lecture 2.11 © 2015 michael stuart design and analysis of experiments lecture 2.1 1.review...
TRANSCRIPT

Lecture 2.1 1© 2015 Michael Stuart
Design and Analysis of ExperimentsLecture 2.1
1. Review
– Minute tests 1.2
– Homework
– Randomized Blocks Design
2. Randomised blocks analysis
3. Two design factors
– a 3 x 3 experiment
Postgraduate Certificate in Statistics Design and Analysis of Experiments

Lecture 2.1 2© 2015 Michael Stuart
Minute Test: How Much
Postgraduate Certificate in Statistics Design and Analysis of Experiments
Lecture 2.1 3© 2015 Michael Stuart
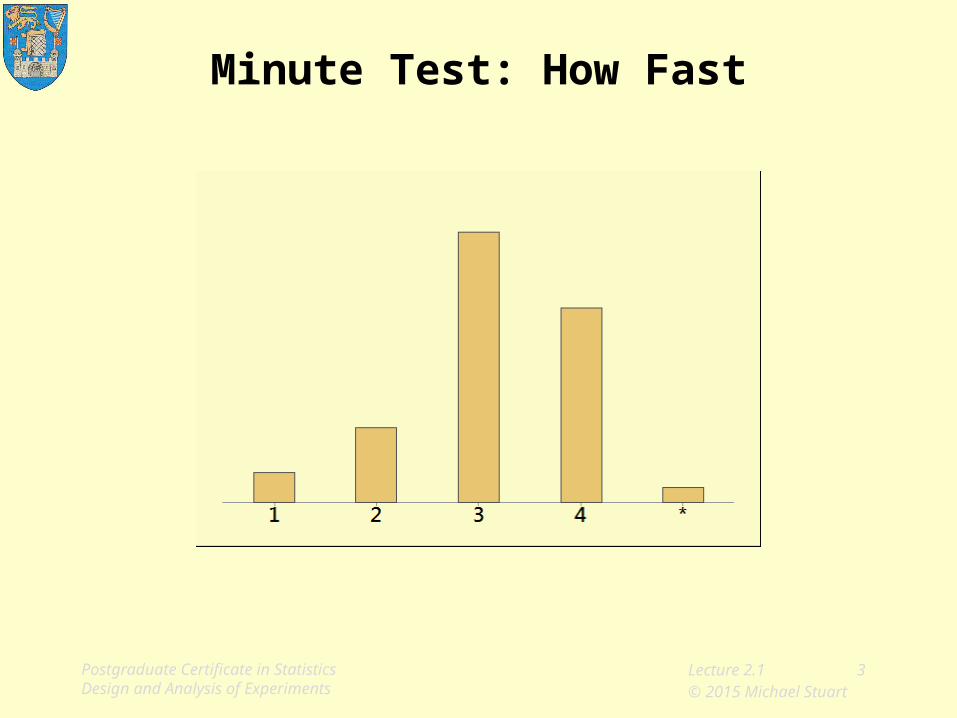
Minute Test: How Fast
Postgraduate Certificate in Statistics Design and Analysis of Experiments

Lecture 2.1 4© 2015 Michael Stuart
Exercise 1.2.1Process Development Study
Formal test:
Numerator measures change effect,
Denominator measures chance effect.
Carry out the test using the results from the first two runs at each speed. Compare with test using complete data
n/s2
yyt
212
Postgraduate Certificate in Statistics Design and Analysis of Experiments

Lecture 2.1 5© 2015 Michael Stuart
Process Development Study
Variable N Mean StDev
Speed B 2 78.75 3.61
Speed A 2 75.25 2.47
Speed B Speed A
76.2 73.581.3 77.0
Postgraduate Certificate in Statistics Design and Analysis of Experiments
Lecture 2.1 6© 2015 Michael Stuart
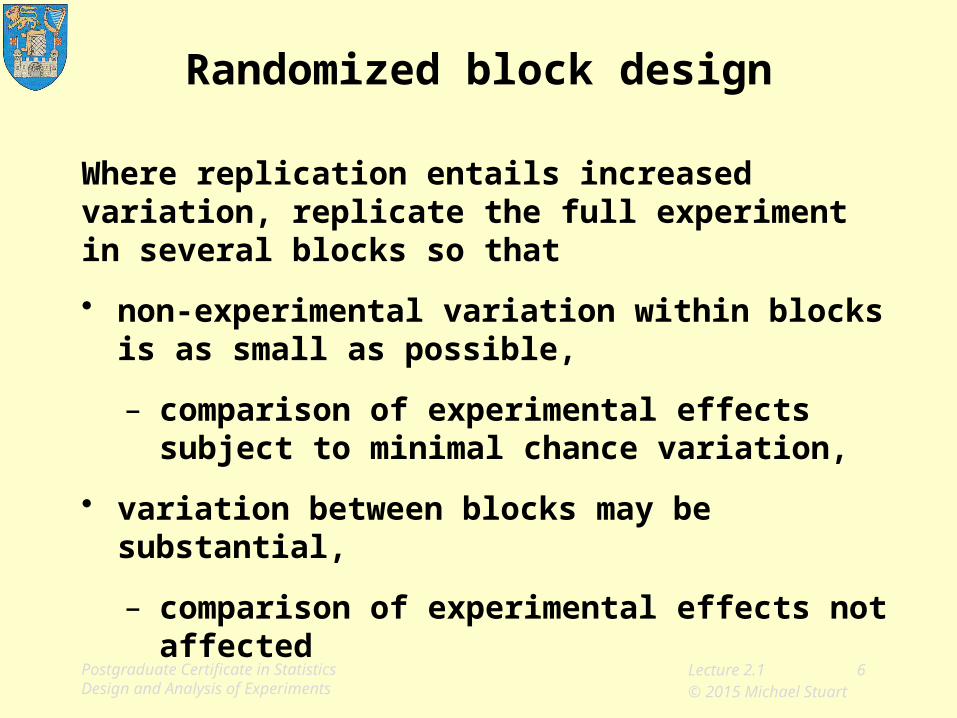
Randomized block design
Where replication entails increased variation, replicate the full experiment in several blocks so that
• non-experimental variation within blocks is as small as possible,
– comparison of experimental effects subject to minimal chance variation,
• variation between blocks may be substantial,
– comparison of experimental effects not affected
Postgraduate Certificate in Statistics Design and Analysis of Experiments

Lecture 2.1 7© 2015 Michael Stuart
Illustrations of blocking variables
Agriculture:
fertility levels in a field or farm,
moisture levels in a field or farm,
genetic similarity in animals, litters as blocks,
etc.
Postgraduate Certificate in Statistics Design and Analysis of Experiments
Lecture 2.1 8© 2015 Michael Stuart
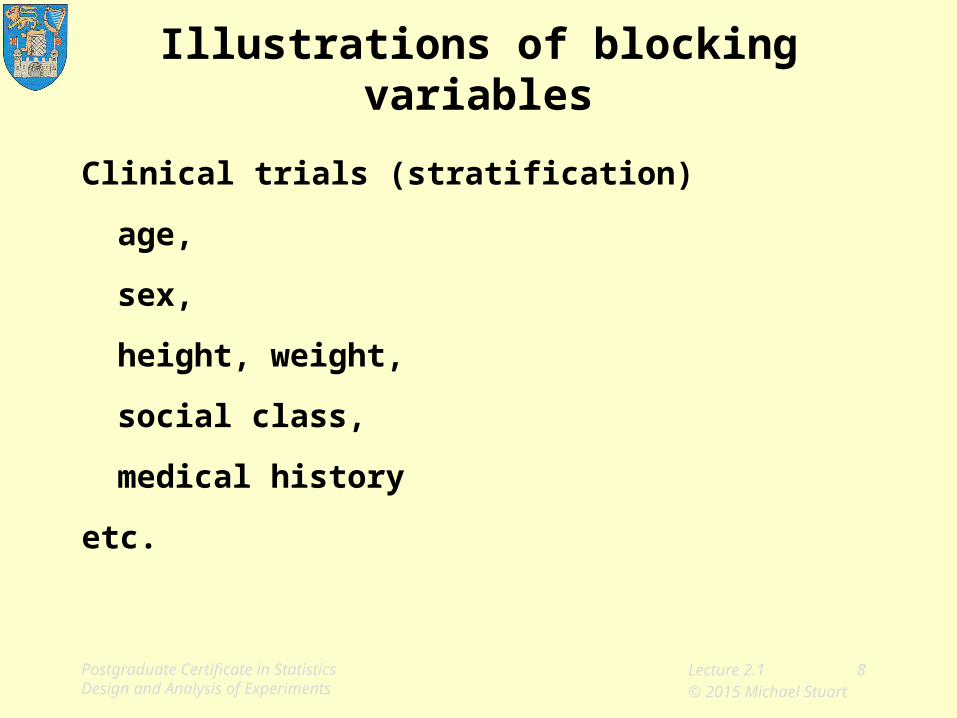
Illustrations of blocking variables
Clinical trials (stratification)
age,
sex,
height, weight,
social class,
medical history
etc.
Postgraduate Certificate in Statistics Design and Analysis of Experiments

Lecture 2.1 9© 2015 Michael Stuart
Illustrations of blocking variables
Clinical trials
different treatments applied to the same individual at different times,
cross-over, carry-over, correlation,
body parts as blocks,
hands, feet, eyes, ears,
etc.
Postgraduate Certificate in Statistics Design and Analysis of Experiments

Lecture 2.1 10© 2015 Michael Stuart
Illustrations of blocking variables
Industrial trials
similar machines,
time based blocks,
time of day, day of week, shift
etc.
Postgraduate Certificate in Statistics Design and Analysis of Experiments

Lecture 2.1 11© 2015 Michael Stuart
Case StudyReducing yield loss in a chemical process
• Process: chemicals blended, filtered and dried
• Problem: yield loss at filtration stage
• Proposal: adjust initial blend to reduce yield loss
• Plan:
– prepare five different blends
– use each blend in successive process runs, in random order
– repeat at later times (blocks)
Postgraduate Certificate in Statistics Design and Analysis of Experiments
Lecture 2.1 12© 2015 Michael Stuart
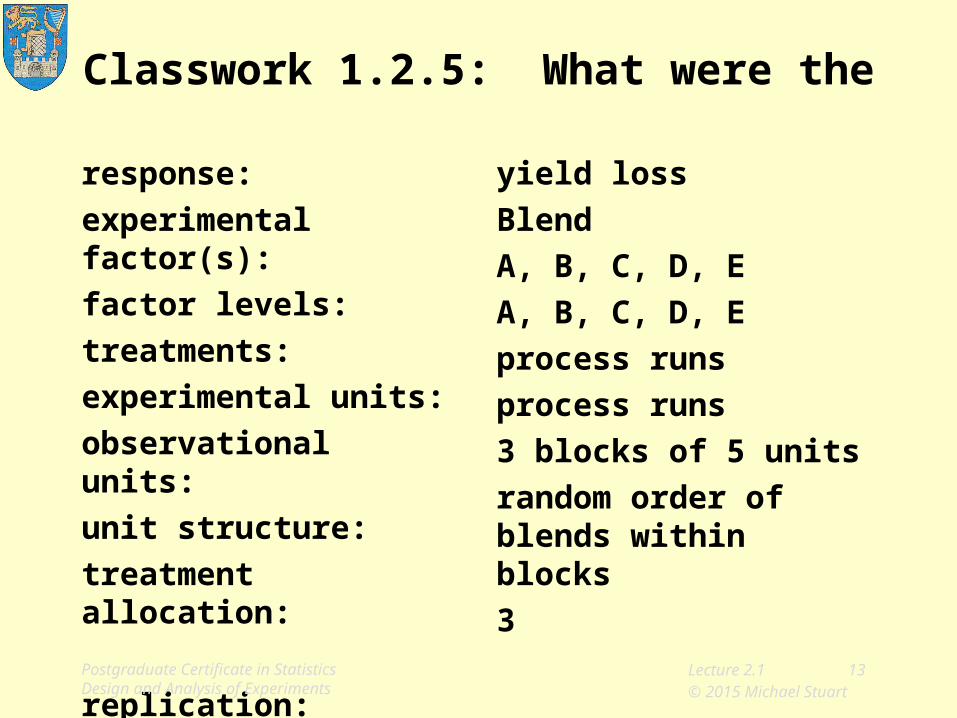
Classwork 1.2.5: What were the
response:
experimental factor(s):
factor levels:
treatments:
experimental units:
observational units:
unit structure:
treatment allocation:
replication:
Postgraduate Certificate in Statistics Design and Analysis of Experiments
Lecture 2.1 13© 2015 Michael Stuart
Classwork 1.2.5: What were the
response:
experimental factor(s):
factor levels:
treatments:
experimental units:
observational units:
unit structure:
treatment allocation:
replication:
yield loss
Blend
A, B, C, D, E
A, B, C, D, E
process runs
process runs
3 blocks of 5 units
random order of blends within blocks
3
Postgraduate Certificate in Statistics Design and Analysis of Experiments

Lecture 2.1 14© 2015 Michael Stuart
Unit Structure
Block 1 Block 2 Block 3
Postgraduate Certificate in Statistics Design and Analysis of Experiments
Unit 1Unit 2Unit 3Unit 4Unit 5
Unit 1Unit 2Unit 3Unit 4Unit 5
Unit 1Unit 2Unit 3Unit 4Unit 5

Lecture 2.1 15© 2015 Michael Stuart
Unit Structure
Block 1 Block 2 Block 3
Postgraduate Certificate in Statistics Design and Analysis of Experiments
Unit 1_1Unit 1_2Unit 1_3Unit 1_4Unit 1_5
Unit 2_1Unit 2_2Unit 2_3Unit 2_4Unit 2_5
Unit 3_1Unit 3_2Unit 3_3Unit 3_4Unit 3_5
Blocks
Units
Units nested in Blocks

Lecture 2.1 16© 2015 Michael Stuart
Randomization procedure
1. enter numbers 1 to 5 in Column A of a spreadsheet, headed Run,
2. enter letters A-E in Column B, headed Blend,
3. generate 5 random numbers into Column C, headed Random
4. sort Blend by Random,
5. allocate Treatments as sorted to Runs in Block I,
6. repeat Steps 3 - 5 for Blocks II and III.
Go to ExcelPostgraduate Certificate in Statistics Design and Analysis of Experiments
Lecture 2.1 17© 2015 Michael Stuart
Part 2 Randomised blocks analysis
• Exploratory analysis
• Analysis of Variance
• Block or not?
• Diagnostic analysis
– deleted residuals
• Analysis of variance explained
Postgraduate Certificate in Statistics Design and Analysis of Experiments

Lecture 2.1 18© 2015 Michael Stuart
Results
Ref: BlendLoss.xls
Block Run Blend Loss, per cent
I 1 B 18.2 2 A 16.9 3 C 17.0 4 E 18.3 5 D 15.1 II 6 A 16.5 7 E 18.3 8 B 19.2 9 C 18.1 10 D 16.0 III 11 B 17.1 12 D 17.8 13 C 17.3 14 E 19.8 15 A 17.5
Postgraduate Certificate in Statistics Design and Analysis of Experiments

Lecture 2.1 19© 2015 Michael Stuart
Initial data analysis
• Little variation between blocks
• More variation between blends
• Disturbing interaction pattern; see laterPostgraduate Certificate in Statistics Design and Analysis of Experiments

Lecture 2.1 20© 2015 Michael Stuart
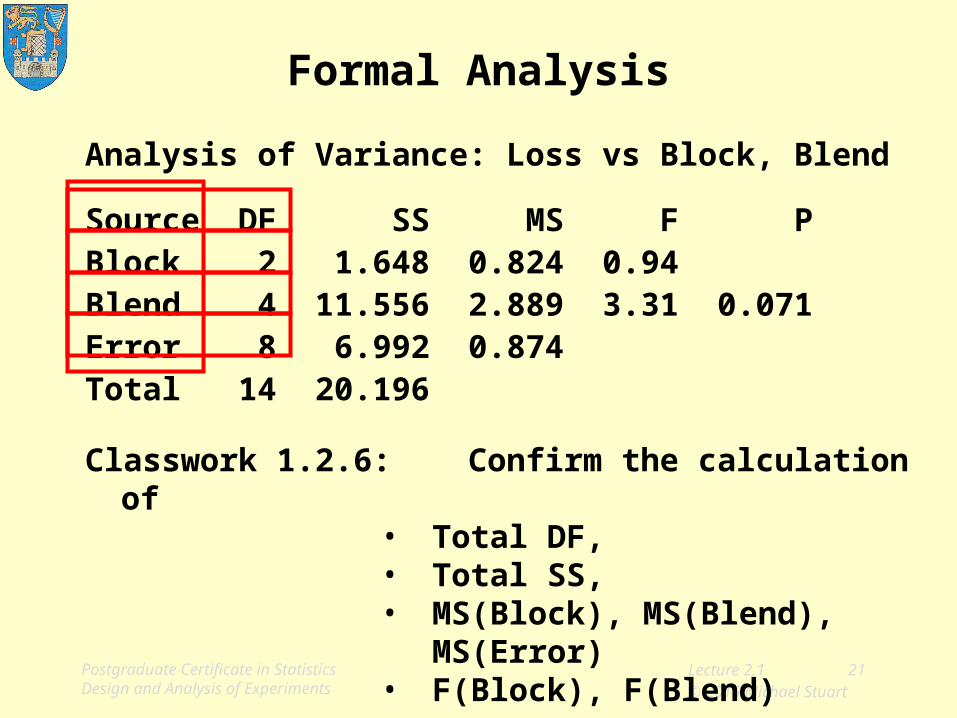
Formal Analysis
Analysis of Variance: Loss vs Block, Blend
Source DF SS MS F PBlock 2 1.648 0.824 0.94 Blend 4 11.556 2.889 3.31 0.071Error 8 6.992 0.874Total 14 20.196
Classwork 1.2.6: Confirm the calculation of• Total DF, • Total SS, • MS(Block), MS(Blend), MS(Error) • F(Block), F(Blend)
Postgraduate Certificate in Statistics Design and Analysis of Experiments
Lecture 2.1 21© 2015 Michael Stuart
Formal Analysis
Analysis of Variance: Loss vs Block, Blend
Source DF SS MS F PBlock 2 1.648 0.824 0.94 Blend 4 11.556 2.889 3.31 0.071Error 8 6.992 0.874Total 14 20.196
Classwork 1.2.6: Confirm the calculation of• Total DF, • Total SS, • MS(Block), MS(Blend), MS(Error) • F(Block), F(Blend)
Postgraduate Certificate in Statistics Design and Analysis of Experiments

Lecture 2.1 22© 2015 Michael Stuart
5% critical values for the F distribution
1 1 2 3 4 5 6 7 8 10 12 24 ∞
2
1 161 200 216 225 230 234 237 239 242 244 249 254 2 18.5 19.0 19.2 19.2 19.3 19.3 19.4 19.4 19.4 19.4 19.5 19.5 3 10.1 9.6 9.3 9.1 9.0 8.9 8.9 8.8 8.8 8.7 8.6 8.5 4 7.7 6.9 6.6 6.4 6.3 6.2 6.1 6.0 6.0 5.9 5.8 5.6 5 6.6 5.8 5.4 5.2 5.1 5.0 4.9 4.8 4.7 4.7 4.5 4.4 6 6.0 5.1 4.8 4.5 4.4 4.3 4.2 4.1 4.1 4.0 3.8 3.7 7 5.6 4.7 4.3 4.1 4.0 3.9 3.8 3.7 3.6 3.6 3.4 3.2 8 5.3 4.5 4.1 3.8 3.7 3.6 3.5 3.4 3.3 3.3 3.1 2.9 9 5.1 4.3 3.9 3.6 3.5 3.4 3.3 3.2 3.1 3.1 2.9 2.7 10 5.0 4.1 3.7 3.5 3.3 3.2 3.1 3.1 3.0 2.9 2.7 2.5 12 4.7 3.9 3.5 3.3 3.1 3.0 2.9 2.8 2.8 2.7 2.5 2.3 15 4.5 3.7 3.3 3.1 2.9 2.8 2.7 2.6 2.5 2.5 2.3 2.1 20 4.4 3.5 3.1 2.9 2.7 2.6 2.5 2.4 2.3 2.3 2.1 1.8 30 4.2 3.3 2.9 2.7 2.5 2.4 2.3 2.3 2.2 2.1 1.9 1.6 40 4.1 3.2 2.8 2.6 2.4 2.3 2.2 2.2 2.1 2.0 1.8 1.5
120 3.9 3.1 2.7 2.4 2.3 2.2 2.1 2.0 1.9 1.8 1.6 1.3 ∞ 3.8 3.0 2.6 2.4 2.2 2.1 2.0 1.9 1.8 1.8 1.5 1.0
Assessing variation between blends
Postgraduate Certificate in Statistics Design and Analysis of Experiments

Lecture 2.1 23© 2015 Michael Stuart
Assessing variation between blends
F(Blends) = 3.3
F4,8;0.1 = 2.8
F4,8;0.05 = 3.8
p = 0.07
F(Blends) is "almost statistically significant"
Multiple comparisons:
All intervals cover 0;
Blends B and E difference "almost significant"
Ref: Lecture Note 1.2, pp19-20.Postgraduate Certificate in Statistics Design and Analysis of Experiments

Lecture 2.1 24© 2015 Michael Stuart
Assessing variation between blocks
F(Blocks) = 0.94 < 1; MS(Blocks) < (MS(Error)
differences between blocks consistent with chance variation;
Source DF SS MS F PBlock 2 1.648 0.824 0.94 0.429Blend 4 11.556 2.889 3.31 0.071Error 8 6.992 0.874Total 14 20.196
Source DF SS MS F PBlend 4 11.556 2.889 3.34 0.055Error 10 8.640 0.864Total 14 20.196Postgraduate Certificate in Statistics Design and Analysis of Experiments

Lecture 2.1 25© 2015 Michael Stuart
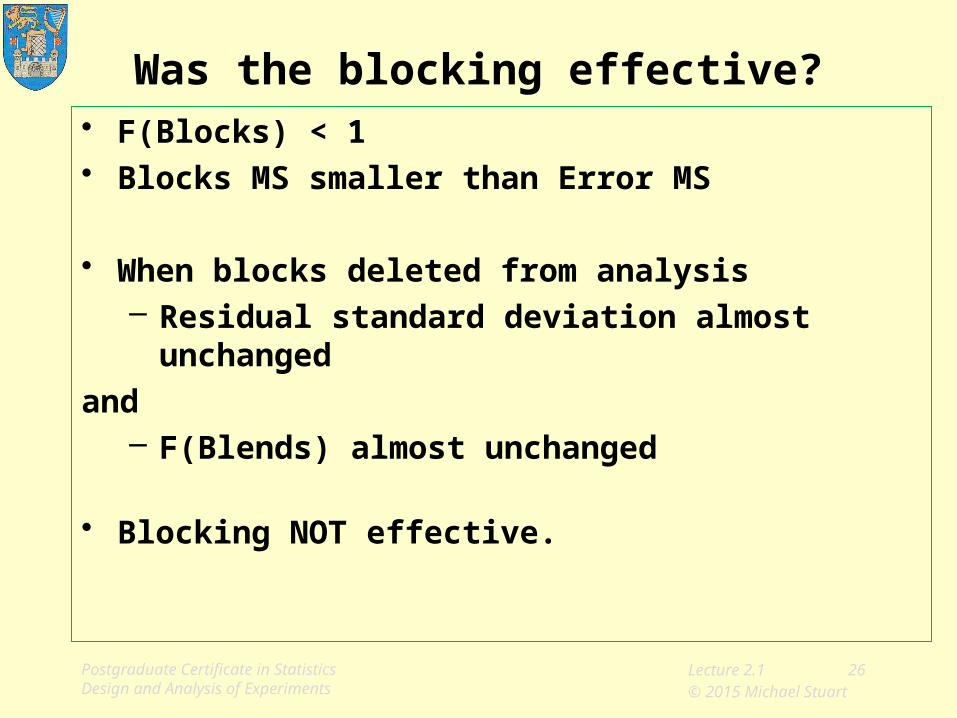
Was the blocking effective?
Source DF SS MS F PBlock 2 1.648 0.824 0.94Blend 4 11.556 2.889 3.31 0.071Error 8 6.992 0.874Total 14 20.196
S = 0.9349
Source DF SS MS F PBlend 4 11.556 2.889 3.34 0.055Error 10 8.640 0.864Total 14 20.196
S = 0.9295
Postgraduate Certificate in Statistics Design and Analysis of Experiments
Lecture 2.1 26© 2015 Michael Stuart
Was the blocking effective?• F(Blocks) < 1• Blocks MS smaller than Error MS
• When blocks deleted from analysis– Residual standard deviation almost unchanged
and– F(Blends) almost unchanged
• Blocking NOT effective.
Postgraduate Certificate in Statistics Design and Analysis of Experiments
Lecture 2.1 27© 2015 Michael Stuart
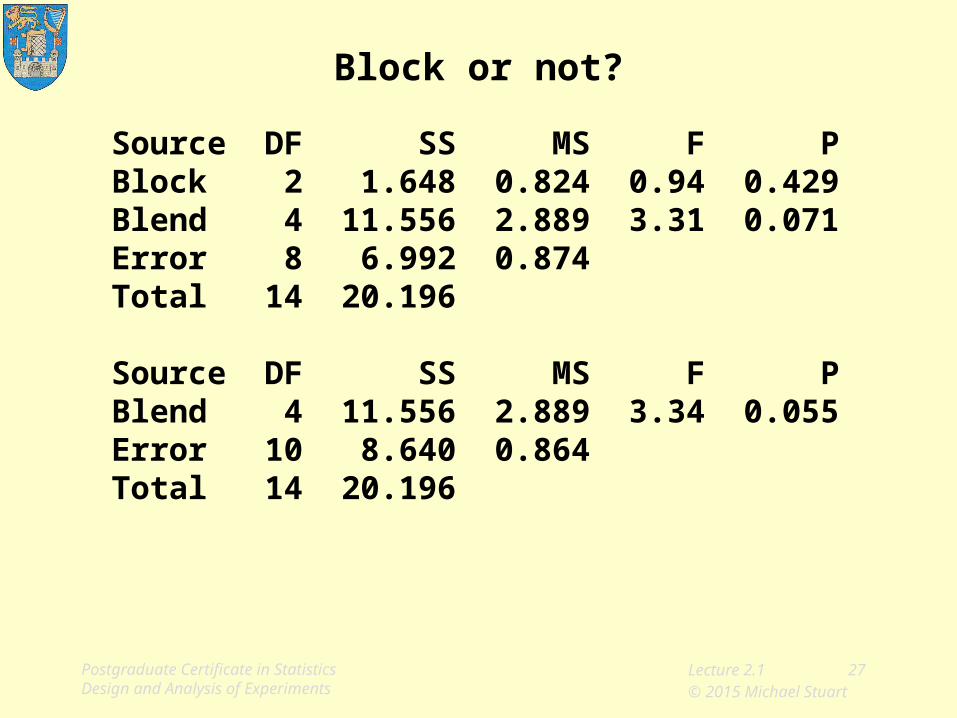
Block or not?
Source DF SS MS F PBlock 2 1.648 0.824 0.94 0.429Blend 4 11.556 2.889 3.31 0.071Error 8 6.992 0.874Total 14 20.196
Source DF SS MS F PBlend 4 11.556 2.889 3.34 0.055Error 10 8.640 0.864Total 14 20.196
Postgraduate Certificate in Statistics Design and Analysis of Experiments

Lecture 2.1 28© 2015 Michael Stuart
Block or not?
Source DF SS MS F PBlock 2 1.648 0.824 0.94 0.429Blend 4 11.556 2.889 3.31 0.071Error 8 6.992 0.874Total 14 20.196
Source DF SS MS F PBlend 4 11.556 2.889 3.34 0.055Error 10 8.640 0.864Total 14 20.196
Postgraduate Certificate in Statistics Design and Analysis of Experiments

Lecture 2.1 29© 2015 Michael Stuart
Block or not?
Omitting blocks
increases DF(Error),
therefore
increases precision of estimate of s,and
increases power of F(Blends)
F4,8:0.10 = 2.8; F4,8:0.05 = 3.8
F4,10:0.10 = 2.6 F4,10:0.05 = 3.5
Smaller critical value easier to exceed, more power.Postgraduate Certificate in Statistics Design and Analysis of Experiments

Lecture 2.1 30© 2015 Michael Stuart
Block or not?
Statistical theory suggests no blocking.
Practical knowledge may suggest otherwise.
Quote from Davies et al (1956):
"Although the apparent variation among the blocks is not confirmed (i.e. it might well be ascribed to experimental error), future experiments should still be carried out in the same way.
There is no clear evidence of a trend in this set of trials, but it might well appear in another set, and no complication in experimental arrangement is involved".
Postgraduate Certificate in Statistics Design and Analysis of Experiments

Lecture 2.1 31© 2015 Michael Stuart
Diagnostic plots
• The diagnostic plot, residuals vs fitted values
– checking the homogeneity of chance variation
• The Normal residual plot,
– checking the Normality of chance variation
Postgraduate Certificate in Statistics Design and Analysis of Experiments

Lecture 2.1 32© 2015 Michael Stuart
Diagnostic analysis
Postgraduate Certificate in Statistics Design and Analysis of Experiments
• One exceptional case
– likely to be related to interaction pattern.
see Slide 19
− resist deletion and refitting!

Lecture 2.1 33© 2015 Michael Stuart
Initial data analysis
• Little variation between blocks
• More variation between blends
• Disturbing interaction pattern; see laterPostgraduate Certificate in Statistics Design and Analysis of Experiments

Lecture 2.1 34© 2015 Michael Stuart
Deleted residuals
• Residual
– observed – fitted
• Standardised Residual
– divide by the usual estimate of s
• Standardised Deleted Residual
– residual calculated from data with suspect case deleted
– s estimated from data with suspect case deleted
Postgraduate Certificate in Statistics Design and Analysis of Experiments

Lecture 2.1 35© 2015 Michael Stuart
Deleted residuals
For each potentially exceptional case:
– delete the case
– calculate the ANOVA from the rest
– use the deleted fitted model to calculate a
deleted fitted value
– calculate deleted residual= obseved value – deleted fitted value
– calculate deleted estimate of s
– standardise
Postgraduate Certificate in Statistics Design and Analysis of Experiments

Lecture 2.1 36© 2015 Michael Stuart
Deleted residuals
Minitab does this automatically for all cases!
They are used to allow each case to be assessed using a criterion not affected by the case.
It is not the residuals are deleted,
it is the case that is deleted
to facilitate calculation of the "deleted" residuals
Simple linear regression illustrates:
Postgraduate Certificate in Statistics Design and Analysis of Experiments
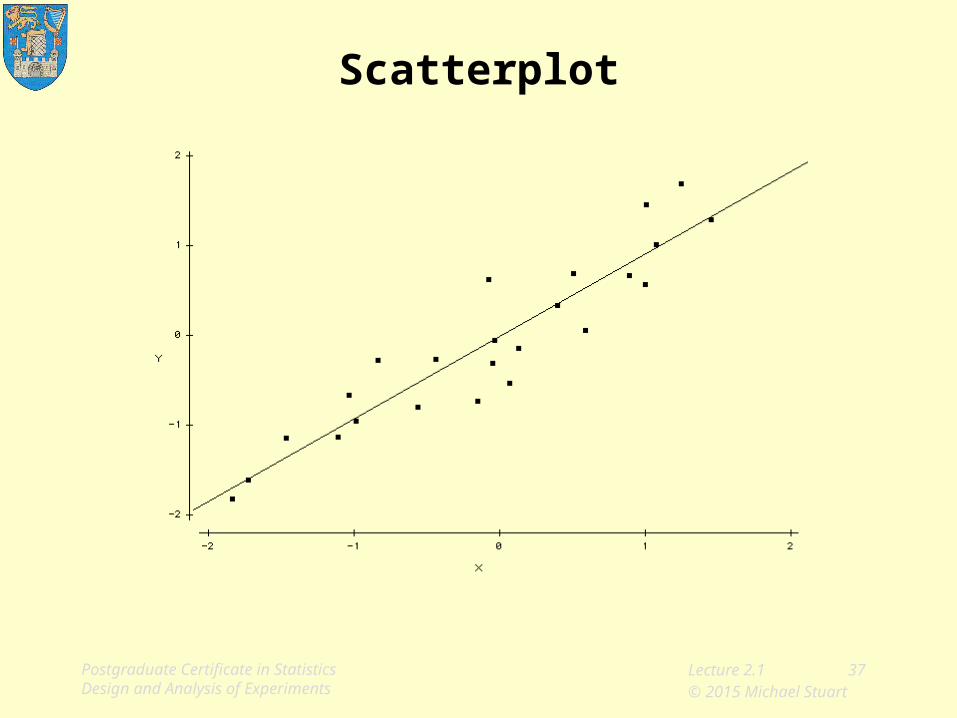
Lecture 2.1 37© 2015 Michael Stuart
Scatterplot
Postgraduate Certificate in Statistics Design and Analysis of Experiments
Lecture 2.1 38© 2015 Michael Stuart
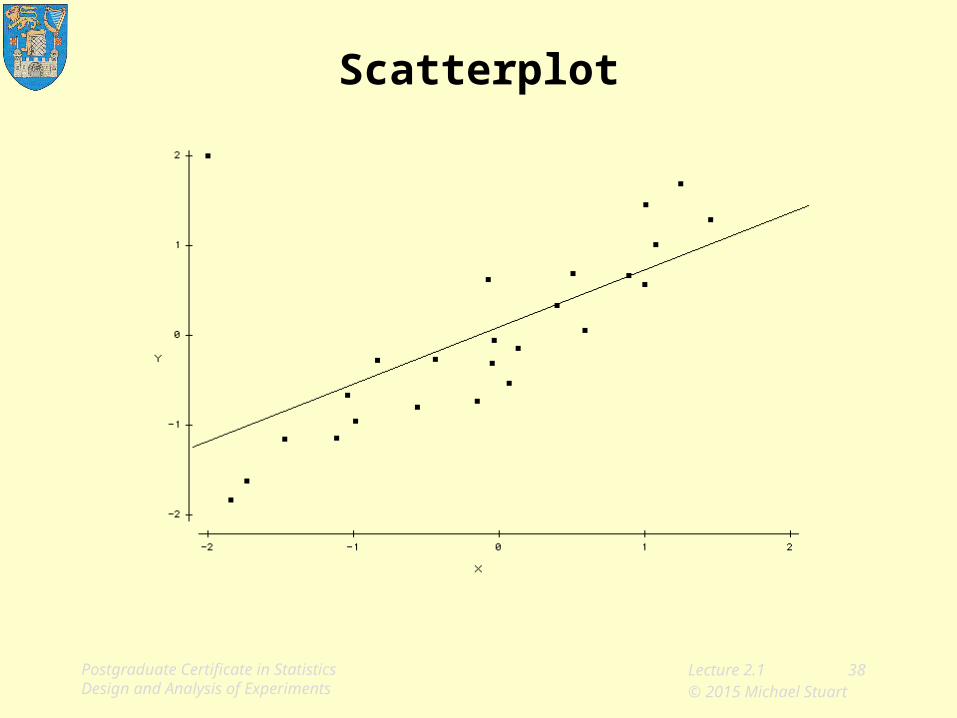
Scatterplot
Postgraduate Certificate in Statistics Design and Analysis of Experiments
Lecture 2.1 39© 2015 Michael Stuart
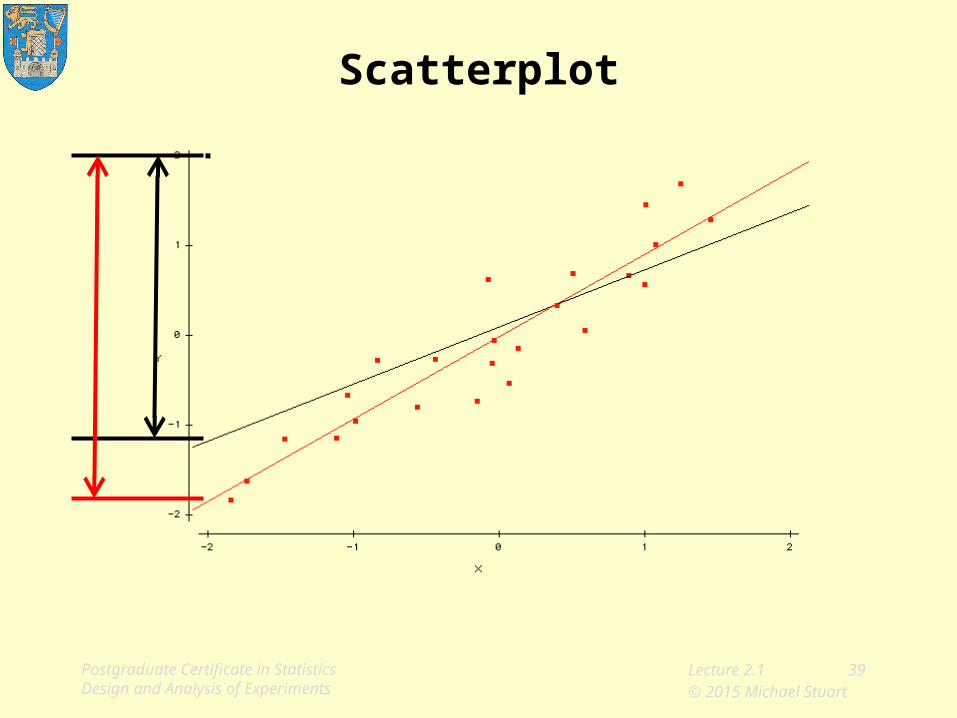
Scatterplot
Postgraduate Certificate in Statistics Design and Analysis of Experiments

Lecture 2.1 40© 2015 Michael Stuart
Deleted residual
Given an exceptional case,
deleted residual > residual using all the data
deleted s < s using all the data
deleted standardised residual
>> standardised residual using all the data
Using deleted residuals accentuates exceptional cases
Postgraduate Certificate in Statistics Design and Analysis of Experiments

Lecture 2.1 41© 2015 Michael Stuart
Corresponding residual plots,Standardized vs Deleted
Postgraduate Certificate in Statistics Design and Analysis of Experiments

Lecture 2.1 42© 2015 Michael Stuart
Randomized Blocks ExampleStandardized vs Deleted
Postgraduate Certificate in Statistics Design and Analysis of Experiments

Lecture 2.1 43© 2015 Michael Stuart
Randomized Blocks ExampleStandardized vs Deleted
Postgraduate Certificate in Statistics Design and Analysis of Experiments

Lecture 2.1 44© 2015 Michael Stuart
Analysis of Variance Explained
Decomposing Total Variation
Expected Mean Squares
Postgraduate Certificate in Statistics Design and Analysis of Experiments
Lecture 2.1 45© 2015 Michael Stuart
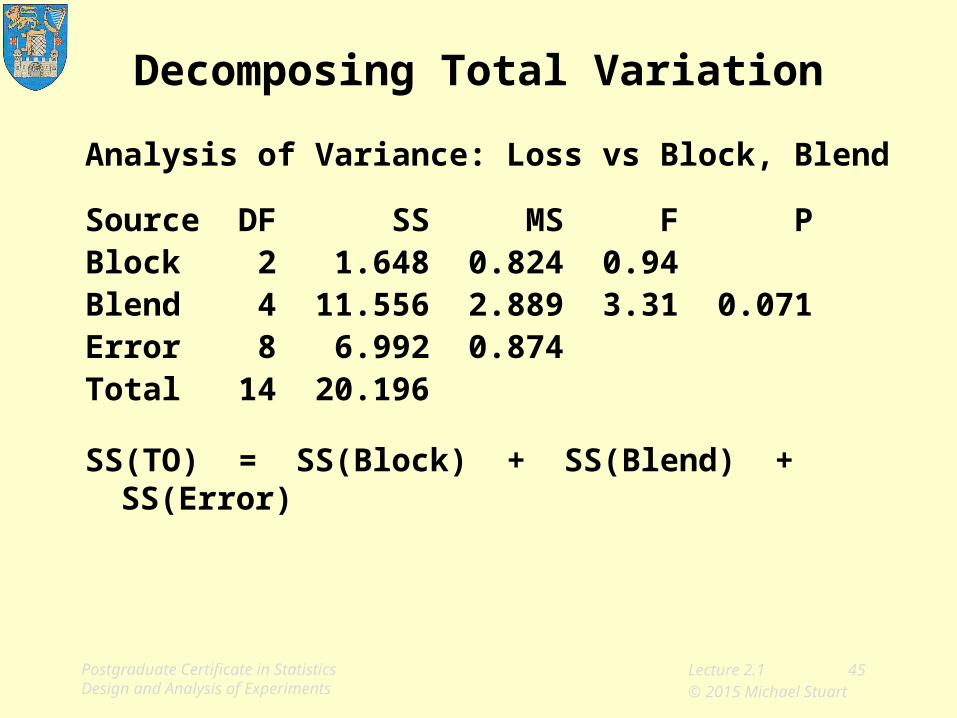
Decomposing Total Variation
Analysis of Variance: Loss vs Block, Blend
Source DF SS MS F PBlock 2 1.648 0.824 0.94 Blend 4 11.556 2.889 3.31 0.071Error 8 6.992 0.874Total 14 20.196
SS(TO) = SS(Block) + SS(Blend) + SS(Error)
Postgraduate Certificate in Statistics Design and Analysis of Experiments
Lecture 2.1 46© 2015 Michael Stuart
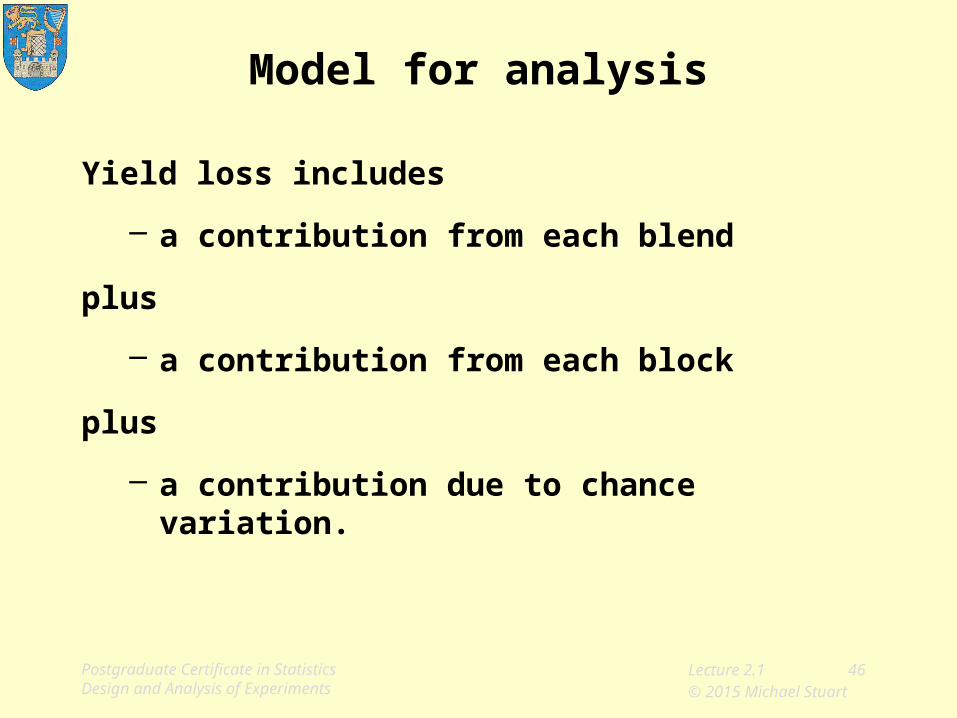
Model for analysis
Yield loss includes
– a contribution from each blend
plus
– a contribution from each block
plus
– a contribution due to chance variation.
Postgraduate Certificate in Statistics Design and Analysis of Experiments

Lecture 2.1 47© 2015 Michael Stuart
Model for analysis
Y = m + a + b + e
where
m is the overall mean,
a is the blend effect, above or below the mean, depending on which blend is used,
b is the block effect, above or below the mean, depending on which block is involved
e represents chance variation
Postgraduate Certificate in Statistics Design and Analysis of Experiments

Lecture 2.1 48© 2015 Michael Stuart
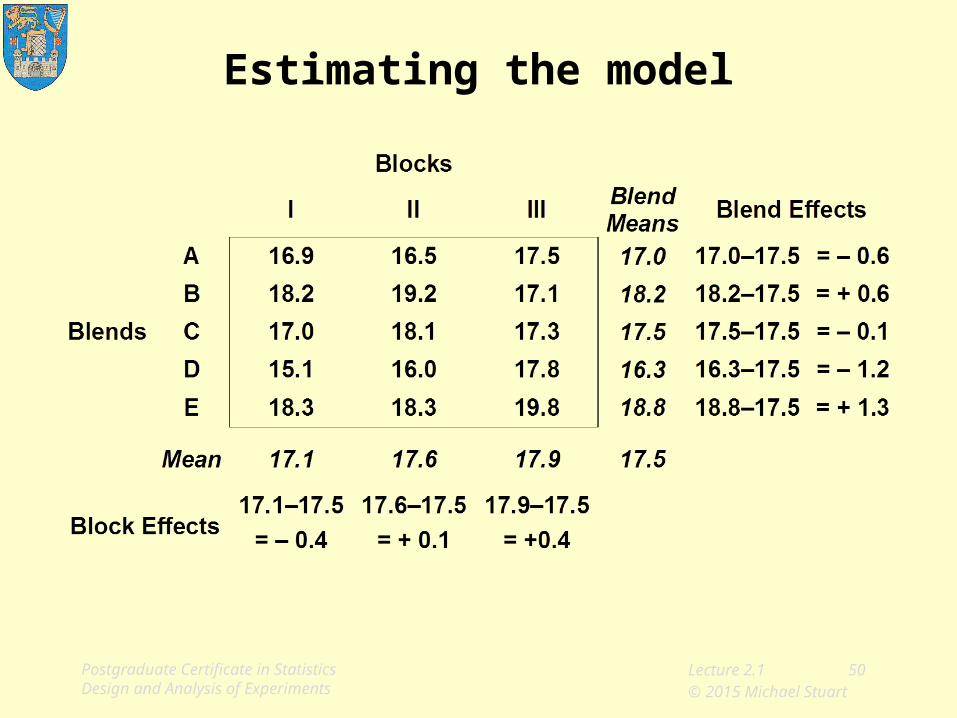
Estimating the model
Postgraduate Certificate in Statistics Design and Analysis of Experiments

Lecture 2.1 49© 2015 Michael Stuart
Estimating the model
Postgraduate Certificate in Statistics Design and Analysis of Experiments
Lecture 2.1 50© 2015 Michael Stuart
Estimating the model
Postgraduate Certificate in Statistics Design and Analysis of Experiments
Lecture 2.1 51© 2015 Michael Stuart
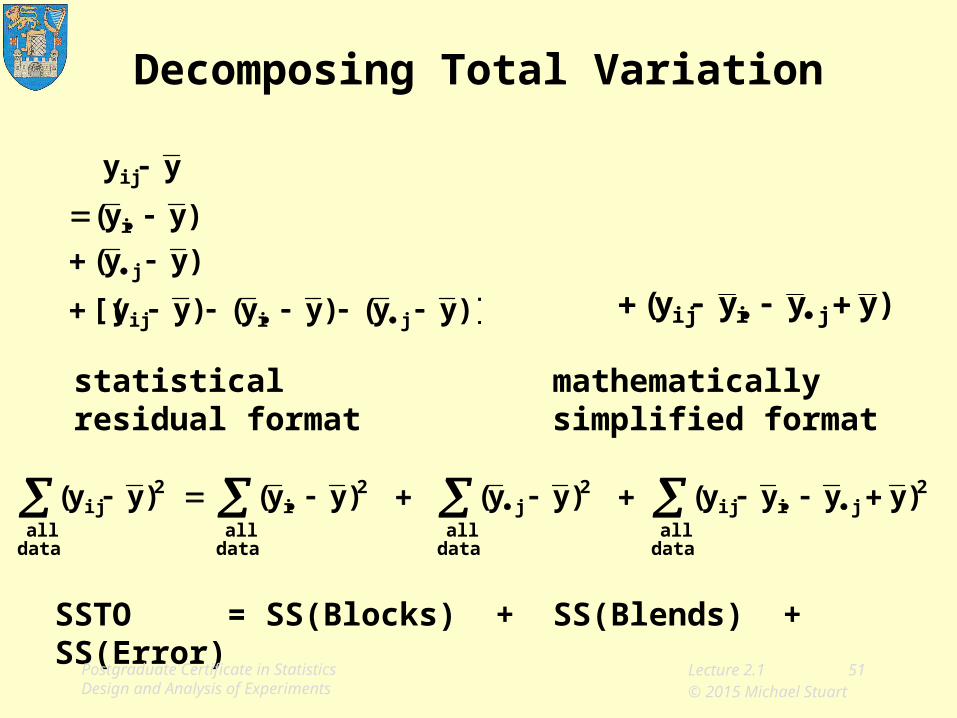
Decomposing Total Variation
statistical residual format
mathematically simplified format
)]yy()yy()yy[(
)yy(
)yy(
yy
jiij
j
i
ij
)yyyy( jiij
SSTO = SS(Blocks) + SS(Blends) + SS(Error)
dataall
2jiij
dataall
2j
dataall
2i
dataall
2ij )yyyy()yy()yy()yy(
Postgraduate Certificate in Statistics Design and Analysis of Experiments

Lecture 2.1 52© 2015 Michael Stuart
Expected Mean Squares
F(Blends) = tests equality of blend means
F(Blocks) = assesses effectiveness of blocking
1I
)(
J= )EMS(Blends i
2i
2
1J
)(
I)Blocks(EMS j
2j
2
2)Error(EMS
)Error(MS
)Blends(MS
)Error(MS
)Blocks(MS
Postgraduate Certificate in Statistics Design and Analysis of Experiments
Lecture 2.1 53© 2015 Michael Stuart
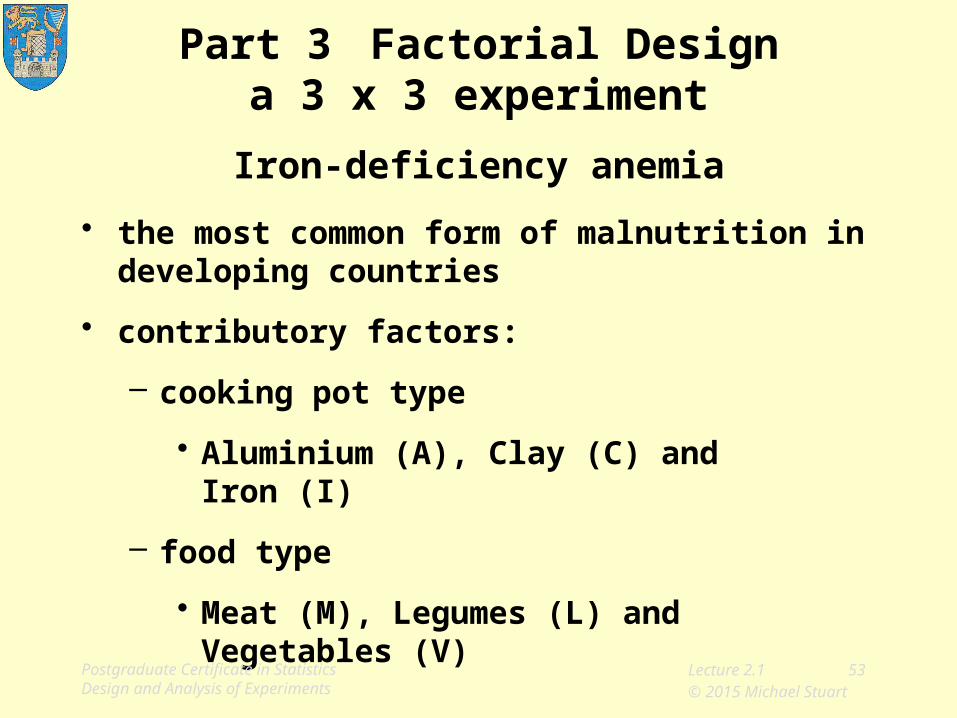
Part 3 Factorial Designa 3 x 3 experiment
Iron-deficiency anemia
• the most common form of malnutrition in developing countries
• contributory factors:
– cooking pot type
• Aluminium (A), Clay (C) and Iron (I)
– food type
• Meat (M), Legumes (L) and Vegetables (V)
Postgraduate Certificate in Statistics Design and Analysis of Experiments
Lecture 2.1 54© 2015 Michael Stuart
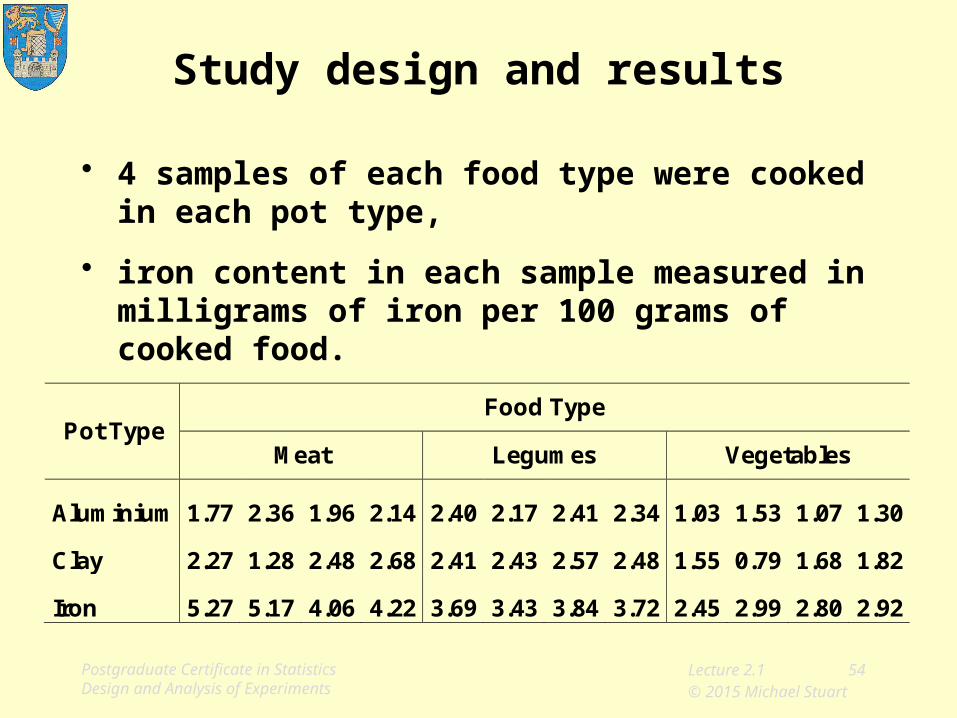
Study design and results
• 4 samples of each food type were cooked in each pot type,
• iron content in each sample measured in milligrams of iron per 100 grams of cooked food.
Pot Type Food Type
Meat Legumes Vegetables
Aluminium 1.77 2.36 1.96 2.14 2.40 2.17 2.41 2.34 1.03 1.53 1.07 1.30
Clay 2.27 1.28 2.48 2.68 2.41 2.43 2.57 2.48 1.55 0.79 1.68 1.82
Iron 5.27 5.17 4.06 4.22 3.69 3.43 3.84 3.72 2.45 2.99 2.80 2.92
Postgraduate Certificate in Statistics Design and Analysis of Experiments

Lecture 2.1 55© 2015 Michael Stuart
Classwork 2.1.1
• What were the– response– experimental factors– factor levels– treatments– experimental units– unit structure– treatment assignment– replication
Postgraduate Certificate in Statistics Design and Analysis of Experiments
Lecture 2.1 56© 2015 Michael Stuart
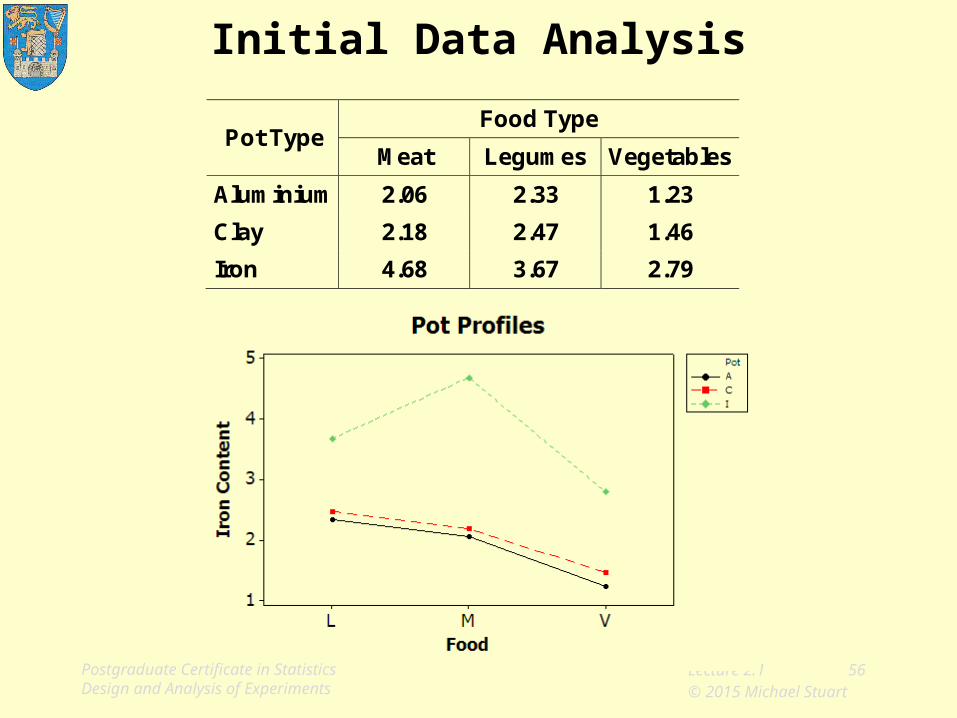
Initial Data Analysis
Pot Type Food Type
Meat Legumes Vegetables
Aluminium 2.06 2.33 1.23
Clay 2.18 2.47 1.46
Iron 4.68 3.67 2.79
Postgraduate Certificate in Statistics Design and Analysis of Experiments

Lecture 2.1 57© 2015 Michael Stuart
Model for analysis
Iron content includes– a contribution for each food type
plus– a contribution for each pot type
plus– a contribution for each food type / pot type
combination
plus– a contribution due to chance variation.
Minitab: Pot Food Pot * FoodPostgraduate Certificate in Statistics Design and Analysis of Experiments
Lecture 2.1 58© 2015 Michael Stuart
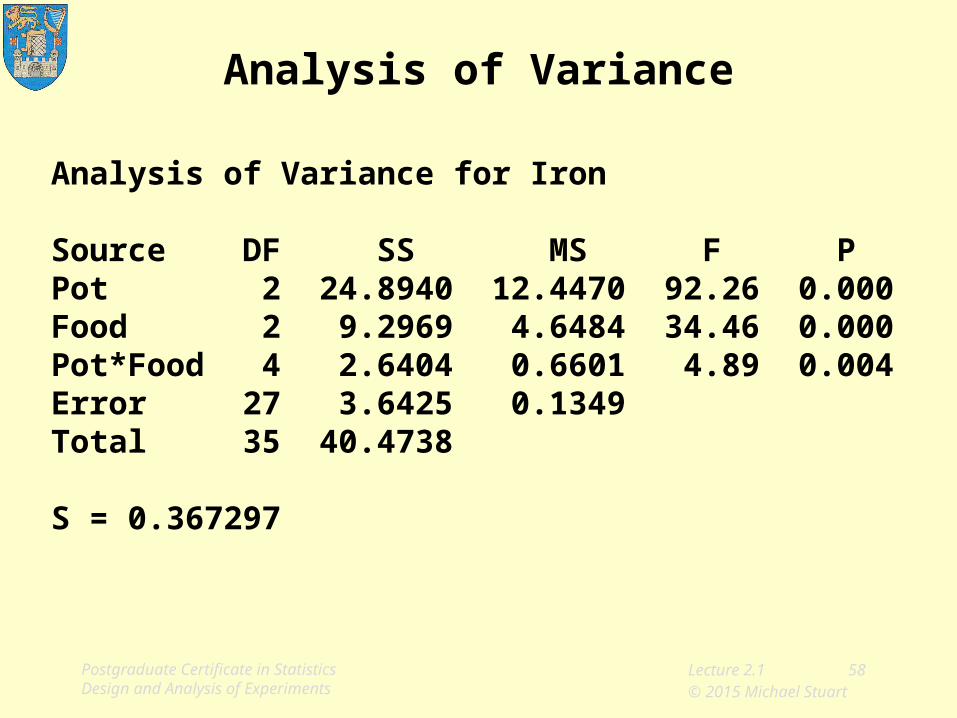
Analysis of Variance
Analysis of Variance for Iron Source DF SS MS F PPot 2 24.8940 12.4470 92.26 0.000Food 2 9.2969 4.6484 34.46 0.000Pot*Food 4 2.6404 0.6601 4.89 0.004Error 27 3.6425 0.1349Total 35 40.4738
S = 0.367297
Postgraduate Certificate in Statistics Design and Analysis of Experiments

Lecture 2.1 59© 2015 Michael Stuart
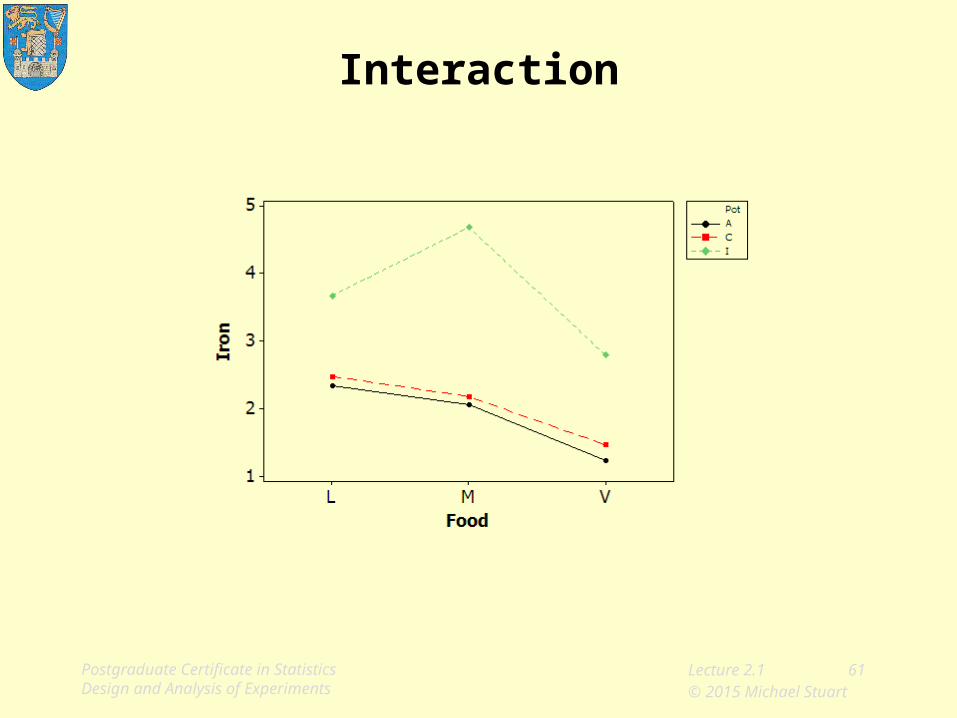
Summary
Cooking in iron pots adds substantially to the average iron content of all cooked foods.
However, it adds considerably more to the iron content of meat,
– around 2.5 to 2.6 mgs per 100gms on average,
than to that of legumes or vegetables,
– around 1.2 to 1.5 mgs per 100gms on average
The iron content is very similar using aluminium and clay for all three food types.
Postgraduate Certificate in Statistics Design and Analysis of Experiments

Lecture 2.1 60© 2015 Michael Stuart
Interaction
Postgraduate Certificate in Statistics Design and Analysis of Experiments
Lecture 2.1 61© 2015 Michael Stuart
Interaction
Postgraduate Certificate in Statistics Design and Analysis of Experiments

Lecture 2.1 62© 2015 Michael Stuart
Diagnostic plots
Postgraduate Certificate in Statistics Design and Analysis of Experiments

Lecture 2.1 63© 2015 Michael Stuart
Diagnostic plots
Slight suggestion of skewness, butconclusions are sufficiently strong to ignore this
Postgraduate Certificate in Statistics Design and Analysis of Experiments

Lecture 2.1 64© 2015 Michael Stuart
Minute test
– How much did you get out of today's class?
– How did you find the pace of today's class?
– What single point caused you the most difficulty?
– What single change by the lecturer would have most improved this class?
Postgraduate Certificate in Statistics Design and Analysis of Experiments

Lecture 2.1 65© 2015 Michael Stuart
Reading
EM §7.3.2, §7.4.2
DCM §§4-1, 5-1 to 5-3
DV §6.2, 6.4
Postgraduate Certificate in Statistics Design and Analysis of Experiments