lecture 2: exporting, innovation and productivity h. vandenbussche brixen, september 2009
TRANSCRIPT

Lecture 2: Exporting, Innovation
and ProductivityH. Vandenbussche
Brixen, September 2009

Intro
• Research questions: – Does Innovation drive exporting?– Does Exporting drive innovation?
• How is Innovation measured? – Input measures: R&D expenditures; R&D department; Training– Output measures: Product innovation, Process Innovation
• Methodology: Probit models
• Empirical Evidence: Mixed
Hylke Vandenbussche Brixen, September 2009

Motivation
Motivation - Data - Econometric approach - Results - Conclusion
Early Literature• Melitz, 2003; Bernard and Jensen, 1999: productivity is a
random exogenous draw from a Pareto distribution.• Yeaple, 2005; Bustos, 2005; Constantini & Melitz 2007:
firms endogenously choose innovation.• Link between innovation and firm growth known in IO
Empirical evidence on innovation INPUT measures• Aw et al (2007): no link between R&D and probability to
start exporting for Taiwanese firms.• Cassiman & Martinez-Ros(2007): no link between R&D
and exporting for Spanish firms.
Hylke Vandenbussche Brixen, September 2009
Motivation
Motivation - Data - Econometric approach - Results - Conclusion
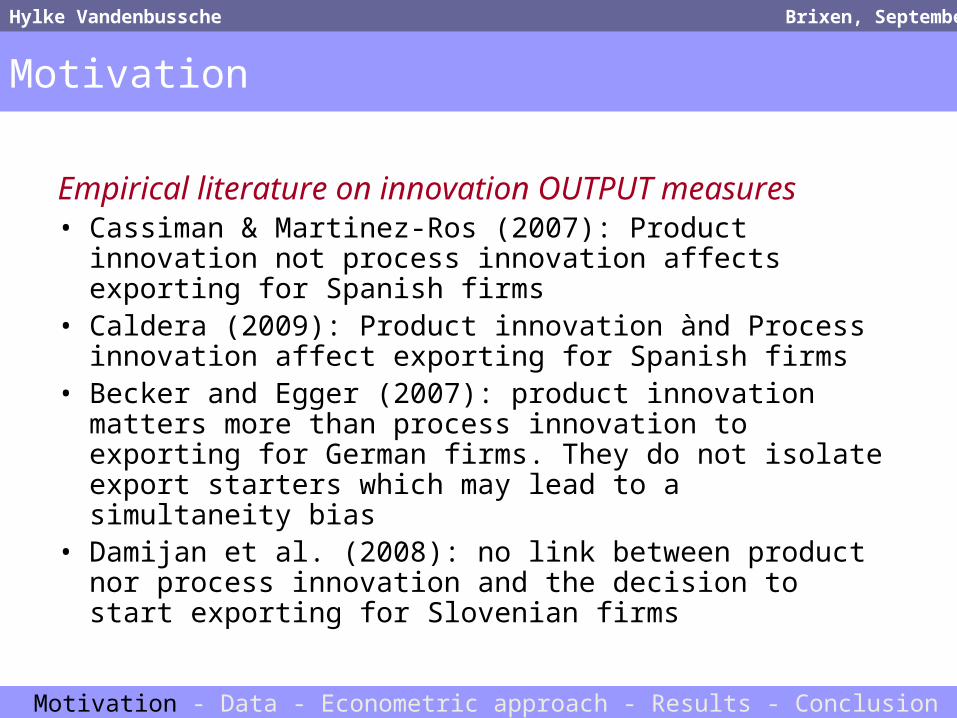
Empirical literature on innovation OUTPUT measures• Cassiman & Martinez-Ros (2007): Product innovation not
process innovation affects exporting for Spanish firms• Caldera (2009): Product innovation ànd Process
innovation affect exporting for Spanish firms• Becker and Egger (2007): product innovation matters
more than process innovation to exporting for German firms. They do not isolate export starters which may lead to a simultaneity bias
• Damijan et al. (2008): no link between product nor process innovation and the decision to start exporting for Slovenian firms
Hylke Vandenbussche Brixen, September 2009

Paper 1: Aw, Roberts and Whinston
• IO approach– Hopenhayn (’92) and Olley and pakes (1986) assume that a firm’s
productivity follows a Markov process and does NOT depend on investment:
– More general formulation here:
with r: spending on R&D and x: participation in export markets
• Data– Taiwanese electronics industry– Largest industrial sector: 25% of exports; 5% of GDP– Firm surveys 1986, 1991, 1996
• Innovation measure– R&D– Training
1( / )t tF
1( / , , )t t t tF r x

Transition Matrix of Investment Activities between Years t and
t + 1, 1986–1996 Number of firms (row proportion)
Investment Activity Year t Year (t + 1)
(number of firms in year t)
Start R&D/T Stop R&D/T Start Export Stop Export
No R&D/WT & No 24 (12.97) – 50 (27.03) –
Export (185)
Only R&D/WT (82) – 36 (43.90) 42 (51.22) –
Only Exporting (276) 73 (26.45) – – 52 (18.84)
R&D/WT & Export(530) – 156 (29.43) – 40 (7.55)

• Direction of causality not clear• Methodology: bivariate Probit model
i.e. takes two independent binary probit models and estimates them together but allows a correlation in the error term. This is to recognize that there may be unobserved variables that affect both binary choices. The model is estimated with maximum likelihood
Choice 1: R&D and Exporting
Choice 2: only Exporting
Choice 3: only R&D
3 32
0 1 2 3 4 5 6 7 1 11 1
Pr ( ) log( ) log( ) log( )it t it it it it it it k it k it it itk k
ob Exp a a a age a Enter a k a pwage a Multi plant a a f Choice l Choice x
3 32
0 1 2 3 4 5 6 7 1 11 1
Pr ( & ) log( ) log( ) log( )it t it it it it it it k it k it it itk k
ob R D a a a age a Enter a k a pwage a Multi plant a a f Choice l Choice r

Discrete Investment Activity Equation
Exporting R&D/WT
intercept −3.377 (0.647)* −6.749 (0.626)*
year dummy 0.137 (0.108) 0.023 (0.096)
entrant dummy 0.647 (0.162)* 0.593 (0.199)*
log(age) 0.128 (0.070) −0.209 (0.069)*
log(kit) 0.383 (0.038)* 0.496 (0.036)*
log(pwageit) −0.319 (0.104)* 0.114 (0.100)
multiplant dummy 0.067 (0.127) 0.035 (0.111)
productivity (ωit) 1.120 (0.356)* 0.524 (0.283)
productivity squared ()ωit 2 −0.631 (0.272)* −0.138 (0.215)
lagged Choice 1 dummy Exporting and R&D/WT 1.270 (0.297)* 0.711 (0.251)*
lagged Choice 2 dummy Exporting but not R&D/WT 0.921 (0.239)* 0.206 (0.263)
lagged Choice 3 dummy R&D/WT but not exporting −0.130 (0.423) 0.329 (0.425)
(ωit) * lagged Choice 1 dummy −0.036 (0.652) 0.193 (0.416)
(ωit) * lagged Choice 2 dummy 0.829 (0.464) −0.045 (0.415)
(ωit) * lagged Choice 3 dummy −0.599 (1.049) 0.246 (0.929)
Corr(εxit, εrit) 0.287 (0.059)*
Notes:
* Statistically significant at the α = 0.05 level.

Conclusion Aw et al.
• History of exporting matters• R&D does NOT matter for exporting• But! R&D and exporting together can put a firm on
a higher future productivity path!

Paper 2: Cassiman&Martinez-Ros
• Data– Spanish manufacturing firms– ’90-99– CIS for Spain: output measure of innovation– One way causality from innovation to exporting
• Theory– Vernon (1966) product life cycle i.e. firms invent new
product, first sell it at home and than abroad

Table 3a: Past Innovation and Exportst
Not Exportt Exportt Total
Not Innovate t-1 2807 (58%) 2070 (42%) 4877 (100%)
Innovate t-1 389 (16%) 2033 (84%) 2422 (100%)
Total 3196 (44%) 4103 (56%) 7299 (100%)
Table 3b: Past Product Innovation and Exports
Not Exportt Exportt Total
No Product Innovation t-1 2799 (51%) 2720 (49%) 5519 (100%)
Product Innovation t-1 397 (22%) 1383 (78%) 1780 (100%)
Total 3196 (44%) 4103 (56%) 7299 (100%)
Table 3c: Past Process Innovation and Exports
Not Exportt Exportt Total
No Process Innovation t-1 2505 (51%) 2405 (49%) 4910 (100%)
Process Innovation t-1 691 (29%) 1698 (71%) 2389 (100%)
Total 3196 (44%) 4103 (56%) 7299 (100%)

Table 7: Decision to Export at time t by Non-Exporters in t-1
Small and Medium Firms (<200 workers) Large Firms (> 200 workers)
(1) (2) (3) (4) (5) (6) (7) (8) (9) (10)
Prod In (t-1) 0.208** 0.218* 1.112** 1.66** 0.55* 0.696** 0.696** 0.604 0.179 0.059
Proc Inn (t-1) 0.084 0.117 - 0.516 -0.966 -0.107 -0.044 -0.044 0.432 -0.092 -0.2
Size 0.017*** 0.027*** 0.018*** 0.029*** 0.029*** 0.001 0.001 0.001 0.001 0.001
SizeSq -0.100*** -0.163*** -0.104*** -0.173*** -0.172*** -0.001 -0.001 -0.001 -0.0004 -0.0005
Foreign 0.317 0.439 0.250 0.388 0.374 -0.511* -0.511* -0.365 -0.325 -0.325
Cap Int 0.00002 0.00004 0.00003 0.00005 0.00005 0.0001 0.0001 0.0001 0.0001 0.0001
Wage Int -1.248*** -1.478*** -1.210*** -1.522*** -1.467*** 0.1447 0.1447 0.132 0.110 0.138
Low Comp 0.001 0.003 0.001 0.002 0.002 0.010 0.010 0.014 0.011 0.012
Index -0.00003 0.00001 0.00003 0.00002 0.00001 0.00006 0.00006 0.00001 -0.00004 0.00001
Intercept -1.677*** -2.394*** -1.96*** -2.2*** -1.71 -2.50 -2.50 -1.852 -0.76 -1.501
Indy-Time Ds Included Included Included Included Included Included Included Included Included Included
Obs 2916 916 2916 2916 2916 140 140 140 140 140

Conclusion Cassiman-Martinez-Ros
• Product Innovation explains Exporting !• Especially in Small firms• Product Innovation suggest firm-specific demand
shocks

Paper 3: Damijan et al.
• Data
-Slovenian firm-level data
-CIS community industry survey ‘96-2002
-output measure of innovation• Methodology
– Bivariate Probit model on exporting and innovation– Allow for two way causality

Bivariate Probit model
A test for correlation between exporting to innovation i.e. “learning”:
Prob(Inov t = 1) = f(Inovt-2;Exp t-2;X t-2)
A test for correlation between innovation to exporting:
Prob(Export t = 1) = f(Exp t-2; Innov t-2;X t-2)

Table 4: Results of bivariate probit regressions (no matching, all exporters)
Export status
(1) (2) (3) (4) (5) (6)
Lagged innovation 0.129 0.054 0.096 -0.093 0.191 -0.041
Lagged exportstatus 1.876*** 2.281*** 2.128*** 2.443*** 2.421*** 2.401***
Lagged productivity 0.126* 0.145 -0.076 -0.067 -0.108 -0.050
Lagged employment 0.214*** 0.166*** 0.321*** 0.130* 0.177* 0.145*
Lagged capitalintensity 0.144*** -0.108** 0.067 -0.092* -0.029 -0.0640
Lagged R&DInvestment 0.004 0.025 0.0090.0260
FDI penetration in industry 0.151 0.114 -0.097-0.079
Industry dummies yes no yes no no no
Timedummies yes yes yes yes yes yes
N 3812 1551 1428 602 623 623
Rho 0.125 0.139 0.118 0.275 0.423 0.197
Prob rho=0 0.058 0.078 0.092 0.063 0.007 0.132
(1)-(4) Both product and process innovation considered, (5)only produc tinnovation is
considered and(6)only process innovation considered

Table5: Results of bivariate probit regressions (no matching, all innovators) Innovation status
• (1) (2) (3) (4) (5) (6) Lagged inn 1.226*** 1.396*** 0.631*** 0.891*** 0.912*** 0.463*** Lagged exports 0.223*** 0.332*** -0.053 0.536** 0.478** 0.254 Lagged productiv 0.167*** 0.171** 0.199** 0.072 0.092 0.208* Lagged employm 0.224*** 0.256*** 0.178*** 0.130** 0.134** 0.228*** Lagged capital int 0.069* -0.057 0.124* 0.049 -0.042 0.053 Lagged R&D Invest 0.077*** 0.051*** 0.057*** 0.049*** FDI penetration in sector 0.793*** 0.708*** 0.564** 0.651*** Sector dummies yes no yes no no noTime dummies yes yes yes yes yes yes N 3812 1551 1428 602 623 623
(1)-(4) Both product and process innovation considered (5)only product innovation is considered and (6)only process innovation considered

Conclusion Damijan et al.
• No evidence that R&D affects exporting• But evidence that Exporting affects innovation
(“learning”) for medium and large firms• Results are confirmed with matching techniques

Innovation, Exports and Productivity:
Firm-level evidence for Belgium
Ilke Vanbeveren (Lessius, KUL) and Hylke Vandenbussche (CORE-UCL & KUL-LICOS)
Brixen, September 2009

Intro
• Main research Q: Does innovation drive exporting?• Data: Belgium, Community Innovation Survey, 2 waves,
starters on export market vs. control group. • Methodology: Probit model. Dependent variable:
probability to start exporting. Independent variables: innovation variables and controls.
• Main findings: – It is the combination of product and process innovation
(not either of two in isolation) that increases firms’ probability to start exporting.
– Controlling for endogeneity of the innovation decision: no significant impact of innovation on probability to start exporting.
Ilke Van Beveren and Hylke Vandenbussche Brixen, September 2009

Road map
1. Motivation & related literature
2. Data
3. Econometric approach
4. Baseline results
5. Accounting for anticipation effects
6. Conclusion
Ilke Van Beveren and Hylke Vandenbussche Brixen, September 2009

Motivation
Motivation - Data - Econometric approach - Results - Conclusion
Three sources of endogeneity:• Simultaneity: Innovation and export decisions are
taken at the same time. – Possible solution: use lagged values of independent
variables.
• Causality: Past exporting history. – Possible solution: focus on starters versus non-exporters.
• Anticipation: Future prospect of exports.– Possible solution: use Instrumental Variable techniques.
Ilke Van Beveren and Hylke Vandenbussche Brixen, September 2009

Data
Motivation - Data - Econometric approach - Results - Conclusion
• Community Innovation Survey data Belgium.• 2 waves: 2000 (CIS3) and 2004 (CIS4).• Sampling is random in each period: 600 firms have
answered both questionnaires.• Information about:
– Firm-level innovation– Firm-level exports
• All sectors of the economy.• Accounting information of firms: Belfirst (2006).
Ilke Van Beveren and Hylke Vandenbussche Brixen, September 2009

Data
Motivation - Data - Econometric approach - Results - Conclusion
• Sample selection: 2 restrictions:– Simultaneity bias: we use (four-year) lagged firm-level
characteristics in the empirical analysis: we can only include firms that have answered both questionnaires (600 firms).
– Causality bias: To rule out the influence of past exporting history: we focus only on starters on the export market and compare these a group of non-exporters (189 firms).
• Innovation variables: dummy variables indicating whether firm engaged in a particular innovation activity.
Ilke Van Beveren and Hylke Vandenbussche Brixen, September 2009

Motivation - Data - Econometric approach - Results - Conclusion
Sector NNon-
exporters StartersMining (Nace 14) 2 1 1Food, beverages & tobacco (Nace 15-16) 6 1 5Textiles, clothing, leather (Nace 17-19) 6 2 4Wood (products) (Nace 20) 3 1 2Paper and publishing (Nace 21-22) 5 1 4Fuel and chemicals (Nace 23-24) 5 1 4Rubber and plastics (Nace 25) 4 1 3Non-metallic minerals (Nace 26) 4 1 3Basic and fabricated metals, machinery (Nace 27-29) 24 4 20Electrical, optical, medical instruments (Nace 30-33) 3 1 2Tranport equipment, manufacturing n.e.c. (Nace 34-37) 9 6 3Construction (Nace 45) 2 2 0Wholesale and retail trade (Nace 50-52) 35 16 19Transport and financial services (Nace 60-67) 40 30 10Real estate and business services (Nace 70-74) 41 24 17Total 189 92 97
Table 1: Sector distribution

Variable
Non-exporters Starters
Number of firms 92 97[Percentage of total] [48.68%] [51.32%]
Size 3.65 3.98***(Employment, fte, 2000) [1.28] [1.32]
Total factor productivity 1.00 2.25*(Törnqvist productivity index, 2000) [0.49] [9.11]
Reported values are means [standard deviations] in 2000 (except where the number of firms is reported). Starters are firms that start exporting in 2004, non-exporters do not export in 2000 and 2004. Significance levels
(*** p < 0.01; ** p < 0.05; * p < 0.10) refer to one-tailed test on the difference between the means for the starters compared to non-exporters.
Variables are defined in Appendix A.
Table 2: Comparing starters to non-exporters:
Motivation - Data - Econometric approach - Results - Conclusion

Motivation - Data - Econometric approach - Results - Conclusion
VariableNon-
exporters StartersN 92 97N_internal R&D 24 29N_external R&D 7 13N_product innovation 30 56N_process innovation 24 48N_product and process inn. 10 32
Table 3: Comparing starters to non-exporters: Innovation characteristics

Motivation - Data - Econometric approach - Results - Conclusion
[1] [2] [3] [4]
Internal R&D dummy 1External R&D dummy 0.4745 1Product innovation dummy 0.5176 0.3074 1Process innovation dummy 0.4805 0.3323 0.4428 1
Table 4: Correlations innovation measures

Econometric approach
Motivation - Data - Econometric approach - Results - Conclusion
• Estimation method: probit model.• Dependent variable: probability to start exporting.• Independent variables:
– Innovation dummies,– Sector dummies,– Firm-level control variables: Size and productivity.
4 4 4Pr 1 ln ,ln , ,it it it it iSTART f Size TFP INN I
Ilke Van Beveren and Hylke Vandenbussche Brixen, September 2009
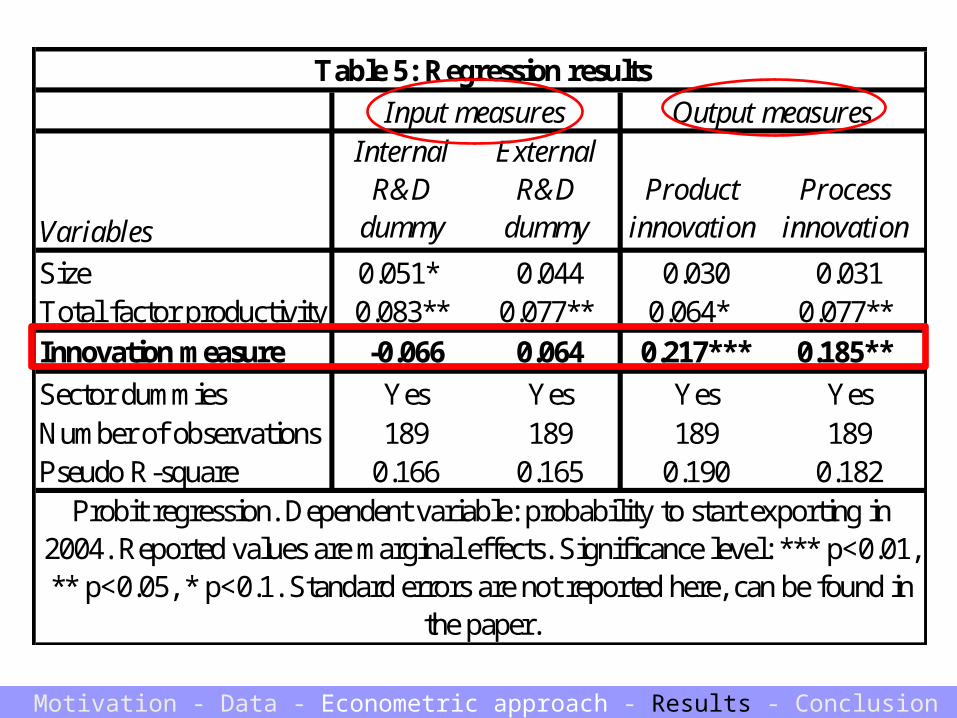
Variables
Internal R&D
dummy
External R&D
dummyProduct
innovationProcess
innovation
Size 0.051* 0.044 0.030 0.031Total factor productivity 0.083** 0.077** 0.064* 0.077** Innovation measure -0.066 0.064 0.217*** 0.185**
Sector dummies Yes Yes Yes YesNumber of observations 189 189 189 189Pseudo R-square 0.166 0.165 0.190 0.182
Table 5: Regression results
Input measures Output measures
Probit regression. Dependent variable: probability to start exporting in 2004. Reported values are marginal effects. Significance level: *** p<0.01, ** p<0.05, * p<0.1. Standard errors are not reported here, can be found in
the paper.
Motivation - Data - Econometric approach - Results - Conclusion

Variables I II III IV V
Size 0.023 0.018 0.045 0.047 0.022Total factor productivity 0.066* 0.068* 0.075** 0.077** 0.073**
Product innovation 0.175** - - - -Process innovation 0.119 - - - -
Only product innovation 0.101 0.085 - -Only process innovation 0.029 - -0.028 -Product & Process innovation 0.301*** - - 0.285***
Sector dummies Yes Yes Yes Yes YesNumber of observations 189 189 189 189 189Psuedo R-square 0.196 0.201 0.167 0.165 0.196
Table 6: Regression results
Probit regression. Dependent variable: probability to start exporting in 2004. Reported values are marginal effects. Significance level: *** p<0.01, ** p<0.05, * p<0.1. Standard errors are not
reported here, can be found in the paper.
Motivation - Data - Econometric approach - Results - Conclusion

Accounting for anticipation effect
Motivation - Data - Econometric approach - Results - Conclusion
• How? IV estimation techniques.• Problem: IV probit is not possible when
endogenous variable is dummy.• Solution: Linear Probability Model (IV).• Requirements for good instruments:
– No direct impact on probability to start exporting.– Significant determinant of endogenous variable,
conditional on all other independent variables.
Ilke Van Beveren and Hylke Vandenbussche Brixen, September 2009

Dependent variable Onlyprod2000 Onlyproc2000 Bothinn2000
Size -0.005 -0.04 0.067** Total factor productivity -0.001 0.001 -0.001
Internal R&D 0.231** 0.213** 0.143* External R&D -0.105 -0.188 0.318** Training 0.107 0.153** 0.025
Sector dummies Yes Yes YesNumber of observations 189 189 189
Table A.1. First-stage regression results
Results of first-stage regression of the IV estimation reported in the last column of Table 6. Reported values are coefficients. Standard errors are unreported here, can be found in the paper. Dependent variable is given at the top of each column.Significance level: *** p<0.01, ** p<0.05, *
p<0.1.
Motivation - Data - Econometric approach - Results - Conclusion

IV IV IV
Size 0.008 0.043 0.041 0.077Total factor productivity 0.003** 0.002 0.002 -0.004
Only product innovation 0.107 -0.151 - -5.153Only process innovation 0.036 - 0.803 4.377Product and process inn. 0.275*** - - 1.207
Instruments (dummies, 2000)
- Internal R&D Training External R&DInternal R&D
Training
Sector dummies Yes Yes Yes YesR-square 0.236 0.163 0.161 0.178Number of observations 189 189 189 189
OLS or IV regression. Dependent variable: dummy, equal to one if the firms starts exporting in 2004. Reported values are coefficients. Significance level: *** p<0.01, **
p<0.05, * p<0.1. Standard errors are not reported here, can be found in the paper.
Table 7: Instrumental variables estimation
Variables
Baseline model LPM
Output measures
Motivation - Data - Econometric approach - Results - Conclusion

Conclusion
Motivation- Data - Econometric approach - Results - Conclusion
• It is not so much product or process innovation in isolation, but rather the combination of the two, that increases firms’ propensity to start exporting.
• After accounting for the potential endogeneity of the innovation decision in firms’ export decision: results suggest that firms self-select into innovation, i.e. they only invest in innovative activities if their future export prospects are good.
Ilke Van Beveren and Hylke Vandenbussche Brixen, September 2009