lecture 2 1 - school of computer science and statistics - …€¦ · · 2012-05-09lecture 2.1 1....
TRANSCRIPT

Design and Analysis of ExperimentsLecture 2.1
1. Review of Lecture 1.2
– Minute tests
– Randomized Blocks Design and Analysis,
with extensions
Lecture 2.1 1
© 2012 Michael Stuart
Diploma in Statistics
Design and Analysis of Experiments
2. Factorial design
– a 3 x 3 experiment
3. Randomized blocks revisited
– interaction?
– explaining ANOVA
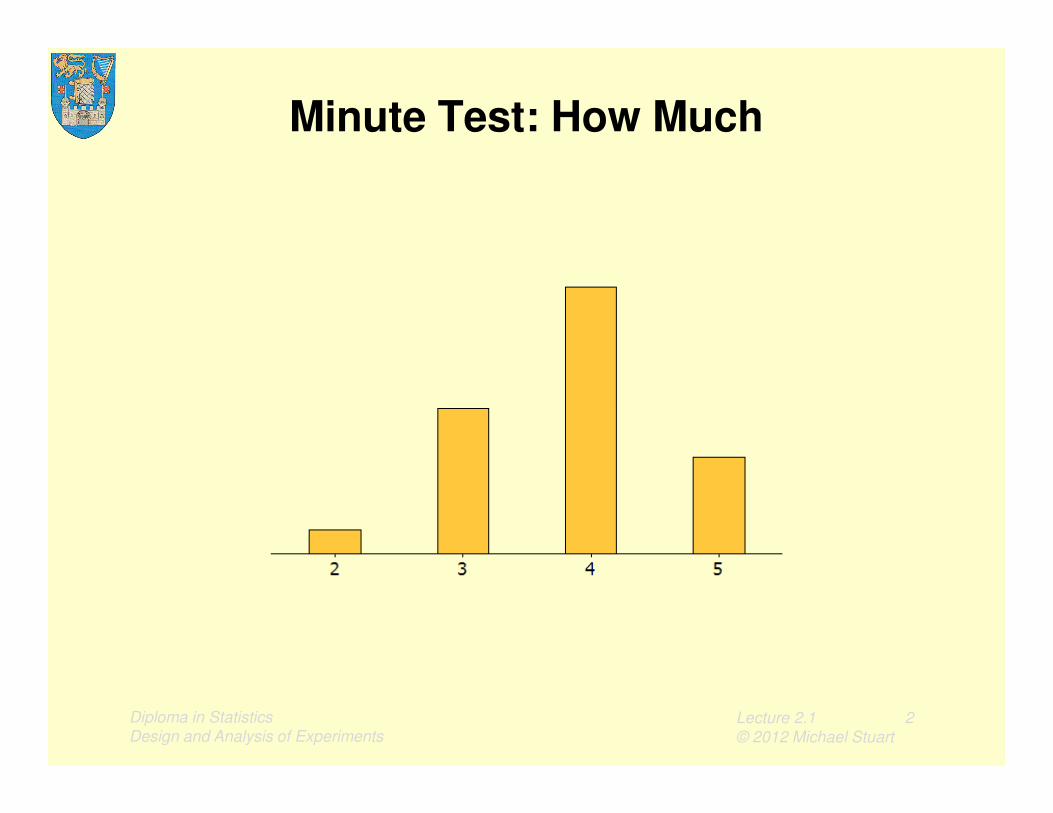
Minute Test: How Much
Lecture 2.1 2
© 2012 Michael Stuart
Diploma in Statistics
Design and Analysis of Experiments

Minute Test: How Fast
Lecture 2.1 3
© 2012 Michael Stuart
Diploma in Statistics
Design and Analysis of Experiments

Randomized Blocks Design and Analysis
Review and Extensions
• Review
• Randomization procedure
• Deleted diagnostics
Lecture 2.1 4
© 2012 Michael Stuart
Diploma in Statistics
Design and Analysis of Experiments
• Deleted diagnostics
• Effect of Blocking
• Adjusted sums of squares

Randomized block design
Where replication entails increased variation, replicate the full experiment in several blocks so that
• non-experimental variation within blocks is as small as possible,
Lecture 2.1 5
© 2012 Michael Stuart
Diploma in Statistics
Design and Analysis of Experiments
– comparison of experimental effects subject to minimal chance variation,
• variation between blocks may be substantial,
– comparison of experimental effects not affected
Illustrations of blocking variables
Agriculture:
fertility levels in a field or farm,
moisture levels in a field or farm,
genetic similarity in animals, litters as blocks,
Lecture 2.1 6
© 2012 Michael Stuart
genetic similarity in animals, litters as blocks,
etc.
Diploma in Statistics
Design and Analysis of Experiments

Illustrations of blocking variables
Clinical trials
age,
sex,
height, weight,
Lecture 2.1 7
© 2012 Michael Stuart
height, weight,
social class,
medical history
etc.
(but analysis of covariance frequently used instead)Diploma in Statistics
Design and Analysis of Experiments

Illustrations of blocking variables
Clinical trials
treatments applied to same individual at different times,
cross-over, carry-over, correlation,
Lecture 2.1 8
© 2012 Michael Stuart
cross-over, carry-over, correlation,
body parts as blocks,
hands, feet, eyes, ears,
etc.
Diploma in Statistics
Design and Analysis of Experiments

Illustrations of blocking variables
Industrial trials
similar machines as blocks,
time based blocks,
time of day, day of week, shift
Lecture 2.1 9
© 2012 Michael Stuart
time of day, day of week, shift
etc.
Diploma in Statistics
Design and Analysis of Experiments

Randomized blocksIllustration
• Process: chemicals blended, filtered and dried
• Problem: yield loss at filtration stage
• Proposal: adjust initial blend to reduce yield loss
• Plan:
Lecture 2.1 10
© 2012 Michael Stuart
Diploma in Statistics
Design and Analysis of Experiments
• Plan:
– prepare five different blends
– use each blend in successive process runs, in random order
– repeat at later times (blocks)

ResultsBlock Run Blend Loss, per cent
I 1 B 18.2
2 A 16.9
3 C 17.0
4 E 18.3
5 D 15.1
II 6 A 16.5
7 E 18.3
8 B 19.2
Lecture 2.1 11
© 2012 Michael Stuart
Diploma in Statistics
Design and Analysis of Experiments
8 B 19.2
9 C 18.1
10 D 16.0
III 11 B 17.1
12 D 17.8
13 C 17.3
14 E 19.8
15 A 17.5
Ref: BlendLoss.xls

Analysis of Variance
Source DF SS MS F P
Block 2 1.648 0.824 0.94 0.429
Blend 4 11.556 2.889 3.31 0.071
Error 8 6.992 0.874
Total 14 20.196
Lecture 2.1 12
© 2012 Michael Stuart
S = 0.9349
F(Blends) is almost statistically significant, p = 0.07
F(Blocks) is not statistically significant, p = 0.4
→ Diagnostic analysis reveals exceptional case
Diploma in Statistics
Design and Analysis of Experiments

Iterated analysis:delete Case 11
Source DF SS MS F P
Block 2 3.758 1.879 4.14 0.065
Blend 4 14.572 3.643 8.03 0.009
Error 7 3.176 0.454
Total 13 19.989
S = 0.674
Lecture 2.1 13
© 2012 Michael Stuart
S = 0.674
F(Blends) is statistically significant, p = 0.01
F(Blocks) is almost significant, p = 0.065
Prediction standard deviation: S = 0.67
Diploma in Statistics
Design and Analysis of Experiments

Randomized Block Design and Analysis
Review and Extensions
• Review
• Randomization procedure
• Deleted diagnostics
Lecture 2.1 14
© 2012 Michael Stuart
Diploma in Statistics
Design and Analysis of Experiments
• Deleted diagnostics
• Effect of Blocking
• Adjusted sums of squares

Randomization procedure
1. enter numbers 1 to 5 in Column A of a spreadsheet, headed Run,
2. enter letters A-E in Column B, headed Method,
3. generate 5 random numbers into Column C, headed Random
Lecture 2.1 15
© 2012 Michael Stuart
Diploma in Statistics
Design and Analysis of Experiments
Random
4. sort Method by Random,
5. allocate Treatments as sorted to Runs in Block I,
6. repeat Steps 3 - 5 for Blocks II to V.
Go to Excel

Randomized Block Design and Analysis
Review and Extensions
• Review
• Randomization procedure
• Deleted diagnostics
Lecture 2.1 16
© 2012 Michael Stuart
Diploma in Statistics
Design and Analysis of Experiments
• Deleted diagnostics
• Effect of Blocking
• Adjusted sums of squares
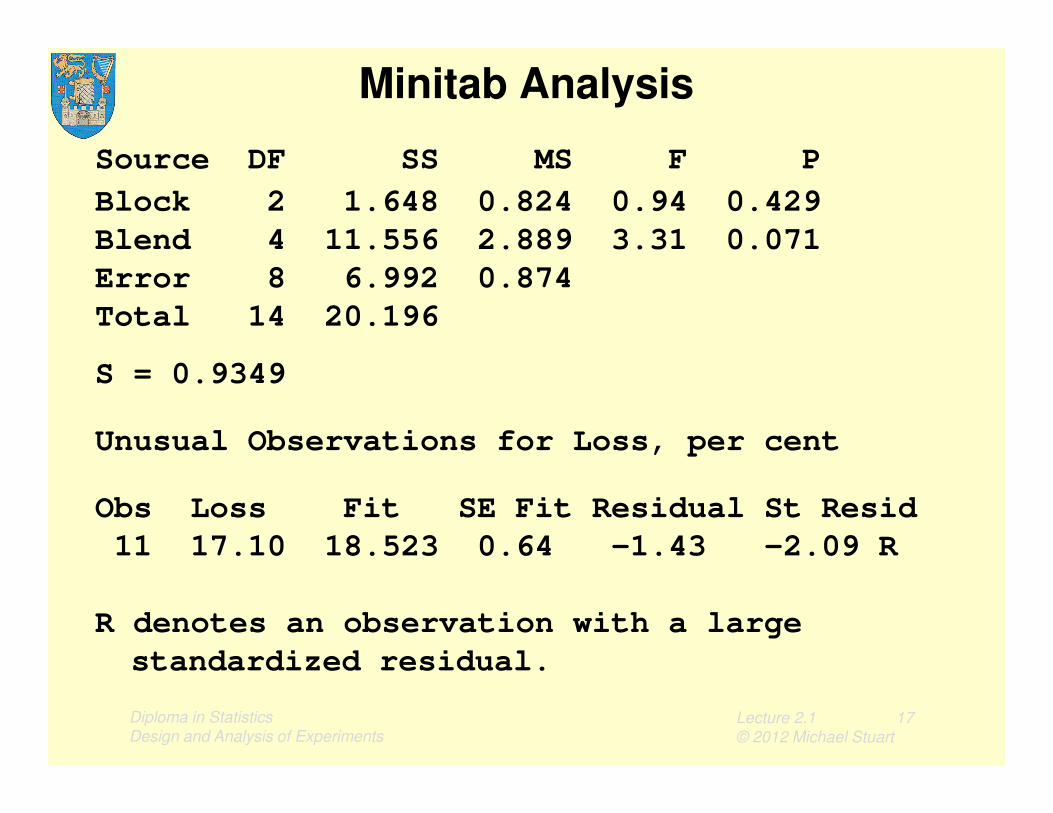
Source DF SS MS F P
Block 2 1.648 0.824 0.94 0.429
Blend 4 11.556 2.889 3.31 0.071
Error 8 6.992 0.874
Total 14 20.196
S = 0.9349
Minitab Analysis
Lecture 2.1 17
© 2012 Michael Stuart
Unusual Observations for Loss, per cent
Obs Loss Fit SE Fit Residual St Resid
11 17.10 18.523 0.64 -1.43 -2.09 R
R denotes an observation with a large
standardized residual.
Diploma in Statistics
Design and Analysis of Experiments
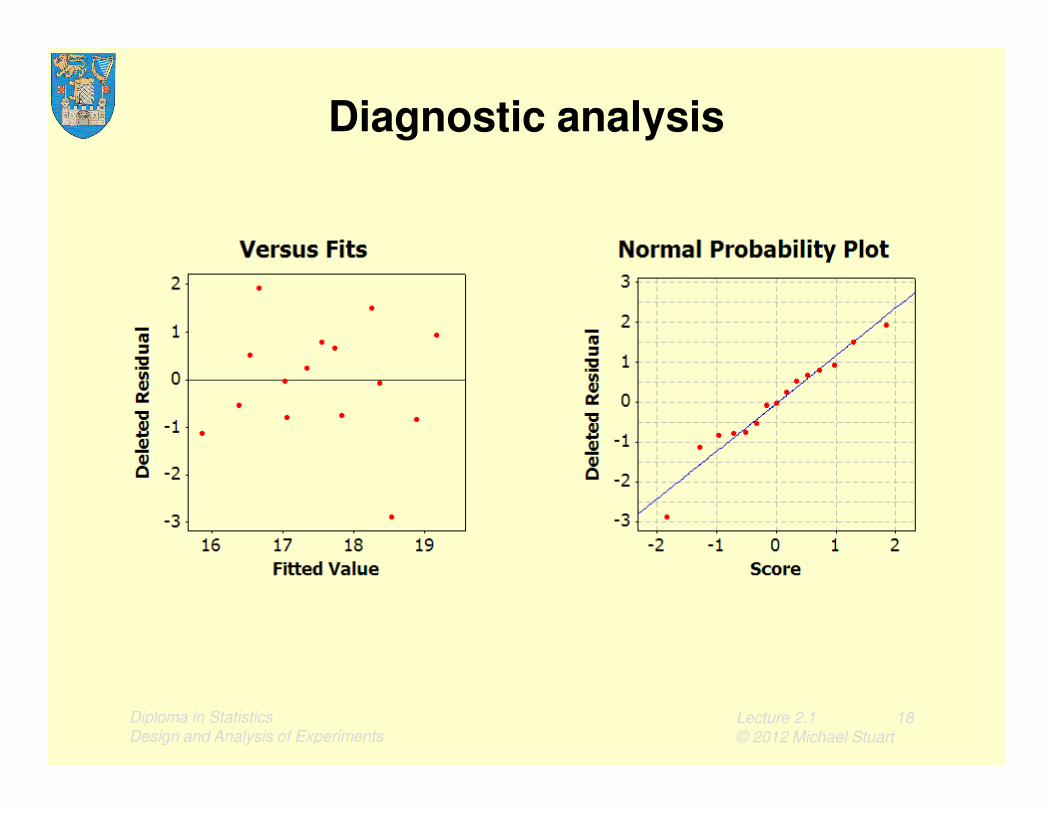
Diagnostic analysis
Lecture 2.1 18
© 2012 Michael Stuart
Diploma in Statistics
Design and Analysis of Experiments

Diagnostic plots
• The diagnostic plot, residuals vs fitted values
– checking for homogeneity of chance variation
Lecture 2.1 19
© 2012 Michael Stuart
Diploma in Statistics
Design and Analysis of Experiments
– checking for homogeneity of chance variation
• The Normal residual plot,
– checking the Normal model for chance variation
Deleted residuals
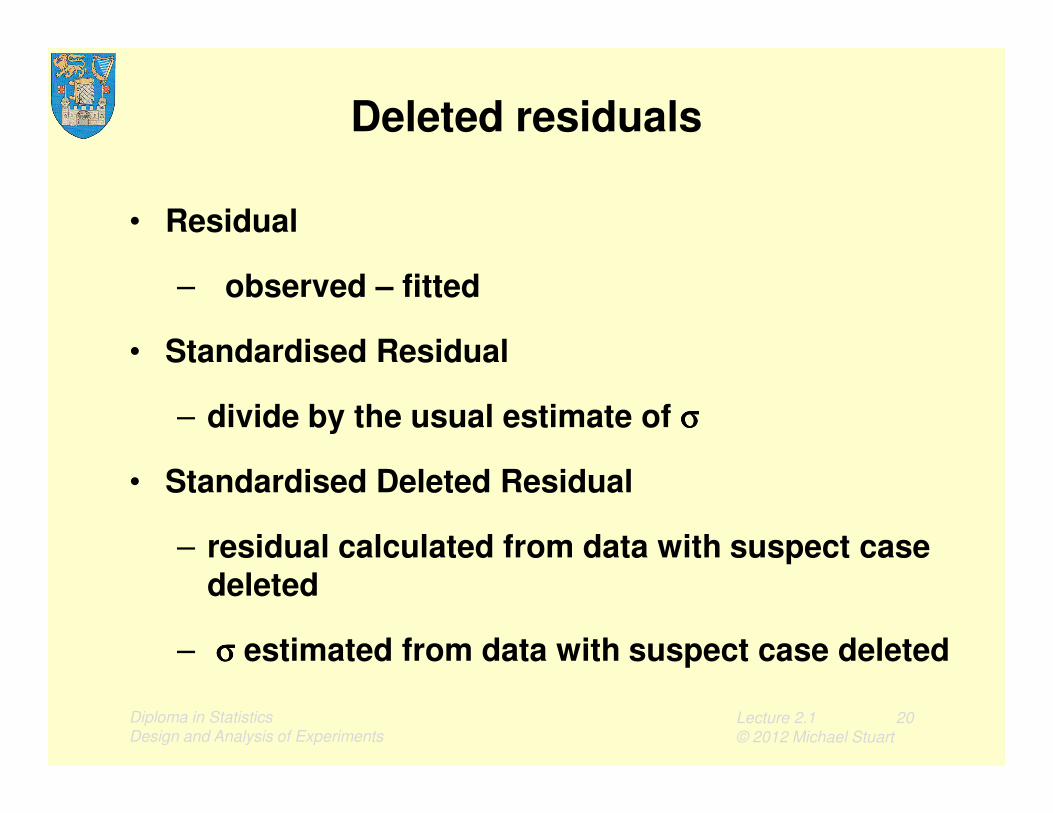
• Residual
– observed – fitted
• Standardised Residual
– divide by the usual estimate of σσσσ
Lecture 2.1 20
© 2012 Michael Stuart
Diploma in Statistics
Design and Analysis of Experiments
– divide by the usual estimate of σσσσ
• Standardised Deleted Residual
– residual calculated from data with suspect case deleted
– σσσσ estimated from data with suspect case deleted

Deleted residuals
For each potentially exceptional case:
– delete the case
– calculate the ANOVA from the rest
– use the deleted fitted model to calculate a
deleted fitted value
Lecture 2.1 21
© 2012 Michael Stuart
Diploma in Statistics
Design and Analysis of Experiments
deleted fitted value
– calculate deleted residual= obseved value – deleted fitted value
– calculate deleted estimate of s
– standardise
Minitab does this automatically for all cases!

Scatterplot, with exceptional case
Lecture 2.1 22
© 2012 Michael Stuart
Diploma in Statistics
Design and Analysis of Experiments

Corresponding residual plots,Standardized vs Deleted
Lecture 2.1 23
© 2012 Michael Stuart
Diploma in Statistics
Design and Analysis of Experiments

Randomized Blocks ExampleStandardized vs Deleted
Lecture 2.1 24
© 2012 Michael Stuart
Diploma in Statistics
Design and Analysis of Experiments

Randomized Blocks ExampleStandardized vs Deleted
Lecture 2.1 25
© 2012 Michael Stuart
Diploma in Statistics
Design and Analysis of Experiments

Randomized Block Design and Analysis
Review and Extensions
• Review
• Randomization procedure
• Deleted diagnostics
Lecture 2.1 26
© 2012 Michael Stuart
Diploma in Statistics
Design and Analysis of Experiments
• Deleted diagnostics
• Effect of Blocking
• Adjusted sums of squares

Was the blocking effective?
Source DF SS MS F P
Block 2 1.648 0.824 0.94 0.429
Blend 4 11.556 2.889 3.31 0.071
Error 8 6.992 0.874
Total 14 20.196
S = 0.9349
Lecture 2.1 27
© 2012 Michael Stuart
S = 0.9349
Source DF SS MS F P
Blend 4 11.556 2.889 3.34 0.055
Error 10 8.640 0.864
Total 14 20.196
S = 0.9295
Diploma in Statistics
Design and Analysis of Experiments
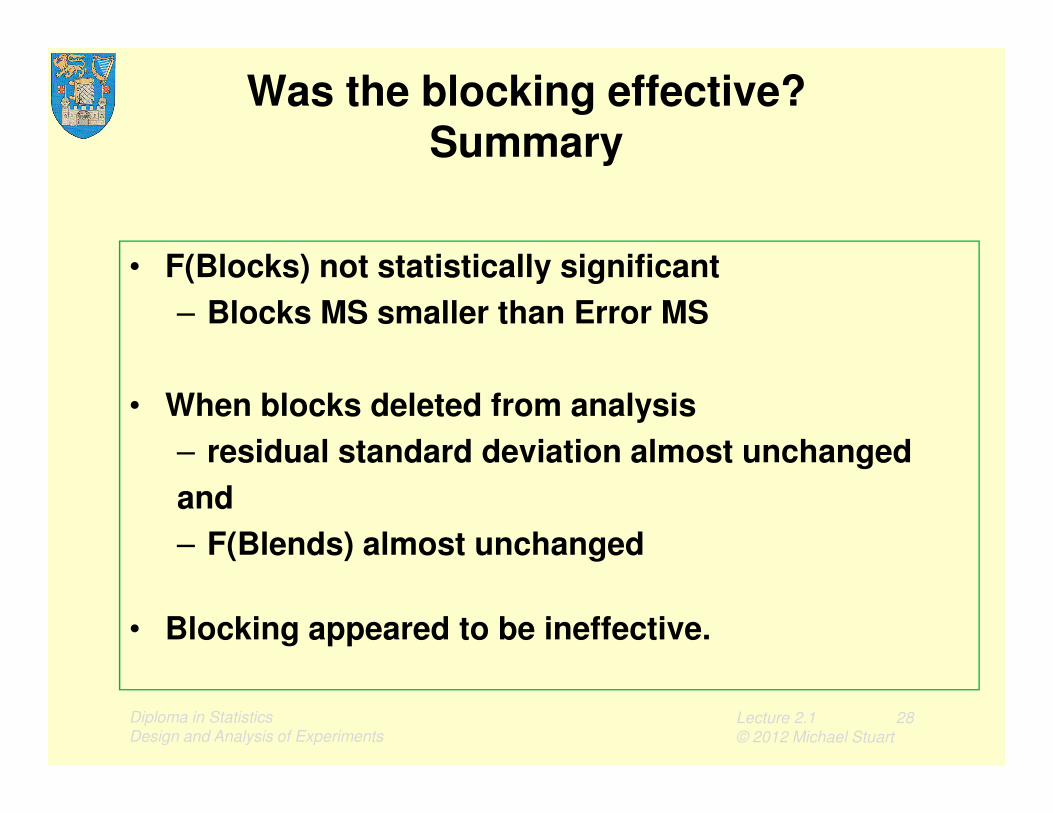
Was the blocking effective?Summary
• F(Blocks) not statistically significant
– Blocks MS smaller than Error MS
• When blocks deleted from analysis
Lecture 2.1 28
© 2012 Michael Stuart
Diploma in Statistics
Design and Analysis of Experiments
• When blocks deleted from analysis
– residual standard deviation almost unchanged
and
– F(Blends) almost unchanged
• Blocking appeared to be ineffective.

Effect of Blocking, revised analysis
Analysis of Variance, with blocks
Source DF SS MS F P
Blend 4 14.572 3.643 8.03 0.009
Block 2 3.758 1.879 4.14 0.065
Error 7 3.176 0.454
Total 13 19.989
Lecture 2.1 29
© 2012 Michael Stuart
Diploma in Statistics
Design and Analysis of Experiments
Total 13 19.989
Analysis of Variance, blocks excluded
Source DF SS MS F P
Blend 4 13.055 3.264 4.24 0.034
Error 9 6.933 0.770
Total 13 19.989

Effect of Blocking, revised analysisSummary
• F(Blocks) almost significant
– Blocks MS more than 4 times Error MS
• When blocks deleted from analysis
– Blocks DF and Error DF combined
– Blocks SS and Error SS combined
Lecture 2.1 30
© 2012 Michael Stuart
Diploma in Statistics
Design and Analysis of Experiments
– Blocks SS and Error SS combined
– combined Error MS much larger than original
– variation between blocks is substantial
• F(Blends) is more significantwhen variation between blocks is allowed for– blocking was effective.

Randomized Block Design and Analysis
Review and Extensions
• Review
• Randomization procedure
• Deleted diagnostics
Lecture 2.1 31
© 2012 Michael Stuart
Diploma in Statistics
Design and Analysis of Experiments
• Deleted diagnostics
• Effect of Blocking
• Adjusted sums of squares

Blend Loss Analysis:Case 11 deleted
General Linear Model: Loss versus Blend, Block
Analysis of Variance for Loss
Source DF Seq SS Adj SS Adj MS F P
Blend 4 13.0552 14.5723 3.6431 8.03 0.009
Block 2 3.7577 3.7577 1.8788 4.14 0.065
Lecture 2.1 32
© 2012 Michael Stuart
Diploma in Statistics
Design and Analysis of Experiments
Block 2 3.7577 3.7577 1.8788 4.14 0.065
Error 7 3.1757 3.1757 0.4537
Total 13 19.9886
S = 0.673548

Adjusted sums of squares
• Sequential sums of squares are calculated allowing for the presence of earlier effects in the model.
• Adjusted sums of squares are calculated allowing for the presence of all other effects in
Lecture 2.1 33
© 2012 Michael Stuart
Diploma in Statistics
Design and Analysis of Experiments
allowing for the presence of all other effects in the model
• No difference with balanced data,– separate sets of effects are uncorrelated,– values of one set not affected by values of
another
• Use Adjusted SS, ignore Sequential SS

Lecture 2.1
1. Review of Lecture 1.2
– Minute tests
– Randomized Block Design and Analysis,
with extensions
Lecture 2.1 34
© 2012 Michael Stuart
Diploma in Statistics
Design and Analysis of Experiments
2. Factorial design
– a 3 x 3 experiment
3. Randomized blocks revisited
– interaction?
– explaining ANOVA

Part 2Factorial Design
Iron-deficiency anemia
• the most common form of malnutrition in developing countries
• contributory factors:
Lecture 2.1 35
© 2012 Michael Stuart
– cooking pot type
• Aluminium (A), Clay (C) and Iron (I)
– food type
• Meat (M), Legumes (L) and Vegetables (V)
Diploma in Statistics
Design and Analysis of Experiments

Study design and results
• 4 samples of each food type were cooked in each pot type,
• iron content in each sample measured in milligrams of iron per 100 grams of cooked food.
Lecture 2.1 36
© 2012 Michael Stuart
Diploma in Statistics
Design and Analysis of Experiments
Pot Type Vegetable Type
Meat Legumes Vegetables
Aluminium 1.77 2.36 1.96 2.14 2.40 2.17 2.41 2.34 1.03 1.53 1.07 1.30
Clay 2.27 1.28 2.48 2.68 2.41 2.43 2.57 2.48 1.55 0.79 1.68 1.82
Iron 5.27 5.17 4.06 4.22 3.69 3.43 3.84 3.72 2.45 2.99 2.80 2.92

Classwork 2.1.0
• What were the– experimental units– experimental runs– observational units– response– factors
Lecture 2.1 37
© 2012 Michael Stuart
– factors– levels– treatments– unit structure– treatment structure– design– replication
Diploma in Statistics
Design and Analysis of Experiments

Initial Data Analysis
Pot Type Vegetable Type
Meat Legumes Vegetables
Aluminium 2.06 2.33 1.23
Clay 2.18 2.47 1.46
Iron 4.68 3.67 2.79
Lecture 2.1 38
© 2012 Michael Stuart
Diploma in Statistics
Design and Analysis of Experiments

Model for analysis
Iron content includes
– a contribution for each food type
plus
– a contribution for each pot type
plus
Lecture 2.1 39
© 2012 Michael Stuart
plus
– a contribution for each food type / pot type combination
plus
– a contribution due to chance variation.
Minitab: Pot Food Pot * FoodDiploma in Statistics
Design and Analysis of Experiments

Analysis of Variance
Analysis of Variance for Iron
Source DF SS MS F P
Pot 2 24.8940 12.4470 92.26 0.000
Food 2 9.2969 4.6484 34.46 0.000
Pot*Food 4 2.6404 0.6601 4.89 0.004
Lecture 2.1 40
© 2012 Michael Stuart
Pot*Food 4 2.6404 0.6601 4.89 0.004
Error 27 3.6425 0.1349
Total 35 40.4738
S = 0.367297
Diploma in Statistics
Design and Analysis of Experiments

Summary
Cooking in iron pots adds substantially to the average iron content of all cooked foods.
However, it adds considerably more to the iron content of meat,
Lecture 2.1 41
© 2012 Michael Stuart
– around 2.5 to 2.6 mgs per 100gms on average,
than to that of legumes or vegetables,
– around 1.2 to 1.5 mgs per 100gms on average
The iron content is very similar using aluminiumand clay for all three food types.
Diploma in Statistics
Design and Analysis of Experiments

Interaction
Lecture 2.1 42
© 2012 Michael Stuart
Diploma in Statistics
Design and Analysis of Experiments

Interaction
Lecture 2.1 43
© 2012 Michael Stuart
Diploma in Statistics
Design and Analysis of Experiments

Diagnostic plots
Lecture 2.1 44
© 2012 Michael Stuart
Diploma in Statistics
Design and Analysis of Experiments

Diagnostic plots
Lecture 2.1 45
© 2012 Michael Stuart
Slight suggestion of skewness, butconclusions are sufficiently strong to ignore this
Diploma in Statistics
Design and Analysis of Experiments

Lecture 2.1
1. Review of Lecture 1.2
– Homework 1.2.1
– Randomized Block Design and Analysis,
with extensions
Lecture 2.1 46
© 2012 Michael Stuart
Diploma in Statistics
Design and Analysis of Experiments
2. Factorial design
– a 3 x 3 experiment
3. Randomized blocks revisited
– interaction?
– explaining ANOVA

Part 3Randomized blocks revisited
Blend Loss analysis included
Blend effects + Block effects + Chance variation,
– NO INTERACTION EFFECTS
Analysis of Variance for Loss,%, using Adjusted
Lecture 2.1 47
© 2012 Michael Stuart
Analysis of Variance for Loss,%, using Adjusted
SS for Tests
Source DF Seq SS Adj SS Adj MS F P
Blend 4 11.5560 11.5560 2.8890 3.31 0.071
Block 2 1.6480 1.6480 0.8240 0.94 0.429
Error 8 6.9920 6.9920 0.8740
Total 14 20.1960
Diploma in Statistics
Design and Analysis of Experiments
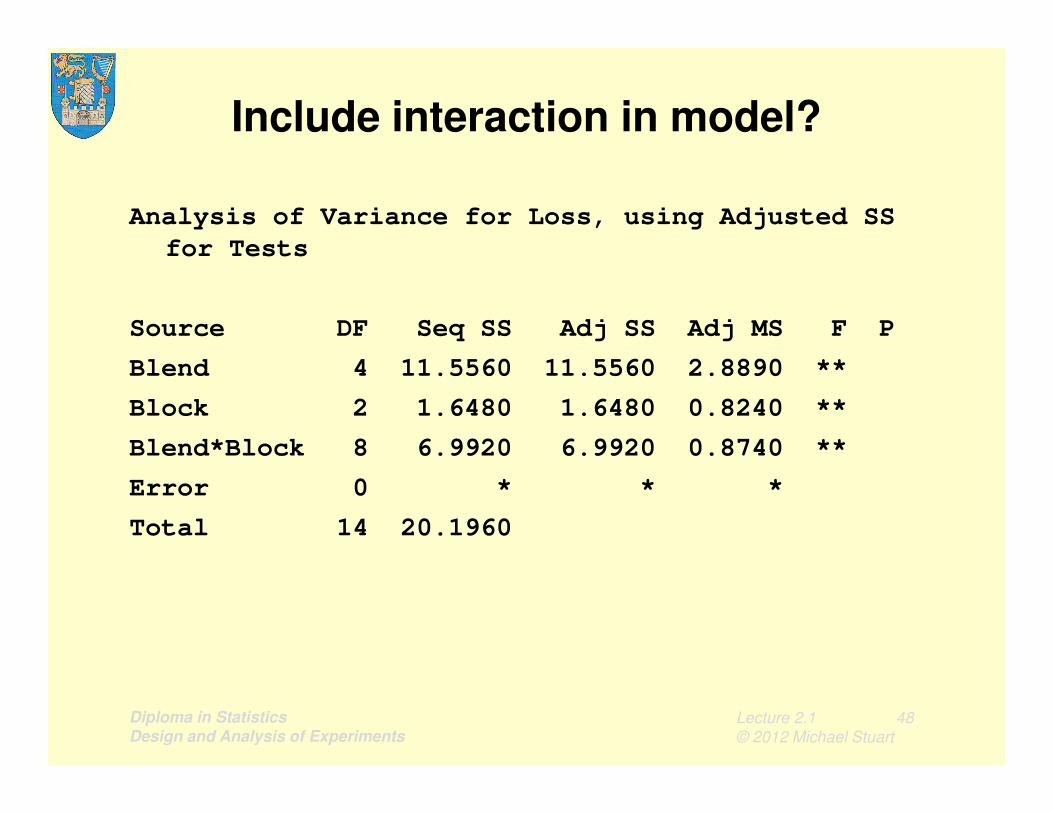
Include interaction in model?
Analysis of Variance for Loss, using Adjusted SS
for Tests
Source DF Seq SS Adj SS Adj MS F P
Blend 4 11.5560 11.5560 2.8890 **
Block 2 1.6480 1.6480 0.8240 **
Lecture 2.1 48
© 2012 Michael Stuart
Block 2 1.6480 1.6480 0.8240 **
Blend*Block 8 6.9920 6.9920 0.8740 **
Error 0 * * *
Total 14 20.1960
Diploma in Statistics
Design and Analysis of Experiments

Classwork 2.1.2
Calculate fitted values:
Overall Mean + Blend Deviation + Block deviation
Block 1
–0.4 Block 2
0.1 Block 3
0.4
Blend A –0.6
Blend B
Lecture 2.1 49
© 2012 Michael Stuart
Diploma in Statistics
Design and Analysis of Experiments
17.5 +
Blend B 0.6
Blend C –0.1
Blend D –1.2
Blend E 1.3
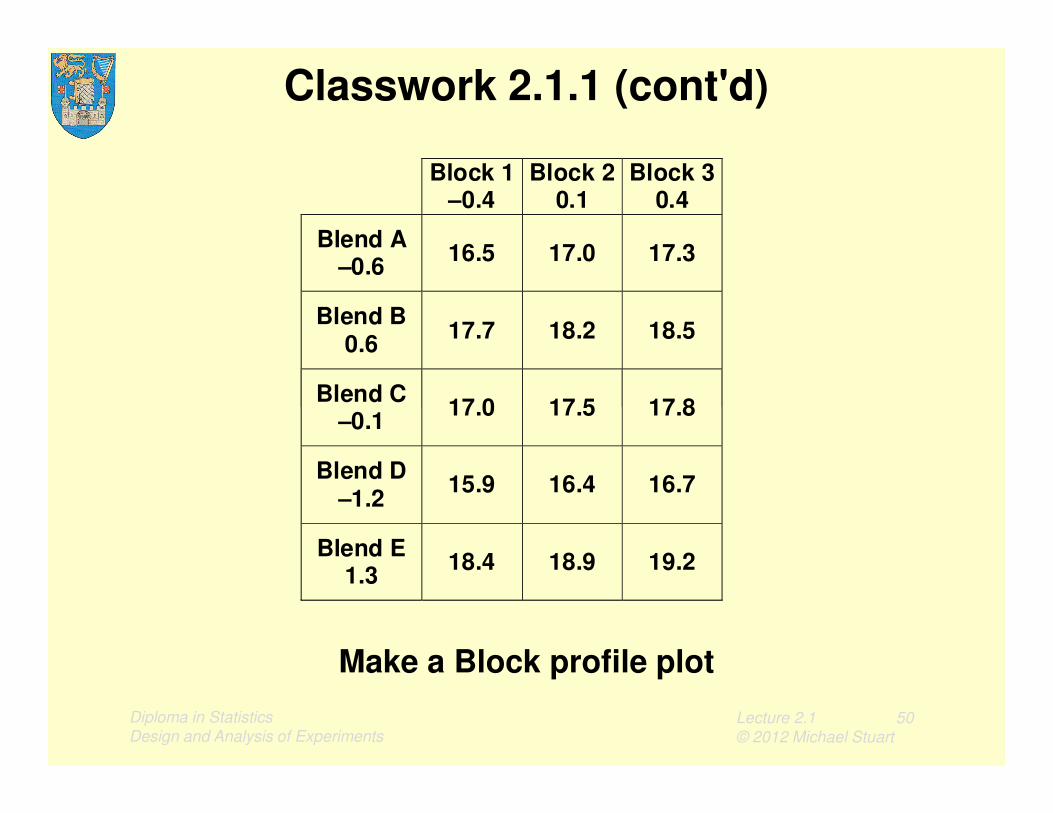
Classwork 2.1.1 (cont'd)
Block 1
–0.4 Block 2
0.1 Block 3
0.4
Blend A –0.6
16.5 17.0 17.3
Blend B 0.6
17.7 18.2 18.5
Blend C 17.0 17.5 17.8
Lecture 2.1 50
© 2012 Michael Stuart
Diploma in Statistics
Design and Analysis of Experiments
Make a Block profile plot
Blend C –0.1
17.0 17.5 17.8
Blend D –1.2
15.9 16.4 16.7
Blend E 1.3
18.4 18.9 19.2

Fitted values; NO INTERACTION
19.5
19.0
18.5
18.0
17.5
Valu
es
1
2
3
Block
Line Plot of Fitted Values
Lecture 2.1 51
© 2012 Michael Stuart
Diploma in Statistics
Design and Analysis of Experiments
EDCBA
17.5
17.0
16.5
16.0
Blend
Fit
ted
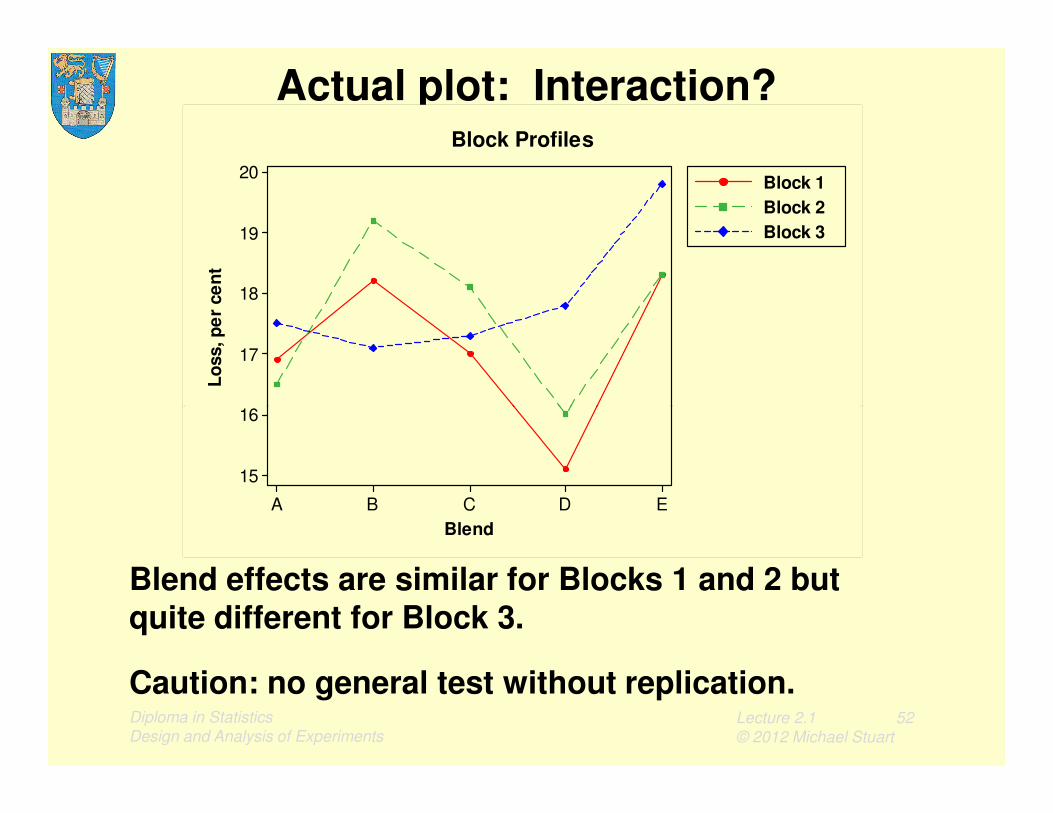
Actual plot: Interaction?
20
19
18
17
16
Lo
ss, p
er
ce
nt
Block 1
Block 2
Block 3
Block Profiles
Lecture 2.1 52
© 2012 Michael Stuart
Diploma in Statistics
Design and Analysis of Experiments
EDCBA
16
15
Blend
Blend effects are similar for Blocks 1 and 2 but quite different for Block 3.
Caution: no general test without replication.

Interaction?
20
19
18
pe
r ce
nt
Block 1
Block 2
Block 3
Block Profiles
Lecture 2.1 53
© 2012 Michael Stuart
Diploma in Statistics
Design and Analysis of Experiments
Blend x Block interaction?
EDCBA
17
16
15
Blend
Lo
ss, p
Interaction?
20
19
18
17
Lo
ss, p
er
ce
nt
A
B
C
D
E
Blend
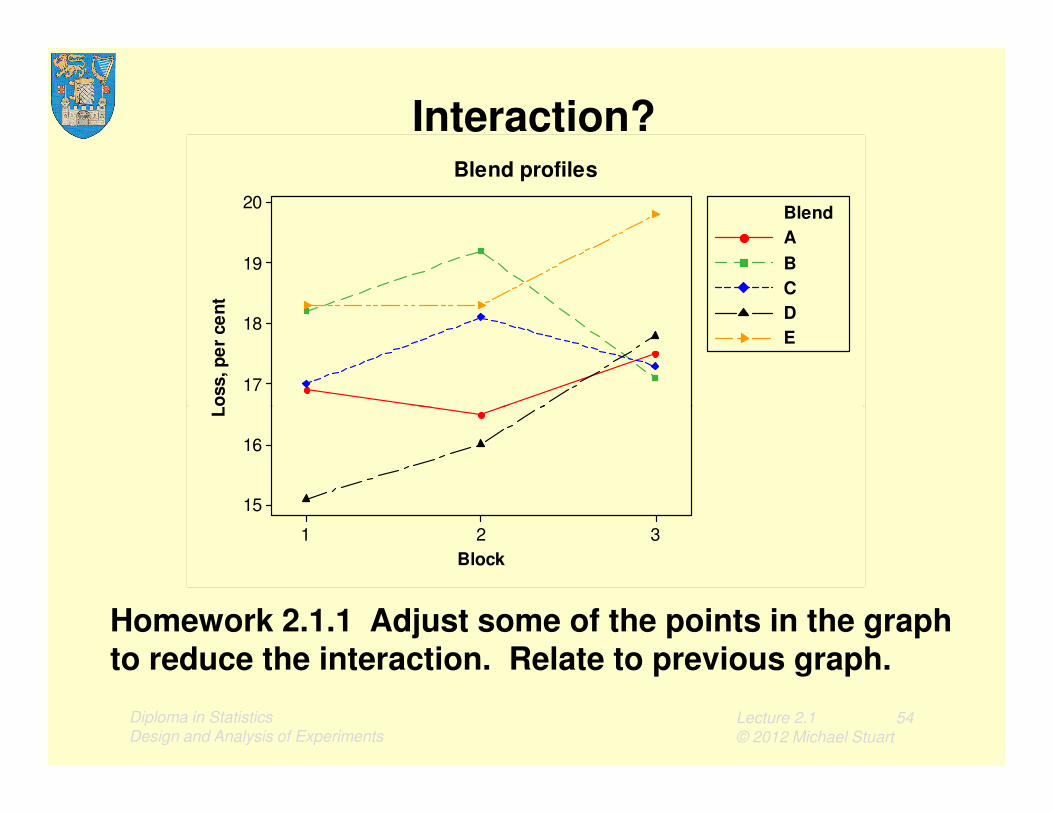
Blend profiles
Lecture 2.1 54
© 2012 Michael Stuart
Diploma in Statistics
Design and Analysis of Experiments
321
16
15
Block
L
Homework 2.1.1 Adjust some of the points in the graph to reduce the interaction. Relate to previous graph.

What to do with no replication?
Recall F-test logic:
– MS(Error) ≈ σσσσ2
– MS(Effect) ≈ σσσσ2 + effect contribution
– F = MS(Effect) / MS(Error) ≈ 1 if effect absent,
>>1 if effect present
No replication?
Lecture 2.1 55
© 2012 Michael Stuart
Diploma in Statistics
Design and Analysis of Experiments
No replication?
use MS(Interaction) as MS(Error)
If Block by Treatment interaction is absent,
– OK
If Block by Treatment interaction is present,
– conservative test

Explaining ANOVA
ANOVA depends on a decompostion of "Total variation" into components:
Total Variation = Blend effect + Block effect
+ chance variation;
Lecture 2.1 56
© 2012 Michael Stuart
+ chance variation;
∑∑∑∑ ++++−−−−−−−−++++
∑∑∑∑ −−−−++++∑∑∑∑ −−−−====∑∑∑∑ −−−−
••••••••••••••••
====
••••••••••••
====
••••••••••••••••••••
j,i
2jiij
k
1j
2j
k
1i
2i
j,i
2ij
)YYYY(
)YY(k)YY(n)YY(
.
Diploma in Statistics
Design and Analysis of Experiments
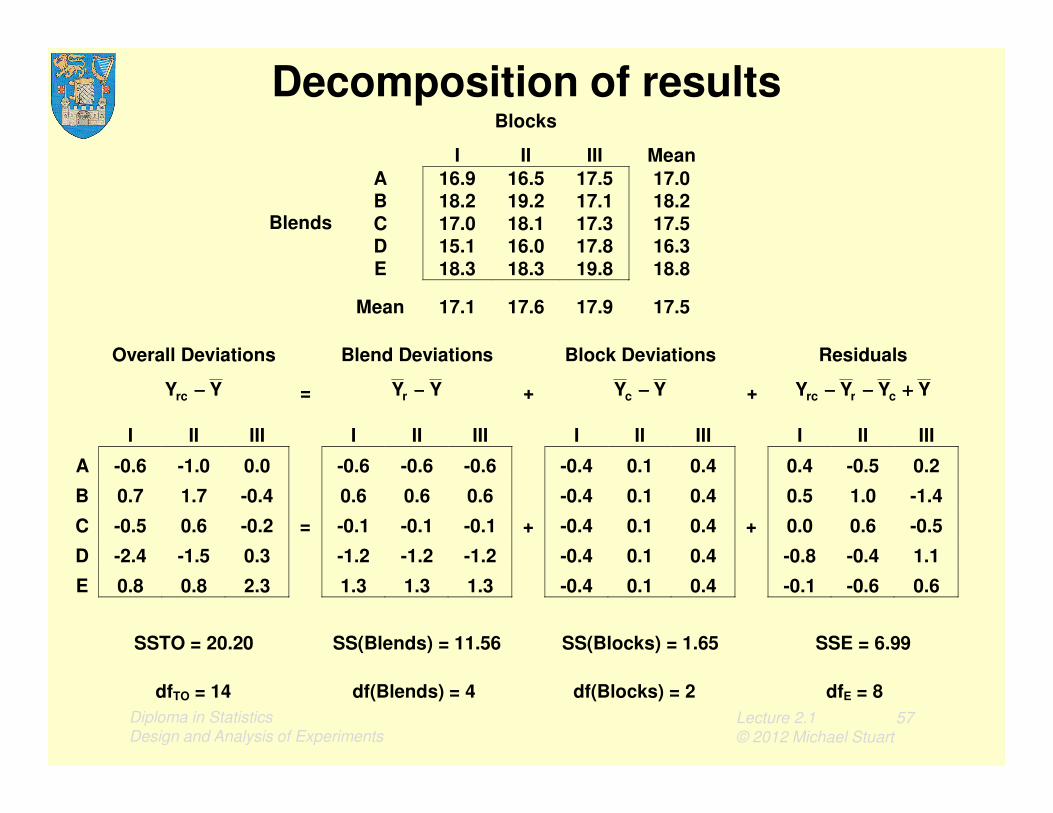
Decomposition of results
Overall Deviations Blend Deviations Block Deviations Residuals
YYrc −−−− = YYr −−−− + YYc −−−− + YYYY crrc ++++−−−−−−−−
Blocks
I II III Mean A 16.9 16.5 17.5 17.0 B 18.2 19.2 17.1 18.2 Blends C 17.0 18.1 17.3 17.5
D 15.1 16.0 17.8 16.3 E 18.3 18.3 19.8 18.8
Mean 17.1 17.6 17.9 17.5
Lecture 2.1 57
© 2012 Michael Stuart
I II III I II III I II III I II III
A -0.6 -1.0 0.0 -0.6 -0.6 -0.6 -0.4 0.1 0.4 0.4 -0.5 0.2
B 0.7 1.7 -0.4 0.6 0.6 0.6 -0.4 0.1 0.4 0.5 1.0 -1.4
C -0.5 0.6 -0.2 = -0.1 -0.1 -0.1 + -0.4 0.1 0.4 + 0.0 0.6 -0.5
D -2.4 -1.5 0.3 -1.2 -1.2 -1.2 -0.4 0.1 0.4 -0.8 -0.4 1.1
E 0.8 0.8 2.3 1.3 1.3 1.3 -0.4 0.1 0.4 -0.1 -0.6 0.6
SSTO = 20.20 SS(Blends) = 11.56 SS(Blocks) = 1.65 SSE = 6.99
dfTO = 14 df(Blends) = 4 df(Blocks) = 2 dfE = 8
Diploma in Statistics
Design and Analysis of Experiments
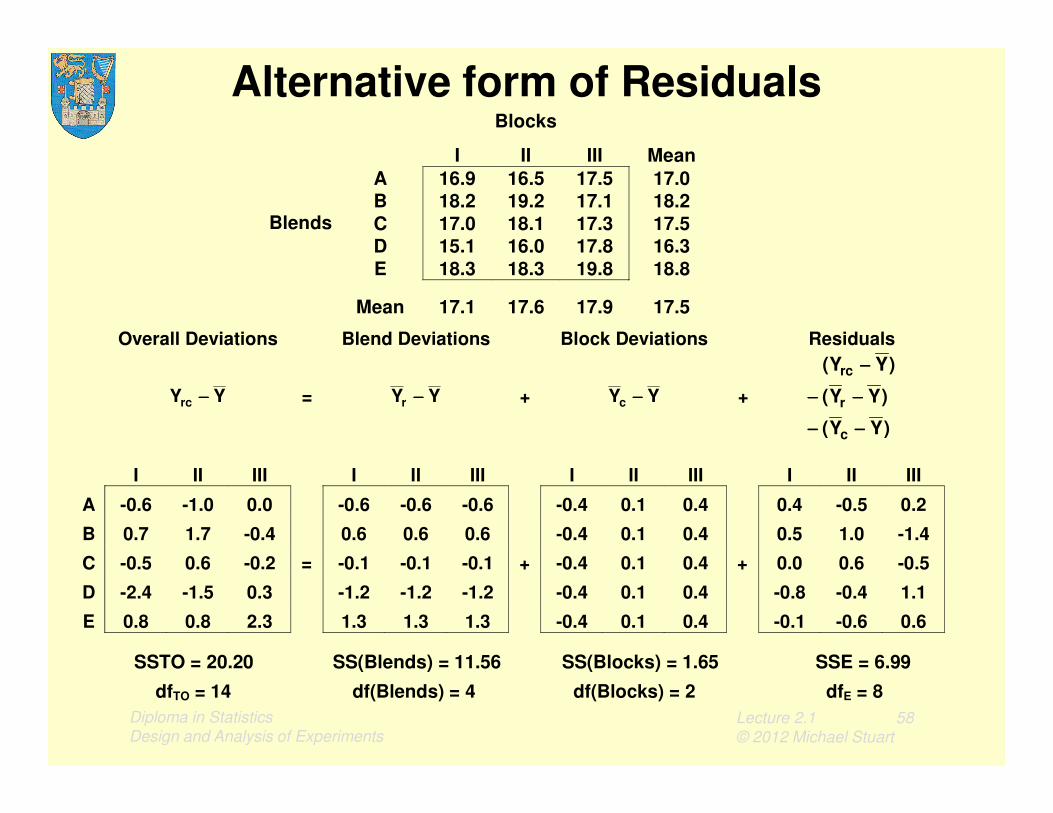
Overall Deviations Blend Deviations Block Deviations Residuals
YYrc −−−− = YYr −−−− + YYc −−−− + )YY(
)YY(
r
rc
−−−−−−−−
−−−−
Alternative form of Residuals Blocks
I II III Mean A 16.9 16.5 17.5 17.0 B 18.2 19.2 17.1 18.2 Blends C 17.0 18.1 17.3 17.5
D 15.1 16.0 17.8 16.3 E 18.3 18.3 19.8 18.8
Mean 17.1 17.6 17.9 17.5
Lecture 2.1 58
© 2012 Michael Stuart
rc r c
)YY( c
r
−−−−−−−−
I II III I II III I II III I II III
A -0.6 -1.0 0.0 -0.6 -0.6 -0.6 -0.4 0.1 0.4 0.4 -0.5 0.2
B 0.7 1.7 -0.4 0.6 0.6 0.6 -0.4 0.1 0.4 0.5 1.0 -1.4
C -0.5 0.6 -0.2 = -0.1 -0.1 -0.1 + -0.4 0.1 0.4 + 0.0 0.6 -0.5
D -2.4 -1.5 0.3 -1.2 -1.2 -1.2 -0.4 0.1 0.4 -0.8 -0.4 1.1
E 0.8 0.8 2.3 1.3 1.3 1.3 -0.4 0.1 0.4 -0.1 -0.6 0.6
SSTO = 20.20 SS(Blends) = 11.56 SS(Blocks) = 1.65 SSE = 6.99
dfTO = 14 df(Blends) = 4 df(Blocks) = 2 dfE = 8
Diploma in Statistics
Design and Analysis of Experiments

Exercise 2.1.1
• See Exercise 2_1_1.doc in the Exercises section of the module web page.
Lecture 2.1 59
© 2012 Michael Stuart
Diploma in Statistics
Design and Analysis of Experiments

Reading
EM §7.3.2, §7.4.2
DCM §§4-1, 5-1 to 5-3
DV §6.2, 6.4
Lecture 2.1 60
© 2012 Michael Stuart
Diploma in Statistics
Design and Analysis of Experiments