lecture # 15: review for final exam - iowa state universityhuhui/teaching/2010sx/aere... · title:...
TRANSCRIPT

Copyright Copyright ©© by Dr. Hui Hu @ Iowa State University. All Rights Reserved!by Dr. Hui Hu @ Iowa State University. All Rights Reserved!
HHui Huui HuDepartment of Aerospace Engineering, Iowa State University Department of Aerospace Engineering, Iowa State University
Ames, Iowa 50011, U.S.AAmes, Iowa 50011, U.S.A
Lecture # 15: Review for Final ExamLecture # 15: Review for Final Exam
AerEAerE 311L & AerE343L Lecture Notes311L & AerE343L Lecture Notes

Copyright Copyright ©© by Dr. Hui Hu @ Iowa State University. All Rights Reserved!by Dr. Hui Hu @ Iowa State University. All Rights Reserved!
AerE343L: AerE343L: Dimensional Analysis and SimilitudeDimensional Analysis and Similitude
Commonly used nonCommonly used non--dimensional parameters:dimensional parameters:
L
force tension surfaceforce inertial WeNumber,Weber
force inertialforce lcentrifugaStr Number, Strohal
forcelity compressibforce inertialM Number,Mach
forcegravity force inertial
lgFr Number, Froude
force viscousforce inertialRe number, Reynolds
force inertialforce pressureEu number,Euler
2
2
∝=
∝=
∝=
∝=
∝=
∝Δ
=
σρ
ϖ
μρ
ρ
lVVl
cV
V
VLVp
Similitude:Similitude:•• Geometric similarity: the model Geometric similarity: the model
have the same shape as the have the same shape as the prototype.prototype.
•• Kinematic similarity: condition Kinematic similarity: condition where the velocity ratio is a where the velocity ratio is a constant between all corresponding constant between all corresponding points in the flow field.points in the flow field.
•• Dynamic similarity: Forces which Dynamic similarity: Forces which act on corresponding masses in the act on corresponding masses in the model flow and prototype flow are model flow and prototype flow are in the same ratio through out the in the same ratio through out the entire flowentire flow

Copyright Copyright ©© by Dr. Hui Hu @ Iowa State University. All Rights Reserved!by Dr. Hui Hu @ Iowa State University. All Rights Reserved!
Measurement UncertaintiesMeasurement Uncertainties
•• ““ErrorError”” is the difference between the experimentallyis the difference between the experimentally--determined value and its true value; determined value and its true value; therefore, as error decreases, accuracy is said to increase. therefore, as error decreases, accuracy is said to increase.
•• Total error, Total error, UU, can be considered to be composed of two components:, can be considered to be composed of two components:–– a random (precision) component, a random (precision) component, –– a systematic (bias) component,a systematic (bias) component,–– We usually donWe usually don’’t know these exactly, so we estimate them with t know these exactly, so we estimate them with PP and and BB, respectively., respectively.
222 PBU +=
XTrue valueX=100
Bias errorBias error
precision errorprecision error
measured valueX=101
Both Bias and Precision ErrorsBoth Bias and Precision ErrorsReproducibilityReproducibility
Precision ErrorPrecision ErrorRepeatabilityRepeatability
truemtruemeasurederror AAEAAA −=⇒−=true
errorrelative A
AE =

Copyright Copyright ©© by Dr. Hui Hu @ Iowa State University. All Rights Reserved!by Dr. Hui Hu @ Iowa State University. All Rights Reserved!
Measurement UncertaintiesMeasurement Uncertainties
ρρ
ρ
pppV
BernoulliVpp
statictotal
statictotal
Δ=
−=
+=
2)(2
)(,21 2
222RRR PBU +=
Uncertainty in velocity V:Uncertainty in velocity V:
∑∑==
⎥⎦
⎤⎢⎣
⎡∂∂
=⎥⎦
⎤⎢⎣
⎡∂∂
=J
ii
iR
J
ii
iR P
XRPB
XRB
1
22
1
22 ;
∑=
=M
jii j
BB1
2
For a large number of samples (N>10) ii SP 2=
( )[ ] ( ) ⎥⎦
⎤⎢⎣
⎡=⎥
⎦
⎤⎢⎣
⎡−
−= ∑∑
==
N
kkii
N
kikii X
NXXX
NS
1
21
1
2 1;1
1

Copyright Copyright ©© by Dr. Hui Hu @ Iowa State University. All Rights Reserved!by Dr. Hui Hu @ Iowa State University. All Rights Reserved!
Pressure Measurement TechniquesPressure Measurement Techniques
•• Deadweight gauges:Deadweight gauges:•• ElasticElastic--element gauges:element gauges:•• Electrical Pressure transducers:Electrical Pressure transducers:•• Wall Pressure measurements Wall Pressure measurements
–– Remote connectionRemote connection–– Cavity mountingCavity mounting–– Flush mountingFlush mounting
•• Pressure Measurements inside Flow FieldPressure Measurements inside Flow Field::

Copyright Copyright ©© by Dr. Hui Hu @ Iowa State University. All Rights Reserved!by Dr. Hui Hu @ Iowa State University. All Rights Reserved!
ρ
ρ
)(2
)(,21
0
20
stat
stat
ppV
BernoulliVpp
−=
+=•• Advantage:Advantage:
•• SimpleSimple•• cheapcheap
•• Disadvantage:Disadvantage:•• averaged velocity onlyaveraged velocity only•• Single point measurementsSingle point measurements•• Low measurement accuracyLow measurement accuracy
Velocity measurement techniques Velocity measurement techniques –– PitotPitot ––Static ProbeStatic Probe

Copyright Copyright ©© by Dr. Hui Hu @ Iowa State University. All Rights Reserved!by Dr. Hui Hu @ Iowa State University. All Rights Reserved!
Velocity measurement techniques Velocity measurement techniques –– Hotwire ProbeHotwire Probe
•• Advantage:Advantage:•• High accuracyHigh accuracy•• High dynamic responseHigh dynamic response
•• Disadvantage:Disadvantage:•• Single point measurementsSingle point measurements•• Fragile, easy to brokeFragile, easy to broke•• Much more expansive Much more expansive
compared with compared with pitotpitot--static static probe.probe.
Flow Field
Current flow through wire
The rate of which heat is removed from the sensor is directly related to the velocity of the fluid flowing over the sensor
V
•• ConstantConstant--current anemometrycurrent anemometry•• ConstantConstant--temperature anemometrytemperature anemometry
),(2ww
w TVqRidt
dTmc &−=
Copyright Copyright ©© by Dr. Hui Hu @ Iowa State University. All Rights Reserved!by Dr. Hui Hu @ Iowa State University. All Rights Reserved!
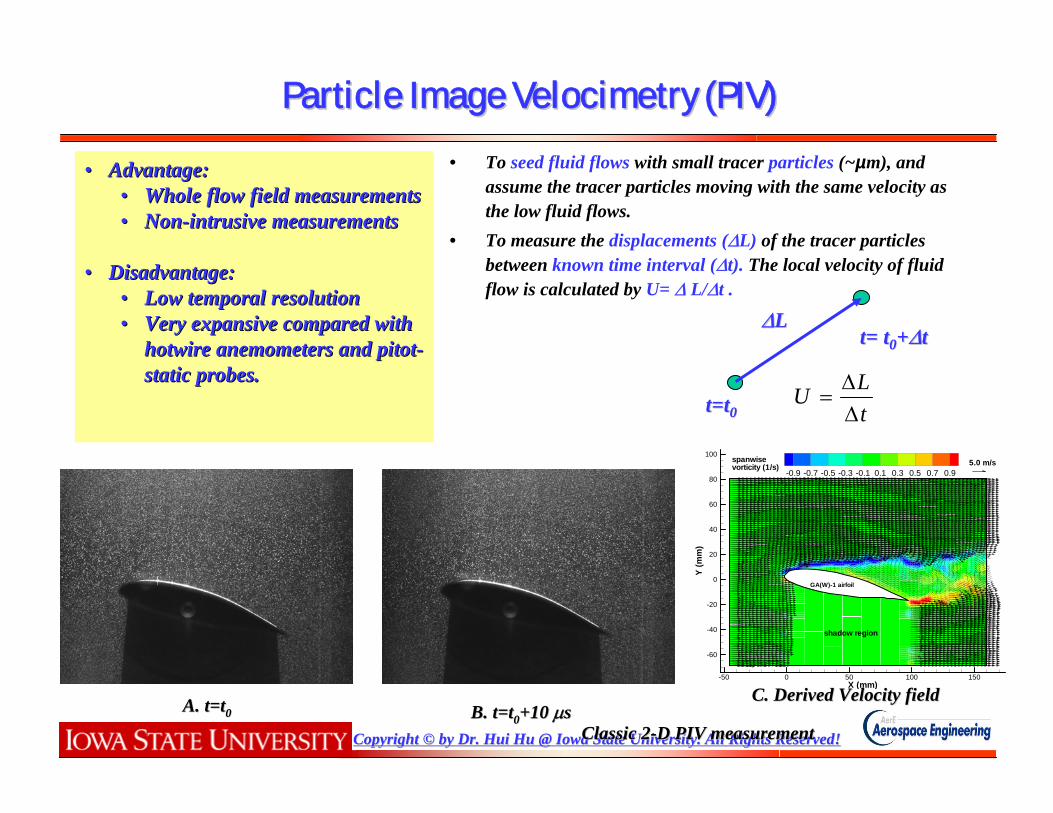
Particle Image Particle Image VelocimetryVelocimetry (PIV)(PIV)
• To seed fluid flows with small tracer particles (~µm), and assume the tracer particles moving with the same velocity as the low fluid flows.
• To measure the displacements (ΔL) of the tracer particles between known time interval (Δt). The local velocity of fluid flow is calculated by U= Δ L/Δt .
A. t=tA. t=t00 B. t=tB. t=t00+10 +10 μμssClassic 2Classic 2--D PIV measurementD PIV measurement
C. Derived Velocity fieldC. Derived Velocity fieldX (mm)
Y(m
m)
-50 0 50 100 150
-60
-40
-20
0
20
40
60
80
100
-0.9 -0.7 -0.5 -0.3 -0.1 0.1 0.3 0.5 0.7 0.95.0 m/sspanwise
vorticity (1/s)
shadow region
GA(W)-1 airfoil
t=tt=t00 tLUΔΔ
=
t= tt= t00++ΔΔttΔΔLL
•• Advantage:Advantage:•• Whole flow field measurementsWhole flow field measurements•• NonNon--intrusive measurementsintrusive measurements
•• Disadvantage:Disadvantage:•• Low temporal resolutionLow temporal resolution•• Very expansive compared with Very expansive compared with
hotwire anemometers and hotwire anemometers and pitotpitot--static probes.static probes.
Copyright Copyright ©© by Dr. Hui Hu @ Iowa State University. All Rights Reserved!by Dr. Hui Hu @ Iowa State University. All Rights Reserved!
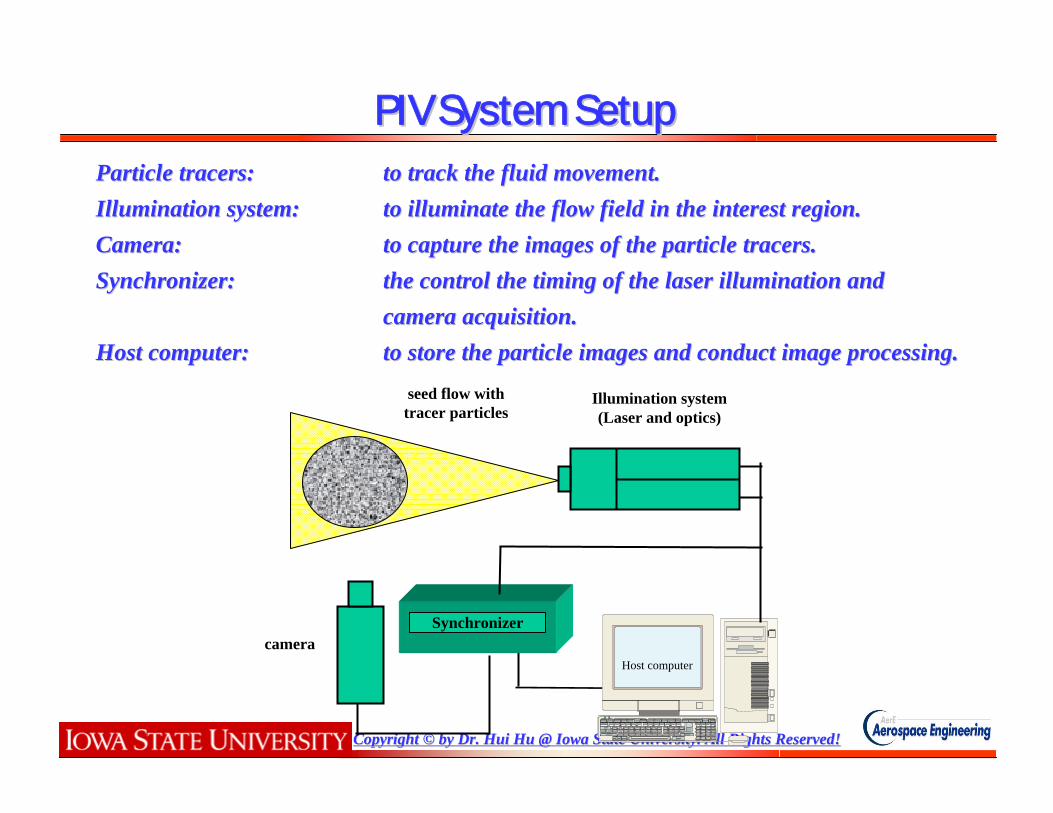
PIV System SetupPIV System Setup
Illumination system(Laser and optics)
cameraSynchronizer
seed flow withtracer particles
Host computer
Particle tracers: Particle tracers: to track the fluid movement. to track the fluid movement. Illumination system: Illumination system: to illuminate the flow field in the interest region.to illuminate the flow field in the interest region.Camera: Camera: to capture the images of the particle tracers.to capture the images of the particle tracers.Synchronizer: Synchronizer: the control the timing of the laser illumination and the control the timing of the laser illumination and
camera acquisition.camera acquisition.Host computer: Host computer: to store the particle images and conduct image processing. to store the particle images and conduct image processing.
Copyright Copyright ©© by Dr. Hui Hu @ Iowa State University. All Rights Reserved!by Dr. Hui Hu @ Iowa State University. All Rights Reserved!
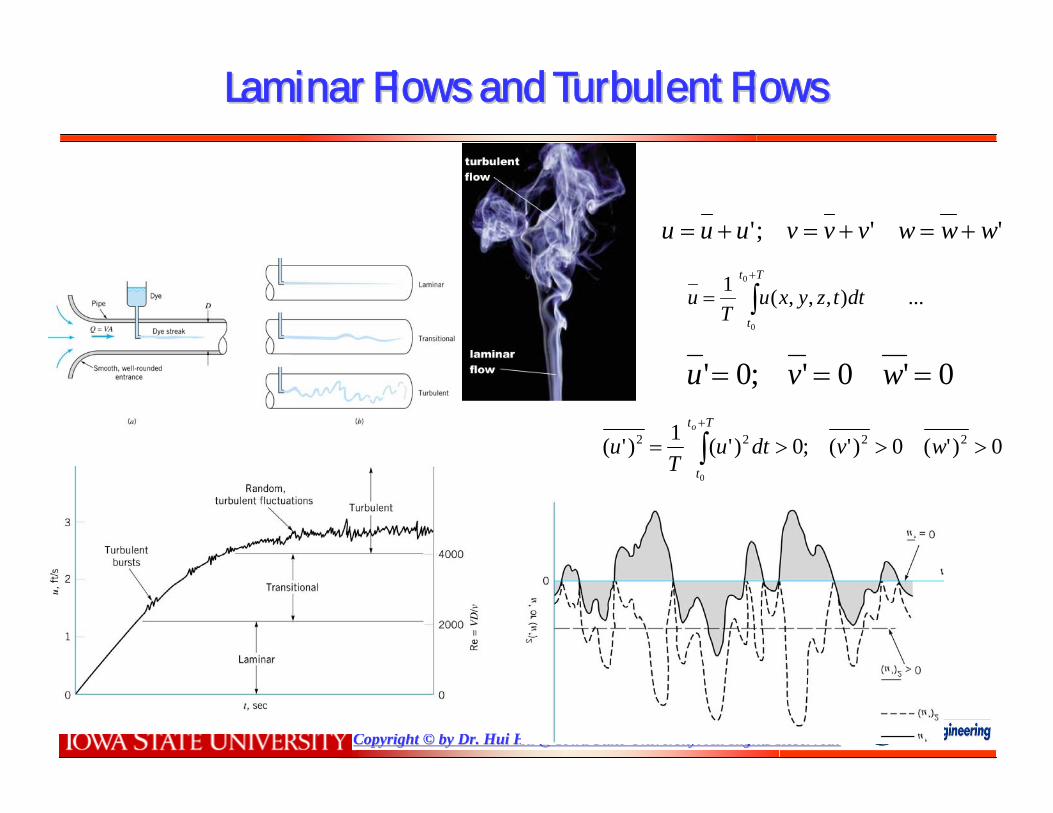
Laminar Flows and Turbulent FlowsLaminar Flows and Turbulent Flows
'';' wwwvvvuuu +=+=+=
...),,,(1 0
0
∫+
=Tt
t
dttzyxuT
u
0'0';0' === wvu
0)'(0)'(;0)'(1)'( 2222
0
>>>= ∫+
wvdtuT
uTt
t
o

Copyright Copyright ©© by Dr. Hui Hu @ Iowa State University. All Rights Reserved!by Dr. Hui Hu @ Iowa State University. All Rights Reserved!
Boundary Layer FlowBoundary Layer Flow
yy
∞==
Uu 99.0,yat δ
Displacement thickness:Displacement thickness:
Momentum thickness:Momentum thickness:

Copyright Copyright ©© by Dr. Hui Hu @ Iowa State University. All Rights Reserved!by Dr. Hui Hu @ Iowa State University. All Rights Reserved!
AerE343L Lab #1: Pressure Sensor Calibration andAerE343L Lab #1: Pressure Sensor Calibration andMeasurement Uncertainty AnalysisMeasurement Uncertainty Analysis
•• Task #1: Task #1: Pressure Sensor Calibration experimentPressure Sensor Calibration experiment–– A pressure sensor A pressure sensor –– SetraSetra pressure transducer with a range of +/pressure transducer with a range of +/-- 5 inH2O5 inH2O
•• It has two pressure ports: one for total pressure and one for sIt has two pressure ports: one for total pressure and one for static (or reference) pressure.tatic (or reference) pressure.
–– A computer data acquisition system to measure the output voltageA computer data acquisition system to measure the output voltage from the manometer.from the manometer.–– A manometer of known accuracy A manometer of known accuracy
•• MensorMensor Digital Pressure Gage, Model 2101, Range of +/Digital Pressure Gage, Model 2101, Range of +/-- 10 inH2O10 inH2O
–– A plenum and a hand pump to pressurize it. A plenum and a hand pump to pressurize it. –– Tubing to connect pressure sensors and plenumTubing to connect pressure sensors and plenum
•• Lab output:Lab output:–– Calibration curve Calibration curve –– Repeatability of your resultsRepeatability of your results–– Uncertainty of your measurementsUncertainty of your measurements
SetraSetra pressure pressure transducertransducer
(to be calibrated)(to be calibrated)
MensorMensor Digital Digital Pressure GagePressure Gage A computerA computer A plenumA plenum hand pumphand pump
tubingtubing

Copyright Copyright ©© by Dr. Hui Hu @ Iowa State University. All Rights Reserved!by Dr. Hui Hu @ Iowa State University. All Rights Reserved!
Lab#02: Lab#02: Airfoil Pressure Distribution Measurements and Calibration of a Small Wind Tunnel
NACA0012 airfoil with 32 pressure tabs
-3.0-2.5-2.0-1.5-1.0-0.5
00.51.01.52.02.53.0
0 1 2 3 4 5 6 7 8 9 10 11 12
X (inches)
Y (i
nche
s)
11
55 10101515
171720202525
3030
0.2
0.4
0.6
0.8
1.0
1.2
1.4
0 2 4 6 8 10 12 14 16 18 20
CL=2παExperimental data
Angle of Attack (degrees)
Lift
Coe
ffici
ent,
Cl
cV
LCl2
21
∞
=ρ
0
0.05
0.10
0.15
0.20
0.25
0.30
0.35
0.40
0 2 4 6 8 10 12 14 16 18 20
Experimental data
Angle of Attack (degrees)
Dra
g C
oeffi
cien
t, C
d
cV
DCd2
21
∞
=ρ

Copyright Copyright ©© by Dr. Hui Hu @ Iowa State University. All Rights Reserved!by Dr. Hui Hu @ Iowa State University. All Rights Reserved!
yy
xx80 mm80 mm
Pressure rake with 41 total pressure probesPressure rake with 41 total pressure probes(the distance between the probes d=2mm)(the distance between the probes d=2mm)
Lab 3: Airfoil Wake Measurements and Hotwire Anemometer CalibratLab 3: Airfoil Wake Measurements and Hotwire Anemometer Calibration ion
yy
xx∫
∫
∞∞
∞
∞∞
∞
∞
−=⇒
−==
2
2
22
2
2
)])(1()([221
)])(1()([
21
dyU
yUU
yUC
C
CU
dAU
yUU
yUU
CU
DC
D
D
ρ
ρ
ρ

Copyright Copyright ©© by Dr. Hui Hu @ Iowa State University. All Rights Reserved!by Dr. Hui Hu @ Iowa State University. All Rights Reserved!
AerE343L #4: Hot wire measurements in the wake of an airfoilAerE343L #4: Hot wire measurements in the wake of an airfoil
yy
xx
80 mm80 mm
Pressure rake with 41 total pressure probes(the distance between the probes d=2mm)
Hotwire probe
Test conditions: Velocity: V=15 m/sAngle of attack: AOA=0, and 12 deg.Date sampling rate: f=1000HzNumber of samples: 10,000 (10s in time)No. of points: 20~25 pointsGap between points: ~0.2 inches
Lab#3Lab#3
Lab#4Lab#4
Copyright Copyright ©© by Dr. Hui Hu @ Iowa State University. All Rights Reserved!by Dr. Hui Hu @ Iowa State University. All Rights Reserved!
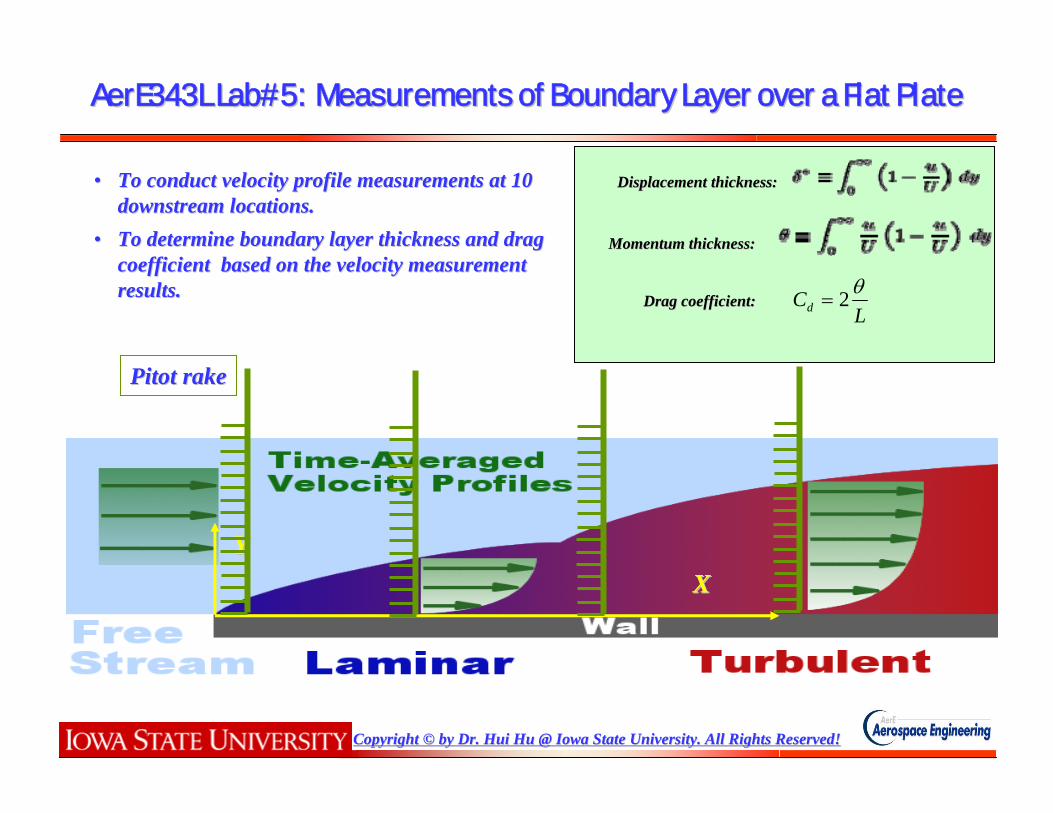
AerE343L Lab#5: Measurements of Boundary Layer over a Flat PlatAerE343L Lab#5: Measurements of Boundary Layer over a Flat Platee
XXYY
PitotPitot rakerake
Displacement thickness:Displacement thickness:
Momentum thickness:Momentum thickness:
•• To conduct velocity profile measurements at 10 To conduct velocity profile measurements at 10 downstream locations.downstream locations.
•• To determine boundary layer thickness and drag To determine boundary layer thickness and drag coefficient based on the velocity measurement coefficient based on the velocity measurement results.results.
LCd
θ2=Drag coefficient: Drag coefficient:
Copyright Copyright ©© by Dr. Hui Hu @ Iowa State University. All Rights Reserved!by Dr. Hui Hu @ Iowa State University. All Rights Reserved!
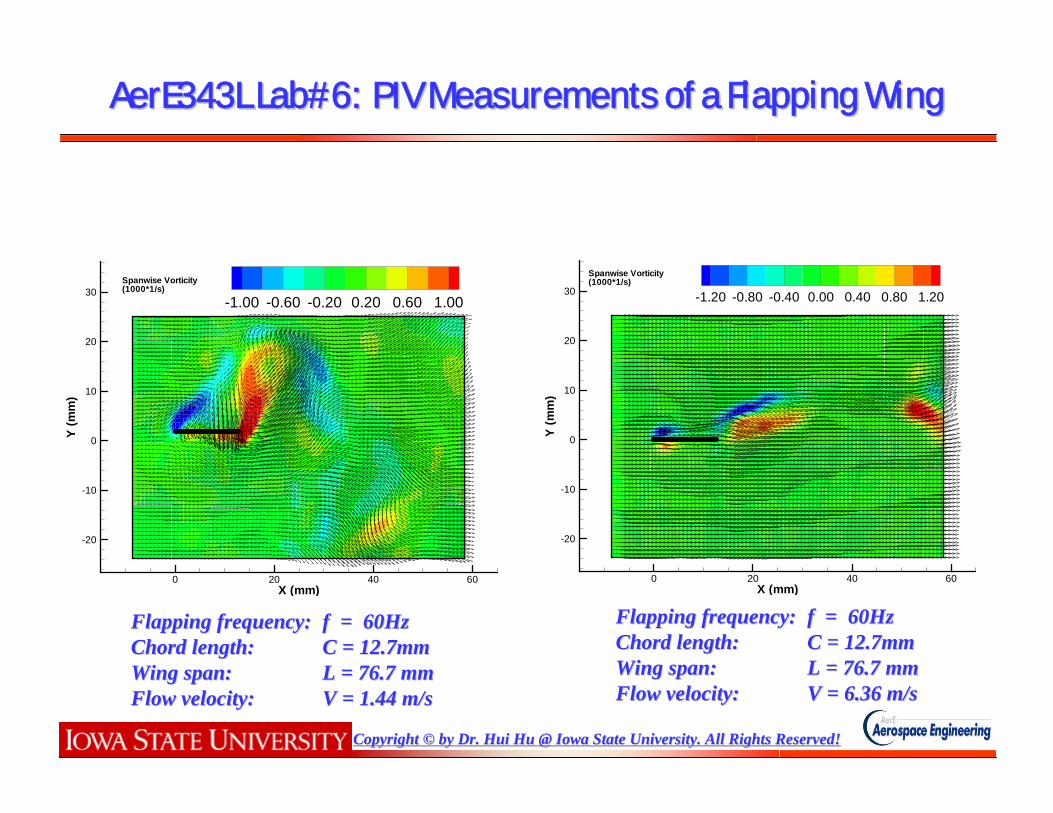
AerE343L Lab#6: PIV Measurements of a Flapping WingAerE343L Lab#6: PIV Measurements of a Flapping Wing
X (mm)
Y(m
m)
0 20 40 60
-20
-10
0
10
20
30-1.00 -0.60 -0.20 0.20 0.60 1.00
Spanwise Vorticity(1000*1/s)
X (mm)
Y(m
m)
0 20 40 60
-20
-10
0
10
20
30 -1.20 -0.80 -0.40 0.00 0.40 0.80 1.20
Spanwise Vorticity(1000*1/s)
Flapping frequency: Flapping frequency: f = 60Hzf = 60HzChord length: Chord length: C = 12.7mmC = 12.7mmWing span: Wing span: L = 76.7 mmL = 76.7 mmFlow velocity: Flow velocity: V = 6.36 V = 6.36 m/sm/s
Flapping frequency: Flapping frequency: f = 60Hzf = 60HzChord length: Chord length: C = 12.7mmC = 12.7mmWing span: Wing span: L = 76.7 mmL = 76.7 mmFlow velocity: Flow velocity: V = 1.44 V = 1.44 m/sm/s

Copyright Copyright ©© by Dr. Hui Hu @ Iowa State University. All Rights Reserved!by Dr. Hui Hu @ Iowa State University. All Rights Reserved!
AerE311L: The nature of lightAerE311L: The nature of light
•• Light as electromagnetic waves.Light as electromagnetic waves.•• Light as photons.Light as photons.•• Color of lightColor of light•• Index of reflectionIndex of reflection
1/ 0 >==λλvcn
sm /3x10c 80 ≈

Copyright Copyright ©© by Dr. Hui Hu @ Iowa State University. All Rights Reserved!by Dr. Hui Hu @ Iowa State University. All Rights Reserved!
Shadowgraph and Shadowgraph and SchlierenSchlieren techniquetechnique
•• Index of refraction:Index of refraction:
•• Depend on variation of index of refraction Depend on variation of index of refraction in a transparent medium and the resulting in a transparent medium and the resulting effect on a light beam passing through the effect on a light beam passing through the test sectiontest section
•• Shadowgraph systems: are used to indicate Shadowgraph systems: are used to indicate the variation of the second derivatives the variation of the second derivatives (normal to the light beam) of the index of (normal to the light beam) of the index of refraction.refraction.
•• SchlierenSchlieren Systems: are used to indicate Systems: are used to indicate the variation of the first derivative of the the variation of the first derivative of the index of refraction index of refraction
1/ 0 >==λλvcn
shadowgraph depicting the flow generated by a bullet shadowgraph depicting the flow generated by a bullet at supersonic speeds. (by Andrew at supersonic speeds. (by Andrew DavidhazyDavidhazy ))
SchlierenSchlieren images of the muzzle blast and images of the muzzle blast and supersonic bullet from firing a .30supersonic bullet from firing a .30--06 caliber 06 caliber highhigh--powered rifle (by Gary S. Settlespowered rifle (by Gary S. Settles ))

Copyright Copyright ©© by Dr. Hui Hu @ Iowa State University. All Rights Reserved!by Dr. Hui Hu @ Iowa State University. All Rights Reserved!
Visualization of a Visualization of a SchockwavesSchockwaves using using SchlierenSchlieren techniquetechnique
Before turning on the Supersonic jetBefore turning on the Supersonic jet
After turning on the Supersonic jetAfter turning on the Supersonic jet

Copyright Copyright ©© by Dr. Hui Hu @ Iowa State University. All Rights Reserved!by Dr. Hui Hu @ Iowa State University. All Rights Reserved!
Schlieren vs. ShadowgraphSchlieren vs. Shadowgraph
ShadowgraphShadowgraph
•• Displays a mere shadowDisplays a mere shadow•• Shows light ray displacementShows light ray displacement•• Contrast level responds toContrast level responds to
•• No knife edge usedNo knife edge used
SchlierenSchlieren
•• Displays a focused imageDisplays a focused image•• Shows ray refraction angle, Shows ray refraction angle, εε•• Contrast level responds toContrast level responds to
•• Knife edge used for cutoffKnife edge used for cutoffyn∂∂
2
2
yn
∂∂
Copyright Copyright ©© by Dr. Hui Hu @ Iowa State University. All Rights Reserved!by Dr. Hui Hu @ Iowa State University. All Rights Reserved!
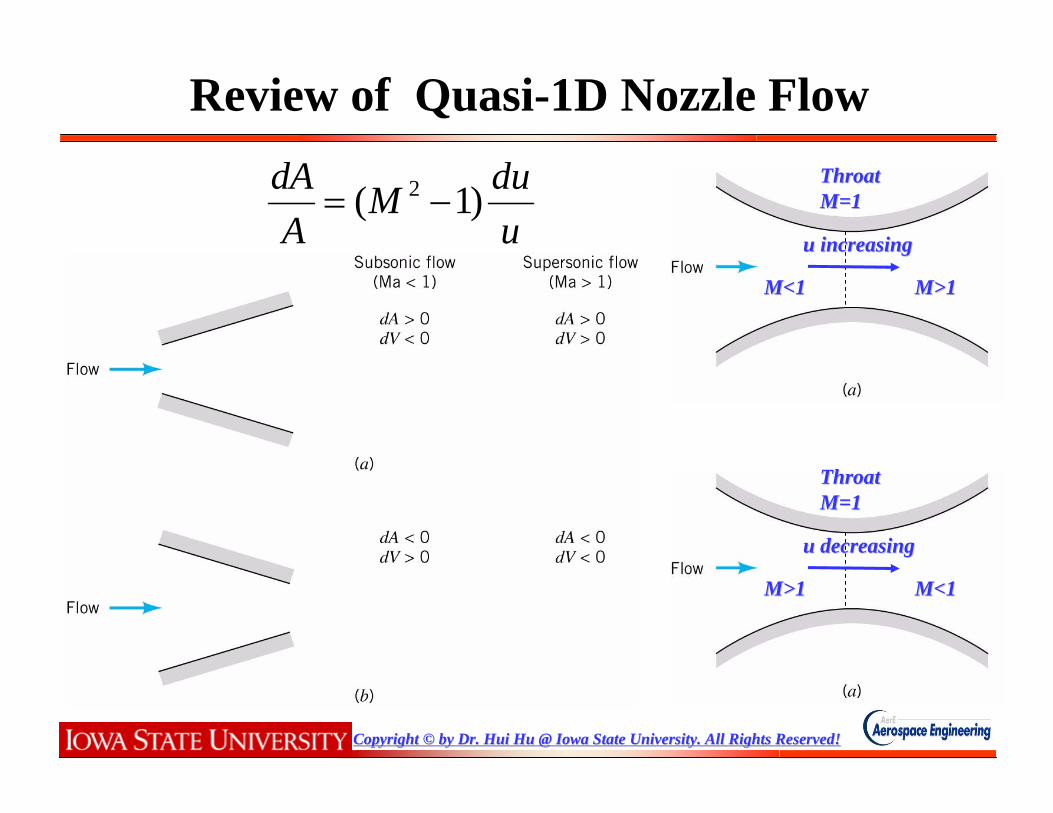
Review of Quasi-1D Nozzle Flow
uduM
AdA )1( 2 −=
M<1M<1 M>1M>1
Throat Throat M=1M=1
u increasingu increasing
M>1M>1 M<1M<1
Throat Throat M=1M=1
u decreasingu decreasing

Copyright Copyright ©© by Dr. Hui Hu @ Iowa State University. All Rights Reserved!by Dr. Hui Hu @ Iowa State University. All Rights Reserved!
1st, 21st, 2ndnd and 3and 3rdrd critic conditionscritic conditions
1st critic 1st critic conditioncondition
2st critic 2st critic conditioncondition
3st critic 3st critic conditioncondition
P 0 in
crea
sing
P 0 in
crea
sing

Copyright Copyright ©© by Dr. Hui Hu @ Iowa State University. All Rights Reserved!by Dr. Hui Hu @ Iowa State University. All Rights Reserved!
AerE311L Lab#1: Visualization of Shockwaves using AerE311L Lab#1: Visualization of Shockwaves using SchlierenSchlierentechniquetechnique
UnderUnder--expanded expanded
flowflow
Flow close to Flow close to 33rdrd criticalcritical
OverOver--expanded expanded
flowflow
22ndnd critical critical –– shock shock is at nozzle exitis at nozzle exit
11stst critical critical –– shock shock is almost at the is almost at the nozzle throat.nozzle throat.

Copyright Copyright ©© by Dr. Hui Hu @ Iowa State University. All Rights Reserved!by Dr. Hui Hu @ Iowa State University. All Rights Reserved!
AerE311L Lab#2: Set Up AerE311L Lab#2: Set Up SchlierenSchlieren and Shadowgraph System to and Shadowgraph System to Visualize a Thermal PlumeVisualize a Thermal Plume
Point SourcePoint Source
Candle plumeCandle plume

Copyright Copyright ©© by Dr. Hui Hu @ Iowa State University. All Rights Reserved!by Dr. Hui Hu @ Iowa State University. All Rights Reserved!
Tank with compressed airTank with compressed air Test sectionTest section
AerE311L Lab#3: Pressure Measurements in a de Laval NozzleAerE311L Lab#3: Pressure Measurements in a de Laval Nozzle
Tap No. Distance downstream of throat (inches) Area (Sq. inches)1 -4.00 0.8002 -1.50 0.5293 -0.30 0.4804 -0.18 0.4785 0.00 0.4766 0.15 0.4977 0.30 0.5188 0.45 0.5399 0.60 0.56010 0.75 0.58111 0.90 0.59912 1.05 0.61613 1.20 0.62714 1.35 0.63215 1.45 0.634

Copyright Copyright ©© by Dr. Hui Hu @ Iowa State University. All Rights Reserved!by Dr. Hui Hu @ Iowa State University. All Rights Reserved!
AerE343L: Final Exam
• Open book• Four problems (25 points each)• ~ 30 minutes
Copyright Copyright ©© by Dr. Hui Hu @ Iowa State University. All Rights Reserved!by Dr. Hui Hu @ Iowa State University. All Rights Reserved!
AerE311L: Final Exam
• Open book• 20 multiple-choice problems• ~ 15 minutes