lecture 13: factorial anova 1 laura mcavinue school of psychology trinity college dublin
Post on 22-Dec-2015
214 views
TRANSCRIPT
Lecture 13:Factorial ANOVA 1
Laura McAvinue
School of Psychology
Trinity College Dublin

Analysis of Variance
One way ANOVA Factorial ANOVA
One Independent Variable
More than One Independent Variable
Two way
Three way
Four way
Between
subjects
Repeated
measures /
Within
subjects
Different participants
Same participants

Factorial ANOVA
• Factor– Another word for an independent variable in ANOVA
• Factorial Design– Design in which there are two or more independent
variables or factors
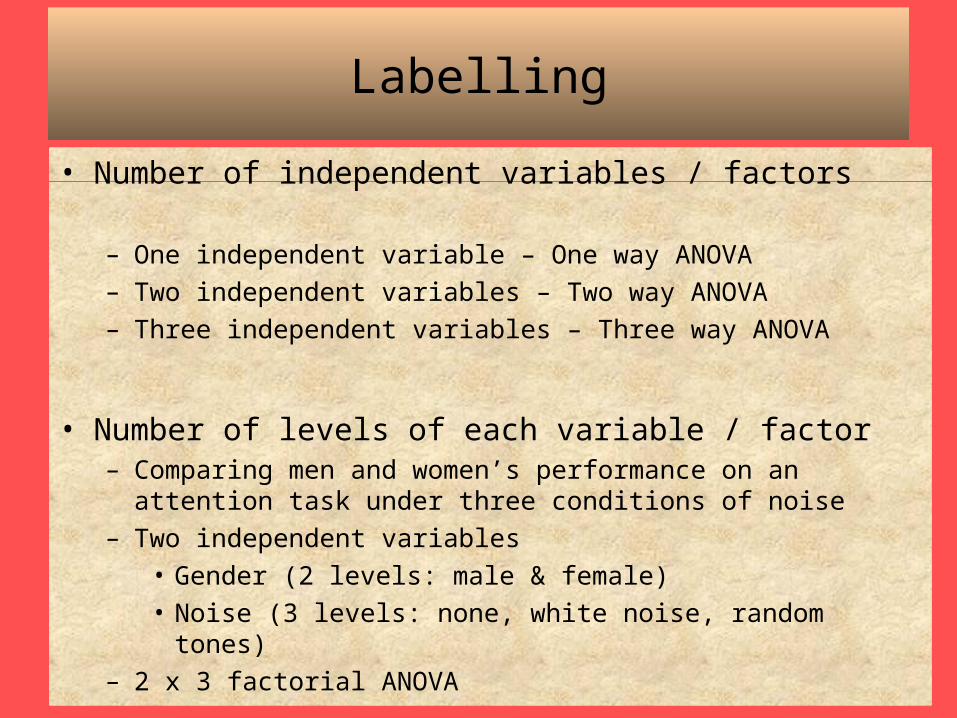
Labelling
• Number of independent variables / factors
– One independent variable – One way ANOVA– Two independent variables – Two way ANOVA– Three independent variables – Three way ANOVA
• Number of levels of each variable / factor– Comparing men and women’s performance on an attention task
under three conditions of noise– Two independent variables
• Gender (2 levels: male & female)• Noise (3 levels: none, white noise, random tones)
– 2 x 3 factorial ANOVA

Factorial ANOVA
• Allows you to examine two things…
– The main effect of each independent variable, when controlling for the other variable
– The interaction between the two variables

Research Example
• We would like to examine the effectiveness of three kinds of therapy (CBT, psychoanalytic, drug) on depressive symptoms displayed by men & women
• What is our dependent variable?– Number of depressive symptoms
• How many independent variables do we have?– 2

Research Example
• We would like to examine the effectiveness of three kinds of therapy (CBT, psychoanalytic, drug) on depressive symptoms displayed by men & women
• What are the independent variables?– Gender & Therapy
• How many levels do they have?– Gender: 2 levels (Male/Female)– Therapy: 3 levels (CBT, Psychoanalytic, Drug)
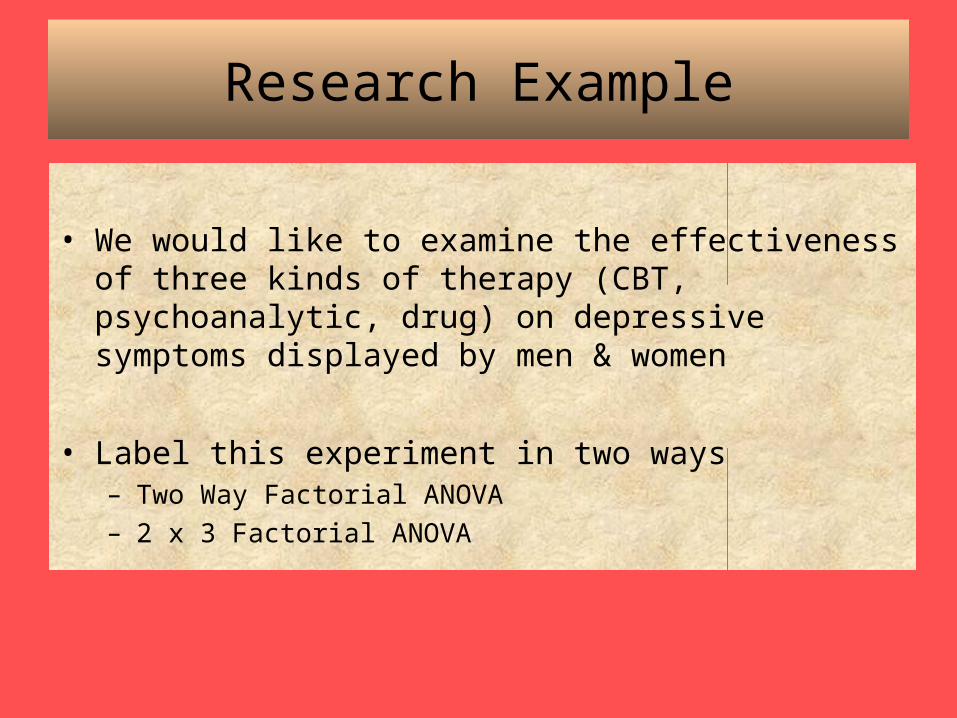
Research Example
• We would like to examine the effectiveness of three kinds of therapy (CBT, psychoanalytic, drug) on depressive symptoms displayed by men & women
• Label this experiment in two ways– Two Way Factorial ANOVA– 2 x 3 Factorial ANOVA
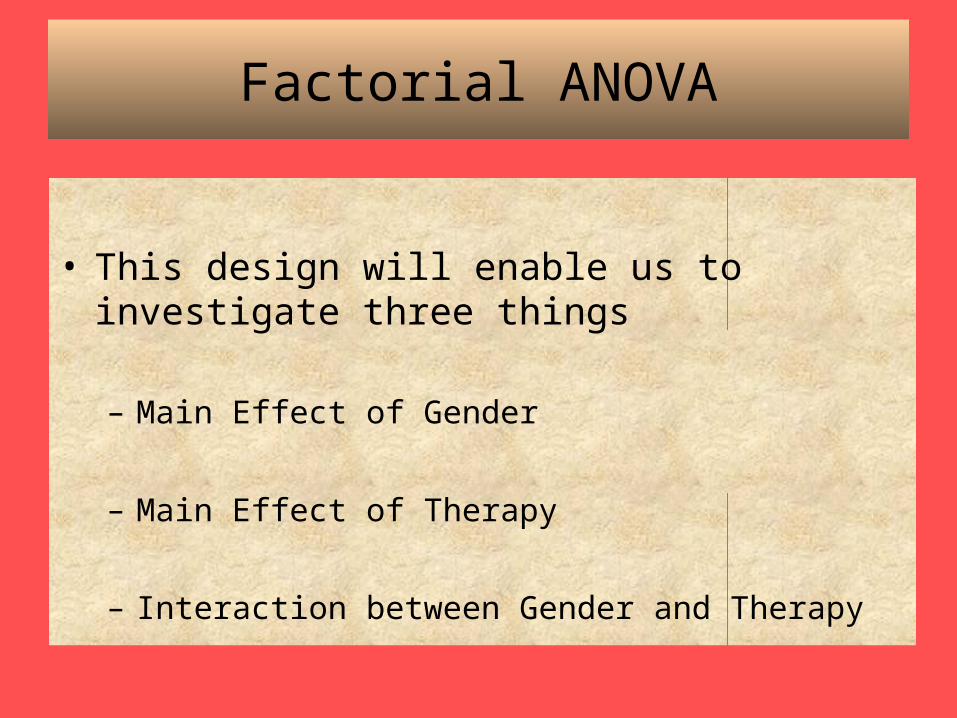
Factorial ANOVA
• This design will enable us to investigate three things
– Main Effect of Gender
– Main Effect of Therapy
– Interaction between Gender and Therapy
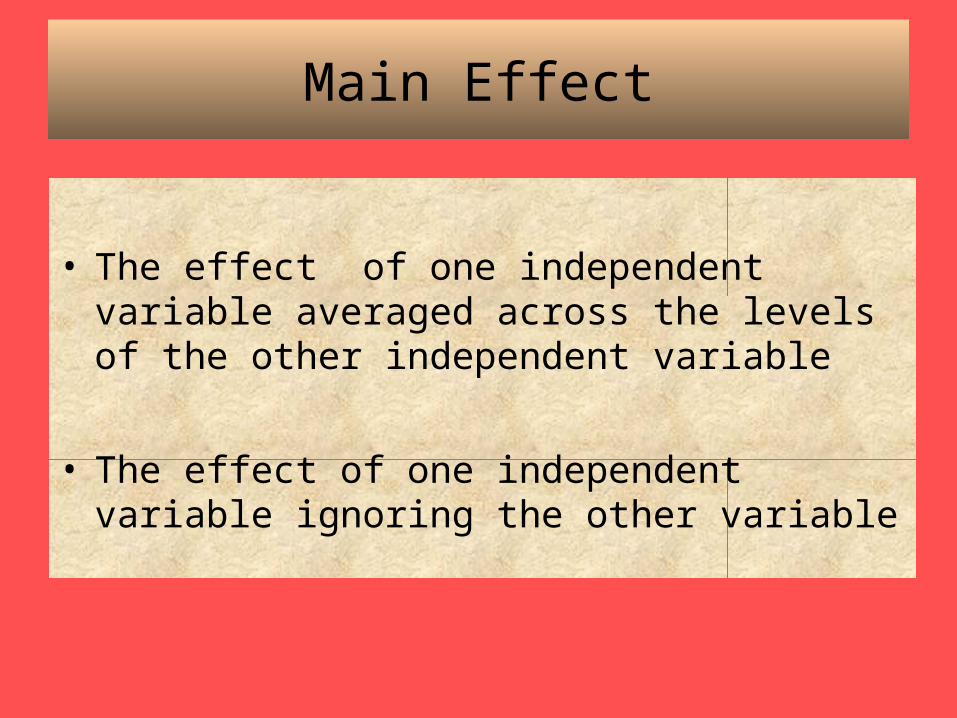
Main Effect
• The effect of one independent variable averaged across the levels of the other independent variable
• The effect of one independent variable ignoring the other variable

Main Effect of Gender
• There is a significant difference between men and women’s no. of depressive symptoms across all therapy groups– Men and women’s depressive symptoms differ, irrespective of
the type of therapy they got– The type of therapy does not influence the effect of gender
• E.g. Men have a significantly lower number of depressive symptoms than women overall, across all three therapy conditions– Ho: There is no effect of gender
• Mean of males = Mean of females
– Halt: There is a main effect of gender
• Mean of males ≠ Mean of females

Main Effect of Therapy
• The kind of therapy administered significantly affected the number of depressive symptoms, irrespective of the gender of the client
• Ho: There is no significant effect of therapy– Mean CBT = Mean Psychoanalytic = Mean Drug
• Halt: At least one mean for therapy is different from the other two
• E.g. CBT significantly reduced the number of depressive symptoms for both men and women

Interaction
• Factorial Design– Enables you to pair each level of each variable with each level of
the other variable / variables
• Interaction– Combined effect IV1 & IV2 on the DV
– Means that the effects of one independent variable depend on the level of the other independent variable
• Simple Effect– The effect of one independent variable at one level of another
variable
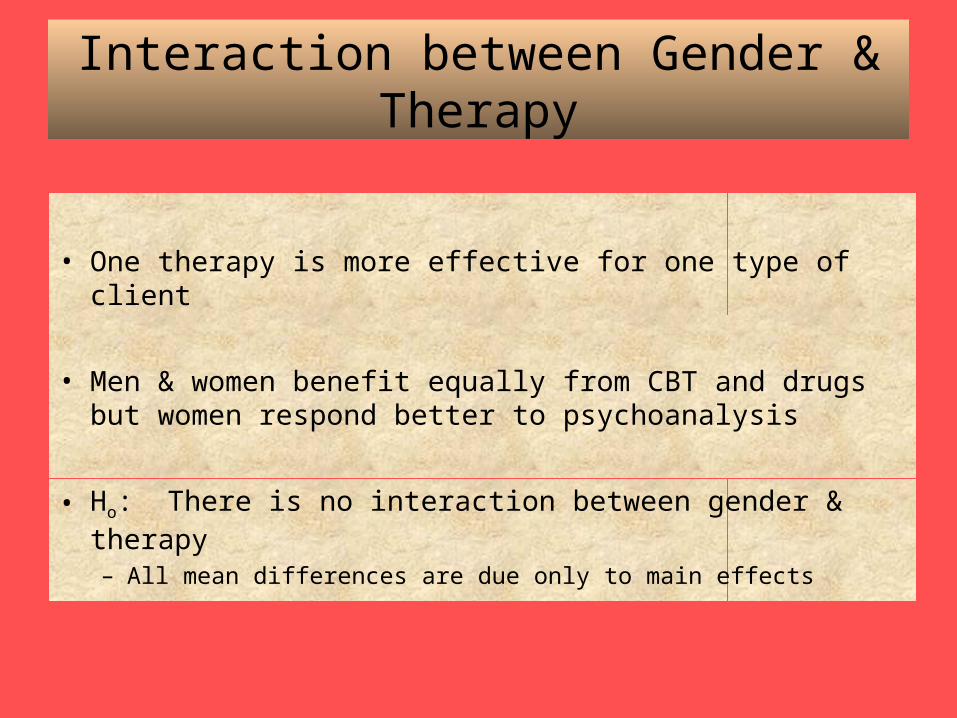
Interaction between Gender & Therapy
• One therapy is more effective for one type of client
• Men & women benefit equally from CBT and drugs but women respond better to psychoanalysis
• Ho: There is no interaction between gender & therapy– All mean differences are due only to main effects

CBT Psychoanalytic
Drug
Males 10 16 24
8 18 26
6 20 28
Females 22 6 20
20 4 22
18 8 24
Type of TherapyG
ende
r

CBT Psychoanalytic
Drug
Males 10 16 24
8 18 26
6 20 28
8 18 26 17.33
Females 22 6 20
20 4 22
18 8 24
20 6 22 16
16.67
Is there a main effect of Gender?
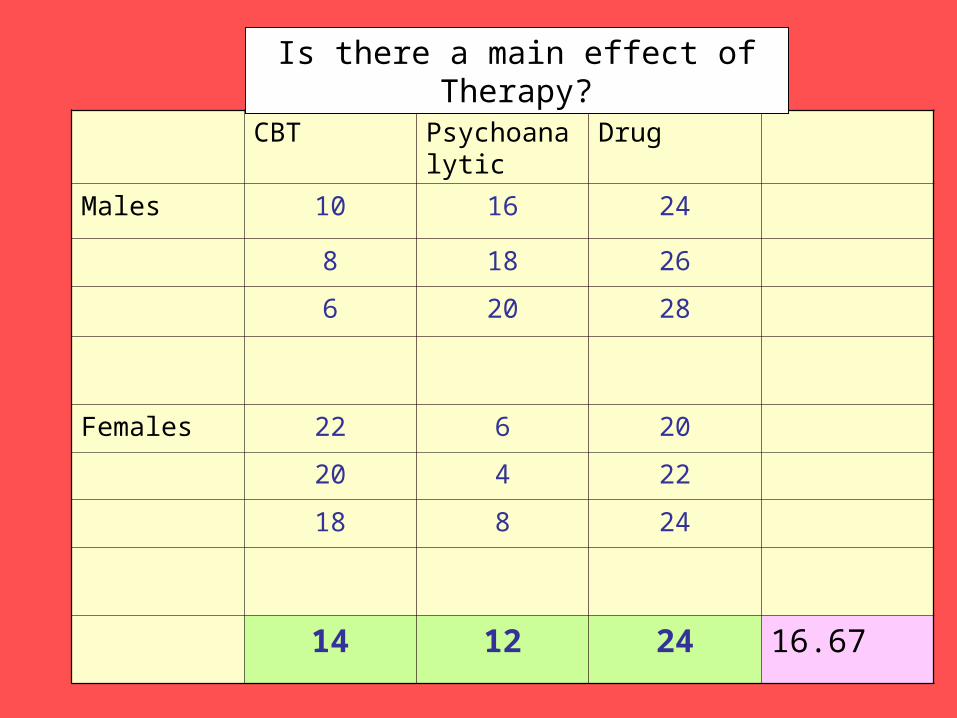
CBT Psychoanalytic
Drug
Males 10 16 24
8 18 26
6 20 28
Females 22 6 20
20 4 22
18 8 24
14 12 24 16.67
Is there a main effect of Therapy?

CBT Psychoanalytic
Drug
Males 10 16 24
8 18 26
6 20 28
8 18 26
Females 22 6 20
20 4 22
18 8 24
20 6 22
16.67
Is there an Interaction between Gender & Therapy?
Examine the pattern of means…

Line graph of the six cell means
0
5
10
15
20
25
30
CBT Psycho-analytic
Drug
male
female
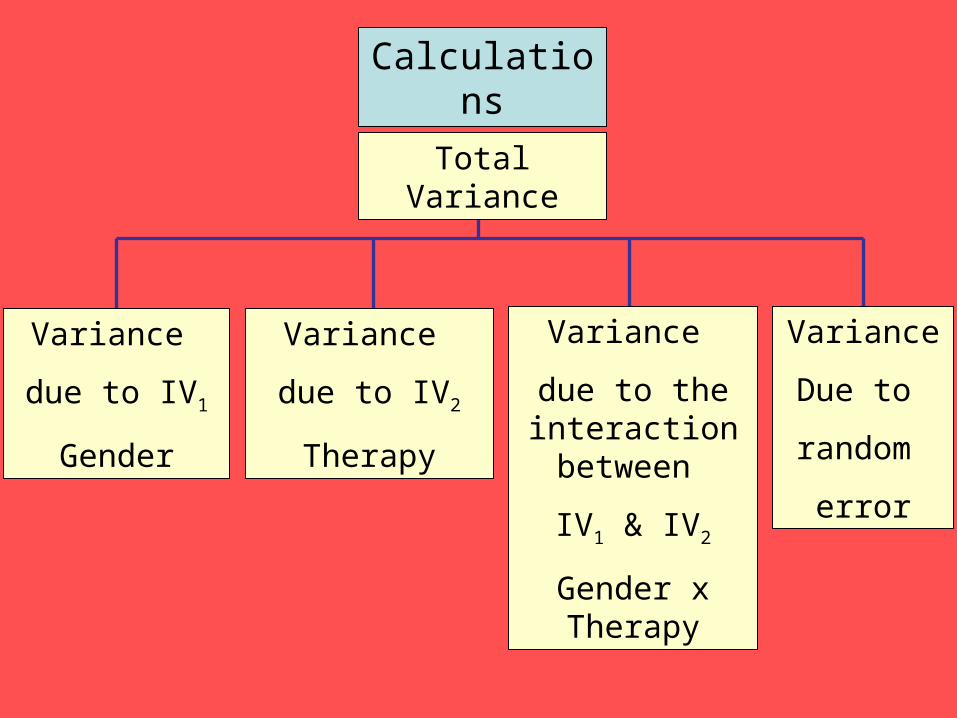
Calculations
Total Variance
Variance
due to IV1
Gender
Variance
due to IV2
Therapy
Variance
due to the interaction between
IV1 & IV2
Gender x Therapy
Variance
Due to
random
error

Three F Ratios
Compare the variance due to the main effects and the interaction to the variance due to random error
Variance due to Gender
Variance due to Random Error
Variance due to Therapy
Variance due to Random Error
Variance due to Gender x Therapy
Variance due to Random Error

CBT Psychoanalytic
Drug
Males 10 16 24
8 18 26
6 20 28
Females 22 6 20
20 4 22
18 8 24 16.67
Total Variance
SStotal∑ (xij - Grand Mean )2
1000
CBT Psychoanalytic
Drug
Males 10 16 24
8 18 26
6 20 28
17.33Females 22 6 20
20 4 22
18 8 24
16
16.67
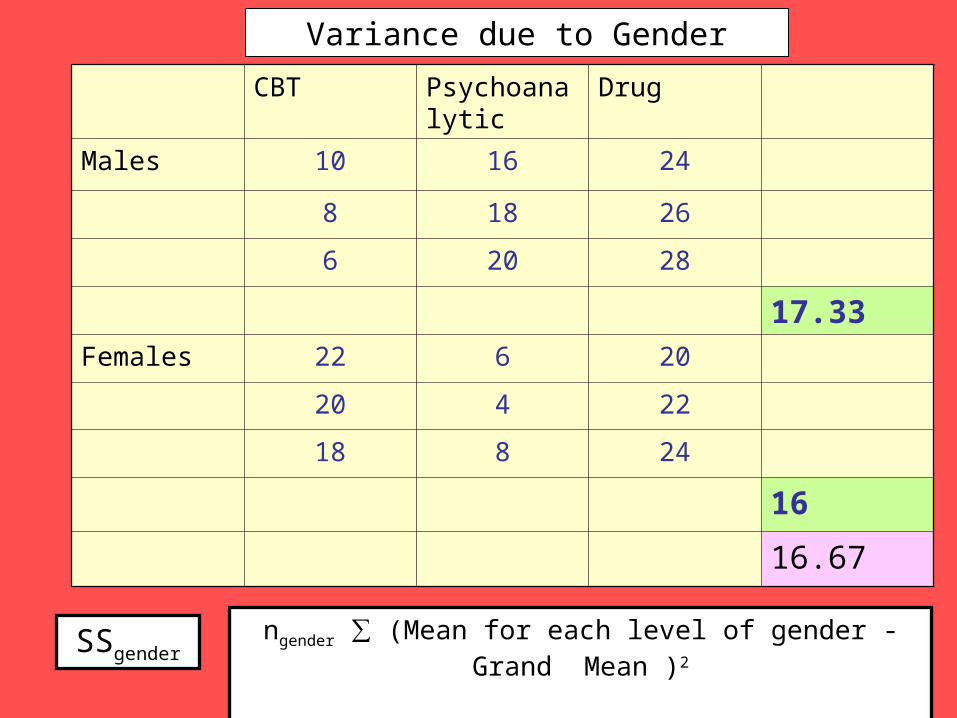
Variance due to Gender
SSgenderngender ∑ (Mean for each level of gender - Grand Mean )2
CBT Psychoanalytic
Drug
Males 10 16 24
8 18 26
6 20 28
17.33Females 22 6 20
20 4 22
18 8 24
16
16.67
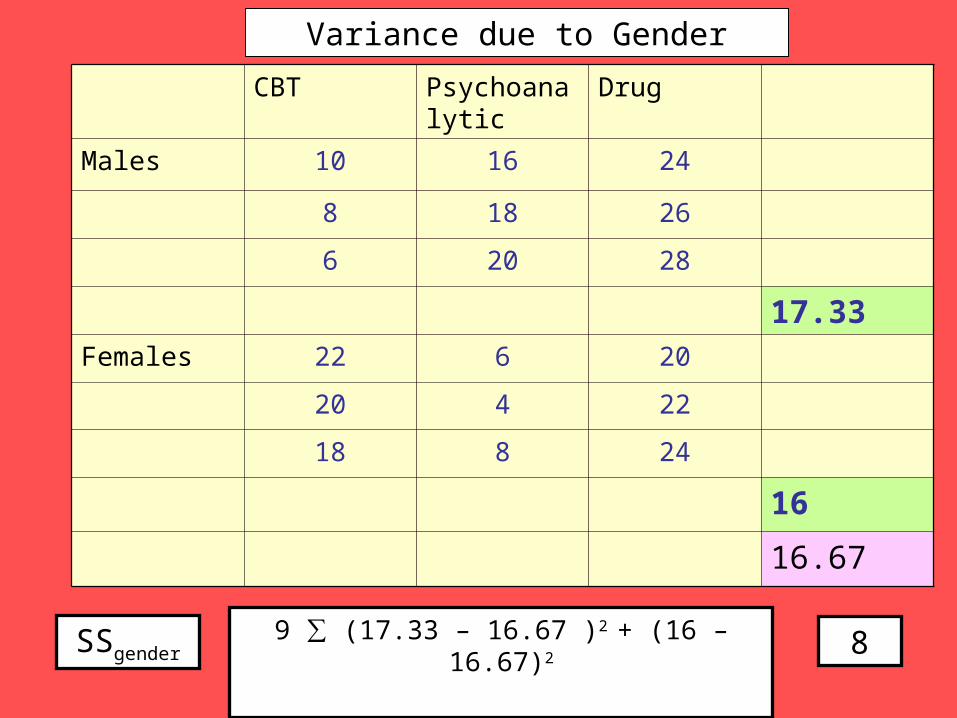
Variance due to Gender
SSgender9 ∑ (17.33 – 16.67 )2 + (16 – 16.67)2
8

CBT Psychoanalytic
Drug
Males 10 16 24
8 18 26
6 20 28
Females 22 6 20
20 4 22
18 8 24
14 12 24 16.67
Variance due to Therapy
SStherapyntherapy ∑ (Mean for each level of therapy - Grand Mean )2
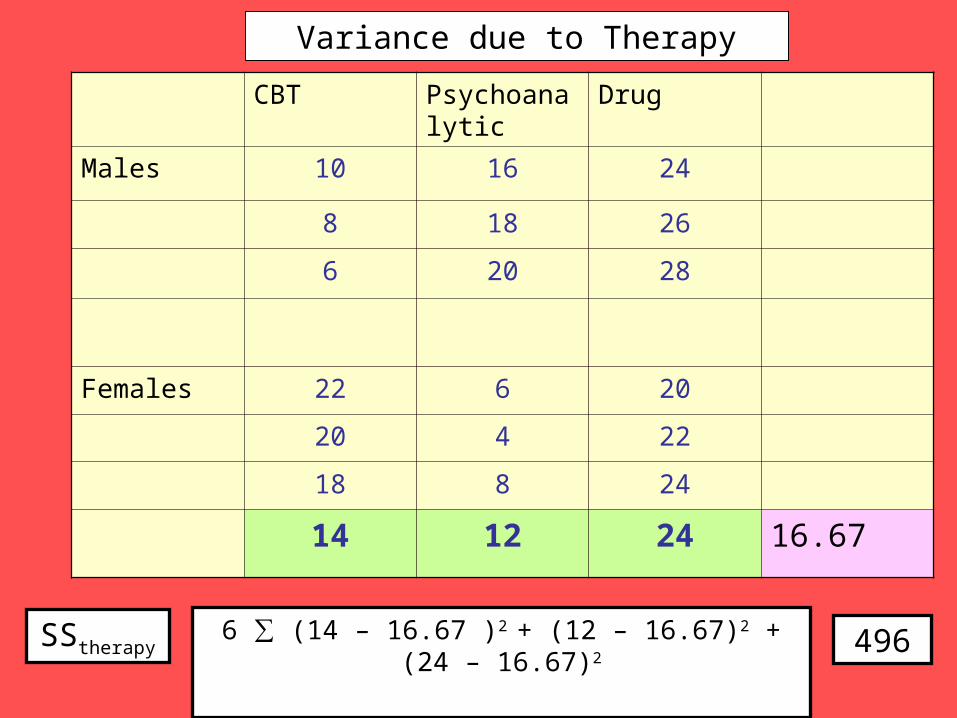
CBT Psychoanalytic
Drug
Males 10 16 24
8 18 26
6 20 28
Females 22 6 20
20 4 22
18 8 24
14 12 24 16.67
Variance due to Therapy
SStherapy6 ∑ (14 – 16.67 )2 + (12 – 16.67)2 + (24 – 16.67)2
496
CBT Psychoanalytic
Drug
Males 10 16 24
8 18 26
6 20 28
8 18 26
Females 22 6 20
20 4 22
18 8 24
20 6 22 16.67
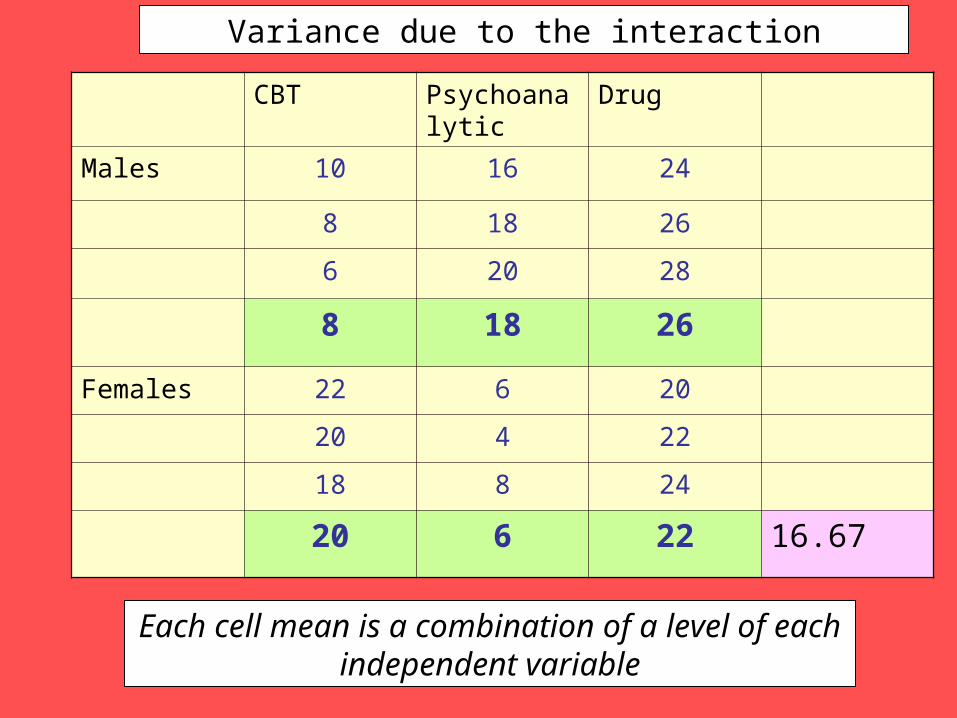
Variance due to the interaction
Each cell mean is a combination of a level of each independent variable

Variance due to the Interaction
• SScells
– The sum of squared deviations of each cell mean from the grand mean
– The variance of the cell means– A measure of how much the cell means differ
• Cell means can differ due to…– Level of Gender– Level of Therapy– Interaction between Gender & Therapy

Variance due to the Interaction
• SScells = SSgender + SStherapy + SSgender x therapy
• SSgender x therapy = SScells – SSgender – SStherapy

CBT Psychoanalytic
Drug
Males 10 16 24
8 18 26
6 20 28
8 18 26
Females 22 6 20
20 4 22
18 8 24
20 6 22 16.67
Variance due to the interaction
No. of participants in each cell ∑ (Each cell mean - Grand Mean )2
SScells

CBT Psychoanalytic
Drug
Males 10 16 24
8 18 26
6 20 28
8 18 26
Females 22 6 20
20 4 22
18 8 24
20 6 22 16.67
Variance due to the interaction
3 ∑ (8 – 16.67 )2 + (18 – 16.67)2 + (26 – 16.67)2 + (20 – 16.67)2 + (6 – 16.67)2 + (22 – 16.67)2
952SScells

Variance due to the Interaction
• SSgender x therapy = SScells – SSgender – SStherapy
• SSgender x therapy = 952 – 8 – 496
• SSgender x therapy = 448

Variance due to Random Error
• Two Methods…
• Directly– SSerror = ∑(each score in each cell – mean of that cell)2
– 48
• Indirectly– SStotal = [SSgender + SStherapy + SSgender x therapy ] + SSerror
– SStotal = [SScells ] + SSerror
– SSerror = SStotal – SScells
= 1000 – 952 = 48

ANOVA table
Source of variation
SS df MS F p
Gender SSgender kgender – 1 SSgender / dfgender
MSgender
MSerror
P value
Therapy SStherapy ktherapy – 1 SStherapy / dftherapy
MStherapy
MSerror
P value
Gender*
Therapy
SSgender*therapy Dfgender * Dftherapy
SSgender*therapy / dfgender*therapy
MSgender*therapy
MSerror
P value
Error SSerror kgender * ktherapy
(n-1)
SSerror / dferror
Total SStotal N – 1

ANOVA table
Source of variation
SS df MS F p
Gender 8 1 8 2 .183
Therapy 496 2 248 62 .000
Gender*
Therapy
448 2 224 56 .000
Error 48 12 4
Total 1000 17