lecture 11: interaction information visualization cpsc 533c, fall 2006 tamara munzner ubc computer...
Post on 21-Dec-2015
226 views
TRANSCRIPT

Lecture 11: Interaction
Information VisualizationCPSC 533C, Fall 2006
Tamara Munzner
UBC Computer Science
17 Oct 2006

Topics
• Topic choices due this Friday 5pm
• Tell me the three topics you do want
• Tell me up to two times you do not want from the four possible (Nov 7, 9, 21, 23)
• Email subject: 533 submit topics• No need to resend unless changed mind

Topic Choices
• application domains– software engineering– computer networks– databases / datamining– cartography– social networks
• data domains– time-series– text / document
collections– tree / hierarchy– graphs / graph drawing– high dimensional– low dimensional
(statistical graphics)
• techniques/approaches– interaction– focus+context– navigation/zooming– glyphs– animation– brushing/linking
• other– frameworks/taxonomies– perception– evaluation
• anything to add?

Proposals
• everybody must have met with me by end of this week– the 3 of you haven't yet, talk to me after class to set
time– my schedule is very tight, office hours today 1:30-2:30
would be safest
• written proposals due next Fri Oct 27– format: HTML or PDF– length: at least 2 pages
• handin email should have– URL – Subject: 533 submit proposal
Proposal Expectations
• name/email address of team (1 or 2 people)• description of domain, task, dataset• personal expertise• proposed infovis solution
– should address abstraction of domain problem
• scenario of use– including sketch/mockup illustrations!
• implementation approach– high-level, what if any toolkits you'll use
• milestones– be specific, include dates
• previous work

Papers Covered
• Ware, Chapter 10: Interacting with Visualizations• Ware, Chapter 11: Thinking with Visualizations• The cognitive coprocessor architecture for interactive
user interfaces George Robertson, Stuart K. Card, and Jock D. Mackinlay, Proc. UIST '89, pp 10-18.
• Visual information seeking: Tight coupling of dynamic query filters with starfield displays Chris Ahlberg and Ben Shneiderman, Proc SIGCHI '94, pages 313-317.
• SDM: Selective Dynamic Manipulation of Visualizations, Mei C. Chuah, Steven F. Roth, Joe Mattis, John Kolojejchick, Proc. UIST '95

Further Reading
• Toolglass and magic lenses: the see-through interface. Eric A. Bier, Maureen C. Stone, Ken Pier, William Buxton, and Tony D. DeRose, Proc. SIGGRAPH'93, pp. 73-76.
• Visual Exploration of Large Structured Datasets. Graham J. Wills. In New Techniques and Trends in Statistics, 237-246. IOS Press, 1995.

Ware Interaction
• low-level control loops, data manipulation– choice reaction time
• depends on number of choices
– selection time: Fitts’ Law• depends on distance, target size
– path tracing• depends on width
– learning: power law of practice• also subtask chunking

Ware Interaction
• low-level control loops– two-handed interaction: Guiard's theory
• coarse vs. fine controle.g. paper vs. pen positioning
– vigilance• difficult, erodes with fatigue
– control compatability• learning/transfer: adaption time depends
– hover/mouseover/tooltip• faster than explicit click

Toolglass/Lenses
• two-handed interaction
• toolglass: semi-transparent interactive tool– e.g. click-through buttons
• magic lens: – e.g. scaling, curvature
Toolglass and magic lenses: the see-through interface. Eric A. Bier, Maureen C. Stone, Ken Pier, William Buxton, and Tony D. DeRose, Proc. SIGGRAPH'93, pp. 73-76.

Ware Interaction
• exploration and navigation loops– navigation
• next time
– rapid zooming• next time
– distortion• previous
– multiple windows, linked highlighting• more today
– dynamic queries• more today

Ware Thinking with Viz
• problem solving loops– external representations– "cognitive cyborgs"
• cost of knowledge– Pirolli/Rao: information foraging/scent theory– attention as most limited resource

Visual Working Memory
• characteristics– different from verbal working memory– low capacity (3-5?)– locations egocentric– controlled by attention– time to change attention: 100ms– time to get gist: 100ms– not fed automatically to longterm memory

Visual Working Memory
• multiple attributes per object stored– position (egocentric), shape, color, texture
• integration into glyphs allows more info
• change blindness (Rensink)– world is its own memory
• inattentional blindness• attracting attention
– motion (or appear/disappear?)

Memory and Loops
• long term memory– chunking– memory palaces (method of loci)
• nested loops– problem-solving strategy– visual query construction– pattern-finding loop– eye movement control loop– intrasaccadic image-scanning loop

InfoVis Implications
• visual query patterns
• navigation/interaction cost
• multiple windows vs. zoom

Cognitive Co-Processor
• animated transitions– object constancy– fixed frame rate required
• architectural solution– split work into small chunks– animation vs. idle states– governor controls frame rate
• [video: 3D rooms]

SDM• sophisticated selection, highlighting,
object manipulation
• [video]

Dynamic Queries: HomeFinder
• filter with immediate visual feedback• “starfield”: scatterplot• [video]
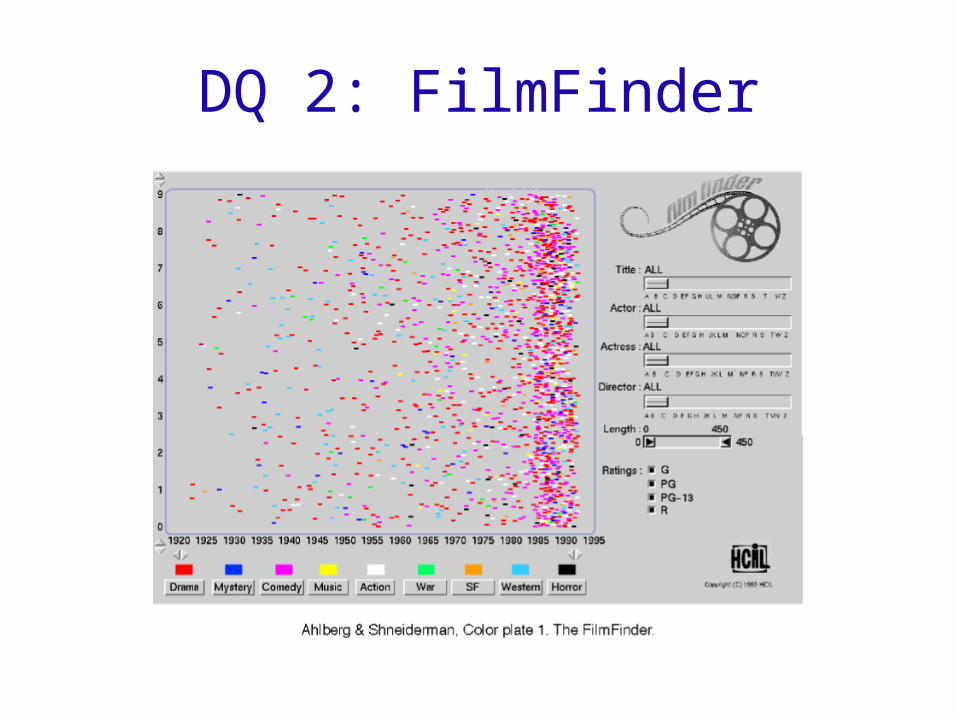
DQ 2: FilmFinder

DQ 2: FilmFinder

More Linked Views
key infovis interaction principle
so far: Ware, Trellis, cluster calendar, ….
brushing: linked highlightingBecker and Cleveland, “Brushing Scatterplots”, Technometrics 29, 127-142
new examples: EDVAttribute Explorer

EDV
Exploratory Data Visualizer
Graham J. Wills. Visual Exploration of Large Structured Datasets. In New Techniques and Trends in Statistics, 237-246. IOS Press, 1995.

Highlighting (Focusing)Focus user attention on a subset of the data within one graph (from Wills 95)
[www.sims.berkeley.edu/courses/is247/s02/lectures/Lecture3.ppt]

Link different types of graphs:Scatterplots and histograms and bars
(from Wills 95)
[www.sims.berkeley.edu/courses/is247/s02/lectures/Lecture3.ppt]

Baseball data:Scatterplots and histograms and bars
(from Wills 95)
select highsalaries
avg careerHRs vs avg career hits(batting ability)
avg assists vsavg putouts (fielding ability)
how longin majors
distributionof positionsplayed
[www.sims.berkeley.edu/courses/is247/s02/lectures/Lecture3.ppt]

Linking types of assist behavior to position played (from Wills 95)
[www.sims.berkeley.edu/courses/is247/s02/lectures/Lecture3.ppt]

Influence/Attribute Explorer
• Visualization for Functional Design, Bob Spense, Lisa Tweedie, Huw Dawkes, Hua Su, InfoVis 95
[video]