lecture 10: look alike - ucla statisticscocteau/stat202a/lectures/lecture10.pdf · % cat...
TRANSCRIPT

Lecture 10: Look alike

1
Mobilize:Mobilizing for Innovative Computer Science Teaching
and LearningA Grant to UCLA from the National Science Foundation
1
Bring computational thinking into the classroom ...and into everyday life.

2
•High School Curriculum: Data are everywhere: students will learn the practice of data interpretation through spatial analysis, temporal analysis, text interpretation, all through their own data.
•Participatory Sensing Software: Flexible, open, tools for authoring, implementing, analyzing participatory sensing data campaigns using mobile phones and web services.
•Multidisciplinary teacher teams: Focus inquiry based investigations on CS, Science, Math, with outreach to Journalism, Social Science, etc.Integrate with standards and professional development.
A multidisciplinary, multi-perspective, partnership: CENS, Center-X, and LAUSD
(Estrin, Hansen, Margolis, Phillips, Priselac, Ullah: began 10/1/10)

3
Mobilize Vision and Partnership• Mobilize is about students in the LAUSD engaging with
Computational Thinking—the critical thinking and problem-solving heart of computer science—through the use of mobile and Web technologies.
• Mobilize is about equity and increasing access to learning opportunities critical for the 21st century.
• Mobilize is a partnership focused on improving computer science education in Los Angeles high schools with implications for the whole country.
14

4
Mobilize: Curricular elements
• Exploring Computer Science, through data• Inquiry-based learning for computational thinking• Learning about how people generate, collect, analyze, and
represent data (data are ubiquitous)• Representation and interpretation of spatial, temporal, text,
and image data.• Math
• Problem solving and algorithmic thinking• Addresses key Math Content Standards
• Science• “Citizen Science” – using scientific data analysis for democratic
participation• Addresses key Science Content Standards

5
Mobilize: Participatory Sensing system
• Participatory sensing is....• PS role in mobilize is a hands on technique for students to
organize around data practices• Student will design and implement Participatory Sensing data
campaigns comprised of:• Mobile experience• Web services for data management• Rich analysis toolkit

Civic and environmental campaign examples
GarbageWatchRecycling Practices on Campus
What’s InvasiveInvasive plant and pest monitoring
2007
http://garbagewatch.com/ http://whatsinvasive.com/
leveraging coordinated, real-time, geo-coded,
tagged, images and prompted
entries

Community campaign example: Boyle Heights
Lukac et al
“ ... Typically planning processes and planners come in and plan with an outside perspective instead of looking at existing patterns of resident flow.”
•~70 residents documenting conditions in and between work, school, home.
•Where they go and gather, the conditions surrounding them.

Sustainability campaign example: PEIR

Data and Roles
Campaign
Data Collec2on
AnalysisAuthor(students) Analyst
(students)
Participant(students)
- Download responses- Upload analysis result
- Upload responses (phone)- Retrieve feedback (phone)- Delete personal responses (web)- Config personal data sharing (web)
Admin(technical support)
- Account/group management* - Permissions are global- See everything and can delete any campaign data (i.e. responses, analysis, etc.) supervisor
(teacher)
- Create/config/delete campaign- Setup co-authors- Register campaign to classes- Monitor campaign activities- Cannot delete campaign responses!
*Initially CENS supported, sustainable longer term by LAUSD IT function

10
andwellness.org
Java 6 + Tomcat 6 + MySQL 5.1
Internet
Participatory Sensing Software: End-to-end System Implementation
Server
JSON/HTTPS
JSON/HTTPS
Android Mobile Phones
Web Browser Clients
Mobilize
test.mobilize.org
Java 6 + Tomcat 6 + MySQL 5.1
Hicks, Monibi, Ramanathan, Selsky, et al

11
Mobilize: Development, Deployment, Sustainability
• Mobilize Curricular Units Created• For Exploring Computer Science (ECS), Math, Science• Map onto California State standards
• Professional development• 400 LAUSD ECS, Math, Science teachers (over 5 years)• Interdisciplinary teams
• Educational Policy Change• Computer ScienceCollege prep (A-G) status• CS teacher certification program• CS methods course designed

Last time
• We started with a treatment of user-defined objects in Python -- Up to that point we had only used aspects of the object-oriented structure in Python and our own work hadn’t involved creating new objects
• We took the example of a browser and examined how a particular module in Python implements this object, the attributes and methods it supports -- We then transitioned to something closer to your new homework assignment

Version control software
• As you have been working through your homework, especially as you moved to “sharing” code with your group, you no doubt had a need to keep track of your different rewrites
• Not surprisingly, your experiences are “generic” in some sense and there are a variety of tools that help you manage the software authoring and sharing processes
• While in previous years I have emphasized a system called Subversion (SVN), this year we’ll use something called Git...

Git
• The purpose of Git is to manage a “software project” or a collection of files (files, directories, subdirectories) as they change over time -- Git stores all this information in a data structure called a repository
• A repository contains, among other things,
• A set of commit objects
• A set of references to commit objects called heads
• The Git repository is stored in the same directory as the project itself, in a subdirectory called, well, .git

Git: An example
• You create a repository by first making a directory for your project, if it doesn’t already exist, and populate it with the “stuff” of your project -- Then run the command “git init” to instantiate the repository (creating the .git directory, for example)
• Then, to commit material to the repository, you need to do two things:
1. First, identify which files to include using the command “git add” -- If a file hasn’t changed since the last commit it is automatically included so you only need to explicitly add files you’ve changed (Git also operates recursively so “git add .” will add everything that has changed)
2. Then call ”git commit” to create a new commit object that will have HEAD as its parent
• A simple short cut is the command “git commit -a” which will automatically add all modified files (but not new ones) to the commit action
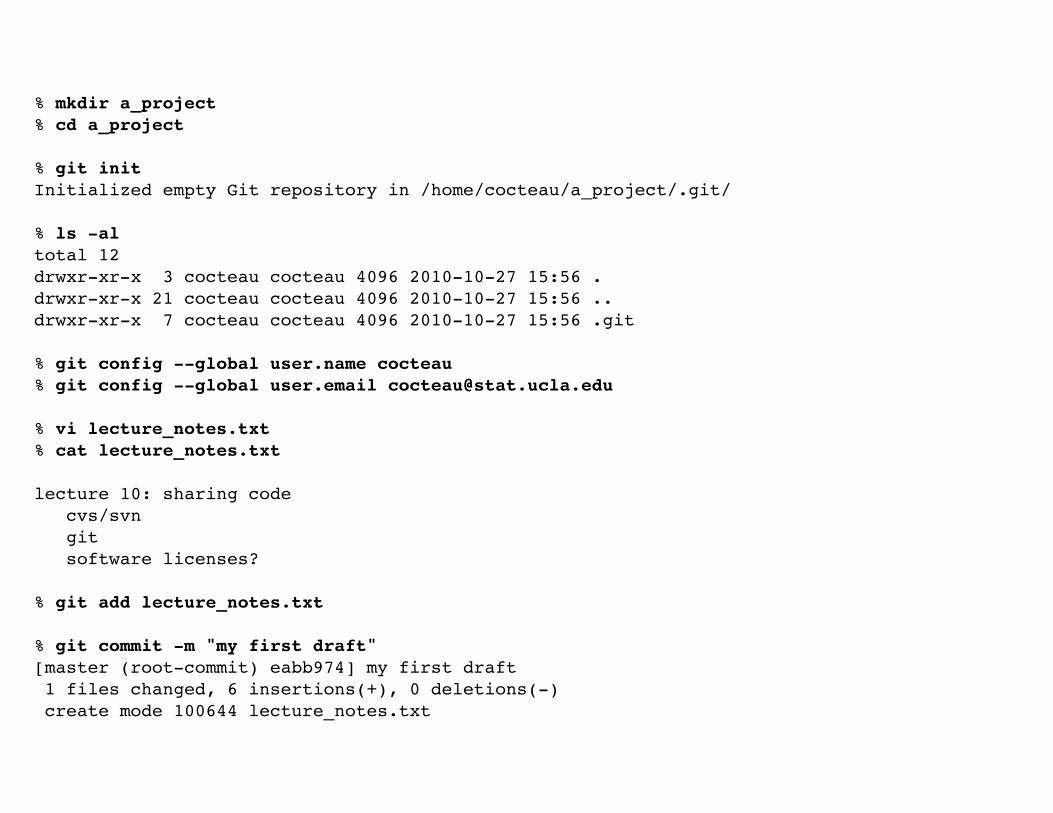
% mkdir a_project% cd a_project
% git initInitialized empty Git repository in /home/cocteau/a_project/.git/
% ls -altotal 12drwxr-xr-x 3 cocteau cocteau 4096 2010-10-27 15:56 .drwxr-xr-x 21 cocteau cocteau 4096 2010-10-27 15:56 ..drwxr-xr-x 7 cocteau cocteau 4096 2010-10-27 15:56 .git
% git config --global user.name cocteau% git config --global user.email [email protected]
% vi lecture_notes.txt% cat lecture_notes.txt
lecture 10: sharing code cvs/svn git software licenses?
% git add lecture_notes.txt
% git commit -m "my first draft"[master (root-commit) eabb974] my first draft 1 files changed, 6 insertions(+), 0 deletions(-) create mode 100644 lecture_notes.txt

% cat lecture_notes.txt
lecture 10: sharing code cvs/svn git software licenses?
% vi lecture_notes.txt % cat lecture_notes.txt
lecture 10: sharing code git software licenses?
cvs/svn (more trouble than it's worth?)
% git commit -a -m "second draft"[master e674059] second draft 1 files changed, 2 insertions(+), 1 deletions(-)
% git logcommit e674059ce23709ea5fca68fbeaf568337d7bbd64Author: cocteau <[email protected]>Date: Wed Oct 27 19:45:38 2010 +0000
second draft
commit eabb9749ad213b8545ba7bb516bb0d4e31b04712Author: cocteau <[email protected]>Date: Wed Oct 27 19:44:18 2010 +0000
my first draft

% cat lecture_notes.txt
lecture 10: sharing code git software licenses?
cvs/svn (more trouble than it's worth?)
% vi lecture_notes.txt % cat lecture_notes.txt
lecture 10: sharing code git software licenses?
% git status# On branch master# Changed but not updated:# (use "git add <file>..." to update what will be committed)# (use "git checkout -- <file>..." to discard changes in working directory)##! modified: lecture_notes.txt#no changes added to commit (use "git add" and/or "git commit -a")
% git commit -a -m "dropped material"[master 41d2f51] dropped material 1 files changed, 0 insertions(+), 2 deletions(-)

% git logcommit 41d2f512332c01d9c7ecc09a9d997b3d1b25ee82Author: cocteau <[email protected]>Date: Wed Oct 27 19:51:41 2010 +0000
dropped material
commit e674059ce23709ea5fca68fbeaf568337d7bbd64Author: cocteau <[email protected]>Date: Wed Oct 27 19:45:38 2010 +0000
second draft
commit eabb9749ad213b8545ba7bb516bb0d4e31b04712Author: cocteau <[email protected]>Date: Wed Oct 27 19:44:18 2010 +0000
my first draft

Git
• A commit object contains three things:
• A set of files that reflect the state of the project at any given point in time
• References to parent commit objects
• A name (40-character string) that uniquely identifies the commit object
• Parent commit objects are those commits that were edited to produce subsequent states of the project -- Generally a commit object will have one parent (but with merges there’s a way to end up with two or more parents)
• You can explicitly refer to parents with the ^ sign -- So HEAD^ refers to the previous commit, and we could use e674059ce23709ea5fca6^ to refer to the parent of a particular commit
• A project always has one commit object with no parents that represents the first commit made to the project repository -- You can imagine data analysis on these commit objects as they represent a graph of changes to the project!

Git
• In pictures, you could imagine our three commits forming a simple graph -- Simple because each commit points to the previous version of the file lecture_notes.txt
• Here A, B and C refer to our three commits
A B C
master
HEAD

Git
• In your projects, it has likely been the case that you’ve been working on a piece of code and you get it to a point where it implements some algorithm reliably -- Never satisfied, you continue to work on it, perhaps adding new features
• During this process, your group members want to be able to use the old version of the code you had perfected, before you launched on your new idea: Now what? You want to be able to jump back to this older version, maybe make some changes so they can more easily use the code and send it to them (although we’ll have easier ways to share code shortly)
• Git supports this situation through the use of branching...

Git
• What we’re talking about is changing from a repository that looks like this...
•
A B C
master
HEAD

Git
• To something more like this...
•
A B C
master
HEAD
D
for-group

Git
• In short, we want to jump back to our commit (B) and start working from there and to do this you first need to know how to reference the commit you’re after -- The log command helps (or we could use, in this case, a reference to HEAD^)
• git branch [new-head-name] [reference-to-(B)]
• Or in this case we might use
• git branch for-group HEAD^
• Which gives us a graph that looks like this...
• A B C
master
HEAD
for-group

Git
• Finally, to be able to work on the older version of the code, you need to set the for-group head to be the current head -- This is done with the command
• git checkout for-group
• This command points HEAD to the commit object you specify and rewrites all the files in the directory to match the files stored in the new HEAD commit (It is recommended that you commit all the files you’ve changed before you do this)
• This gives us the graph we’re after...
A B C
master
HEAD
D
for-group

% cat lecture_notes.txt
lecture 10: sharing code git software licenses?
% git logcommit 41d2f512332c01d9c7ecc09a9d997b3d1b25ee82Author: cocteau <[email protected]>Date: Wed Oct 27 19:51:41 2010 +0000
dropped material
commit e674059ce23709ea5fca68fbeaf568337d7bbd64Author: cocteau <[email protected]>Date: Wed Oct 27 19:45:38 2010 +0000
second draft
commit eabb9749ad213b8545ba7bb516bb0d4e31b04712Author: cocteau <[email protected]>Date: Wed Oct 27 19:44:18 2010 +0000
my first draft
% git branch for-group HEAD^

% git checkout for-groupSwitched to branch 'for-group'
% cat lecture_notes.txt
lecture 10: sharing code git software licenses?
cvs/svn (more trouble than it's worth?)
% git log# On branch for-groupnothing to commit (working directory clean)
% git branch -v* for-group 98ab7ff second draft master ce7f371 dropped material
% git checkout master% git branch -v for-group 98ab7ff second draft* master ce7f371 dropped material

Git
• Now, a more realistic sharing scenario -- You and one of your group members are working on a project where you will be updating separate Python modules, each representing a different part of some task
• You are faced with a few questions -- How are you going to get the code from your partner? How will you let her know if you changed something? And how are you going to receive any changes she makes?

Git
• If you are all working on the same machine, this is pretty simple via Git -- You simply create a copy of your own copy of your partner’s repository using the command
• git clone name
• Here name can be a directory if you are on the same machine, or a URL specification like ssh://server/repository
• git clone ~cocteau/a_project b_project
• Technically, this command creates a new directory called b_project and initializes a repository there -- It then copies all the commit objects and head references from the project

Git
• If after a few hours your partner has made changes, you can incorporate them into your code using the command git pull

% cd % git clone ~cocteau/a_project b_project
% cd b_project% lslecture_notes.txt
% git logcommit ce7f371e97c501d8a22b5695109ed39f5ea4b679Author: cocteau <[email protected]>Date: Wed Oct 27 20:33:54 2010 +0000
dropped material
commit 98ab7ffafeb4c3fbb24ed902918bec0430e917dfAuthor: cocteau <[email protected]>Date: Wed Oct 27 20:33:21 2010 +0000
second draft
commit 79a95de61bd15f531655d62710a49a6839227eedAuthor: cocteau <[email protected]>Date: Wed Oct 27 20:32:55 2010 +0000
my first draft
% git branch -v* master ce7f371 dropped materialcocteau@homework:~/b_project$ git branch -r origin/HEAD -> origin/master origin/for-group origin/master

% cd ~cocteau/a_project% vi lecture_notes.txt% cat lecture_notes.txt
lecture 10: sharing code
maybe start r?
% git commit -a -m "rethink"[master c79a128] rethink 1 files changed, 2 insertions(+), 2 deletions(-)
% cd ~cocteau/b_project% cat lecture_notes.txt
lecture 10: sharing code git software licenses?
% git pullremote: Counting objects: 5, done.remote: Compressing objects: 100% (1/1), done.remote: Total 3 (delta 0), reused 0 (delta 0)Unpacking objects: 100% (3/3), done.From /home/cocteau/a_project ce7f371..c79a128 master -> origin/masterUpdating ce7f371..c79a128Fast-forward lecture_notes.txt | 4 ++-- 1 files changed, 2 insertions(+), 2 deletions(-)
% cat lecture_notes.txt
lecture 10: sharing code
maybe start r?

Git
• Now, suppose you make changes to your copy of your partner’s code and want to send these to her -- The command git push (the opposite of pull) sends data to the remote repository
• There are a number of complications when you start incorporating changes like this -- Some are practical in that their code could have changed as well meaning you have conflicts in your versions
• Git handles a variety of sharing situations, allowing you all to work on different parts of code, managing or at least highlighting conflicts, and generally promoting good work habits
• Most of the material in this section has been taken from an excellent Git tutorial at http://www.eecs.harvard.edu/~cduan/technical/git/ -- Consult this reference for more information

Next time
• We will send around some simple instructions to get us all started on an external hosting site, github -- The idea is that for this project, each group member could contribute to a single project repository

Aside: Sharing code
• Now, aside from the technical mechanism in place for sharing code are there other implications?
• Let’s see...

Sharing code
• Suppose you create some code to fit a new kind of model; after it’s “out there” for a while, perhaps another eager graduate student will find and fix a few bugs, or maybe she’ll even extend what we’ve done and add new analysis
• Maybe some small company will create a GUI for your fitting package and start to distribute it internally to its engineers
• Or, maybe, the company does a little market research and realizes that there s a huge need for tools of this kind and wants to sell it
• What laws exist to govern these kinds of developments?

Copyright
• Technically, any creative works you produce are automatically copyrighted; this includes software -- This means you have the following rights
1. The exclusive right to copy the work; 2. The exclusive right to make derivative works; 3. The exclusive right to distribute the work; 4. The exclusive right to perform the work; and 5. The exclusive right to display the work
http://www.groklaw.net/article.php?story=20031231092027900

Copyright
• The Open Source software movement has created licenses, legal mechanisms, which allow people to use copyrighted material subject to certain restrictions
• Typically, these licenses restrict how people can use, copy and redistribute software

Copyright
• R is licenses under the GNU General Public License; It is the most popular Open Source software license
1. The right to copy and redistribute so long as you include a copyright notice and a disclaimer of warranties. You may charge for the cost of distribution and you may offer warranty protection for a fee.
2. The right to make derivative works for your own use. 3. The right to distribute derivative works so long as you:
1. Identify the work as modified; 2. License it under the GPL; and 3. Provide the license information interactively if the program normally runs interactively.
This section, and the obligation to license under the GPL, does not apply to works which are independent works distributed with the GPL'd work and which run on the GPL'd works.
4. You may distribute the work only in executable form so long as the source code is:
1. distributed with the object code;2. offered by a written offer, valid for a period of at least three years, to make the source code available for
no more than the cost of distribution; and3. for non-commercial distributions, accompanied with the offer the redistributing party received as to the
availability of the source code.
5. You may not impose restrictions on any of these rights.
http://www.groklaw.net/article.php?story=20031231092027900

Copyright
• Basically, you get rights to use, copy and redistribute provided you do so under the GPL license
• This means that software can’t become less “free” or “open” through successive enhancements

[homework library] find . -name DESCRIPTION -exec grep "License:" '{}' \;
License: GPL version 2 or newerLicense: LGPL Version 2 or later.License: GPL (>= 3)License: avas is public domain, ace is on StatlibLicense: GPL (>= 2)License: GPL (>= 2)License: GPLLicense: GPL (>= 2)License: GPL (>= 3)License: Unclear (Fortran) -- code in Statlib's ./S/adaptLicense: GPL (version 2 or later)License: GPL (>= 2)License: GPL (>= 2)License: GPL (>= 2)License: GPL (>= 2)License: GPLLicense: GPL (>= 2)License: GPL version 2 or newerLicense: GPLLicense: GPL (>= 2)License: GPL-2License: GPL-2License: GPL2License: GPL version 2 or newerLicense: GPL-2License: GPLLicense: GPL version 2License: GPL

The typical line of reasoning...
• If my software is disposable, who cares? If it’s worth something, why should I share it?
• Ugh, the legalese is way too much to think about; Why not just let people use my software if they want?

Well...
• The copyright is yours whether you like it or not; and placing something in the public domain is not entirely trivial
• By attaching a license to a piece of software, you are saying that the software IS valuable, and that the value is enhanced by letting others participate in its evolution
• The strength of the Open Source effort is that the value of software increases when a community of people contribute

And it’s not just software
• A couple more months after you graduate, you find yourself at a university creating a whole lot of educational materials
• Again, you own the copyright; wouldn’t it be better to share?
• Creative Commons builds off the work in the Open Source software effort and has designed a set of licenses that can be custom assembled to let you control how others can use your work (http://www.creativecommons.org)


End of the Aside on sharing code...

Python and data analysis?
• As part of the Mobilize effort, we’ve had to ask ourselves about the possibility of doing real data analytic work in Python -- There was some concern that R might be too complicated (it was not MY concern)
• With iPython (interactive tool) and matplotlib (module for graphing) and numpy (module for numerical data) we get close -- Would anyone be interested in experimenting with this suite as a data analytic platform?
• What do we need from a data analytic system?


A little history...

Statistical Computing in the 1960’s
• A number of statistical systems and programs already existed; BMD and P-Stat were in current use and GenStat was being developed
• These systems grew out of specific application areas and tended to offer pre-packaged analyses
• At the time, most statistics researchers would not be directly involved in analyzing data; programmers (read graduate students) would do the grubby work when necessary
The systems like BMD and SAS, for example, and PStat, to some extent, and GenStat’s another good example, all grew up in environments where statisticians were required to do some fairly committed routine analysis. So BMD, of course comes from a biomedical field; SAS from several areas but medical, again; and GenStat comes from an agricultural background.
Now in all those situations, the statistics groups, amongst other duties, were expected to be doing kind of analysis to order. You know, the data would come along from a experiment, or a clinical trial, or other sources, and as part of the job of the statisticians to produce analysis. Now often the analysis that they produced were relatively predetermined, or at least that’s how it worked out. Interview with John Chambers, 2002

The mid 1960’s at Bell Labs
• Statistics Research at Bell Labs tackled large-scale data analysis projects with teams of researchers and “programmers”
• Unlike much of the statistical computing of the day, this kind of work was not well suited to pre-packaged programs
• Even then, AT&T was creating large-scale applications; data from TelStar, an early (1960s) communications satellite, involved tens of thousands of observations
Launched by NASA aboard a Delta rocket from Cape Canaveral on July 10, 1962, Telstar was the first privately sponsored space launch. A medium-altitude satellite, Telstar was placed in an elliptical orbit (completed once every 2 hours and 37 minutes), revolving at a 45 degree angle above the equator. Because of this, its transmission availability for transatlantic signals was only 20 minutes in each orbit.
Telstar relayed its first television pictures (of a flag outside its ground station in Andover, Maine) on the date of its launch. Almost two weeks later, on July 23, it relayed the first live transatlantic television signal. During that evening it also dealt with the first telephone call transmitted through space and successfully transmitted faxes, data, and both live and taped television, including the first live transmission of television across an ocean (to Pleumeur-Bodou, in France). John F. Kennedy, then President of the United States, gave a live transatlantic press conference via Telstar.

The mid 1960’s at Bell Labs
• During this period, John Tukey was also starting to formulate the beginnings of Exploratory Data Analysis
EDA is an approach to data analysis that postpones the usual assumptions about what kind of model the data follow with the more direct approach of allowing the data itself to reveal its underlying structure and model. EDA is not a mere collection of techniques; EDA is a philosophy as to how we dissect a data set; what we look for; how we look; and how we interpret.
Most EDA techniques are graphical in nature with a few quantitative techniques. The reason for the heavy reliance on graphics is that by its very nature the main role of EDA is to open-mindedly explore, and graphics gives the analysts unparalleled power to do so, enticing the data to reveal its structural secrets, and being always ready to gain some new, often unsuspected, insight into the data. In combination with the natural pattern-recognition capabilities that we all possess, graphics provides, of course, unparalleled power to carry this out.
Taken from www.itl.nist.gov
“Exploratory analysis is detective work -- numerical detective work -- or counting detective work -- or graphical detective work”

The mid 1960’s at Bell Labs
“Today, software and hardware together provide far more powerful factories than most statisticians realize, factories that many of today's most able young people find exciting and worth learning about on their own. Their interest can help us greatly, if statistics starts to make much more nearly adequate use of the computer. However, if we fail to expand our uses, their interest in computers can cost us many of our best recruits, and set us back many years.”
The technical tools of Statistics, Nov 1964

The mid 1960’s at Bell Labs
• In previous decades, computers had matured significantly, but the access a user might have to these systems was limited; recall that in 1964, Bell Labs partnered with MIT and GE to create Multics (for Multiplexed Information and Computing Service)
“Such systems must run continuously and reliably 7 days a week, 24 hours a day in a way similar to telephone or power systems, and must be capable of meeting wide service demands: from multiple man-machine interaction to the sequential processing of absentee-user jobs; from the use of the system with dedicated languages and subsystems to the programming of the system itself”

The mid 1960’s at Bell Labs
• While Bell Labs dropped out of the project in 1969, it did spark a lot of interest among researchers throughout the lab; John Chambers had just joined the lab and was starting to think about larger computing issues
• He and a small group of statisticians began to consider how this kind of computing platform might benefit the practice of statistics
• What should the computer do for us?

What should the computer do for us?
• Let’s take a moment and answer that question for ourselves; you now have a fair bit of experience collecting, organizing and analyzing data with simple shell tools and Python scripts
• What operations would a computing environment designed for statisticians make easy? What kinds of data types should be “built-in”? How should one interact with it?
• How do your answers change if you think instead about a someone looking at data, someone who might not be a statistician?

Data analyst’s IO
Data analyst’s mind andintuition
Conceptualitems andoperations(Analysh)
Conceptualcomputer
Actual computer
Facilitatingtransducers
Adapted from Chambers (2000)
The mid 1960’s at Bell Labs
• What should the computer do for us?
• In answering this question, the Bell Labs group considered the necessary components of a system that would “more naturally express what we do and allow us to interactively program analyses”
• Tukey produced a memo that outlined the basic concepts; memos were the emails of the mid 1960s

Data analyst’s IO
Data analyst’s mind andintuition
Conceptualitems andoperations(Analysh)
Conceptualcomputer
Actual computer
Facilitatingtransducers
Adapted from Chambers (2000)
Follow the arrows clockwise from the Mind and Intuition block. Tukey’s notion is that data analysts have an arsenal of operations applicable to data, which they describe to themselves and to each other in a combination of mathematics and (English) words, for which he coins the term Analysh. These descriptions can be made into algorithms (my term, not his) -- specific computational methods, but not yet realized for an actual computer (hence the conceptual computer). Then a further mapping implements the algorithm, and running it produces output for the data analyst. The output, of course, stimulates further ideas and the cycle continues.(The facilitating transducers I interpret to mean software that allows information to be translated back and forth between internal machine form and forms that humans can write or look at -- a transducer, in general, converts energy from one form to another. So parsers and formatting software would be examples.)
Taken from Chambers (2000)

The mid 1960’s at Bell Labs
• This group met again in the summer of 1965; Martin Wilk opened the meeting with the following
“What do we want? We want to have easy, flexible, availability of basic or higher level operations, with convenient data manipulation, bookkeeping and IO capacity. We want to be able easily to modify data, output formats, small and large programs and to do this and more with a standard language adapted to statistical usage.”
• Unfortunately, the plans developed by this group remained just that, plans; it wasn’t until a decade later that a second group met, and on May 5, 1976, work started on what would become “S”


The development of S
• The image on the previous page is a scan of the first graphic produced at the May 5 meeting, and according to Chambers:
• “The upper portion depicts the concept of an interface between a proposed user-level language and an ‘algorithm,’ which meant a Fortran-callable subroutine. The lower portion of the figure shows diagrammatically a hierarchical, list-like structure for data, the direct forerunner of lists with named components, structures with attributes and eventually classes with slots... The two portions of the sketch in fact lead to the themes of function calls and objects, in retrospect.

The development of S
• By the end of 1976, John Chambers and Rick Becker had produced a working version of their sketch
• The program was initially referred to as “the system” locally, and attempts to come up with new names yielded lots of “unacceptable” candidates, but all of which had the letter “S” in common; and so, given the precedent of the recently-developed C language...

Unix and S
• Becker and Chambers made the most of the Unix project happening in parallel at the labs at the same time; by creating a Unix version of S (S Version 2), their system became portable (or at least it could go anywhere Unix could)
• At that point, AT&T started licensing both Unix and S, with both university groups and “third-party” resellers in mind; this meant others could contribute to the development of the software

The development of S
• About a decade after the first version of S, a complete revision of the language took place (S3, described in the “blue book”) which gave rise to an extensive modeling effort (described in the “white book”); for most of you, this version of S will most closely resemble R (to come)
• One more decade and another version (S4, described in Chambers’ book “Computing with Data”) that brought with it a new class and method system
• In 1998 Chambers won the ACM (Association for Computing Machinery) Software System Award; S has “forever altered the way people analyze, visualize and manipulate data”

And finally...
• Ross Ihaka and Robert Gentleman (both at the University of Auckland at the time) wrote a reduced version of S for “teaching purposes”
• In 1995 Ross and Robert were persuaded to release the code for R under the GPL (the General Public License; it allows you to use it freely, distributed it, and even sell it, as long as the receiver has the same rights and the source code is freely available)
• R is now administered by a core group of about a dozen people; but many more contribute code, and many many more program in R

The R environment
• R is an integrated suite of software facilities for data manipulation, calculation and graphical display. It includes
• an effective data handling and storage facility,
• a suite of operators for calculations on arrays, in particular matrices,
• a large, coherent, integrated collection of intermediate tools for data analysis,
• graphical facilities for data analysis and display either on-screen or on hardcopy, and
• a well-developed, simple and effective programming language which includes conditionals, loops, user-defined recursive functions and input and output facilities.

The R environment
• The term "environment" is intended to characterize it as a fully planned and coherent system, rather than an incremental accretion of very specific and inflexible tools, as is frequently the case with other data analysis software.
• R, like S, is designed around a true computer language, and it allows users to add additional functionality by defining new functions. Much of the system is itself written in the R dialect of S, which makes it easy for users to follow the algorithmic choices made.
• Many users think of R as a statistics system. We prefer to think of it of an environment within which statistical techniques are implemented. R can be extended (easily) via packages.

The R environment
• While there is a fair bit of difference between how R and S are implemented, one of the most visible for users involves how code is shared
• The S language is often the vehicle of choice for research in statistical methodology, and R provides an Open Source route to participation in that activity.
• In my mind, the ease with which packages can be published, accessed (installed) and auditioned is one of the real innovations of R
• As an aside, what do (nearly) all of the names on the right have in common?
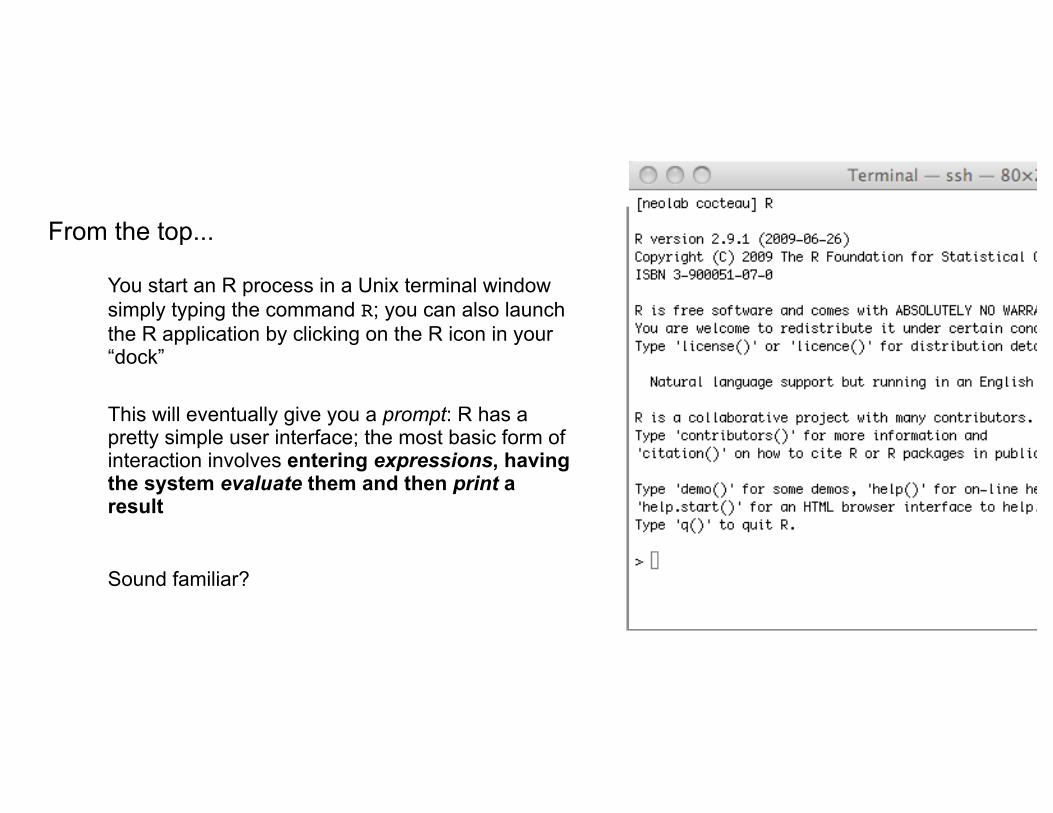
From the top...
• You start an R process in a Unix terminal window simply typing the command R; you can also launch the R application by clicking on the R icon in your “dock”
• This will eventually give you a prompt: R has a pretty simple user interface; the most basic form of interaction involves entering expressions, having the system evaluate them and then print a result
• Sound familiar?

Let’s talk about your homework...


Shazam
• The algorithm behind Shazam is fairly straightforward -- A time-frequency decomposition is performed examining which frequencies are dominant at which times in a song
• The peaks in this map forma kind of constellation -- Relationships between the individual elements are then encoded using something called geometric hashing (don’t worry about this yet)
• Given a sample of audio, the same process is repeated and a search is made to see if there are matching patterns of peaks...


