lecture 1- electronic measurement systems
DESCRIPTION
Electrical EngineeringTRANSCRIPT


04/19/2023 EAB 3602 2009/2010 2
INTRODUCTION
• Class schedule: Teusday, 8 am - 10 pm, BK10• Lab: Wednesday 2-5 pm (starts next week)– Instrumentation Lab, KEE (Tower, Level 6) :Lab 1-7– Makmal Pemprosesan BahanBio, KBP: Lab 8-10
• Grading:– Quiz & Assignment: 10 %– Lab : 20 %– Test 1 & 2 : 30 %– Final Exam : 40 %
04/19/2023 EAB 3602 2009/2010 3
• References:– Fundamentals of Electricity for Agriculture- Robert
J Gustafon and Mark T Morgan 2004. 3rd Edition.– Electronic Instrumentation – H S Kalsi, 2004
(McGraw-Hill , 2nd Edition)– Introduction to Instrumentation and
Measurements – Robert B. Northrop, 2005 (CRC Press , 2nd Edition)
– Notes and Handouts

04/19/2023 EAB 3602 2009/2010 4
Lecture 1ELECTRONIC MEASUREMENT
SYSTEMS

04/19/2023 EAB 3602 2009/2010 5
Introduction
• To introduce electronic instrumentation systems so the students will acquire an ability to make accurate and meaningful measurements of mechanical and thermal quantity.
04/19/2023 EAB 3602 2009/2010 6
Introduction
• Instrumentation is a technology of measurement
• Measuring is basically used to monitor a process or operation, or as well as the controlling process.

04/19/2023 EAB 3602 2009/2010 7
Quantity
• Mechanical quantity:– Strain, force, pressure, moment, torque,
displacement, velocity, acceleration, flow velocity, mass flow rate, volume flow rate, frequency, and time
• Thermal quantity:– Temperature, heat flux, specific heat, and thermal
conductivity

04/19/2023 EAB 3602 2009/2010 8
Electronic Instrumentation System
Power Supply Transducer
Conditioning Circuit
Amplifier
Recorder Data processor Engineering Analysis
Power supply provides the energy to drive the transducer

04/19/2023 EAB 3602 2009/2010 9
Electronic Instrumentation System
Power Supply Transducer
Conditioning Circuit
Amplifier
Recorder Data processor Engineering Analysis
The transducer is an analog device that converts a change in the mechanical or thermal quantity being measured into a change of electrical quantity.
E.g. ∆Strain --- ∆Resistance
Strain gage type transducers
04/19/2023 EAB 3602 2009/2010 10
Electronic Instrumentation System
Power Supply Transducer
Conditioning Circuit
Amplifier
Recorder Data processor Engineering Analysis
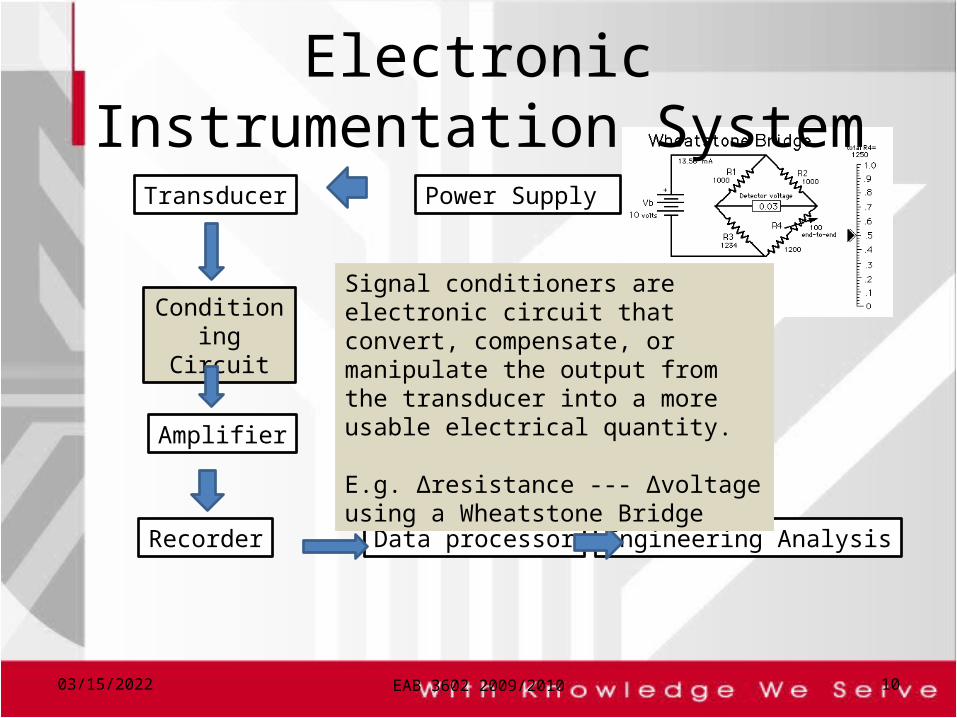
Signal conditioners are electronic circuit that convert, compensate, or manipulate the output from the transducer into a more usable electrical quantity.
E.g. ∆resistance --- ∆voltage using a Wheatstone Bridge

04/19/2023 EAB 3602 2009/2010 11
Electronic Instrumentation System
Power Supply Transducer
Conditioning Circuit
Amplifier
Recorder Data processor Engineering Analysis
Amplifiers are required in the system when the voltage output from the transducer-signal conditioner combinations is small.
E.g. Amplifier with gains of 10 to 1000 are used to increase the signals to level (1-10V) that are compatible with the voltage-measuring devices used in the system.

04/19/2023 EAB 3602 2009/2010 12
Electronic Instrumentation System
Power Supply Transducer
Conditioning Circuit
Amplifier
Recorder Data processor Engineering Analysis
Recorders are voltage-measuring devices used to display the measurement in a form that can be read and interpreted. Recorders may be analog (oscilloscopes and magnetic ape recorder) or digital (numerical array).

04/19/2023 EAB 3602 2009/2010 13
Electronic Instrumentation System
Power Supply Transducer
Conditioning Circuit
Amplifier
Recorder Data processor Engineering Analysis
Data processors are used with instrument systems that incorporate analog- to-digital converters (A.D) and provide the output signal presenting the measurement in a digital code. The output from the processor is displayed in graphs or tables. Example: Computer

04/19/2023 EAB 3602 2009/2010 14
Electronic Instrumentation System
Power Supply Transducer
Conditioning Circuit
Amplifier
Recorder Data processor Engineering Analysis
An Engineering analysis is conducted to evaluate new or modified designs of a machine component, structure, electronic system, or vehicle to ensure efficient and reliable performance when the prototype is placed in operation.

04/19/2023 EAB 3602 2009/2010 15
QUALITIES OF MEASUREMENTS
• PERFORMANCE CHARACTERISTICS– Static– Dynamic
• HOW TO QUANTIFY?– Error Measurements– Statistical Analysis
04/19/2023 EAB 3602 2009/2010 16
STATIC CHARACTERISTICS

04/19/2023 EAB 3602 2009/2010 17
CHARACTERISTICS OF MEASUREMENT SYSTEMS
• Static Characteristic:– used to define the performance criteria for the
measurement of quantities that remain constant(Considered for instrument to measure unvarying
process condition)

Measurement Errors
• Deviation of a reading from the expected value of the measured variable
• Extent of measurement error must be stated with the measurement
• Error in measurement is expressed as absolute error or percentage of error
18

Error Calculation
Absolute error (e)
The difference between the expected (Yn) and the measured (Xn) value of a variable
Percentage of error
e = Yn - Xn
Percent error = (100)Yn
Yn - Xn
19

Types of Static Errors
• Divided into four categories:–Gross Errors–Systematic Errors–Random Errors–Limiting Errors
20

Gross Errors
• Generally the fault of the person using the measuring instrument such as incorrect reading, incorrect recording, incorrect use etc
• Avoidable and must be identified and minimized if not eliminated
21

Systematic Errors
• Probable causes:– Instrument error– Environmental effect– Observational errors
• Causes shall be identified and corrected
22
Random Errors
o Generally an accumulation of large numbers of small inherent causes
o Shall be statistically analyzed and reduced
o Prompt for better accuracy and precise instrument
23

Limiting Errors
o Manufacturing limitation to the accuracy of an instrument
o Stated as percentage of full-scale deflection
o Increases as measured value less than full-scale deflection
24

Limiting Errors (cont’d)
• Example:
A 300-V voltmeter is specified to be accurate within ±2% at full scale. Calculate the limiting error when the instrument is used to measure a 120-V source.
The magnitude of the limiting error is
2/100 x 300 = 6V
Therefore, the limiting error at 120 V is
6/120 x 100 = 5%
(reading < full scale, limiting error increased)
25

• Accuracy – The degree of exactness
of a measurement compared to the expected value
A = 1 - Yn
Yn - Xn
Accuracy vs. Precision
• Precision– A measure of consistency,
or repeatability of measurements
Xn - XnPrecision = 1 -Xn
Xn = the value of the nth measurement
nX = the average of the set of n measurements
26

Example
The expected value of the voltage across a resistoris 5.0V. However, measurement yields a value of4.9V. Calculate:
a) absolute error (0.1)b)% error (2%)c) relative accuracy (0.98)d) % accuracy (98%)
27

04/19/2023 EAB 3602 2009/2010 28
CHARACTERISTICS OF MEASUREMENT SYSTEMS
• Dynamic Characteristic– Concerned with the relationship between the
system input and output when the measured quantity is varying rapidly

04/19/2023 EAB 3602 2009/2010 29
Dynamic Characteristic

04/19/2023 EAB 3602 2009/2010 30

04/19/2023 EAB 3602 2009/2010 31
Example:

Measurement Uncertainty
• Probability that a reading falls within the interval that contain true value
• Confidence level for margin of errors• Statistically determined• Reflect instrument imprecision
32

Statistical Analysis of Error in Measurement
oMean value/ Arithmetic Mean oDeviationoAverage deviation (D)oStandard deviation (S)
33

n
1i
n321 x x x x
n
x
nx i
Arithmetic mean/average
n = total number of piece of data
xn = the value of the nth measurement
xi = set of number
34

Deviation
• The difference between each piece of data and arithmetic mean
xxd nn * Note
0 21 ntot dddd
35
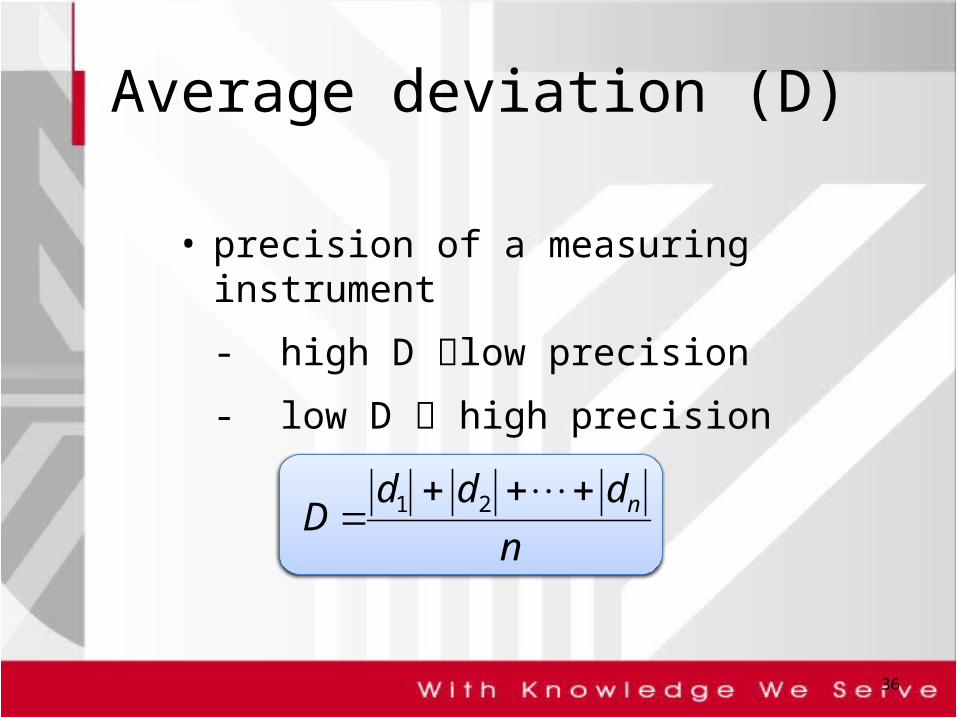
Average deviation (D)
• precision of a measuring instrument
- high D low precision
- low D high precision
n
dddD n
21
36

Standard deviation (S)
• The degree to which the value vary about the average value
30nfor
1
1 1
2
1
2
n
d
n
xxS
n
ii
n
ii
30 n for 1
2
n
dS
n
ii
37

ExampleFor the following data compute
(a) The arithmetic mean (49.9)
(b) The deviation of each value (0.2,-0.2,-0.3,0.3)
(c) The algebraic sum of the deviation (0)
(d) The average deviation (0.25)
(e) The standard deviation (0.294)
x1= 50.1
x2= 49.7
x3= 49.6
x4= 50.2
38
Calibration
• Process of establishing the relation between the indication of a measuring instrument and the value of a measurement standard
• Traceability to International Standard• Calibration improve accuracy
39

THE END
40