lecture 04: position, velocity, and acceleration...
TRANSCRIPT
LECTURE 04: Position, Velocity, and Acceleration Graphs
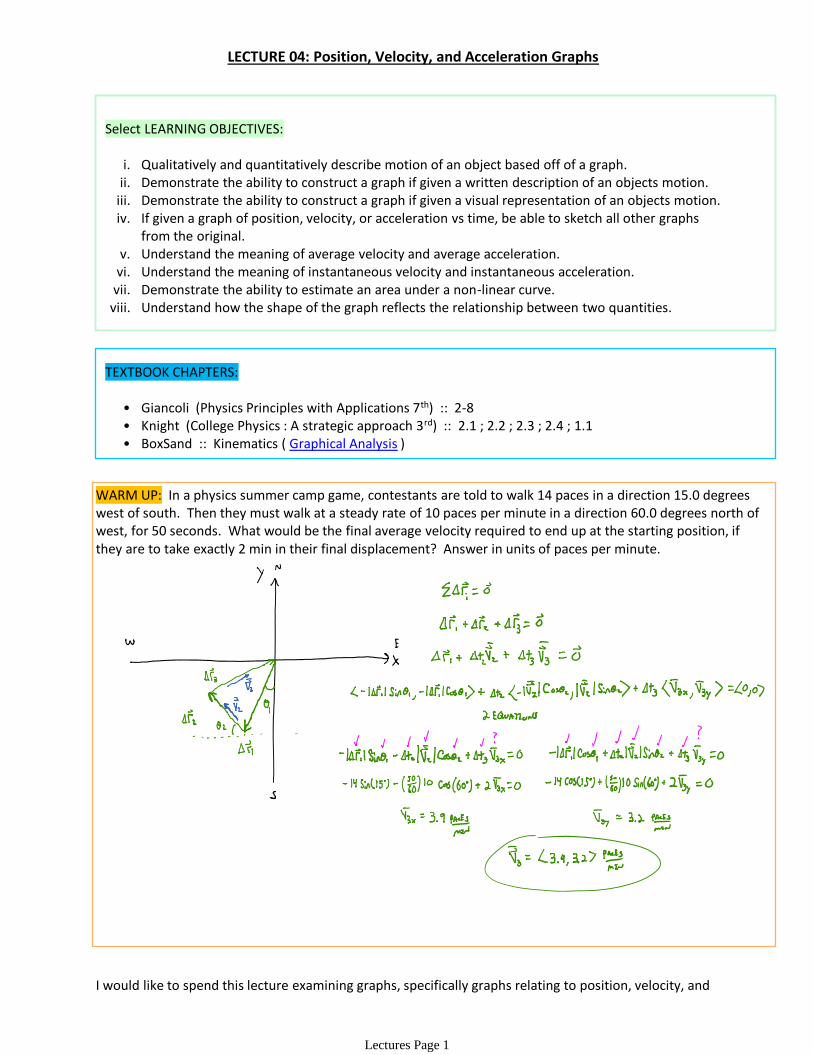
WARM UP: In a physics summer camp game, contestants are told to walk 14 paces in a direction 15.0 degrees west of south. Then they must walk at a steady rate of 10 paces per minute in a direction 60.0 degrees north of west, for 50 seconds. What would be the final average velocity required to end up at the starting position, if they are to take exactly 2 min in their final displacement? Answer in units of paces per minute.
I would like to spend this lecture examining graphs, specifically graphs relating to position, velocity, and acceleration. But why? That is, why spend time looking at pictures when we can get all the information we could
Select LEARNING OBJECTIVES:
Qualitatively and quantitatively describe motion of an object based off of a graph.i.Demonstrate the ability to construct a graph if given a written description of an objects motion.ii.Demonstrate the ability to construct a graph if given a visual representation of an objects motion.iii.If given a graph of position, velocity, or acceleration vs time, be able to sketch all other graphs from the original.
iv.
Understand the meaning of average velocity and average acceleration.v.Understand the meaning of instantaneous velocity and instantaneous acceleration.vi.Demonstrate the ability to estimate an area under a non-linear curve.vii.Understand how the shape of the graph reflects the relationship between two quantities.viii.
TEXTBOOK CHAPTERS:
Giancoli (Physics Principles with Applications 7th) :: 2-8 •Knight (College Physics : A strategic approach 3rd) :: 2.1 ; 2.2 ; 2.3 ; 2.4 ; 1.1 •BoxSand :: Kinematics ( Graphical Analysis )•
Lectures Page 1

acceleration. But why? That is, why spend time looking at pictures when we can get all the information we could ever want from mathematical equations? There are numerous reasons one might want to analyze a graph rather than an equation. Sometimes equations are long and messy, so analyzing a graph might be easier and less time consuming to extract information from. Sometimes an analytical equation might not even exist, thus graphs are a necessary tool. At the forefront of modern physics research, one might spend years of performing experiments with the net result of producing just a few graphs. Other professions also rely heavily on graphs. So it would be wise of us to start learning how to approach graphs by looking at specific examples relating to position, velocity, and acceleration.
This lecture will mostly be comprised of example and practice problems, but I would like to quickly describe how you should approach any graph that you encounter in your life. Perhaps one of the most often overlooked idea when dealing with graphs is figuring out what the axis represent. This is hopefully very easily accomplished by just looking at the axis labels. Look at the axis labels. This cannot be stressed enough, a graph is useless if you do not know what it is supposed to be representing. Once you know what quantities are being plotted against each other, then you can start the analysis process. Even throughout your analysis process, constantly check the labels on the graph to help cement which physical quantities you are dealing with.
The majority of graphical analysis we will be covering in this lecture can be summarized by the below diagram…
PRACTICE: A person initially at point P in the illustration stays there a moment and then moves along the axis to Q and stays there a moment. They then run quickly to R, stays there a moment, and then strolls slowly back to P. Which of the following position versus time graphs below correctly represents this motion?
Lectures Page 2

PRACTICE: A dog moves along a straight line and his position is plotted with respect to time as shown below. When is his speed maximum and moving in the negative direction?
PRACTICE: The figure shows a plot of an object's velocity as a function of time while traveling in a straight line. What is the value, in m/s2, of the greatest magnitude acceleration the object undergoes.
At time tB, both trains have the same velocity.1.Both trains speed up all the time.2.Both trains have the same velocity at some time before tB.3.At some instant, both trains have the same acceleration.4.At time tB, both trains have the same magnitude of displacement from t=0.5.
PRACTICE: The graphs shows position as a function of time for two trains running on parallel tracks. Which of the following statements are true:
Lectures Page 3
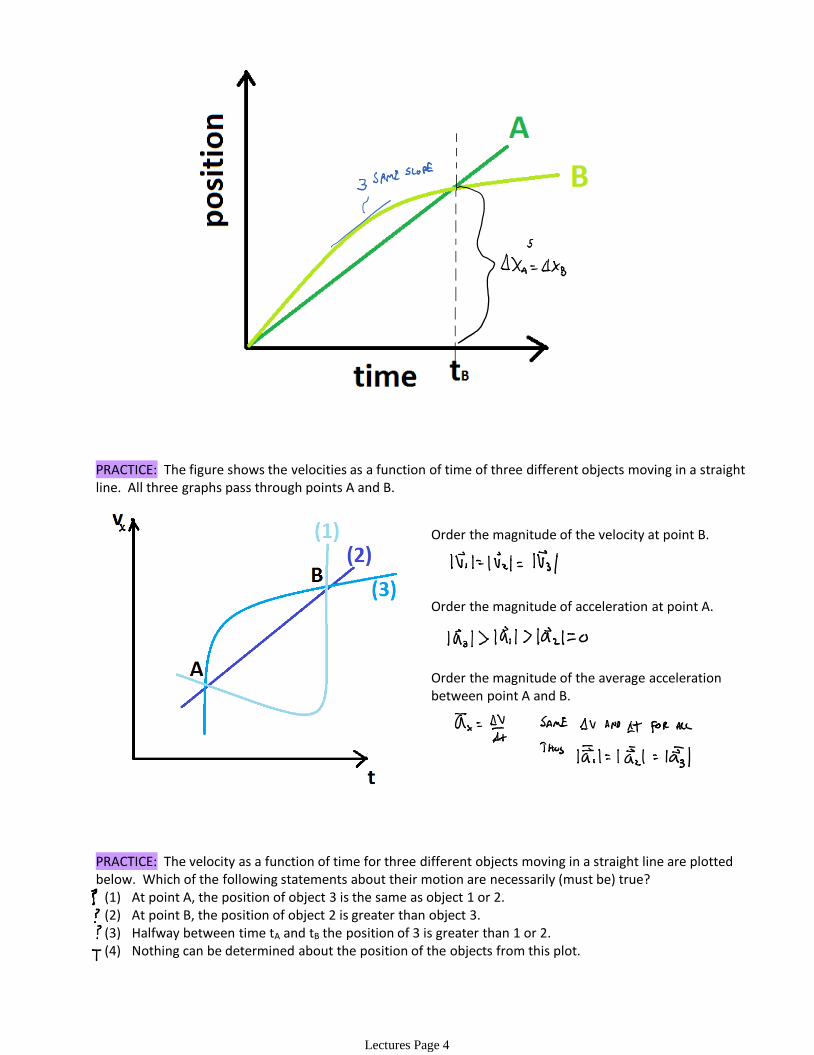
PRACTICE: The figure shows the velocities as a function of time of three different objects moving in a straight line. All three graphs pass through points A and B.
At point A, the position of object 3 is the same as object 1 or 2.(1)At point B, the position of object 2 is greater than object 3.(2)Halfway between time tA and tB the position of 3 is greater than 1 or 2. (3)Nothing can be determined about the position of the objects from this plot.(4)
PRACTICE: The velocity as a function of time for three different objects moving in a straight line are plotted below. Which of the following statements about their motion are necessarily (must be) true?
Order the magnitude of the velocity at point B.
Order the magnitude of acceleration at point A.
Order the magnitude of the average accelerationbetween point A and B.
Lectures Page 4

PRACTICE: Which of the following position as a function of time plots…
…shows an object that has the direction of velocity change duringthe motion plotted?
…shows an object that is speedingup during the entire time plotted?
…shows on object that has an acceleration with a constantdirection and magnitude?
Lectures Page 5

Distance increases.1.Distance decreases.2.Distance stays the same.3.
PRACTICE: Two balls are released from rest and undergo free-fall. Ball A is released first, followed by ball B a moment later. What happens to the distance between the balls while they are in free fall.
Conceptual questions for discussion
Two cars A and B start from rest and move for an equal amount of time on a straight line. Car A has an acceleration "a" for the first half of the total time and "2a" for the second half. Car B has an acceleration "2a" for the first half of the total time and "a" for the second half. Do the cars travel the same distance?
1)
If the velocity of an object is zero, is the acceleration of that object necessarily zero?2)The slope of a position graph is the speed. Comment on this statement. 3)The area under a velocity vs time graph for an object traveling in a straight line is the position. Likewise, the area under an acceleration vs time graph for an object traveling in a straight line is velocity. Comment on these statements.
4)
Lectures Page 6

Lectures Page 7