leaving school early: the quest for universal primary ... school early: the quest for universal...
TRANSCRIPT

Journal statistique africain, numéro 13, novembre 2011110
4. Leaving School Early: The quest for Universal Primary Education in Uganda1
Anthony Tamusuza2
AbstractTuition-free primary education has been available in Uganda for over a decade, but universal enrollment has yet to be attained, as the Net Enrollment Ratio (NER) stands at 83%. In this paper, we analyze this issue using household survey and institutional administrative data. We find that the Ugandan primary school education experience is characterized by, among other issues, over-age enrollment and elevated attrition rates. Indeed, research has shown that the median survival in primary school is less than five years. Socioeconomic status, geographic location of the school, age at initial enrollment, and child labor (but not child gender) are some of the factors that contribute to school non-attendance and dropout rates. Child labor is particularly countervailing and this paper highlights that a differentiation exists between urban and rural areas. In urban areas, children who work are more likely to attend school, in rural areas they are less likely. We highlight attrition as an area that warrants specific policy attention.
Key words: school completion, dropout rates, net enrollment, Millennium Development Goals
RésuméL’enseignement primaire est gratuit en Ouganda depuis plus d’une décennie, toutefois la scolarisation universelle n’est pas encore effective puisque le taux net de scolarisation s’établit à 83 %. Dans le présent article, nous analysons ce problème en utilisant des données issues d’une enquête sur les ménages ainsi que des données administratives et institutionnelles. Nous avons découvert que l’enseignement primaire en Ouganda se caractérise, entre autres, par l’inscrip-tion d’enfants ayant dépassé l’âge scolaire et par les taux d’attrition élevés. En fait, des études ont montré que la durée médiane de survie dans l’enseignement primaire est inférieure à cinq ans. La situation socioéconomique, l’emplacement géographique de l’établissement scolaire, l’âge de la première inscription et le travail des enfants (et non le sexe de l’enfant) sont parmi les facteurs qui dé-terminent les taux d’absences et de décrochages scolaires. Le travail des enfants est un facteur particulièrement contraignant mais, à ce sujet, le présent article
1 Acknowledgments: I am grateful to the Ugandan Bureau of Statistics for providing access to the data, and for comments from Shannon Patty and two anonymous reviewers on an earlier draft.2 Anthony Tamusuza works in Iraq for the Inter-Agency Information and Analysis Unit (IAU) of the United Nations, email: [email protected]. The views expressed in this paper are those of the author and do not reflect those of the United Nations.

The African Statistical Journal, Volume 13, November 2011 111
4. Leaving School Early: The Quest for Universal Primary Education in Uganda
souligne qu’il y a une différence entre les zones urbaines et rurales. Les enfants des zones urbaines qui travaillent ont plus de chances d’aller à l’école que ceux des zones rurales. Nous avons, par ailleurs, souligné que l’attrition est un aspect qui requiert une attention particulière de la part des pouvoirs publics.
Mots clefs : achèvement du cycle d’enseignement, taux de décrochages, taux net de scolarisation, Objectifs du Millénaire pour le développement
1. INTRODUCTION
In 1997, Uganda implemented a primary schools “no tuition” program which, among other things, eliminated monetary costs for all children attending public primary schools. The aim was to get all children in the country attending primary school. The program has been largely successful, but the country has yet to attain universal primary education, since over 15% of eligible children (aged 6–12 years) are not in school. This paper uses household survey data to gain some insight into why, in spite of the removal of the tuition barrier, this is so.
In the year 2000, world leaders endorsed the Millennium Development Goal Number Two. This enshrined the principle that by the year 2015, children everywhere – boys and girls alike – should complete a full course of primary schooling. To measure progress toward achievement this goal, three indicators were chosen: (i) the Net Enrollment Ratio (NER), (ii) the proportion of pupils starting Grade One who reach the last grade of primary education, and (iii) the literacy rate of the youth aged 15–24.
Predating the UN MDG Conference, Uganda had already introduced tuition-free primary education in 1997. The program has been hugely successful in a number of areas: in increasing access to education, especially for the poor; removing bias toward girls; improving school infrastructure; and in increasing budgetary allocation to the education sector. Nonetheless, there are several challenges remaining: notably, to attain universal enrollment and low primary school completion rates. Using household survey data, we attempt to gain insight into the demand-side constraints that prevent full enrollment and which lead to high primary school attrition rates.
1.1 The Ugandan education system
The Ugandan education system has primary, secondary, vocational, and ter-tiary levels. The system includes seven years of primary education, officially
Journal statistique africain, numéro 13, novembre 2011112
Anthony Tamusuza
for pupils aged 6–12 years, followed by six years of secondary education. In 2010, 22% of the population aged 6–12 attended primary school. There are seven grades of primary education, referred to as Primary 1 through Primary 7, abbreviated as P1, P2, P3, P4, P5, P6, and P7. As of 2010, there were about 16,000 primary schools in the country, and approximately 75% of these were government owned, that is, by the Ministry of Education and Sports (MOES 2008a). At the end of P7, students sit terminal exams, and depending on their academic performance, they may proceed to secondary or vocational education.
1.2 The universal primary education (UPE) program in Uganda
An Education Policy Review Commission was inaugurated in 1987 to review all sectors of education in the country (MOES 1998). This Commission, after extensive consultation with the stakeholders, promulgated the idea of universal primary education (UPE). The Commission recognized that “only when every child is enrolled at the right age and does not leave school without completing the full cycle of primary education” would all citizens be equipped with the basic education they would need to lead a full and productive life. Universal primary education was also seen as a way of helping to transform society, fostering greater unity among the people, higher moral standards, and an accelerated growth of the economy. The ideas of the Commission were synthesized in a White Paper on Education, which was published in 1992. This ultimately led to the introduction of free primary education in 1997.
Initially, the policy envisioned the provision of free primary education for up to four children per family. However, the government quickly realized that this restriction would be too complicated to implement, therefore a decision was made to change the policy, so that all pupils wishing to access education would qualify for free tuition.
To concretize the policy, a Capitation Grant was introduced. This was to be used for purchasing instructional materials such as textbooks, with the amount contingent on the number of pupils enrolled in each school. A School Facilitation Grant was also introduced, to be used for infrastructure, namely the construction of classrooms and teachers’ houses. With the de-centralization policy in place, the financing arrangement allowed funds to be transmitted by the central government to local governments (via the District Administration Officer), who in turn would pass them on to the schools.
The UPE program emphasized gender equality. The initial provision was that of the four children per family to be given free tuition, two should be

The African Statistical Journal, Volume 13, November 2011 113
4. Leaving School Early: The Quest for Universal Primary Education in Uganda
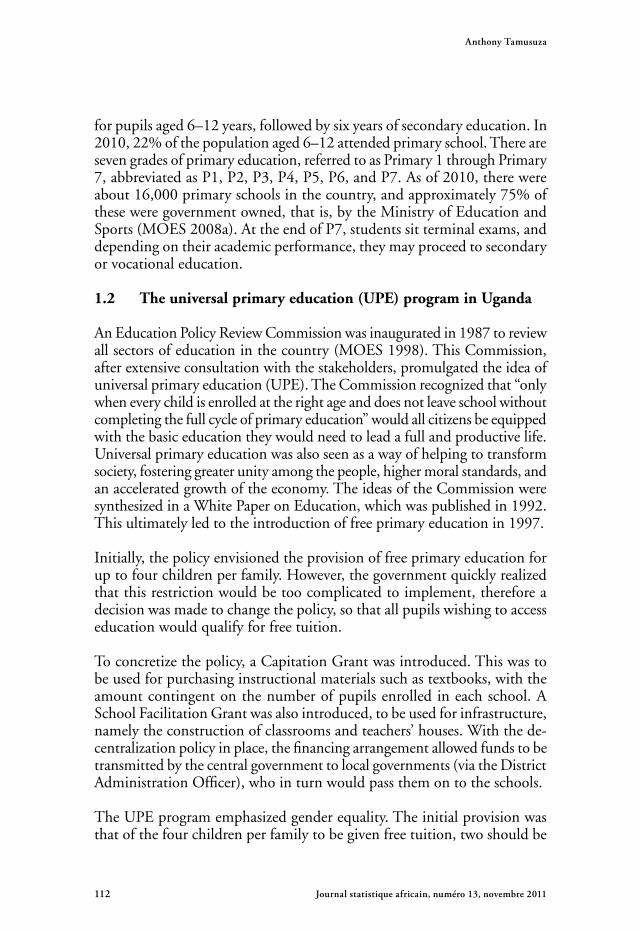
girls (where applicable). In addition, practical steps were taken by govern-ment officials to encourage girls’ parents to enroll their daughters in school. Primary education was not made entirely free though, as parents were expected to contribute toward other costs like pens, exercise books, school uniform and sportswear, transportation to and from school, and meals at school. Table 1 provides a synopsis of the implementation of the UPE policy.
Table 1: Implementation of the UPE program(a) Year of fee abo-
lition1997
(b) Approach Initially, only four pupils per family were allowed free tuition, but this restriction was later removed.
(c) Was fee aboli-tion part of wider policy reform?
Yes, curricula were changed, disadvantaged and itinerant children were brought into the school system, and teachers were trained.
(d) Driving force/ political lead-ership
UPE was announced as an Election Manifesto issue by the President. (See Stasavage 2005).
(e) Prior planning Yes
(f ) Communica-tion of new policy
Sensitization seminars were held at national and district levels with political, administrative, and religious leaders.
Announcements in the media, e.g. radio and newspapers.
Handbook clarifying different stakeholders’ roles published by MOES in 1998.
(g) Nature of fees abolished/type
Tuition fees, school development charges, textbooks, terminal Primary School Examination fees were waived for parents and paid for by the Government.
Parents were to provide lunches, school uniforms, pencils and pens and exercise books; and were expected to contribute labor to school construction.
(h) Nature of fees abolished/ for which grades?
Fees for all grades in primary education were abolished. Oth-er schooling costs remained: e.g. meals at school, uniform, exercise books, pens and pencils.
(i) Sequencing/ phasing by age, grade, over time
Initially restricted to four pupils per family. This restriction was quickly removed because the Government realized it was not feasible to implement.

Journal statistique africain, numéro 13, novembre 2011114
Anthony Tamusuza
(j) Grant size and mechanism for transfer-ring revenues to schools to replace fees
Capitation Grant used for purchasing instructional materials like textbooks.
School Facilitation Grant (SFG) used for infrastructure, e.g. classrooms and teachers’ houses. Hence the grant size was dependent on total enrollment per school.
Funds transferred to districts, which further transmitted the money to the primary schools.
The Local Government Statute of 1993 decentralized the administration and management of government primary schools to District Councils and School Management Com-mittees.
(k) Includes pri-vate schools?
No. Private schools must confirm to MOES guidelines, but are not funded by central government.
(l) Increase in primary school enrollment
Rose from 2.7 million in 1997 to 7.3 million pupils in 2003.
(m) Gender Parity Index (girls/boys)
Right from the beginning, Government emphasized that the policy was gender-neutral. Currently, half of all pupils are girls.
(n) Primary Pupil–Teacher Ratio (PTR)
National average is 50:1. Wide rural/urban and regional vari-ations: the worst-off districts have a PTR that exceeds 100:1. Lower grades have higher PTR ratios in the range of 70:1. (Byamugisha and Ogawa 2010; Makerere University Institute of Social Research 2009; MOES 2008a.)
(o) Coping strate-gies to address enrollment surge and pro-tect quality
Education budgetary realignment: e.g. education was al-located an increased share of the national budget from 7% in 1990 to about 24% in 2003.
Share of primary education in total education budget in-creased. Increased donor support.
Funds flow better between central government and schools. (See Ablo and Reinikka 1998.)
The African Statistical Journal, Volume 13, November 2011 115
4. Leaving School Early: The Quest for Universal Primary Education in Uganda
(p) Benefits of primary school fee abolition
Universal Secondary Education (USE) policy has been in place since 2007. It is an indirect consequence of UPE.
Higher enrollment of children with special education needs.
More infrastructure: newer schools and classrooms have been constructed; desks, textbooks have been provided.
Increased enrollment of girls, leading to gender parity.
Increase (in number and proportion) of trained teachers.
Decentralized teachers’ recruitment and transfers made at the district level, instead of centrally, thus decisions are made locally.
(q) Donor support Yes. From inception to present. Overseas Development As-sistance is about 8% of the education budget.
Sources: World Bank/UNICEF (2009a); MOES (1998, 1999, 2004a, and 2008a).
1.3 Achievements of the UPE program
Total enrollment in primary school has risen dramatically, from around 3 million pupils in 1997 to about 7.6 million currently, according to the latest Uganda Ministry of Education and Sports (MOES) data. The reduction in costs related to schooling have also led to the elimination of the gender bias in accessing primary education and to increased access to primary education by the poor (Deininger 2003).
In addition to increased enrollment, the UPE policy has resulted in an improvement in the quality of the primary education system. The share of education in the national budget increased from approximately 7% in 1990 to about 24% in 2003, although this was reduced to about 16% for the 2011/2012 financial year (MFPED 2011). Gender bias toward boys has been removed, while infrastructure, teacher training, and teacher avail-ability have all improved.
1.4 Challenges of universal enrollment
Notwithstanding the achievements of the UPE program in Uganda, con-straints to attaining universal primary school enrollment persist. Data from various household surveys over the last decade estimate the Net Attendance Ratio3 (NER) for children age 6–12 in primary school to be in the range of
3 Net primary school enrollment is defined as the percentage of primary-school-age chil-dren (6–12) enrolled in school. Strictly speaking, household surveys and censuses measure attendance, and not enrollment, which would be measured using school records. Thus the

Journal statistique africain, numéro 13, novembre 2011116
Anthony Tamusuza
85%. For example, nine years after the UPE program was implemented, in the 2010 Uganda National Household Survey (UNHS), the NER was 83%.
Figure 1 shows that the primary school NER has been fairly stable over the years, and was measured at 87% in the 2001 Uganda Demographic and Health Survey (UDES). There are subtle differences between the surveys, but these may be attributed to a lack of uniformity in questionnaire word-ing, survey concepts, and procedures. Further, sampling errors were noted between the surveys, which do not necessarily reflect actual changes in the estimated NER. Notably, in the 2002 Census, which is devoid of any sampling errors, the NER was 86%.
Figure 1: Primary school Net Enrollment Ratio (NER), children aged 6–12 (%)
Sources: UNHS-Uganda National Household Survey 2010; UDHS-Uganda Demographic & Health Survey 2001; NSDS-National Service Delivery Survey.
1.5 Justifying universal education
At the most basic level, there is an obvious positive spillover effect for so-ciety from having an educated and literate population. Education leads to higher incomes and is a direct path out of poverty. In addition, there are
rates published are in fact net attendance rates. But we use the term enrollment, without loss of generality, to imply attendance.
UNHS 1999/2000
UDES 2001
Census 2002
UNHS 2002/2003
UNHS 2005/06
UDHS 2006
NSDS 2008
UNHS 2009/2010
Net Enrollment Rate
Survey year
0 20 40 60 80 100

The African Statistical Journal, Volume 13, November 2011 117
4. Leaving School Early: The Quest for Universal Primary Education in Uganda
positive externalities for the individual and for society as a whole. These may include healthier individuals, leading to longer life expectancies and less medical expenditure. Teenage children with educated mothers are less likely to become pregnant (Vila 2002). Using data from Ethiopia, Doyle and Weale (1994) also highlight the correlation between education, fertil-ity, and economic growth. Increasing educational outcomes in a developing country context like Uganda is even more important since education is a pathway out of poverty. For example, Deininger (2003) estimates that if the median level of education were to increase to seven years, then household incomes would grow by an average of 2.5%.
Lutz et al. (2008) argue that complementing primary education with some secondary education gives an even stronger boost to economic growth. They show that GDP growth estimates might be five times higher if this policy were introduced.
A policy brief issued by the International Institute for Applied Systems Analysis (IIASA 2008), using cross-country economic growth data from over 100 countries, shows unambiguously that education is a fundamental determinant of a nation’s health, demographic trends, personal income, and the country’s overall level of economic growth. Education is also a neces-sary precondition for long-term economic growth. The researchers also advise making universal secondary education a goal, to give poor countries the human capital boost that is necessary to bring large segments of the population out of poverty.
Education for girls has been shown to have far-reaching benefits. Hill and King (1995) estimate that a 10% increase in girls’ primary enrollment would decrease infant mortality by 4.1 deaths per 1,000 live births. They also demonstrate that a similar rise in girls’ secondary enrollment leads to a further reduction of 5.6 deaths per 1,000 live births. Educated mothers are likely to have fewer children, healthier families, higher incomes, and are more likely to send their children to school. Education for girls also has a strong positive impact later, on the health outcomes of their children with respect to immunization rates and family nutrition.
Education, in addition to being a goal in itself, is a powerful driver of progress toward the other MDGs (Bruns et al. 2003). Research indicates that education for boys and girls is an effective preventive weapon against HIV/AIDS. Better education also contributes to natural resource manage-ment, including preservation of tropical rain forests (UN Millennium Project 2005). However, Bruns et al. note that most of the positive externalities

Journal statistique africain, numéro 13, novembre 2011118
Anthony Tamusuza
associated with primary education require that children complete at least five years of schooling.
1.6 Constraints to school enrollment
Child Labor: One of the most serious obstacles to school enrollment is child labor. Children who work tend to have erratic school attendance and poor concentration in class. For example, using household survey data from Bolivia and Venezuela, Psacharopoulos (1997) found a link between child labor and reduced educational attainment, as measured by grade repeti-tion. Guarcello et al. (2008) also identify child labor as a major obstacle to achieving universal primary education and other development goals.
Children from poor households are particularly vulnerable because the op-portunity cost of schooling is substantially higher for them. Such children may have to work in the fields, grazing the family’s animals or protecting crops against predators. Both Psacharopoulos (1997) and Priva (1999) found that children from poor households who work contribute significantly to total household income. Priva argues that banning child labor could reduce the welfare of the households intending to send their children to work. Wig-gins and Deshingkar (2007), for their part, point out that the prohibition of child labor hardly ever makes any impact in rural areas.
Cost: Another major constraint to school attendance is the cost involved. Apart from tuition, there are other monetary charges, and these include registration and exam fees, uniform and sports equipment, books and supplies, food for lunch, and travel costs. To illustrate, in the UDES survey, almost one in four of children mentioned the monetary costs as a reason for non-attendance at school. Especially for poor households, the direct monetary costs of school-ing may be prohibitive. For example, Deininger (2003) found that in 1992, attendance for children aged 6–12 was only 46% in the poorest quintile, compared to 82% in the richest quintile. However, by 1997 this disparity had narrowed and attendance in primary school had risen to about 78% for the poorest quintile compared to 89% for the richest quintile.
Dropout rate: Using household survey data from 44 Demographic and Health Surveys carried out in 35 different countries, Filmer and Pritchett (1998) found that in some countries the poor enroll at the lower grades, but then drop out “in droves,” while in other countries the poor never bother to enroll in the first place. Both patterns lead to lower attainment by the poor. They also highlighted huge differences in enrollment and attainment between the poor and the wealthy.
The African Statistical Journal, Volume 13, November 2011 119
4. Leaving School Early: The Quest for Universal Primary Education in Uganda
Gender: Other factors that affect enrollment include the gender of the child. Burke and Beegle (2004) found that female parents may favor girls, in that the mother’s schooling is associated to a greater degree with a daughter’s attendance than a son’s attendance. A correlation has also been documented between low attendance at school and children from ethnic minorities, children who are disabled, and children in conflict or post-conflict regions. Moreover, where these issues exist, they tend to exacerbate the gender dif-ferences.
Residence: Children living in rural areas are less likely to attend school be-cause the distances are greater, the facilities are poorer, and the need for child labor is greater. In particular, younger children are affected by the distance to school since they are less able to walk sizable distances. Moreover, poorer households are more likely to be rural than urban (Filmer and Pritchett 1998). Poor households spend more proportionately on education than do the rich (Kadzimira and Rose 2003), which means that they have less money to spend on other household necessities like food and medical bills.
Birth order: Birth order also affects schooling. We may start with the premise that a large number of children in a household has negative causal effects on the quality of education. This is because given equal resources, parents with more children have less resources to commit per child than parents with fewer children. Park and Chung (2007) found a strong but negative causal relationship between sibship size and education of the first-born and second-born children in rural Bangladesh. Using evidence from the Turk-ish Demographic and Health Survey, Kirdar et al. (2007) also concluded that birth order affects schooling, to the detriment of the middle children. They found this impact to be more pronounced in poor families, and they maintain that scarce financial resources are the underlying cause of this birth order effect.
Infrastructure and other factors: Other barriers that hinder children’s schooling include the following: poor school infrastructure; teacher short-ages and absence; lack of school meals; long distance to school; insufficient sanitary facilities at school; limited employment opportunities after school; civil insecurity; cultural practices like early marriages; preference of boys’ education over girls; and truancy.

Journal statistique africain, numéro 13, novembre 2011120
Anthony Tamusuza
2. METHODOLOGY
2.1 The data
Enrollment rates from primary school administrative databases: The Uganda Ministry of Education and Sports (MOES) publishes annual en-rollment estimates using data from school records submitted by primary school administration in the Education Abstract. These data have been used in the descriptive analysis of this paper.
Data from national household surveys: The study also analyzes data from four nationally representative household surveys carried out over the last decade: the UDES, 2001; and the Uganda National Household Surveys (UNHS) 2002/03, 2005/06 and 2009/2010. The UNHS were modeled on the World Bank’s Living Standards Measurement Studies (LSMS). The UDES covered about 4,200 households and 11,600 school-age children and was linked to the 2000–2001 Uganda Demographic and Health Survey (DHS). The survey was fielded from April to July 2001. For the UNHS, data were collected using face-to-face interviews during the periods: May 2002–April 2003, May 2005–April 2006, and May 2009–April 2010.
Because the UDES surveyed the same households as the 2000 Uganda De-mographic and Health Survey, it was possible to use information from the 2000 DHS, such as household wealth quintiles, by linking the two surveys.
2.2 Analysis
We analyzed household survey data in order to identify the correlates to primary school enrollment. First, we present descriptive statistics and also use logistic regression to identify factors that are associated with schooling.
Second, the survival analysis approach is used to gain further insight into the factors related to children’s survival through to final grade, and the timing of children dropping out of school. A discrete-time Cox regression model using SAS’s PROC PHREG is used to identify the covariates relating to the duration of schooling. We use the highest level attained to approximate dura-tion in school for children aged 6–14 for the three UNHS surveys. We use current schooling status to compute duration in school for children attending school at the time of the survey; the level at which the child left to estimate duration in years that these children spent in school. By definition, we treat children attending school at the time of the survey as censored, since we do not know if or when they will drop out of school. We include only time-

The African Statistical Journal, Volume 13, November 2011 121
4. Leaving School Early: The Quest for Universal Primary Education in Uganda
invariant variables in the regression because the survey was cross-sectional, and does not have any time-dependent covariates. We include the follow-ing covariates in the Cox regression model: age, household size, region and gender of the household head, gender of child, poverty status, child labor status, urban/rural location, household assets, electricity, household owning a business, school in the community, orphan status, and household head’s age. We include a dummy for age of child less than 9 as one of the covariates.
Third, we use binary logistic regression, and more specifically the direct modeling approach (Chao-Ying et al. 2002), to regress the attendance indicator on the following predictor variables: age of child; hhsize: the size of the household; log_vall, natural log of total household expenditure in nominal Uganda shillings; waterdist1: dummy, 1 if distance to water source is greater than 1km, 0 otherwise; electric: 1 if the household has electric power for cooking, lighting or both purposes; chilabor: 1 if the child en-gages in child labor, 0 otherwise; hasbizz: 1 if the household owned any business, 0 otherwise; farms 1 if the household is a farming household, 0 otherwise; comschol: 1 if the community has a school located in it; orphan: 1 if the child is an orphan who lost both parents; headage1: age in years of household head; dummies for region of residence, North, East, Central, West; we also include sexhead: 1 if gender of household head is male, 0 if female; sexchild: dummy for sex of child, 1 is male, 0 is female; poor4: dummy is 1 if the household is poor, 0 if not poor; urban: dummy of rural/urban loca-tion; PAeduc: Household head has at least primary education; and log_assets: natural log of household assets valued in nominal Uganda shillings in 2005. To account for interaction effects, we include several interaction terms in the regression model as follows: chilabor * urban, chilabor * sexofchild and sexhead * sexofchild. However, there was no interaction effect found, thus these interactions were removed from subsequent models.
The logistic model used can be specified as follows:
9
Third, we use binary logistic regression, and more specifically the direct modeling approach
(Chao-Ying et al. 2002), to regress the attendance indicator on the following predictor
variables: age of child; hhsize: the size if the household; log_vall, natural log of total
household expenditure in nominal Uganda shillings; waterdist1: dummy, 1 if distance to water
source is greater than 1km, 0 otherwise; electric: 1 if the household has electric power for
cooking, lighting or both purposes; chilabor: 1 if the child engages in child labor, 0 otherwise;
hasbizz: 1 if the household owned any business, 0 otherwise; farms 1 if the household is a
farming household, 0 otherwise; comschol: 1 if the community has a school located in it;
orphan: 1 if the child is an orphan who lost both parents; headage1: age in years of household
head; dummies for region of residence, North, East, Central, West; we also include sexhead: 1
if gender of household head is male, 0 if female; sexchild: dummy for sex of child, 1 is male, 0
is female; poor4: dummy is 1 if the household is poor, 0 if not poor; urban: dummy of
rural/urban location; PAeduc: education of Household head has at least primary education; and
log_assets: natural log of household assets valued in nominal Uganda shillings in 2005. To
account for interaction effects, we include several interaction terms in the regression model as
follows: chilabor * urban, chilabor * sexofchild and sexhead * sexofchild. However, there was
no interaction effect found, thus these interactions were removed from subsequent models.
The logistic model used can be specified as follows:
logit [ π(x) ] = α + β1x1 + β2x2 + . . . + βnxn (1)
where π(x) = P(Y=1) and α is the intercept. Y=1 if the child (aged 6–14) attends primary
school and Y=0 if s/he does not. While we acknowledge that the official age range for
attending primary school is 6 through 12, we adopt the approach taken by Guarcello et al.
(2008) of extending the analysis beyond age 12, to include children aged 13 and 14. This
approach takes into account a considerable proportion of children 13 and 14 who were still
attending primary school.
Fourth, we employ a discrete-time logistic model to identify the timing of dropping out of
school for the children who have enrolled. This approach allows for the identification of the
risk of dropping out of primary school in each grade (Singer and Willett 1993). Time period is
the duration of schooling, and in the absence of repetition, it coincides with the class/grade of
child.
We repeat the regressions for three surveys: the UDES, the 2005 and 2010 UNHS surveys.
2.3 Limitations of the data
The Uganda Ministry of Education and Sports (MOES) uses data from school records
submitted by primary school administrations. These estimates are consistently higher than the
survey estimates. For example, the Ministry estimated the NER to be 93% in 2007 and 95% in
2008. Because of methodological and reporting differences, the MOES estimates will not
necessarily be identical to the household survey estimates. Some schools did not respond to the
Ministry’s request for information: in 2007 the response rate was around 74%, and in 2008
about 83%.
4 A hous e ho ld was c las s ifie d as poor (o r no t ) by UBOS aft e r e xt e ns ive p roce s s ing and
ad jus t m e nt s t o t he e xpe nd it ure da t a . For a com ple t e de s c rip t ion o f t he ad jus t m e nt s and t he
pove rt y c las s ifica t ion p roce dure , s e e Chap t e r 6 (p .4 9 -6 9 ) o f t he UNHS 2 0 0 5 / 0 6 s urve y
re port .
(1)
where
9
Third, we use binary logistic regression, and more specifically the direct modeling approach
(Chao-Ying et al. 2002), to regress the attendance indicator on the following predictor
variables: age of child; hhsize: the size if the household; log_vall, natural log of total
household expenditure in nominal Uganda shillings; waterdist1: dummy, 1 if distance to water
source is greater than 1km, 0 otherwise; electric: 1 if the household has electric power for
cooking, lighting or both purposes; chilabor: 1 if the child engages in child labor, 0 otherwise;
hasbizz: 1 if the household owned any business, 0 otherwise; farms 1 if the household is a
farming household, 0 otherwise; comschol: 1 if the community has a school located in it;
orphan: 1 if the child is an orphan who lost both parents; headage1: age in years of household
head; dummies for region of residence, North, East, Central, West; we also include sexhead: 1
if gender of household head is male, 0 if female; sexchild: dummy for sex of child, 1 is male, 0
is female; poor4: dummy is 1 if the household is poor, 0 if not poor; urban: dummy of
rural/urban location; PAeduc: education of Household head has at least primary education; and
log_assets: natural log of household assets valued in nominal Uganda shillings in 2005. To
account for interaction effects, we include several interaction terms in the regression model as
follows: chilabor * urban, chilabor * sexofchild and sexhead * sexofchild. However, there was
no interaction effect found, thus these interactions were removed from subsequent models.
The logistic model used can be specified as follows:
logit [ π(x) ] = α + β1x1 + β2x2 + . . . + βnxn (1)
where π(x) = P(Y=1) and α is the intercept. Y=1 if the child (aged 6–14) attends primary
school and Y=0 if s/he does not. While we acknowledge that the official age range for
attending primary school is 6 through 12, we adopt the approach taken by Guarcello et al.
(2008) of extending the analysis beyond age 12, to include children aged 13 and 14. This
approach takes into account a considerable proportion of children 13 and 14 who were still
attending primary school.
Fourth, we employ a discrete-time logistic model to identify the timing of dropping out of
school for the children who have enrolled. This approach allows for the identification of the
risk of dropping out of primary school in each grade (Singer and Willett 1993). Time period is
the duration of schooling, and in the absence of repetition, it coincides with the class/grade of
child.
We repeat the regressions for three surveys: the UDES, the 2005 and 2010 UNHS surveys.
2.3 Limitations of the data
The Uganda Ministry of Education and Sports (MOES) uses data from school records
submitted by primary school administrations. These estimates are consistently higher than the
survey estimates. For example, the Ministry estimated the NER to be 93% in 2007 and 95% in
2008. Because of methodological and reporting differences, the MOES estimates will not
necessarily be identical to the household survey estimates. Some schools did not respond to the
Ministry’s request for information: in 2007 the response rate was around 74%, and in 2008
about 83%.
4 A hous e ho ld was c las s ifie d as poor (o r no t ) by UBOS aft e r e xt e ns ive p roce s s ing and
ad jus t m e nt s t o t he e xpe nd it ure da t a . For a com ple t e de s c rip t ion o f t he ad jus t m e nt s and t he
pove rt y c las s ifica t ion p roce dure , s e e Chap t e r 6 (p .4 9 -6 9 ) o f t he UNHS 2 0 0 5 / 0 6 s urve y
re port .
is the intercept. Y=1 if the child (aged 6–14) attends primary school and Y=0 if s/he does not. While we acknowledge that the official age range for attending primary school is 6 through 12, we adopt the approach taken by Guarcello et al. (2008) of extending the
4 A household was classified as poor (or not) by UBOS after extensive processing and adjustments to the expenditure data. For a complete description of the adjustments and the poverty classification procedure, see Chapter 6 (pp.49-69) of the UNHS 2005/06 survey report.

Journal statistique africain, numéro 13, novembre 2011122
Anthony Tamusuza
analysis beyond age 12, to include children aged 13 and 14. This approach takes into account a considerable proportion of children aged 13 and 14 who are still attending primary school.
Fourth, we employ a discrete-time logistic model to identify the timing of dropping out of school for the children who have enrolled. This approach allows for the identification of the risk of dropping out of primary school in each grade (Singer and Willett 1993). Time period is the duration of school-ing, and in the absence of repetition, it coincides with the class/grade of child.
We repeat the regressions for three surveys: the UDES, the 2005 and 2010 UNHS surveys.
2.3 Limitations of the data
The Ugandan Ministry of Education and Sports (MOES) uses data from school records submitted by primary school administrations. These esti-mates are consistently higher than the survey estimates. For example, the Ministry estimated the NER to be 93% in 2007 and 95% in 2008. Because of methodological and reporting differences, the MOES estimates will not necessarily be identical to the household survey estimates. Some schools did not respond to the Ministry’s request for information: in 2007 the response rate was around 74%, and in 2008 about 83%.
On the other hand, surveys interview the general household population, while the Ministry collates data from schools, including pupil ages. Pupil ages are critical for accurately calculating the NER but they are probably not accurately reported by school heads. Furthermore, because government school fund allocations are based on pupil enrollment, there may be a mo-tivation for school officials to inflate pupil numbers (IOB 2008; anecdotal press reports).
Because the multivariate analysis is based on three surveys, some of the in-dependent variables were not available in all surveys. This made it difficult to account for all possible differences in enrollment rates, which constrained the power of the regression models.
3. RESULTS
The implementation of the universal primary education program has re-sulted in a considerable increase in the enrollment of children. Trend data
The African Statistical Journal, Volume 13, November 2011 123
4. Leaving School Early: The Quest for Universal Primary Education in Uganda
from the MOES show that total enrollment in primary school increased from 3.1 million in 1996 to 5.2 million in 1997.
3.1 Constraints to UPE in Uganda
Analysis of household survey data reveals several principal factors that hinder the attainment of universal primary education (UPE). Some children never enroll in school; other children start attending primary school at an age that is later than the official age (“over-age attendance”), while some children attend primary school only to drop out later before completing the primary education cycle. Collectively, all these reasons, which are analyzed below, contribute to bring down the NER statistic.
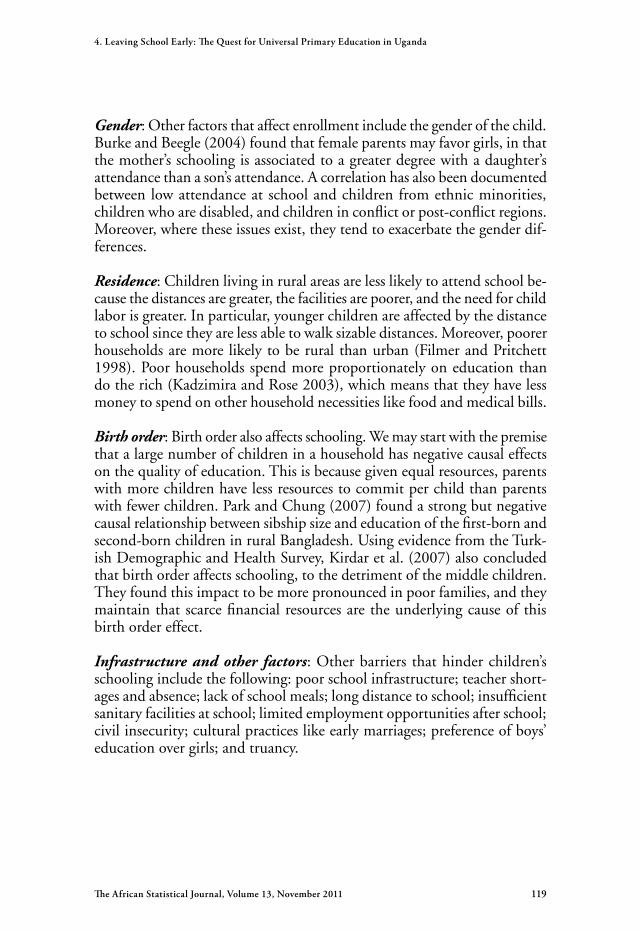
Over-age attendanceOne of the indicators of the extent of over-age children attending primary school is the Gross Enrollment Ratio (GER). This is defined as the total enrollment in primary education (including those outside the relevant age range) as a ratio of the official school-age population. Thus, the primary school GER is the total population in primary school over the population aged 6–12 years. The results show that Uganda compares poorly with the rest of Sub-Saharan Africa, whose average gross enrollment is 102% (UNESCO 2011). Table 2a shows that there are many children attending primary education outside the official primary school age range of 6–12 years. Table 2a also indicates that the GER has declined over the past decade, and that the gender gap has been reducing over time.
Table 2a: Gross Enrollment Ratio (GER) by surveySurvey (Year) Male Female Total
UDES (2001) 132 124 128
Population Census (2002) 130 124 127
UNHS (2005/2006) 129 125 127
UNHS (2009/2010) 121 120 120
Sources: UDES, 2001; Uganda Population and Housing Census, 2002; UNHS, 2005/06 and 2009/2010.
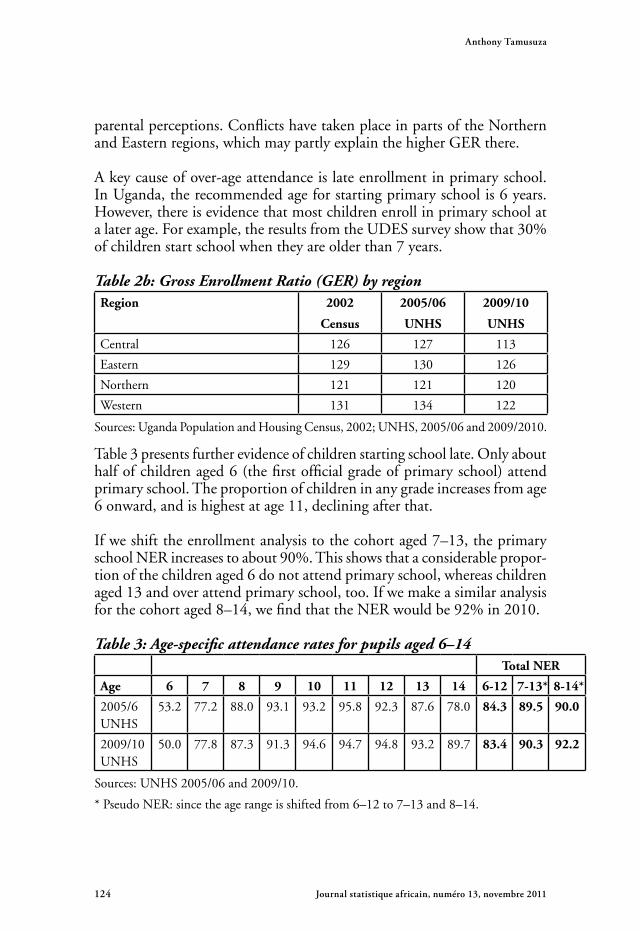
Table 2b shows the GER by region. The Western and Eastern regions evidence the highest GER, while the Northern region has the lowest. In 2009/10, the Western region had the highest GER. A higher GER may reflect high repetition rates among pupils, as well as late entry due to civil strife and
Journal statistique africain, numéro 13, novembre 2011124
Anthony Tamusuza
parental perceptions. Conflicts have taken place in parts of the Northern and Eastern regions, which may partly explain the higher GER there.
A key cause of over-age attendance is late enrollment in primary school. In Uganda, the recommended age for starting primary school is 6 years. However, there is evidence that most children enroll in primary school at a later age. For example, the results from the UDES survey show that 30% of children start school when they are older than 7 years.
Table 2b: Gross Enrollment Ratio (GER) by regionRegion 2002
Census
2005/06
UNHS
2009/10
UNHS
Central 126 127 113
Eastern 129 130 126
Northern 121 121 120
Western 131 134 122
Sources: Uganda Population and Housing Census, 2002; UNHS, 2005/06 and 2009/2010.
Table 3 presents further evidence of children starting school late. Only about half of children aged 6 (the first official grade of primary school) attend primary school. The proportion of children in any grade increases from age 6 onward, and is highest at age 11, declining after that.
If we shift the enrollment analysis to the cohort aged 7–13, the primary school NER increases to about 90%. This shows that a considerable propor-tion of the children aged 6 do not attend primary school, whereas children aged 13 and over attend primary school, too. If we make a similar analysis for the cohort aged 8–14, we find that the NER would be 92% in 2010.
Table 3: Age-specific attendance rates for pupils aged 6–14Total NER
Age 6 7 8 9 10 11 12 13 14 6-12 7-13* 8-14*
2005/6 UNHS
53.2 77.2 88.0 93.1 93.2 95.8 92.3 87.6 78.0 84.3 89.5 90.0
2009/10 UNHS
50.0 77.8 87.3 91.3 94.6 94.7 94.8 93.2 89.7 83.4 90.3 92.2
Sources: UNHS 2005/06 and 2009/10.
* Pseudo NER: since the age range is shifted from 6–12 to 7–13 and 8–14.
The African Statistical Journal, Volume 13, November 2011 125
4. Leaving School Early: The Quest for Universal Primary Education in Uganda
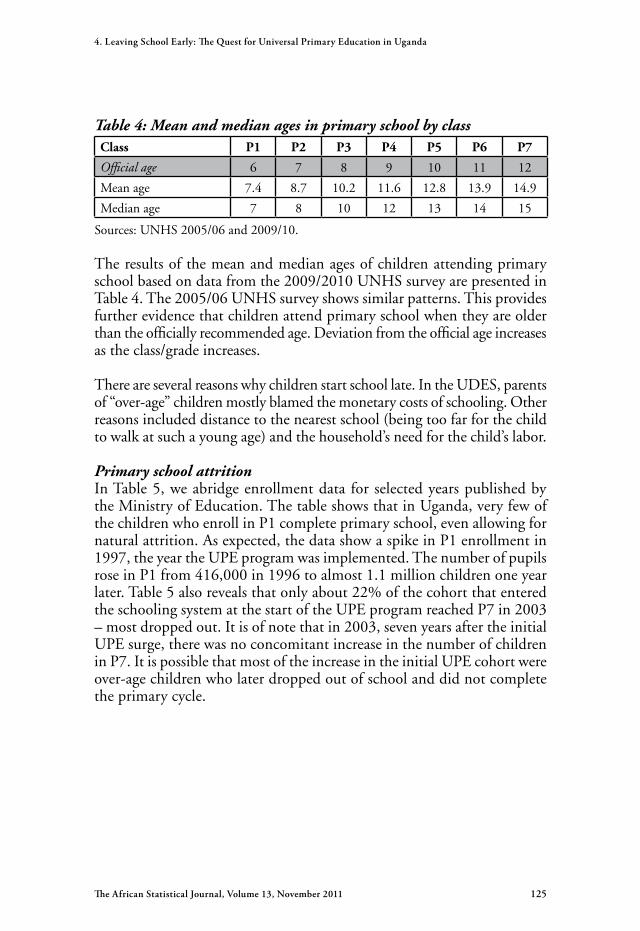
Table 4: Mean and median ages in primary school by classClass P1 P2 P3 P4 P5 P6 P7
Official age 6 7 8 9 10 11 12
Mean age 7.4 8.7 10.2 11.6 12.8 13.9 14.9
Median age 7 8 10 12 13 14 15
Sources: UNHS 2005/06 and 2009/10.
The results of the mean and median ages of children attending primary school based on data from the 2009/2010 UNHS survey are presented in Table 4. The 2005/06 UNHS survey shows similar patterns. This provides further evidence that children attend primary school when they are older than the officially recommended age. Deviation from the official age increases as the class/grade increases.
There are several reasons why children start school late. In the UDES, parents of “over-age” children mostly blamed the monetary costs of schooling. Other reasons included distance to the nearest school (being too far for the child to walk at such a young age) and the household’s need for the child’s labor.
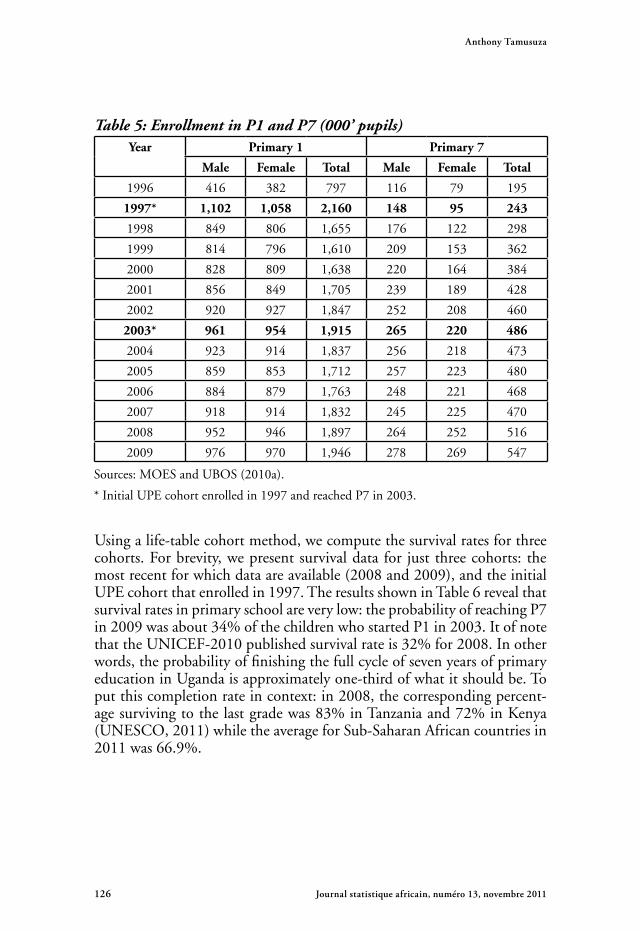
Primary school attritionIn Table 5, we abridge enrollment data for selected years published by the Ministry of Education. The table shows that in Uganda, very few of the children who enroll in P1 complete primary school, even allowing for natural attrition. As expected, the data show a spike in P1 enrollment in 1997, the year the UPE program was implemented. The number of pupils rose in P1 from 416,000 in 1996 to almost 1.1 million children one year later. Table 5 also reveals that only about 22% of the cohort that entered the schooling system at the start of the UPE program reached P7 in 2003 – most dropped out. It is of note that in 2003, seven years after the initial UPE surge, there was no concomitant increase in the number of children in P7. It is possible that most of the increase in the initial UPE cohort were over-age children who later dropped out of school and did not complete the primary cycle.
Journal statistique africain, numéro 13, novembre 2011126
Anthony Tamusuza
Table 5: Enrollment in P1 and P7 (000’ pupils)Year Primary 1 Primary 7
Male Female Total Male Female Total
1996 416 382 797 116 79 195
1997* 1,102 1,058 2,160 148 95 243
1998 849 806 1,655 176 122 298
1999 814 796 1,610 209 153 362
2000 828 809 1,638 220 164 384
2001 856 849 1,705 239 189 428
2002 920 927 1,847 252 208 460
2003* 961 954 1,915 265 220 486
2004 923 914 1,837 256 218 473
2005 859 853 1,712 257 223 480
2006 884 879 1,763 248 221 468
2007 918 914 1,832 245 225 470
2008 952 946 1,897 264 252 516
2009 976 970 1,946 278 269 547
Sources: MOES and UBOS (2010a).
* Initial UPE cohort enrolled in 1997 and reached P7 in 2003.
Using a life-table cohort method, we compute the survival rates for three cohorts. For brevity, we present survival data for just three cohorts: the most recent for which data are available (2008 and 2009), and the initial UPE cohort that enrolled in 1997. The results shown in Table 6 reveal that survival rates in primary school are very low: the probability of reaching P7 in 2009 was about 34% of the children who started P1 in 2003. It of note that the UNICEF-2010 published survival rate is 32% for 2008. In other words, the probability of finishing the full cycle of seven years of primary education in Uganda is approximately one-third of what it should be. To put this completion rate in context: in 2008, the corresponding percent-age surviving to the last grade was 83% in Tanzania and 72% in Kenya (UNESCO, 2011) while the average for Sub-Saharan African countries in 2011 was 66.9%.

The African Statistical Journal, Volume 13, November 2011 127
4. Leaving School Early: The Quest for Universal Primary Education in Uganda
Table 6: Survival rate to last grade (P7)Cohort Male Female Total
2003-2009 34.2 33.8 34.0
2002-2008 33.4 32.2 32.8
1997-2003, initial UPE cohort 29.0 26.1 27.6
Sources: MOES, UBOS enrollment data.
Figure 2 shows the survival function for the cohort in P7, relating to the year 2009. The results affirm that there are virtually no gender differences in dropout rates. The chances of dropping out of school appear greatest during the transition between P1 and P2. Survival functions for other cohorts show a similar pattern. This may be partly explained by the high repetition rates in P1. After the initial hazardous year, a smaller proportion of pupils leave in later years.
Figure 2: Estimated survival function for primary school children
Sources: MOES and UBOS (2010a).
We graphically estimate the median survival in primary school at about 4.7 years, which is extrapolated at the point when the probability exceeds the 0.5 level. The median is the point in time at which 50% of the initial
0.21 2 3 4 5 6 7
0.4
0.6
0.8
1.0Survival distribution
Grade/Class
Male Female Total

Journal statistique africain, numéro 13, novembre 2011128
Anthony Tamusuza
cohort drops out of school. After five years, over 50% of the pupils who started education will have dropped out. This estimate of the median is consistent with that derived from the life table method, which is 4.6 years.
Data from the 2000 Demographic and Health Survey (DHS) show the repetition rate (defined as the proportion of pupils in a class in a given school year who attended that same class in the previous school year) to be about 17% in P1, falling further for children in the higher classes (Table 7). The 2006 DHS did not publish any repetition rates, while the UNHS series of surveys typically do not collect any information on repetition rates.
Further evidence in the UDES shows that about 10 of the pupils that dropped out cited failing exams and repetition as the reasons. Estimates using school enrollment data in the 2008 Education Abstract suggest a repetition rate of 11% (MOES 2008a). This implies that low-achieving pupils are more likely to drop out. However, the survey was a retrospective study, so some of the documented repetitions could have occurred prior to the implementation of the official policy against repetition.
Table 7: Repetition rates by class Grade/Class P1 P2 P3 P4 P5 P6 P7
Male 17.4 8.2 8.4 8.3 6.9 10.2 10.8
Female 17.2 6.2 7.7 5.7 7.5 9.2 8.5
Urban 10.8 3.4 7.2 7.0 7.6 6.5 7.9
Rural 19.3 8.4 8.3 7.1 7.0 11.4 11.5
Total 17.3 7.2 8.0 7.0 7.2 9.7 9.8
Source: 2000 Demographic and Health Survey Report.
Child labor as a hindrance to schooling According to UNICEF (2007), one in three children in Africa is engaged in child labor. This sets the context for our brief discussion on child labor as a major hindrance to school attainment in Uganda. We follow the UNICEF convention/definition when discussing child labor. UNICEF defines a child as working depending on their age and the number of hours they work:
• for children aged 5–11 inclusive: if the child did any work whatsoever, they are classified as engaging in child labor;
• for children aged 12–14 inclusive: if the child worked for more than 14 hours in a week, then they are classified as engaging in child labor; and

The African Statistical Journal, Volume 13, November 2011 129
4. Leaving School Early: The Quest for Universal Primary Education in Uganda
• for those aged 15 and above: if they worked for more than 43 hours in a week, then they are classified as engaging in child labor.
The analysis of UNHS surveys suggests that child labor is largely a rural phenomenon. Children living in the poorest households and in rural areas are most likely to be engaged in child labor. In rural areas, 22% of children aged 6–14 report some form of child labor, compared to only 7% of chil-dren in urban areas. When parents were asked why their child was not in school, the most frequently cited reasons were: it is too expensive to send the child to school; the child is deemed too young to enroll in school; and/or the child is needed to help at home or in a family business.
3.2 Multivariate analysis: correlates of school enrollment
Table 8 shows estimated enrollment by background characteristics of the child. The Eastern region has the highest school attendance, which is con-sistent with the findings of the UDES. There are no gender differences in 2005, as boys and girls are equally likely to attend; furthermore children in female-headed households are as likely to attend school as those in male-headed households. However, the NER is higher in urban areas than in rural areas, and is lower in poorer households compared to richer households.
Ironically, children engaged in some form of child labor are more likely to attend school. This finding correlates with those of the UDES surveys, namely that children attending school are far more likely than those not attending school to have done either domestic work or to have worked for an employer outside the household. The UDES report attributes this to illness and disability, arguing that able-bodied children are likely to both work and attend school, while disabled children are less likely to do both of these activities.

Journal statistique africain, numéro 13, novembre 2011130
Anthony Tamusuza
Table 8: Estimated NER for children aged 6–12 (%)Background characteristics 2005 UNHS 2010 UNHS
Region Central 87 83
Eastern 88 84
Northern 78 76
Western 84 78
Household head Female-headed 84 81
Male-headed 85 81
Sex of child Female 85 81
Male 84 80
Residence Rural 84 84
Urban 89 81
Poverty status Non-poor household 86 83
Poor household 79 76
Child Labor (CL) Not engaged in CL 83 79
Engaged in CL 90 89
Sources: UNHS 2005/2006; 2009/2010.
Net attendance of non-poor children is higher by 7% than that of the poor. Further, in Table 8 we see that working children are more likely to attend school. However, this relationship is spurious. When we control for other factors, using multivariate regression, we are able to untangle the effect of child labor (Table 9).

The African Statistical Journal, Volume 13, November 2011 131
4. Leaving School Early: The Quest for Universal Primary Education in Uganda
Table 9: Results from logistic regression modeling: correlates of attendance
2003 UNHS 2005 UNHS 2010 UNHS
Parameter Estimate OR † Estimate OR † Estimate OR †
Intercept -2.699 -1.162 -1.357
Age of Child 0.165 * 1.18 0.209 * 1.23 0.228 * 1.26
Proportion spent on food
0.136 1.15 -0.689 * 0.50 -0.539 * 0.59
Household size
-0.002 1.00 -0.007 0.99 -0.034 * 0.97
Log of house-hold assets
0.061 * 1.06 0.047 ** 1.05 0.048 * 1.05
Distance to water >1km
-0.011 0.98 -0.028 0.95 0.036 1.08
Household has electricity
0.111 1.25 0.194 * 1.47 0.193 * 1.48
Child is orphaned
0.011 1.02 0.102 * 1.23 -0.015 0.96
Hh head Aged >35
-0.001 0.99 -0.017 0.97 -0.049 0.91
Head Educ. Primary
0.502 * 1.65 0.520 * 1.68 0.601 * 1.84
Head Educ. Secondary +
0.553 * 1.74 0.317 * 1.37 0.689 * 1.99
Reg. Eastern v Central
0.616 * 1.85 0.428 * 1.54 0.483 * 1.62
Reg. North-ern v Central
-0.152 0.86 -0.003 1.00 0.011 1.01
Reg. Western v Central
0.324 * 1.38 0.050 1.05 0.096 1.11
Reg. Eastern v Northern
0.768 * 2.15 0.431 * 1.54 0.473 * 1.60
Reg. Eastern v Western
0.292 * 1.34 0.378 * 1.46 0.387 * 1.46
Reg. North-ern v Western
-0.476 * 0.62 -0.053 0.95 -0.085 0.91
Sex of head 0.062 1.13 0.064 ** 1.14 0.033 1.07
Sex of child 0.004 1.00 -0.034 0.97 -0.051 0.95

Journal statistique africain, numéro 13, novembre 2011132
Anthony Tamusuza
2003 UNHS 2005 UNHS 2010 UNHS
Parameter Estimate OR † Estimate OR † Estimate OR †
Household poor
-0.276 * 0.76 -0.246 * 0.78
Child Labor in urban areas
0.741 * 2.10 0.522 * 1.69
Child Labor in rural areas
-0.622 * 0.54 -0.560 * 0.57
Child Labor, poor house-holds
-0.868 * 0.42
Child Labor, non-poor households
0.613 * 1.85
Urban dummy
0.162 1.18
Household has business
-0.011 0.98 0.076 ** 1.16
Community has school
-0.064 0.88
Notes: * Significant at 5%, ** Significant at 10%; † OR= Odds Ratio
Sources: UNHS 2003, 2005, 2010.
Table 9 shows that the age of child, residence (Eastern region), household poverty status, household assets, child labor, education of household head, and expenditure on food all help to determine the school enroll-ment ratios. These results are generally robust across the three surveys. The principal findings relating to school attendance are analyzed sepa-rately below.
Children from wealthier households are more likely to attend schoolHousehold characteristics play a determining role in whether a child goes to school or not. Living in a poor household exerts a strong negative effect on schooling, and this is consistent across all three surveys. For a child from a poor household, the odds of attending primary school are approximately 23% lower than for one from a non-poor household, controlling for other variables. Household assets including a house, electronics, and other indica-tors of wealth, are positively associated with school enrollment. Children

The African Statistical Journal, Volume 13, November 2011 133
4. Leaving School Early: The Quest for Universal Primary Education in Uganda
in asset-endowed households are more likely to attend school. If we think of assets as another measure of wealth, the results imply another linkage of education enrollment to household wealth. We do not include expenditure as a covariate in the model since the poverty indicator variable is derived from household expenditure.
The proportion of money a household spends on food is also negatively associated with enrollment. As this proportional expenditure rises, the likeli-hood of a child from that household enrolling in school reduces.
Child labor constrains attendance in rural areasChild labor constrains schooling. In two of the three surveys, the interaction between child labor and rural/urban residence is significant. Rural children who work are about 50% less likely to attend school than those not engaged in child labor. However, in urban areas, child labor is found to be positively associated with schooling in two of the surveys. In the 2010 survey, the interaction between child labor and residence was not statistically significant.
It is difficult to find an explanation why child labor is positively associ-ated with schooling in urban areas. However, the definition of child labor employed here is based on hours worked instead of the type of work. Thus, urban children who are classified as working may only be engaged in household chores, which do not necessarily displace schooling. It may also be that poor children in urban areas have to combine school and work to contribute toward their schooling costs and other household expenses, a reason cited in some of the UPPAP district reports.
For non-economic activities, most of the children were involved in “fetching water.” We therefore include distance to water source as a proxy for the effort that the household puts into accessing water. We also include the covariate of whether the household was involved in farming. The hypothesis is that children who live further from water sources may be less likely to attend school, since they spend more time fetching water. The empirical evidence was that distance from the household to the main water source did not affect attendance.
Child characteristics: age, location, and genderThe results show that as the age of the child increases, so do the odds of their attending school. The effect of age is significant in all three survey regres-sions. For example, in the 2005 survey, a one-year increase in age enhances the odds of attending primary school by 25%. To put it another way, the odds are increased multiplicatively by a factor of 1.25. These results are

Journal statistique africain, numéro 13, novembre 2011134
Anthony Tamusuza
consistent with those in Table 3, which show that the proportion attending primary school increases with age.
Furthermore, for children who live in farming households (either crop farming or animal husbandry), schooling is not affected by residing in such households. This suggests that merely owning an enterprise does not constrain a child’s education; rather sending the child to work in these en-terprises (either family-owned or external) represents the actual constraint.
Similarly, being a female child, an orphan, or living in a female-headed household does not constrain attendance at primary school. This finding is consistent across all three surveys.
It is plausible that girls are more likely to engage in child labor than boys. We tested this hypothesis by including the gender/child-labor interaction in the regressions. It was not statistically significant, and thus was removed from the final model. Girls aged 6–14 were no more likely to engage in child labor than boys in the same age group.
Household characteristics: type of household and access to electricityWe hypothesized that owning a non-agricultural household enterprise (e.g. a metal workshop or a tailoring business) would increase the overall demand for labor (including child labor) in the household, and that this would reduce school attendance. The results though suggest otherwise. The contribution to household welfare, and the accompanying ability to fund schooling from these enterprises, outweigh the demand for all labor, including child labor.
Children in households that have electricity are more likely to attend primary school. This is significant in two of the three analyses. Access to electricity is to a large extent restricted to urban areas, and it is plausible that the urban poor have less access to electricity. Furthermore, access to electricity in Uganda is low compared to the region as a whole. According to the 2002 Census, only 8% of households had access to electricity, while in 2010 this figure rose to just 12%.
Household size is not a correlate of school enrollment in two of the three surveys. In the 2010 survey, children in larger households were less likely to attend school.
Children in the Eastern region record higher school attendanceChildren in the Eastern region are more likely to attend school than chil-dren in the other regions, and this finding is robust across all three surveys.

The African Statistical Journal, Volume 13, November 2011 135
4. Leaving School Early: The Quest for Universal Primary Education in Uganda
The estimated odds of attending primary school for children in the Eastern region are approximately 50% higher than for children in other regions. To the extent that the Eastern region has higher gross enrollment rates (Table 2b), we argue that this partly explains the variation in attendance rates in the Eastern region relative to the rest of the country. Differences between the Central, Northern, and Western regions appear to be more nuanced.
Parents’ education is positively correlated with school attendanceThe results show strong evidence that children of educated parents are more likely to attend school. Children in households whose heads have received some level of education (whether primary only or higher) are more likely to attend school. This finding is consistent across all three surveys (Table 9).
No discernible gender differences in school attendanceThere is no evidence that girls are disadvantaged in accessing primary educa-tion. The variable for child’s gender is not statistically significant in any of the three surveys. Furthermore, the gender of the parent has no effect on the schooling status of the children. We include the interaction between the gender of head and gender of child: it is not statistically significant in any of the three regressions. Also, the relationship between the age of the household head and school attendance is not statistically significant, implying that younger parents are more likely to favor education than older parents.
Low completion rate for primary schools: reasons and timing of dropping outDescriptive research reveals that primary school completion rates are low in Uganda. The survival rate is about one-third of initial pupil enrollment at Grade 1, while the median duration in primary school is slightly less than five years. Figure 3 shows that the hazard of dropping out of school is lower at the beginning and at the end of the primary education cycle, but higher in the middle classes. This is plausible, since children who have persisted to the end are more motivated and perhaps have more resources to enable them stay in school.
The rate of dropping out is highest after four or five years of education. It is conceivable that girls in the mid-range of primary school – especially those who started school over-age – are more likely to drop out. This is due to a number of factors, including early marriage, early pregnancies, peer pressure, and the need to look after their children. However, evidence suggests that if appropriate modalities for retention (such as counseling services, appropriate medical care, and baby facilities for young mothers) were to be provided, it might be possible to retain these children in school

Journal statistique africain, numéro 13, novembre 2011136
Anthony Tamusuza
for longer periods. At the same time, evidence from UDES suggests that as pupils grow older, the likelihood of dropping out increases. The mean age is 13 for both male and female dropouts.
Figure 3: Estimated hazard of dropping out of primary school
Sources: UDES, 2001; UNHS 2006, 2010.
3.3 Correlates of duration of schooling
The results of the Cox regression are presented in Table 10. The “hazard”5 of dropping out or leaving school early increases with age. It may be inter-preted as the instantaneous risk or the conditional probability of an event happening in the “next instant,” given that no such event has occurred prior to that time. Children aged 9 and older are more likely to drop out of school compared to the younger children in the 6–9 age bracket (where age is significant, the coefficient is negative). The hazard of dropping out of school increases by about 47% for children over 9 years of age. This may reflect the fact that as children mature, they are better able, and more likely, to do physical work within and outside the household.
5 In this study, “hazard” is the risk of dropping out of school over the course of the subsequent year.
1 2 3 4 5 6 7
Hazard probability
Year or grade of enrollment
UDES UNHS 2006 UNHS 2010
0.0
0.1
0.2
0.3
0.4
0.5

The African Statistical Journal, Volume 13, November 2011 137
4. Leaving School Early: The Quest for Universal Primary Education in Uganda
Table 10: Cox regression: correlates of school durationCorrelates 2001 UDHS 2005 UNHS 2010 UNHS
Estimate HR † Estimate HR † Estimate HR †
Started Primary at age 6 -0.711 * 0.49
Urban/rural (1=urban) -0.517 * 0.61 -0.541 * 0.58 -0.503 ** 0.60
Sex of child (1=male) -0.007 0.99 0.201 1.22 0.202 1.22
Eastern v Central -1.164 * 0.31 -1.143 * 0.32 -0.269 0.76
Northern v Central -0.480 * 0.64 -0.313 ** 0.73 0.166 1.18
Western v Central -0.499 * 0.60 -0.129 0.88 -0.027 0.97
Eastern v Northern -0.684 * 0.49 -0.830 * 0.44 -0.435 ** 0.65
Eastern v Western -0.665 * 0.52 -1.015 * 0.36 -0.242 0.79
Northern v Western 0.019 1.07 -0.185 0.83 0.193 1.21
Age Child < 10 -1.149 * 0.78 0.387 1.47 -0.580 * 0.56
Dummy Orphan=1 -0.843 * 0.41 -0.440 * 0.64 -0.539 * 0.58
Age of Hh Head -0.005 0.99 -0.201 0.81 -0.138 0.87
Household size -0.082 * 0.92 -0.019 0.98 -0.078 * 0.92
Education of Hh Head -0.615 * 0.53 -0.609 * 0.54
Sex of HH head -0.139 0.86 -0.138 0.87 -0.305 0.74
Household has Electricity 0.244 1.28 0.097 1.10 0.274 1.32
Household is poor -0.695 * 0.50 -0.353 ** 0.70
Engaged in Child labor -0.754 * 0.47 -0.421 ** 0.66
Proportion hh spent on food 2.135 * 8.45 2.449 * 14.82
Natural log of hh assets -0.185 * 0.83 -0.147 * 0.87
2nd Wealth Quintile -0.071 0.96
Middle Quintile -1.087 * 0.63
4th Quintile -0.484 * 0.34
Richest Quintile -1.846 * 0.16
Notes: * Significant at 5% level. ** Significant at the 10% level. † HR=Hazard Ratio
Sources: UDHS 2001; UNHS 2005, 2010
Socioeconomic status also plays a part in whether or not children stay on in primary school. Children in wealthier households are less likely to drop out compared to children in the poorest quintile (the omitted quintile dummy). The coefficients for the three top quintiles are all statistically significant and negative, and the hazard of dropping out of school decreases as income increases.

Journal statistique africain, numéro 13, novembre 2011138
Anthony Tamusuza
Other things being equal, children in rural areas are more likely to drop out than children in urban children. The hazard of dropping out of primary school is 60% higher in rural areas compared to urban areas.
Children in the Eastern region are more likely to stay on in school, compared to the children in the Central, Northern, or Western regions. For example, the estimated hazard of dropping out in the Eastern region is about 70% lower than for children in the Central region. This is consistent with earlier results, which found the Eastern region to be better-off than other regions.
The following correlates increase the likelihood of a child dropping out of school: being an orphan; living in a household that spends more on food; living in a poor household; and engaging in child labor. Children who combine schooling with work (child labor) are more likely to drop out than non-working children who attend school. Household size, age of the household head, gender of child, gender of household head, and access to electricity are not significant correlates of staying on in school. The results suggest that orphans and non-orphans are equally likely to enroll in primary school but, once enrolled, orphans are more likely to drop out.
Lastly, starting school on time (aged 6) is associated with completing in the UDES survey. The hazard of dropping out is 49% lower for children who started school on time, compared to those who started over-age.
Factors associated with timely school enrollmentIdeally, children should start school at age 6 or perhaps 7. Our study was assisted by the fact that the UDES survey asked respondents about the age at which the child started primary school . We therefore included, among the covariates, a dummy that takes on a value of 1 if the child started primary school at age 6, and a value of 0 if otherwise.
The results show that the age and education of the household head, and household wealth are positively correlated with starting at the right age. Educated parents are more likely to send their children to school on time, especially if they received a higher-level education (secondary level or above). The 2006 Demographic and Health Survey found that children in poorer areas and in rural areas tend to start school later.

The African Statistical Journal, Volume 13, November 2011 139
4. Leaving School Early: The Quest for Universal Primary Education in Uganda
Table 11: Logistic regression: correlates of starting school at age 6Parameter Estimate Pr>ChiSq OR†
Intercept 0.817 0.0003
Rural / Urban 0.067 0.174 1.15
Household size -0.018 ** 0.095 0.98
Hh Head education Primary -0.081 0.335 0.92
Hh Head education Second-ary+
-0.248 * 0.034 0.78
Sex of child (1=male) -0.009 0.706 0.98
Sex of head (1=male) -0.003 0.918 0.99
Orphan -0.026 0.806 0.95
Distance to School 0.003 0.575 1.00
Wealth Quintile 2nd -0.209 ** 0.064 0.81
Wealth Quintile Middle -0.290 * 0.005 0.75
Wealth Quintile 4th -0.538 * <.0001 0.58
Wealth Quintile Richest -0.497 * 0.0002 0.61
Electricity 0.028 0.658 1.09
b4UPE -0.264 * <.0001 0.59
Eastern v Northern -0.225 ** 0.091 0.799
Eastern v Western -0.150 0.111 0.861
Northern v Western 0.075 0.560 1.078
Eastern v Central 0.021 0.829 1.021
Northern v Central 0.245 ** 0.069 1.278
Western v Central 0.170 ** 0.071 1.185
Age of hh head 0.003 0.149 1.003
Notes: * Significant at the 5% level. ** Significant at the 10% level; †OR=Odds Ratio.
Sources: UDES, 2005/2006; Uganda Demographic and Health Survey, 2006.
Children in wealthier households (measured by the wealth quintile) are more likely to start primary school at the right age, compared to children in the poorest quintile (the omitted quintile dummy).

Journal statistique africain, numéro 13, novembre 2011140
Anthony Tamusuza
4. SUMMARY AND CONCLUSIONS
Uganda has made tremendous strides in increasing school enrollment rates over the past decade. The country has eliminated the bias against girls in accessing primary education, while reducing the wealth effects in the access to education. Moreover, it has encouraged more children to start school at the right age. However, the evidence shows that the country has yet to attain full primary school enrollment.
We analyzed four household surveys and identified several constraints to attaining universal primary education. Ideally, children should stay in school and finish primary education before progressing further. The key impediments to primary enrollment are starting late (i.e. when they are older than 6), low completion rates, the household wealth effects (poverty status, household assets), and the need for children to work, especially in rural areas. Together, these factors serve as an obstacle to attaining a higher enrollment rate. Students from a disadvantaged background are more at risk of early exit from the education system.
4.1 The high dropout rate receives scant policy attention
Failure to complete primary education is high in Sub-Saharan Africa, where it is estimated at 67% (Fredriksen 2005). Unfortunately, Uganda’s comple-tion ratio is far lower than this average, at about 33%.
One can argue that the schooling authorities’ emphasis has been on getting children to enroll in school, rather than on retaining those already enrolled. The Ministry of Education has made tremendous strides in addressing the supply side of the primary education system. There has been investment in teacher recruitment and training, textbook supplies, and school infrastruc-ture. In its official documents (e.g. MOES 2008b) the Ministry of Educa-tion and Sports identifies four pillars to enhance the quality of education: namely pupils, teachers, management, and the community (see Table A1 in the Appendix at the end of this paper).
What this approach lacks though is specific attention to the demand side of primary education. The Ministry recognizes that children start school over-age, and that the dropout rates are high. It also notes that the late starters are more likely to drop out because of peer pressure, while early starters tend to repeat classes because they may find the learning material too advanced for their age.

The African Statistical Journal, Volume 13, November 2011 141
4. Leaving School Early: The Quest for Universal Primary Education in Uganda
The Ministry of Education has not taken any targeted action to encourage on-time school entry. Instead it has delegated to the local governments the role of (i) enacting by-laws to enforce the school entry age of 6, (ii) further sensitizing parents on the policy, (iii) ensuring local verification strategies aimed at preventing under-age children enrolling in P1, and (iv) encouraging and facilitating early childhood development centers for children aged 3–5.
Unfortunately, school attrition fails to receive the attention that it deserves in the published Ministry guidelines. The Ministry has instructed local governments to enact by-laws “aimed at ensuring compulsory attendance of school children in the age bracket 6 to 17.”
4.2 Policy options to encourage enrolled pupils to stay on at school
Beyond investments in teachers and teacher training, schools and classrooms, school facilities and books, what other options are available to encourage children to stay in primary school and complete their education? In this section, we discuss a few of those options.
One effort in this direction is school feeding programs. Lack of the provision of school meals was cited as a constraint to the UPE program. The World Food Program (WFP) provides food in the Karamoja region, northeastern Uganda, while the Ruhiira Millennium Village Project in Western Uganda also provides school meals. As a result, school attendance has increased in these areas (UPPAP 2002; Sanchez et al. 2009). The government is a key player in the education sector: 74% of primary schools (accounting for 87% of all the pupils) are government-owned (MOES 2008a). Any effort to feed children at school would benefit the majority of especially needy children. Resources may be lacking but with oil resources becoming available soon, this is one social program option that could be considered.
In Bangladesh, for example, poor households receive monthly food rations as long as they send their children to primary school. Studies also show that the provision of meals at school encourages enrollment and a concomitant decrease in dropout rates. Moreover, these effects are most pronounced in the poorer households. In effect, school feeding programs may serve as social safety-nets, which encourage schooling in hard times, such as dur-ing civil conflict or drought (Ravallion and Wodon 2000; Bennett 2003). In the context of Africa, the government of Ghana, with assistance from international donors, implemented a school feeding program that has led to improved enrollment and school retention (Sabates et al. 2010).
Journal statistique africain, numéro 13, novembre 2011142
Anthony Tamusuza
There may be additional benefits associated with school feeding programs. These include inducing changes in the home diets of the children involved, addressing nutritional deficiency (mainly inadequate energy intake), and addressing micronutrient deficiency such as iodine or Vitamin A deficiency, which may lead to a significant improvement in the growth and cognitive performance of disadvantaged children6 (Greenhalgh et al. 2007; Tomlinson 2007). When implemented properly in the Ugandan context, a functional school feeding program would reduce the direct costs of education, and translate into improvement in the primary school enrollment and comple-tion rates, especially for the poor.
In addition to school feeding programs, Fredriksen (2005) advocates for reductions in the distance to school by establishing a greater number of smaller, lower-grade schools. Fredriksen also stresses the importance of reducing child labor, especially for girls, as ways of reducing the school dropout rates.
In Ghana, teachers have been sensitized and take a more proactive role when they identify children that are likely to drop out. Teachers may visit parents of such children to encourage them to continue sending their children to school, pointing out the benefits. Another approach is for schools to allow children a few days off during harvest season, while offering separate catch-up lessons later. These and other incentives can be offered to encourage school retention (Sabates et al. 2010). Some of these could be adopted in Uganda.
Policies that encourage on-time enrollment will positively impact grade repetition, dropout rates, and completion rates. Encouraging pre-primary (nursery or kindergarten) education, especially where such facilities are defi-cient, can be promoted as a more attractive alternative to sending under-age children to primary school.
We acknowledge the arguments both for and against class/grade repetition. We decline to take a stand on that issue, because we find both sides of the argument compelling.
4.3 Other policy-relevant issues
Enrollment in the Eastern region is higher than in the rest of the country. This has been attributed by some (for example, IOB 2008) to inaccuracies
6 Beyond those listed, other positive externalities of a school feeding program may include, for example, spillover effects in the agricultural sector by increasing demand for food used in the school meals, kicking off a local food supply chain, and a boost to the local economy.
The African Statistical Journal, Volume 13, November 2011 143
4. Leaving School Early: The Quest for Universal Primary Education in Uganda
in reporting, and to the inflation of pupil numbers by school heads. The evidence though seems to point to the East being different from the rest of the country: it has higher (gross and net) enrollment rates than the rest of the country; children there are less likely to drop out, and these differences are statistically significant. Perhaps parents in this region have a natural proclivity for education. We argue that it is worthwhile to find out why this is so, since this would be of policy relevance to the rest of the country. On the other hand, the Northern region has experienced a civil conflict in the last decade, so this may explain why this region is relatively worse off than the rest of the country for most socioeconomic indicators.
Instruction in several local languages or dual instruction in English and the mother tongue should be encouraged, especially for the lower classes. Although the Ministry of Education introduced vernacular teaching for the lower classes (P1–P3) in 2007, the program was not well facilitated – for example, teachers did not get the instruction materials and professional train-ing to successfully tutor younger pupils in local languages. When properly implemented, vernacular training can help reduce school attrition. In Mali, the repetition rate is 20% in French language primary schools, compared to 5% in schools that mix instruction in French and local languages until Grade 4 (World Bank/UNICEF 2009b).
The budgetary allocation to the education sector in general, and to primary education in particular, could also be scaled up. For example, in 2008 Uganda spent only 3.3% of its GDP on education, compared to 7.0% in Kenya and 7.6% in Tanzania (UNESCO 2011). In Uganda, the budgetary allocation to education peaked at 23% in 2003 but has since fallen.
The results underscore the need for programs specifically targeting the poor in primary education, to curb the dropout rate. There are few studies that address the issue of dropping out of school. The UPPAP national report (2002) and various subnational reports offer interesting insights into the reasons children drop out of school from the community’s perspective. Poor infrastructure, lack of money for schooling, the need to work, early mar-riages, delayed release of school funds by the government, poor motivation for both teachers and pupils, and poor job prospects for graduates were all mentioned as reasons why children may not complete school.
While it is not official policy, some pupils without scholastic materials and/or uniform are reportedly turned away from school in many cases. Unfor-tunately, the extent of this problem cannot be evaluated from the available household data. But this suggests that the Ministry of Education should do

Journal statistique africain, numéro 13, novembre 2011144
Anthony Tamusuza
more to ensure enforcement of its guidelines at the school level. Increased publicity and sensitization programs are needed to heighten awareness. Civil society can also play its role by urging the Ministry to address the high and unsustainable dropout rates.
Lastly, it is estimated that 8% of children aged 6–14 have never enrolled in school. Most of these children fall into the lower age groups, below 10 years of age. These children represent a major barrier to the country’s risk of achieving universal primary education (UPE). Bringing them into the education realm should be a policy goal. Studies that identify the causal barriers to schooling, particularly for those who never enroll, would provide information to further the debate.
Collectively, the evidence suggests that a more holistic approach is needed by the Ministry of Education beyond eliminating tuition and providing the infrastructure that schools need. Addressing constraints such as extreme rural poverty and child labor are necessary, although this may be beyond the specific scope of the UPE program.
REFERENCES
Ablo, E. and R. Reinikka (1998). “Do Budgets Really Matter? Evidence from Public Spending on Education and Health in Uganda.” World Bank Policy Research Working Paper no. 1926. Washington, DC: World Bank.
Agresti, A. (2002). Categorical Data Analysis. Hoboken, NJ: John Wiley & Sons, Inc.
Bennett, J. (2003). Review of School Feeding Projects, London: Department for International Development (DFID).
Bruns, B., A. Mingat, and R. Rakotomalala (2003). Achieving Universal Primary Education by 2015 – A Chance For Every Child. Washington, DC: World Bank.
Bundy, D., C. Burbano, M. Grosh, A. Gelli, M. Jukes, and L. Drake (2009). Rethinking School Feeding: Social Safety Nets, Child Development, and the Education Sector. Washington, DC: IBRD/ World Bank in Collaboration with WFP.
The African Statistical Journal, Volume 13, November 2011 145
4. Leaving School Early: The Quest for Universal Primary Education in Uganda
Bureau of Statistics (BOS) and ORC Macro (2001). Uganda DHS UDES 2001: Education Data for Decision-making. December. Kampala: BOS.
Bureau of Statistics (BOS) (2003). Uganda National Household Survey 2002/2003. Report on the Socio-Economic Survey. November. Kampala: BOS.
Bureau of Statistics (BOS) (2006a). 2002 Uganda Population and Housing Census Analytical Report Abridged report. October. Kampala: BOS.
Bureau of Statistics (BOS) (2006b). Uganda National Household Survey 2005/2006. Report on the Socio-Economic Module. December. Kampala: BOS.
Bureau of Statistics (BOS) and Macro International Inc. (2007). Uganda Demographic and Health Survey 2006. August. Kampala: BOS.
Bureau of Statistics (BOS) (2009). The 2008 National Service Delivery Survey Report. Kampala: BOS.
Bureau of Statistics (BOS) (2010a). 2010 Statistical Abstract. Kampala: BOS.
Bureau of Statistics (BOS) (2010b). Uganda National Household Survey 2009/2010. Socio-Economic Module. Abridged Report. November. Kam-pala: BOS.
Burke, K. and K. Beegle (2004). “Why Children Aren’t Attending School: The Case of Northwestern Tanzania,” Journal of African Economies, vol. 13, no. 2, pp. 333–355.
Byamugisha, A. and K. Ogawa (2010). “Universal Primary Education Policy and Quality of Education in Uganda: The Cases for Kabale and Soroti Districts,” African Educational Research Journal, no. 1, pp. 60–76.
Chao-Ying, J. P., T. H. So, F. K. Stage, and E. P. St. John (2002). “The Use and Interpretation of Logistic Regression in Higher Education Journals,” Research in Higher Education, vol. 43, no. 3, pp. 259–293.
Chen, S. and S. Wallace (2008). “Determinants of Education Duration in Jamaica. International Studies Program.” Working Paper 08-03. Georgia: Andrew Young School of Policy Studies, Georgia State University.

Journal statistique africain, numéro 13, novembre 2011146
Anthony Tamusuza
Deininger, K. (2003). “Does the Cost of Schooling Affect Enrollment by the Poor? Universal Primary Education in Uganda,” Economics of Education Review, vol. 22, no. 3, pp. 291–305.
Doyle, C. and M. Weale (1994). “Education, Externalities, Fertility and Economic Growth,” Education Economics, vol. 2, pp. 129–167.
Education Policy and Data Center (EPDC) (2009). “Pupil Performance and Age: A Study of Promotion, Repetition, and Dropout Rates among Pupils in Four Age Groups in 35 Developing Countries.” Working Paper EDPC-09-02. Washington, DC: Education Policy and Data Center.
Filmer, D. and L. Pritchett (1998). “The Effect of Household Wealth on Educational Attainment. Demographic and Health Survey Evidence.” Policy Research Working Paper no. 1980. Washington DC: World Bank.
Fredriksen, B. (2005). “Keeping the Promise: What Is Holding up Achieving Primary Education for All African Children?,” Finance and Development, vol. 42, no. 2. Washington, DC: International Monetary Fund.
Galimaka, L. (2008). “Policy Gaps in Universal Primary Education that Contribute to School Dropout in Uganda.” Unpublished Master’s Degree thesis. The Hague, the Netherlands: Graduate School of Development Studies, Institute of Social Studies.
Glewwe, P. W. and G. H. Jacoby (1995). “An Economic Analysis of Delayed Primary School Enrollment in a Low Income Country: The Role of Early Childhood Nutrition,” The Review of Economics and Statistics, vol. 77, no. 1, pp. 156–169.
Greenhalgh, T., E. Kristjansson, and V. Robinson (2007). “Realist Review to Understand the Efficacy of School Feeding Programmes,” British Medical Journal, vol. 335, pp. 858–861.
Guarcello, L., F. Rosati, G. Breglia, and V. F. Ssennono (2008). Understand-ing Children’s Work in Uganda. Rome: University of Rome.
Hill, M.A. and E. M. King (1995). “Women’s Education and Economic Wellbeing,” Feminist Economics, vol. 1, no. 2, pp. 21–46.
Hosmer, D. W. and S. Lemeshow (1989). Applied Logistic Regression. New York: John Wiley & Sons.

The African Statistical Journal, Volume 13, November 2011 147
4. Leaving School Early: The Quest for Universal Primary Education in Uganda
International Institute for Applied Systems Analysis. (2008). “Econom-ic Growth in Developing Countries: Education Proves Key.” IIASA. Schlossplatz 1 A-2361 Laxenburg, Austria. Document available online at: <http://www.iiasa.ac.at/Admin/PUB/policy-briefs/pb03.html>.
IOB (2008). Primary Education in Uganda. IOB Impact Evaluation. Policy and Operations Evaluation Department of the Netherlands Ministry of Foreign Affairs. Report no. 311. April 2008.
Jacoby, H. G. (1994). “Borrowing Constraints and Progress through School: Evidence from Peru,” Review of Economics and Statistics, vol. 76, no.1, pp. 151–160.
Kadzimira, E. and P. Rose (2003). “Can Free Education Meet the Demands of the Poor? Evidence from Malawi,” International Journal of Educational Development, vol. 23, no. 5, pp. 501–516.
Kim, Y. (2000). “Growth Gains from Trade and Education,” Journal of International Economics, vol. 50, no. 2, pp. 519–545.
Kirdar, M. G., M. Dayıoglu, and A. Tansel (2007). “Impact of Sibship Size, Birth Order, and Sex Composition on School Enrollment in Urban Turkey.” Munich Personal RePEc Archive (MPRA) Paper No. 2755. Available online at: <http://mpra.ub.uni-muenchen.de/2755/>
Lutz, W., J. C. Cuaresma, and W. Sanderson. (2008). “The Demography of Educational Attainment and Economic Growth,” Science, vol. 319, no. 5866, pp. 1047–1048.
McEwan, P. J. and J. S. Shapiro (2008). “The Benefits of Delayed Primary School Enrollment: Discontinuity Estimates Using Exact Birth Dates,” Journal of Human Resources, vol. 43, no. 1, pp. 1–29.
Makerere Institute of Social Research (MISR) (2009). Final Report of the Baseline Survey for the Quality Enhancement Initiative (QEI) Project. Kam-pala: Makerere University.
Ministry of Education and Sports (MOES) (1998). Guidelines on Policy, Roles, and Responsibilities of Stakeholders in the Implementation of Universal Primary Education. Kampala: MOES.
Journal statistique africain, numéro 13, novembre 2011148
Anthony Tamusuza
Ministry of Education and Sports (MOES) (1999). The Ugandan Experience of Universal Primary Education (UPE). Kampala: MOES.
Ministry of Education and Sports (MOES) (2004a). Universal Primary Education: Enhancing UPE: A Stakeholder’s Handbook. May 2004. Kampala: MOES.
Ministry of Education and Sports (MOES) (2004b). National Report on the Development of Education in Uganda at the Beginning of the 21st Century. August 2004. Kampala: MOES.
Ministry of Education and Sports (MOES) (2004c). Primary School Enroll-ment rates, available online at: <http://www.education.go.ug/Reference_Tables%20-%202004.htm>.
Ministry of Education and Sports (MOES) (2007). Enrollment Rates infor-mation, available online at the Ministry of Education and Sports Website: < http://www.education.go.ug/2007_abstract_files/2007_primary_abstract/NER_All.pdf. >
Ministry of Education and Sports (MOES) (2008a). Educational Statistical Abstract. 2008. Kampala: MOES.
Ministry of Education and Sports (MOES) (2008b). Guidelines on Policy, Planning Roles and Responsibilities of Stakeholders in the Implementation of Universal Primary Education (UPE) for Districts and Urban Councils. Oc-tober, 2008. Kampala: MOES.
Ministry of Education and Sports (MOES) (2011). Background to the Budget 2011/12 Fiscal Year. Kampala: MOES.
Park, C. and W. Chung (2007). “Effect of Sibship Size and Birth Order on Education in a Subsistence Level Economy: Evidence from Rural Bangla-desh.” Unpublished paper. Singapore: Department of Economics, University of Singapore. Available online at: <http://www.economics.smu.edu.sg/events/Paper/Park_Cheolsung.pdf>
Patrón, R. (2008). “Early School Dropouts in Developing Countries: An Integral Approach to Guide Intervention. The Case of Uruguay,” Journal of Economics, Banking and Finance, vol. 2, no. 2, pp. 1–10.

The African Statistical Journal, Volume 13, November 2011 149
4. Leaving School Early: The Quest for Universal Primary Education in Uganda
Psacharopoulos, G. (1997). “Child Labor versus Educational Attainment. Some Evidence from Latin America,” Journal of Population Economics, vol. 10, no. 4, pp. 377–386.
Ranjan, P. (1999). “An Economic Analysis of Child Labor,” Economics Let-ters, vol. 64, no. 1, pp. 99–105.
Ravallion, M. and Q. Wodon (2000). “Does Child Labor Displace School-ing? Evidence on Behavioral Responses to an Enrollment Subsidy,” The Economic Journal, vol. 110, no. 462, pp. 158–175.
Roderick, M. (1994). “Grade Retention and School Dropout: Investigat-ing the Association,” American Educational Research Journal, vol. 31, no. 4, pp. 729–759.
Sabates, R., K. Akyeampong, J. Westbrook, and F. Hunt (2010). “School Drop out: Patterns, Causes, Changes and Policies.” Background paper com-missioned for the Education For All (EFA) UNESCO Global Monitoring Report, 2011.
Sanchez, P. A., G. L. Denning, and G. Nziguheba (2009). “The African Green Revolution Moves Forward,” Food Security, vol. 1, no. 1, pp. 37–44.
Singer, J. D. and J. B. Willett (1993). “It’s about Time: Using Discrete-Time Survival Analysis to Study Duration and the Timing of Events,” Journal of Educational Statistics, vol. 18, no. 2, pp. 155–195.
Stasavage, D. (2005). “The Role of Democracy in Uganda’s Move to Uni-versal Primary Education,” Journal of Modern African Studies, vol. 43, no. 1, pp. 53–73.
Tomlinson, M. (2007). “School Feeding in East and Southern Africa: Im-proving Food Sovereignty or Photo Opportunity?” Regional Network for Equity in Health in Southern Africa (EQUINET) Discussion Paper no. 46. Harare: EQUINET.
UN Millennium Project. (2005). Toward Universal Primary Education: Investments, Incentives and Institutions. Task Force on Education and Gender Equality. Available online at: <http://www.unmillenniumproject.org/documents/.>
Journal statistique africain, numéro 13, novembre 2011150
Anthony Tamusuza
UNESCO (2011). Global Education Digest 2010: Comparing Education Statistics across the World. Montreal: UNESCO.
UNICEF (2007). “Protection against Abuse, Exploitation and Violence”.World Fit for Children Targets. Available online at: <http://www.unicef.org/progressforchildren/2007n6/index_41846.htm>
UPPAP (Uganda Ministry of Finance, Planning and Economic Develop-ment) (2002). Deepening the Understanding of Poverty. Uganda Participatory Poverty Assessment Process. Second Participatory Poverty Assessment Report. December. Kampala: UPPAP.
Vila, L. E. (2002). “The Non-Monetary Benefits of Education,” European Journal of Education, vol. 35, no. 1, pp. 21–33.
Wiggins, S. and P. Deshingkar (2007). “Rural Employment and Migration: In Search of Decent Work,” Overseas Development Institute Briefing Paper. October. London: ODI.
World Bank/UNICEF (2009a). Abolishing School Fees in Africa: Lessons from Ethiopia, Ghana, Kenya, Malawi, and Mozambique. Washington, DC: World Bank in collaboration with UNICEF.
World Bank/UNICEF (2009b). Six Steps to Abolishing Primary School Fees. Operational Guide. Washington, DC: World Bank in collaboration with UNICEF.

The African Statistical Journal, Volume 13, November 2011 151
APPENDIX
Table A1: MOES Guidelines for Enhancing School Qualityquality Pillar Program Approach
I PUPILS Placing books in the hands of Pupils P4 – P7
Inclusion of Physical Education in School Curriculum
Tracking and monitoring pupil attendance
Ensure school sanitation and hygiene
Provide quality teachers
Provide more instructional materials for P1 – P3
Provide more classrooms
II TEACHERS Implement Scheme of Service
Continuous Professional Development
Timely release of teachers’ salaries
Ensure daily attendance by teachers and head-teachers
Provide teacher houses
Reduce the Pupil–Teacher Ratio for lower classes (pub-lished at 70:1 by MOES)
III MANAGEMENT Strengthen School Management Committees
Strengthen supervision by budgeting for at the Ministry level
Improve record keeping of teacher and pupil attendance, and of financial records
Implement a reward system for outstanding schools
IV COMMUNITY Enforce minimum age entry policy (i.e. age 6)
Encourage parents to meet their obligation of providing lunch to pupils
Encourage parents to engage in school activities and child performance monitoring
Source: MOES (2008b).