learning water labs
TRANSCRIPT

High School Learning Water Labs 2017
Hartnell College CSUMB Gonzales High School
Water Learning Labs Outcomes
By the end of the module, students will be able to:
-Describe the availability of water at the local, regional, and global levels including sources, locations, systems utilized to transfer water from source to point of use (natural or engineered)
-Identify the major physical, chemical and biological constituents found in water
-Describe the water treatment process to remove particulate matter and pathogens (examine: county, state, national, and international processes)
-Identify examples of organic matter, pathogens, and inorganic material found in water
-Apply the knowledge of the difference between consumptive and non-consumptive water use
including sources, locations, systems utilized to transfer water from source to point of use (natural or engineered)
Career Skills
-practice safe field and laboratory procedures -procedures that are done with integrity to produce accurate and reliable results -perform correct hands-on field data collection techniques -graph data (analyze and present data) -evaluate self produced and resource supplied graphs -synthesize testing procedures to test new water samples -understand nine factors that affect water quality -evaluate water quality based on present chemical, biologic, geologic, hydrologic and atmospheric conditions -perform chemical analysis of water quality -calculate chemical, and physical aspects to produce a total water quality index for the region surveyed -develop teamwork among the team members -Illustrate the causal loop diagram to depict the relationships between water quantity, use, pollution, quality, and energy -Apply the causal loop diagram to integrate relationships between population, consumption, technology, water scarcity, and demand -Prepare the water footprint method to evaluate the implications of different manufacturing and commercial farm activities in a particular area
Intellectual Skills
Critical Thinking: Evaluate issues of water scarcity, stress, and use on the local industry and community .... local industry includes agriculture (production and processing/handling), recreation/sports/tourism (i.e. such as golf), as well as household and community use
High School Learning Water Labs 2017
Hartnell College CSUMB Gonzales High School
Quantitative Reasoning: Calculate the water demand considering local resources, commercial and residential needs, and economic constraints.
Information Literacy: Research the current requirements on a commercial farm with respect to water for the 1) federal 2) state and 3) county levels.
Written Communication: Describe functional requirements of a treatment processes to improve water sources that is appropriate for different given situations.
Oral Communication: Discuss the impacts of drainage on water systems
Alignment to the Next Generation Science Standards: Students who demonstrate understanding can
HS-ESS2-2 Analyze geoscience data to make the claim that one change to Earth’s surface can create feedbacks that cause changes to other Earth systems
HS-ESS2-5 Plan and conduct an investigation of the properties of water and its effects on Earth materials and surface processes.
HS-ESS3-1 Construct an explanation based on evidence for how the availability of natural resources, occurrence of natural hazards, and changes in climate have influenced human activity
HS-ESS3-3 Create a computational simulation to illustrate the relationships among management of natural resources, the sustainability of human populations, and biodiversity
HS-ESS3-4 Evaluate or refine a technological solution that reduces impacts of human activities on natural systems
HS-LS2-7 Design, evaluate, and refine a solution for reducing the impacts of human activities on the environment and biodiversity
Disciplinary Core Ideas
Resource availability has guided the development of human society. (HS-ESS3-1)
All forms of energy production and other resource extraction have associated economic, social, environmental, and geopolitical costs and risks as well as benefits. New technologies and social regulations can change the balance of these factors. (HS-ESS3-2)
The sustainability of human societies and the biodiversity that supports them requires responsible management of natural resources. (HS-ESS3-3)
Scientists and engineers can make major contributions by developing technologies that produce less pollution and waste and that preclude ecosystem degradation. (HS-ESS3-4)

High School Learning Water Labs 2017
Hartnell College CSUMB Gonzales High School
When evaluating solutions, it is important to take into account a range of constraints, including cost, safety, reliability, and to consider social, cultural, and environmental impacts (secondary to HS-ESS3-1, HS-ESS3-4
Science and Engineering Practices
Developing and Using Models
Using Mathematics and Computational Thinking
Constructing Explanations and Designing Solutions
Engaging in Argument from Evidence
Cross-Cutting Concepts
Cause and Effect
Scale, Proportion, and Quantity
Systems and System Models
Energy and Matter
Stability and Change
Connecting with Community
-Understand that your daily actions affect the local, regional, and global well-being of others
-Value water as a precious resource
-Achieve more sustainable management of water resources in your region and globally through your own decisions and actions
-Understand that water is a limited natural resource that is not distributed equally in the world
-Identify how water is embodied in all materials, products, and services
-Understand the segments of the population that are at a greater risk of water stress and demand due to environmental, social, cultural, political, and economic issues and pressures
Learning How to Learn
Recognize the limits of one’s knowledge around water issues

High School Learning Water Labs 2017
Hartnell College CSUMB Gonzales High School
Formulate questions that would need to be answered to address an issue involving water
Design and execute a plan for self-directed learning
Title: Lesson 1: Sampling Water Duration: 3 hours
NGSS Standards/Performance Expectations
HS-ESS2-5 Plan and conduct an investigation of the properties of water and its effects on Earth materials and surface processes.
Objective Learn how to collect a sample of water
Materials Water sampling kit:
ENGAGEMENT Activity (Identify necessary supports/scaffolding/ modifications) [Time Allotted: 20 minutes]
What are examples of “Best Practices?” Have students describe how to brush your teeth, compare method to each other, then compare to the American Dental Association Infographic. As a class discuss how a “best practice” informs the actions we take. Define best practice as “a technique or method that, through experience and research, has proven to reliably lead to a desired result.”
Transition to sampling: The act of collecting a portion of material for analytical purposes that accurately represents the material being sampled with respect to stated objectives.
EXPLORATION Activity (Identify necessary supports/scaffolding/ modifications) [Time Allotted: 1 hour]
Work in clean hands, dirty hands partners (see student sheet) Part 1: Labeling samples. Have students create labels for their samples including -laboratory number (room number of classroom/assigned #) -sample type -date sample collected -sampling station name or code -filtered/unfiltered -description of sample treatment (preservation) Part 2: Collecting samples -grab or composite -filtered or unfiltered Note *Part 3: Analyzing samples (next lesson plan) -volume -temperature -pH -anions?

High School Learning Water Labs 2017
Hartnell College CSUMB Gonzales High School
U.S. Geological Survey, variously dated, National field manual for the collection of water-quality data: U.S. Geological Survey Techniques of Water-Resources Investigations, book 9, chaps. A1-A10, available online at http://pubs.water.usgs.gov/twri9A.
EXPLANATION Activity (Identify necessary supports/scaffolding/ modifications) [Time Allotted: 20 minutes]
Write a description of the “best practice for labeling, collecting, and analyzing data from a water sample.
ELABORATION Activity (Identify necessary supports/scaffolding/ modifications) [Time Allotted: 30 minutes]
Data quality begins before the first sample is collected, by taking care to use proper equipment, being aware of data-quality requirements, and being alert to potential sources of sample contamination.
Common sources of potential sample contamination include: unclean equipment, improper handling of sample, unclean working environment, unclean containers, cross-contamination, and improper cooling temperature. Can you find the source of contamination? Provide students with examples of contaminated and clean equipment.
EVALUATION Activity [Time Allotted: 1 hour]
Part 1 (individual): Students are the supervisor of technicians collecting water samples. One of their employees has submitted their written report for best practices in water sampling. Students are provided with an incomplete and partially incorrect “best practice” description for water sampling that they must amend and correct. Collect and evaluate. Part 2 (team): Students then work in pairs to draft a complete water sampling procedure with at least two rounds of feedback.
Notes:

High School Learning Water Labs 2017
Hartnell College CSUMB Gonzales High School
Title: Lesson 2: What are we measuring? Duration: 3 hours
NGSS Standards/Performance Expectations
HS-ESS2-5 Plan and conduct an investigation of the properties of water and its effects on Earth materials and surface processes.
Objective Measure properties of water
Materials pH meter, thermometer, graduated cylinder previously collected water samples
ENGAGEMENT Activity (Identify necessary supports/scaffolding/ modifications) [Time Allotted: 20 minutes]
Scale of the Universe: http://htwins.net/scale2/ Select 5 objects and ask the students to estimate their size using the metric system. Have a class discussion about measuring very large or very small objects.
EXPLORATION Activity (Identify necessary supports/scaffolding/ modifications) [Time Allotted: 3 hours, best as 2x1.5 hour segments or 3x1 hour segments]
Measurement Stations 1. Temperature
Temperature is an integral part of life. If a person’s body temperature goes either up or down by more than 10 degrees F, significant harm and death can occur. All living organisms have thresholds with respect to temperature. As a rule of thumb, low fresh water temperatures make for healthier aquatic life than high temperatures. Temperature Measurement Students use the thermometers to measure the hot, lukewarm, or cold water as practice involving the use of a thermometer. Show students how easy it is for improper measuring techniques to give incorrect readings due to heat flow from a person’s body to the thermometer. Techniques for Reading Temperature Students should be taught to read the thermometer by having their line of sight from their eyes to the thermometer perpendicular to the thermometer. In other words, avoid parallax by looking straight at the thermometer.
2. pH pH is defined as the negative log of the concentration of hydronium ions (H3O+) in a solution. This information is useful for agriculture, medicine, marine science just to mention a few fields. Acids, bases

High School Learning Water Labs 2017
Hartnell College CSUMB Gonzales High School
and salts cause changes in pH for water. A change of 1 unit in pH is a change of a factor of ten in acidity. The pH for acids ranges from 0 to 7, which is neutral, while bases go from 7 to 14. The chart below shows pH values of various materials that may be tested in the lab or discussed in class. Techniques for Reading pH Have the students predict which substances are acidic or basic, and then run laboratory tests to determine not only the classification of each item, but also the pH value of each. Use a pH meter, pH litmus paper and colorimetric PH tests
3. Phosphate Phosphate is a negatively charge ion. Due to ionic bonding, phosphate exists as a polyatomic anion and interacts with various cations. Phosphate Measurement Using three types of laundry detergent students assess relative levels of phosphates. Have students test water that has been supplemented with some form of soap as sources for phosphates. Use a phosphate meter and colorimetric phosphate tests. Techniques for Measuring Phosphate
4. Nitrate Nitrate is also a negatively charged ion. Found in ground water or septic systems. Due to ionic bonding, nitrate exists as a polyatomic anion and interacts with various cations. Nitrate Measurement Using three types of nitrate-based fertilizers students assess relative levels of nitrates. Have students test water that has been supplemented with some form of fertilizer as sources for nitrates. Use a phosphate meter and colorimetric nitrate tests.
5. Total Solids Dissolved solids, suspended solids, solution concentrations, mineral water, lime deposits, solubility, density and hard water are many areas that relate to this idea of foreign substances in the steam. Total Solids Measurement Measuring small quantities of mass associated with small quantities of water, and converting them to milligrams/liter. One milligram per liter is one part per million. (ppm, ppb examples) Techniques for Measuring Nitrates
EXPLANATION Activity (Identify necessary supports/scaffolding/ modifications) [Time Allotted: 20 minutes for researching an outline, 20 minutes for writing]
Randomly assign one of the topics below to students Temperature: Discuss the relationship between heat and temperature and the different temperature scales. Evaluate the range of temperatures suitable for different types of organisms and why most plants will survive warmer waters than many fish. pH: Research the pH of the water table for Monterey County. How it it similar to or different from lakes, rivers, streams, and oceans.

High School Learning Water Labs 2017
Hartnell College CSUMB Gonzales High School
Phosphate: Show slides or photos of a pond experiencing cultural eutrophication. Discuss ways a pond may have changed to become overrun with algal blooms. Investigate the biology or chemistry of phosphate in plant growth by doing a mini research report on the element phosphorous or the polyatomic ion phosphate. Nitrate: Discuss the role of fertilizers in plant growth and sources for nitrates, natural and synthetic, include how NO3 readily bonds with other substances to form proteins would also be appropriate. Total Solids: Research and connect water hardness to the types of solids in the stream and how the solids are dissolved and may be in an ionic state. Discuss how these solids play a role in water hardness and what water hardness is. Explain how a water softener works in homes. Explain how water hardness may impact plumbing.
ELABORATION Activity (Identify necessary supports/scaffolding/ modifications) [Time Allotted: 1 hour]
Only three percent of all water on Earth is fresh water. Of that three percent, one percent is accessible for domestic use. We use this water in our homes, our work and our recreation. We rely on this percent for our health and our way of life. When fresh water is contaminated with certain substances it is no longer useful. Research the minimum amounts/thresholds of the substances you tested in water. Create an infographic to educate your community about drinkable water.
EVALUATION Activity [Time Allotted:1 hour]
Part 1(individual): Test the water samples collected from Lesson 1 for each of the water quality tests. Part 2 (team): Create a table each of the samples in the class for a given measurement. Create three different types of graphs to display the data. Which graph is the best way to display the data?
Notes:

High School Learning Water Labs 2017
Hartnell College CSUMB Gonzales High School
Title: Measuring Error: Quality Assurance, Quality Control (QAQC) Duration: 3 hours
NGSS Standards/Performance Expectations
HS-ESS2-5 Plan and conduct an investigation of the properties of water and its effects on Earth materials and surface processes.
Objective Perform analytical field control by incorporating duplicates, blanks, spikes, and known reference samples when collecting water
Materials Same as water sampling x 5, plus reference samples
ENGAGEMENT Activity (Identify necessary supports/scaffolding/ modifications) [Time Allotted: 20 minutes]
How many chocolate chips are in homemade chocolate chip cookies? An introduction to quality control.
The goal of QC sampling is to identify, quantify, and document bias and variability in data that result from the collection, processing, shipping, and handling of samples.
Bias: systematic, directional error measured by the use of blank, spike, or reference-material samples.
Variability: random error measured by the use of environmental or QC sample replicates.
EXPLORATION Activity (Identify necessary supports/scaffolding/ modifications) [Time Allotted:]
QC Stations
The Blank: The primary purpose of a blank sample (“blank”) is to measure the magnitude of contaminant concentration (for analyte(s) of specific interest) that might have been introduced into the sample as a result of sampling-related activities. Blank water is strictly defined within the USGS as specially prepared distilled/deionized water (DIW)
The Replicate: The primary purpose of replicate samples is to identify and (or) quantify the variability in all or part of the sampling and analysis system. Replicates— environmental samples collected in duplicate, triplicate, or greater multiples—are considered identical or nearly identical in composition and are analyzed for the same chemical properties.
The Spike: A “spike” sample is an environmental sample to which target com- pounds (the field-matrix spike mixture) are added after

High School Learning Water Labs 2017
Hartnell College CSUMB Gonzales High School
the sample has been processed. Field-spike samples are used to measure bias and answer the question “What loss or gain of target analytes occurred because of degradation and water-matrix characteristics?” Bias deter- mined from spikes is termed “recovery” and reflects the amount of analyte(s) measured expressed as a percentage of the amount spiked.
The Reference: Standard-reference-water samples (SRS) and reference-material samples that are submitted by field personnel for laboratory analysis can be used to answer questions, such as “What are the bias and variability associated with field-handling, shipping, and laboratory procedures”? Reference samples typically are submitted from the field as blind samples and as split replicate samples because the composition is known, thus eliminating guesswork regarding the accuracy of the analytical results.
EXPLANATION Activity (Identify necessary supports/scaffolding/ modifications) [Time Allotted: 1 hour]
QC sampling is part of an overall strategy for quality assurance of the data collected and generally is described in the Quality Assurance Plan (QAP) or Sampling and Analysis Plan (SAP). Who uses QAPs? Research a QAP for Monterey County.
ELABORATION Activity (Identify necessary supports/scaffolding/ modifications) [Time Allotted:]
Create a glossary of terms used thus far in your lab notebook. Provide at least one example of the use of the term
EVALUATION Activity [Time Allotted:]
Part 1 (individual): Test the water samples collected from Lesson 1 for each of the water quality tests. Part 2 (team): Create a table each of the samples in the class for a given measurement. Create three different types of graphs to display the data. Which graph is the best way to display the data?
Notes:

High School Learning Water Labs 2017
Hartnell College CSUMB Gonzales High School
Title: Global Positioning Systems Duration: 3 hours
NGSS Standards/Performance Expectations
HS-ESS2-5 Plan and conduct an investigation of the properties of water and its effects on Earth materials and surface processes.
Objective Describe Global Positioning System (GPS)
Materials Per group of 4 students 4 pieces of different color string (pre-cut) 1 Pencil or pen for marking the potential position of each signal A large map (provided)
ENGAGEMENT Activity (Identify necessary supports/scaffolding/ modifications) [Time Allotted: 40 minutes]
Use google earth to locate 1) a place in California 2) a place in the United States 3) a place on the North American continent 4) a place on an entirely different continent. How does google earth work? What are satellites? What do they do?
EXPLORATION Activity (Identify necessary supports/scaffolding/ modifications) [Time Allotted: 1 hour]
Orbiting the Earth are a number of Global Positioning System (GPS) satellites that can help determine your location on the planet. GPS positioning works on two basic mathematical concepts. The first is called trilateration, which literally means positioning from three distances. The second concept is the relationship between distance traveled, rate (speed) of travel and amount of time spent traveling, or: Distance = Rate × Time trilateration finds your position on the Earth by knowing the location of orbiting GPS satellites and the distance from those satellites to your location on the planet. GPS satellites are always sending out radio signals. In GPS positioning the rate is how fast the radio signal travels, which is equal to the speed of light (299,792,458 meters per second). Time is determined by how long it takes for a signal to travel from the GPS satellite to a GPS receiver on earth. With a known rate and time we can solve for the distance between satellite and receiver. Once we have the distance from at least 3 satellites, we can determine a 3 dimensional position on the surface of the earth. We are going to model/simulate GPS positioning using 4 satellites. You are going to pretend to be a GPS receiver somewhere on the map and will figure out where you are based on the 4 "signals" you receive. But for you (and for a GPS receiver) all those signals tell you is where the satellite was when it sent the signal, and how long it

High School Learning Water Labs 2017
Hartnell College CSUMB Gonzales High School
took for the signal to get from the satellite to you. In other words, you have the time elapsed from when the signal left the satellite to when it arrived at your location. You also know where the satellite was when it sent you the signal, since the positions of the satellites are shown on the map. You need to determine where you could be, based on that amount of time elapsed. Since we know the speed of the signal (R), and the elapsed time (T), we can figure out the distance (D). Distance = Rate × Time In true 3 dimensional GPS positioning, the signals from the satellites are represented by spheres. For this exercise, we are going to use circles since we are on a 2 dimensional map. So, as a GPS receiver you need to figure out just how far from each satellite you are. Keep in mind you could be anywhere!
EXPLANATION Activity (Identify necessary supports/scaffolding/ modifications) [Time Allotted:]
Discuss the potential sources of error in calculating position. In order to know the distance from the satellite to the receiver you need to know exactly where the satellite was when it sent its signal. That positional information is included in the signal that travels from the satellites. Also, the rate is not exactly the speed of light (it's really close though), as there are a variety of things that can cause delays, such as atmospheric conditions. There is also the problem of multi-path (signals bouncing off the ground or off of buildings), dilution of precision (really bad distribution of satellites in the sky) and other potential sources of error
ELABORATION Activity (Identify necessary supports/scaffolding/ modifications) [Time Allotted: 30 minutes]
GPS is an essential element of the global information infrastructure. The technology is in everything from cell phones and wristwatches to bulldozers, shipping containers, and ATM's. For three of the following, explain why GPS provides important data: agriculture, aviation, marine science, public safety, disaster relief, infrastructure such as roads and highways, surveying and mapping.
EVALUATION Activity [Time Allotted: 1 hour]
Part 1 (individual): Students create a map of water sampling sites using GPS data Part 2 (team): Students are provided with latitude and longitude coordinates and must identify their sites on a map
Notes:

High School Learning Water Labs 2017
Hartnell College CSUMB Gonzales High School
Title: Water Sensor Build Duration: 3 hours
NGSS Standards/Performance Expectations
HS-ESS2-5 Plan and conduct an investigation of the properties of water and its effects on Earth materials and surface processes.
Objective Build a water sensor
Materials Water sensor kit 1. General Purpose PCB 2x2 inch. 2. Resistor: 10K ---------- 2 Nos. 3. Resistor: 15K ----------1 No. 4. Resistor: 1K ----------1 No. 5. Transistor: 2222A ---------- 2 Nos. 6. Capacitor: 22uF/25V ---------- 1 No. 7. Red LED: 5mm ----------1 No. 8. Black & Red wire ---------- 1 meter. 9. 9V battery with connector ---------- 1 No. Tool: Cutter, solder, soldering iron
ENGAGEMENT Activity (Identify necessary supports/scaffolding/ modifications) [Time Allotted: 40 minutes]
Diagram the rain sensor. This circuit can be used to detect water level and same circuit can be used as rain sensing circuit
EXPLORATION Activity (Identify necessary supports/scaffolding/ modifications) [Time Allotted: 1 hour]
This circuit can be used to detect water level and same circuit can be used as rain sensing circuit 1- Mount all the components on the PCB according to the circuit diagram. 2- Connect the battery with correct polarity. 3- Connect the sensor wire together to test initially.
High School Learning Water Labs 2017
Hartnell College CSUMB Gonzales High School
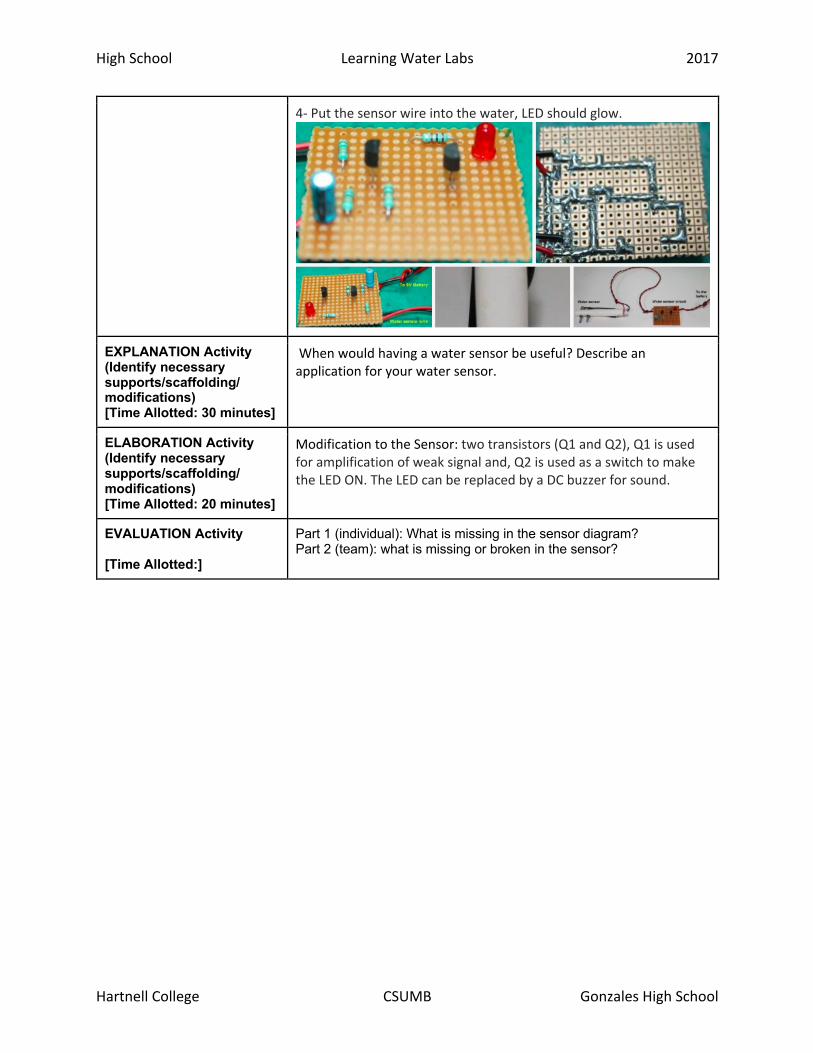
4- Put the sensor wire into the water, LED should glow.
EXPLANATION Activity (Identify necessary supports/scaffolding/ modifications) [Time Allotted: 30 minutes]
When would having a water sensor be useful? Describe an application for your water sensor.
ELABORATION Activity (Identify necessary supports/scaffolding/ modifications) [Time Allotted: 20 minutes]
Modification to the Sensor: two transistors (Q1 and Q2), Q1 is used for amplification of weak signal and, Q2 is used as a switch to make the LED ON. The LED can be replaced by a DC buzzer for sound.
EVALUATION Activity [Time Allotted:]
Part 1 (individual): What is missing in the sensor diagram? Part 2 (team): what is missing or broken in the sensor?