learning to predict rare events in event sequences by gary m weiss and haym hirsh presented by veena...
Post on 19-Dec-2015
222 views
TRANSCRIPT

Learning To Predict rare events in event sequences
By
Gary M Weiss and Haym Hirsh
Presented by
Veena Raja Rathna
Contents
• Aim & Introduction to the problem
• Basic problem Formulation
• Definitions & Evaluation metrics
• Learning methods
• Example & Results
TimeWeaver
• Reference

AIM Introduction to the problem
• To predict rare events from sequences of events which contain non numerical features
• An event sequence is a time stamped observations described by a fixed set of features
• Why• Predicting events with categorical data is an
important real world problem • Not Suited to be solved by existing statistical
and machine learning methods

Background
• Classical time series - Predict next ‘n’ successive observations from a history of past observations
• Statistical techniques not applicable to event prediction because
they require numerical features
do not support predicting a specific ‘event’ within window of time.
Examples
• Telecommunication equipment failure
• Predicting Fraudulent credit card transactions
• Start of Transcription in DNA sequences

Basic Problem Formulation
• Definitions• Event- Et: is a time stamped observation which
occurs at time ‘t’ and is described by a set of feature value pairs.
• Event Sequence- S: is a time ordered sequence of events.S=Et1,Et2,….Etn
• Domain Object- D: events are associated with D which is a generator of events
Definitions
• Target Event Xt :is the event to be predicted and is specified by a set of feature value pairs.
• Warning Time W:is the lead time necessary for a prediction to be useful
• Monitoring Time M: determines the maximum amount of time prior to target event for which a prediction is considered correct.
Problem now reduces to
• Learning a prediction procedure P that correctly predicts the target events.
• P is a function that maps an event sequence to a boolean prediction value.
• P:Et1,Et2,Et3,…Etn-->{+,-}• A target event is predicted if at least one
prediction is made within its prediction period• A prediction is correct if it falls within the
prediction period of some target event

Evaluation Measures for Event Prediction
• Recall = #Target Events Predicted /Total target events
It is the percentage of target events correctly predicted
• Simple Precision = TP/TP+FP
TP - true predictions FP - false Predictions
Simple precision is the percentage of predictions that are correct

Evaluation Metrics
• Normalized precision = #Target Events Predicted/#Target Events Predicted +FP
Replaces # of correct predictions with target
events correctly predicted
• Reduced Predictions = #Target Events predicted/# Target Events Predicted+Discounted FP
• A prediction is active for a period equal to its monitoring time

Basic Learning Method
• Identify prediction patterns : The space of PP is searched to identify a set ‘C’ of candidate PP.Each pattern c C should do well at predicting a subset of target events.
• Generate prediction rules : An ordered list of PP is generated from C. Prediction rules are then formed by creating a disjunction of the top n PP,thereby creating solutions with different precision/recall values.
• PP is a sequence of events connected by ordering primitives that define sequential or temporal constraints between consecutive events

Ordering primitives are
• Let A B C D represent individual events• ‘Wildcard’ “*” matches any number of events so
the PP A*D matches ABCD• ‘next’ “.” matches no events so the PP A.B.C only
matches ABC
• ‘unordered’ “|” allows events to occur in any order and is commutative so that the PP A|B|C will match ,amongst others,CBA
Example
• “|” has the highest precedence so the pattern “A.B*C|D|E” matches A followed by B,followed sometime later by a C,D and E in any order.
• Each feature in an event is permitted to take on the “?” value that matches any feature value.
• PP also has an integer valued pattern duration

Learning Method
• A PP matches an event sequence if
• 1) events within the PP matches events within an event sequences
• 2) ordering constraints in the PP are obeyed
• 3) events involved in the match occur within the pattern duration
• This language enables flexible and noise tolerant prediction rules to be constructed, such as
• if 3(or more) A events & 4( or more B events occur within an hour, then predict the target event.

GA for identifying PP
• Use GA to identify a diverse set of PP.• Each individual in the GA’s population represents
part of a complete solution and should perform well at classifying a subset of the target events.
• GA used is steady state GA where only a few individuals are modified each ‘iteration’ .

Basic steps in GA
• 1. Initialize population
• 2. while stopping criteria not met
• 3. select 2 individuals from the population
• 4. apply mutation operator to both individuals with Pm;
• else apply crossover operator
• 5. evaluate the 2 newly formed individuals
• 6. Replace 2 existing individuals with the new ones
• 7.done

Selection and Replacement Strategy
• GA’s selection and replacement strategy must balance two opposing criteria
• 1. They must focus the search in the most profitable areas of the search space.
• 2. Maintain a diverse population to avoid premature convergence and to ensure that the individuals in the population collectively cover most of the target events.

Selection & Replacement Strategy
• Fitness of the PP is based on both its precision and recall and is given by
fitness = ((* )+1)precision recall
-------------------------------------
(* )precision+recall
• To encourage diversity we use a strategy called sharing that rewards individuals based on how different they are from other individuals in the population

Selection & Replacement Strategy
• Individuals are selected proportional to their shared fitness = fitness/ count
• count measures the degree of similarity of individual j to p individuals comprising the population
count j=(1 -distance(j k))3
The similarity of 2 individuals is measured using a phenotypic distance metric that measures the distance based on the performance of the individual

Observations
• The more similar an individual to the rest of the individuals in the population, smaller the distances & greater the count.
• Replacement strategy also uses shared fitness.
• Individuals are chosen for deletion inversely proportional to their shared fitness

Creating Prediction Rules
• Greedy Algorithm shown is used to form a list of prediction rules S from a set of candidate patterns C
• Precision, recall and prediction vector information computed in the first step for each PP are used.
• Step 11 requires access to the training set and is the most time-intensive step

Algorithm
• 1. C=patterns returned from the GA;S={};• 2. while C!=0 do• 3. for c C do• 4. if(increase_recall(S+c,S)<=THRESHOLD)• 5. then C=C-c;• 6. Elseeval=PF*(c.precisionS.precision)+increase_recall(S+c,S);• 7. done• 8. Best={c C,x C|c.eval>=x.eval}• 9. S=S||best;C=C=best;• 10. recompute S.precision on the training set;• 11. done

Observations
• Builds solution with increasing recall by heuristically selecting the best PP in C using eval function in line 6.
• PF controls the importance of precision vs recall.PPs that do not increase the recall by at least THRESHOLD are discarded.
• Both THRESHOLD AND PF affect the complexity of t he learned concept and can prevent overfitting of the data

TimeWeaver
• This paper describes timeweaver a GA based ML system that predicts rare events
• For AT & T ,the specific task is to predict failure of 4ESS h/w components from alarm messages.
• Problem Formulation• Each 4ESS generated alarm is an event with 3
features--device,severity ,code
• each 4ESS is a domain object that generates an event sequence and the target event is any event with code set to ‘FAILURE’

Experiments
• Training set 110,000 alarms reported from 55 4ESS switches.
• Test set contained 40,000 alarms from 20 different 4ESS switches.This data included 1200 alarms which indicated equipment failure.
• THRESHOLD was 1% and PF was 10
• Pattern 351:<TMSP,?,MJ>*<?,?,MJ>*<?,?MN> indicates that within 351 sec time period a major severity alarm on a TSMP device is followed by a major alarm and minor alarm

Results
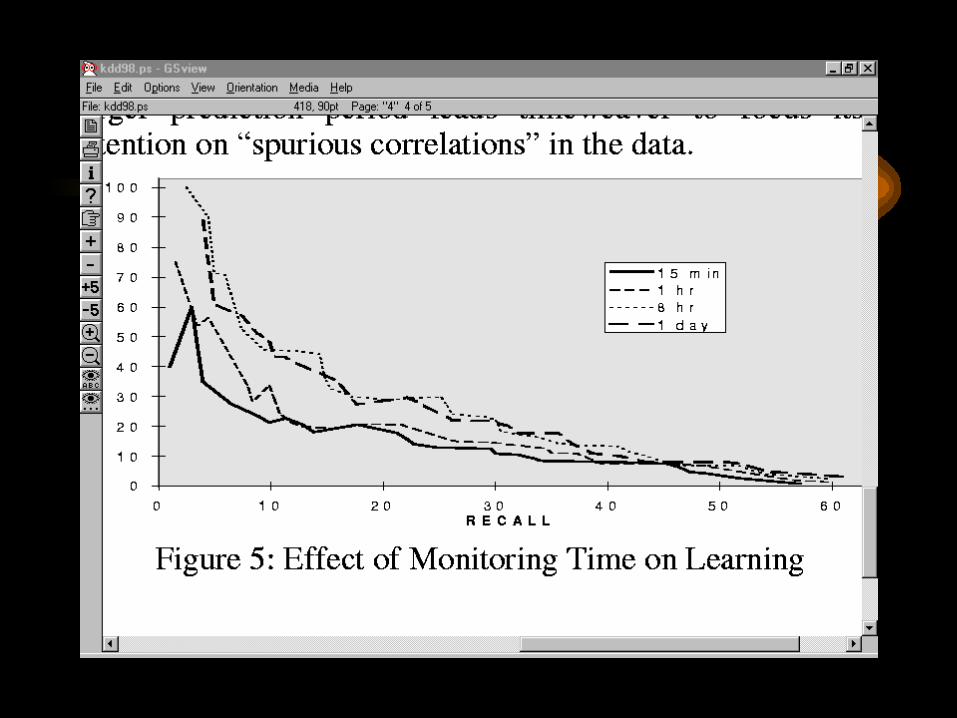
• Varying the warning time demonstrates that it is much easier to predict failures when short warning time is required.
• Increasing the monitoring time significantly improves TW’s ability to predict failures.
• Larger prediction period leads TW to focus its attention on ‘spurious correlations’ in data.


Comparision with other methods
• Tw was compared to C4.5rules and RIPPER - 2 rule induction systems and FOIL a system that learns logical definitions from relations.
• Class distribution of the generated examples is skewed; prevented C4.5rules and RIPPER from predicting any failure.
• TW yields results with precision 3-5 times higher for a given recall value than various thresholding strategies used by ANSWER system. Concept space is much more expressive.

Example
• {100:a,b},{104:c,c},{105:d,a},{108:c,c},{110:a,d},
{111:crash,c},{115:d,a},{118:,c,c},{119:a,d},{124:a,b}!
Format: Integer valued timestamp,colon,comma separated list of feature values.2 feature values per event and each event can take on the values a,b,c or d.The first can also take on the value “crash”. The target event is any event with ‘crash’ as the first feature. Warning time is 2 secs and monitoring time is 8 secs.
TW-GA training on this might produce PP: 4:|c,c|*|c,c|.

References
• Learning to predict rare events in categorical time series data
• http://paul.rutgers.edu/~gweiss/thesis/timeweaver.html