learning sql server 2008 reporting services sql server 2008 reporting services microsoft sql server...
TRANSCRIPT

Learning SQL Server 2008 Reporting Services
Jayaram Krishnaswamy
Chapter No. 6 "Working with the Report Builder"

For More Information: www.packtpub.com/learning-sql-server-2008-reporting-services/book
In this package, you will find: A Biography of the author of the book
A preview chapter from the book, Chapter NO.6 "Working with the Report Builder"
A synopsis of the book’s content
Information on where to buy this book
About the Author Jayaram Krishnaswamy studied at the Indian Institute of Science in Bangalore and Madras University, India and also taught at the Indian Institute of Technology in Madras. He went to Japan on the Japanese Ministry of Education Research scholarship to complete his PhD in Electrical Engineering from Nagoya University. He was a Post Doctoral Fellow at Sydney University in Australia, a Government of India Senior Scientific Officer at the Indian Institute of Science in Bangalore and Indian Institute of Technology at Kanpur, a Visiting Scientist at the Eindhoven Institute of Technology in Netherlands, a Visiting Professor of Physics at the Federal University in Brazil, an Associate Research Scientist at the government laboratory in Sao Jose dos Campos in Sao Paulo, Brazil, a visiting scientist at the National Research Council in Ottawa, Canada before coming to USA in 1985. He has also taught and worked at the Colorado State University in Fort Collins and North Carolina State University in Raleigh, North Carolina. He worked with Northrop Grumman Corporation on a number of projects related to high energy electron accelerators / free electron lasers. These projects were undertaken at the Brookhaven National Laboratory in Long Island and in the Physics Department at Princeton University. He has over 80 publications refereed and non-refereed publications and 8 issued patents. He is fluent in Japanese and Portuguese and lives in Plainsboro, New Jersey, USA.

For More Information: www.packtpub.com/learning-sql-server-2008-reporting-services/book
He has been working in the IT related fields since 1997. He was once a Microsoft Certified Trainer in Networking and a Siebel developer. He has worked with several IT related companies, such as the Butler International in their Siebel practice; several other IBM sub contractors and smaller companies. Presently he is active in writing technical articles in the IT field to many online sites such as CodeProject, APSFree.com, DevShed.com, DevArticles.com, OfficeUsers.org, ASPAlliance.com, ITToolbox.com, databasedev.co.uk, cimaware.com, and many others. During 2006-2007 he wrote more than 200 articles mostly related to database and web related technologies covering Microsoft, Oracle, Sybase, ColdFusion, Sun, and other vendor products.

For More Information: www.packtpub.com/learning-sql-server-2008-reporting-services/book
Learning SQL Server 2008 Reporting Services Microsoft SQL Server 2008 Reporting Services is far richer than its predecessors and provides a solid foundation for cutting edge business solutions. It is a one stop complete solution for business of any size. The departure of the architectural details from its immediate predecessor provides the motivation for writing a book. In my case, it is more than this. The idea to write in a style that helps make learning a pleasure and not drudgery was the overriding factor in writing this book. I come from a background in research, education, and instruction spanning more than 25 years. I have observed at first hand how the learning side reacts to instructions. I have taken some of these ideas into my online articles. The feedback I have received, and have been receiving was one of the driving forces. The book was completed soon after the RTM release, the differences between the RTM and the final version are minimal.
I have been through the gamut of reporting software from both Microsoft and others for several years. From the time when Visual Basic did not have proper reporting support (it was still bundled with Crystal Reports) to this day, I have seen and worked with all the various reporting software that Microsoft has produced as well as those from others. I have been involved in reporting activities both for profit and non-profit organizations. Over the years, the art of reporting has evolved in leaps and bounds (compare the charting support provided by MS Chart Control to what we see in MS SQL Reporting Services today). But the advent of internet and web-based reporting has changed the reporting landscape drastically and there is still more to come when the mobile platform begins its reign. I believe there will be yet another opportunity to write another book.
This book is replete with hands-on exercises. You begin your learning activity in Chapter 1 and finish it in the last appendix after going through 50 or more exercises. I believe this will give you a full flavor of what this product is about. If you have not been exposed to SQL Server you will still be able to understand the complete mechanics of how reports are generated and how they can be used. The book has assumed that you have Windows XP OS with copies of SQL Server 2008 Enterprise Edition, Visual Studio 2008 with SP1, Crystal Reports 2008 from SAP (all three are evaluation copies) and access to a copy of Northwind database (you can download from the link provided in Chapter 1).

For More Information: www.packtpub.com/learning-sql-server-2008-reporting-services/book
The book is structured in such a way that you start learning and building what you learned. You get the best out of the book if you follow the chapters as they are laid out. If you are already experienced in an earlier version you may jump to what interests you. Every chapter has a little background information, information that has been distilled from Microsoft documentation. Each chapter is complete in itself and each hands-on gives you a complete picture of the task. Obviously it is not possible to address the myriad of variations that are possible with the software but most of the common ones have been addressed. The book does not deal with SharePoint support in integrating reporting services. This has been deliberate to keep the book size reasonable and make learning a lot easier.
Microsoft has strived hard and is striving harder to ramp up productivity (write less code) by advocating the idea of RAD (Rapid Application Development), what I call Microsoft Wizardry. The idea that anyone can generate a report even if he/she is not well versed in the intricacies involved is a great motivator. The major emphasis of this book is on this very idea, knowing the wizards. In doing so, coding has been kept to a minimum, but is not absent. The coding that is provided is enough to build upon, as there are many references provided in the last appendix. In fact one does not have to go very far, Microsoft has excellent documentation, the last word on anything you need to know. You can go beyond and invade its forums to learn even more, as I have done myself. Microsoft and Crystal Reports have an established relationship spanning many versions and Crystal Reports is a great technology. For this reason a chapter on Crystal Reports has been added to the book.
The reviewers have done a painstaking job of going through my writing. For any errors or omissions in the book, I am entirely responsible. I am confident that the book will be most useful for those who want to learn and become productive within a very short time. I will, of course, be looking forward to hearing from my readers who would like to share their learning experience.

For More Information: www.packtpub.com/learning-sql-server-2008-reporting-services/book
What This Book Covers Chapter 1 Provides background information on what reporting activity is about and lists major reporting software vendors. This chapter should not be skipped as the hands-on guides you to install the necessary infrastructure to work with the rest of the book—Installing SQL Server 2008, Configuring the Report Server, and getting a copy of the sample database.
Chapter 2 Provides architectural background and describes various components of Reporting Services. The chapter also deals with every tool at your disposal in working with Reporting Services such as Report Server, Report Manager, and Model Designer.
Chapter 3 describes about the ReportViewer control and the hands-on deals with both the Windows and web-based reports using this important tool. Report authoring, report modification, and publishing the report to the intranet server are detailed in the hands-on exercises.
Chapter 4 Visual Studio 2008 provides great support for authoring reports that are deployed to the report server, an integral part of SQL Server 2008. The option of creating reports deployable to Report Server using BIDS is also described. The various project types that are available for Reporting Services including the Report Model Project are illustrated by the hands-on exercises.
Chapter 5 This chapter is all about Report Manager, the frontend for the Report Server backend. The full interaction between the Windows operating system, the Report Server, and the Report Manager is amply illustrated with a large number of hands-on exercises. You also get a full dose of the security aspects, the scheduling, and delivery aspects of reporting.
Chapter 6 This chapter is all about Report Builder, a great standalone tool for authoring and deploying reports from a variety of vendor database products. After a complete illustrated introduction to the user interface, the hands-on exercises show how to author reports using the wizards as well as starting from scratch.
Chapter 7 This chapter deals with different kinds of reports that can be authored using the Report Builder. The hands-on exercises guide you to author free form reports, matrix reports, parameterized reports and drill through reports. Ad hoc report authoring as well as reports based on Report Models and XML data are also included in the hands-on.

For More Information: www.packtpub.com/learning-sql-server-2008-reporting-services/book
Chapter 8 The programming interfaces to Reporting Services are discussed in this chapter. The hands-on exercises show the practical aspects of using URL Access, Reporting Web Services API, the Windows Management Instrumentation and the Reporting Services utilities.
Chapter 9 In this chapter you will be looking at Crystal Reports 2008 in Visual Studio 2008. You will be working with hands-on in importing a Crystal Report designed in Crystal Reports 2008 as well as generating Crystal Reports in Visual Studio 2008’s IDE.
Chapter 10 In this chapter the process of programmatically creating a SQL Server Reporting Services tabular report is described. You will be creating a very simple report using the code provided. The approach is to introduce the programming by creating the three parts of a report: connection, dataset, and layout.
Appendix A This appendix deals with Queries and Datasets used in Report Generation. The differences between SQL Queries, MDX queries and Semantic queries are described.
Appendix B In this Appendix converting Reports with extensions RDL to RDLC as well as reports with extension RDLC to RDL are discussed. In the hands-on you will convert a RDLC to a RDL.
Appendix C Reporting Services command line utilities are described. In the hands-on exercise you will be practicing with the rs.exe utility.
Appendix D Numerous links to blogs download sites, open source reporting software, and white papers are listed.

For More Information: www.packtpub.com/learning-sql-server-2008-reporting-services/book
Working with the Report Builder
The Microsoft SQL Server 2008 Reporting Services Report Builder 2.0 tool can be installed from a standalone installer available at this Microsoft site, http://download.microsoft.com/download/a/f/6/af64f194-8b7e-4118-b040-4c515a7dbc46/ReportBuilder.msi. The same fi le is also available from a collection of download fi les when you access the Microsoft SQL Server 2008 Feature Pack, October 2008 at http://www.microsoft.com/downloads/details.aspx?FamilyId=228DE03F-3B5A-428A-923F-58A033D316E1&displaylang=en.
Report Builder 2.0 is feature-rich reporting tool with the latest Microsoft Offi ce look and feel. It provides an extremely fl exible GUI with user friendly wizards for creating the Tablix data regions, a versatile construct that includes tables, matrix, and charts and gauges. Report Builder 2.0 supports server resources such as shared Data Sources, works with SQL Server Data Sources and many third party products, and can directly open and edit server hosted reports. Report Builder together with Report Manager provides powerful support for building and managing a bewildering array of report types.
Report Builder overview In the present version of SQL Server 2008 [Enterprise Evaluation edition] there are two Report Builders available. Report Builder 1.0, which has remained as a program that can be launched from the Report Manager, and the new Report Builder 2.0, which is a stand alone report authoring tool that needs to be independently launched.

For More Information: www.packtpub.com/learning-sql-server-2008-reporting-services/book
Working with the Report Builder
[ 284 ]
Although Report Builder 1.0 can access Report Models built with Visual Studio 2008 and the Report Manager, it cannot be used to create reports using those models. It also does not work with Reports generated by Visual Studio 2008 / BIDS / Report Builder 2.0. The errors can be summarized as follows:
When you try to access the Report Server 2008 from the link provided on the • Report Builder 1.0 interface you get the following error message:Specifying credentials in a URL is not supportedWhen you try to open a report created using VS2008/BIDS/Report • Builder2.0 using the Open Report… and Open File… navigational items in Report Builder 1.0 you get the following error message:System.IO.StreamReader: The Report element was not found.Report Builder 1.0 allows you to access Report Models created with VS2008/• BIDS/Report Manager and even allows you create a report in design view but this report cannot be processed on the Report Server. If you try to do so, you get the following error message:
MemoryStream length must be non-negative and less than 2^31 - 1 - origin. Param-eter name: offset; Remote GDI stream version: ?. Expected version: 11.0.1.
In this chapter the Report Builder 2.0 interface will be described along with the new features that are incorporated into this version. Report Builder 2.0 is admirably suited to address all items in the Report Defi nition Language of 2008. The Hands-on exercise 6.1 describes enabling My Reports, which allows each user to save his reports in his own folder helping the author to make his reports available after verifying that the report meets all the requirements. Hands-on exercise 6.2 describes how you can take an existing report authored with Report Builder 2.0 or otherwise (VS2008) and modify its formatting and other features using Report Builder 2.0. Hands-on exercise 6.3 shows how you may create a report from scratch and embellish with charts and gauges.
One of the important features of Report Builder 2.0 is the empowerment it provides business users to create ad hoc reports using the Report Models built on the databases they use. Building these models was discussed in Chapters 3 and 5. In the next chapter, you will be creating ad hoc reports based on the models you created earlier using Report Builder.

For More Information: www.packtpub.com/learning-sql-server-2008-reporting-services/book
Chapter 6
[ 285 ]
In this chapter, you will be learning mostly about the Report Builder 2.0 interface details and working with it to create reports or modify them. It may be noted that Report Builder generates 2008 compliant RDL fi les as described in http://download.microsoft.com/download/6/5/7/6575f1c8-4607-48d2-941d-c69622e11c32/RDL_spec_08.pdf and therefore, cannot work with reports generated using 2005 technology.
Report Builder 2.0 user interface description Report Builder is a report authoring tool and the basic procedure for authoring a report consists of the following steps:
Report planning•
Connecting to a source of data•
Extracting a dataset from source•
Designing the report and data binding•
Previewing the report•
Although deploying the report is not included in the above, Report Builder can deploy the report as well. It is not always necessary to deploy a completed report, as any part of a report defi nition fi le can be deployed. This makes modifying a report on the server very fl exible.
In the following sections, the various parts of the Report Builder interface will be described starting at the very top and going to the bottom of the interface.
The menu for fi le operations Report Builder 2.0 can be accessed from Start | All Programs | Microsoft SQL Server 2008 Report Builder| Report Builder 2.0.

For More Information: www.packtpub.com/learning-sql-server-2008-reporting-services/book
Working with the Report Builder
[ 286 ]
This brings up the Report Builder Interface 2.0 as shown with the design area containing two icons: Table or Matrix and Chart. Each of these will launch a related wizard which will step you through the various tasks. The Report Builder 2.0 interface is very similar to Offi ce 2007. More than one instance of Report Builder can be launched.
At the very top of the following screen shown you have the undo and redo controls as well as a save icon.

For More Information: www.packtpub.com/learning-sql-server-2008-reporting-services/book
Chapter 6
[ 287 ]
When you click on the save icon the Save as Report window gets displayed as shown. Here you provide a name for the report. The default save extension is *.rdl and it will be saved to the report server. It may also be persisted to a folder on your machine.

For More Information: www.packtpub.com/learning-sql-server-2008-reporting-services/book
Working with the Report Builder
[ 288 ]
Clicking on the Offi ce button (top left) opens a drop-down window shown in the following screenshot:
In this window, you can carry out a number of tasks such as creating a new report, opening an existing report, saving a report, and saving a report with a different name.
The Save button saves it to the default location seen earlier and Save as invokes the same window to save the report with a different name as seen earlier displying the report server instance as the Save to location.
The Recent Documents pane shows the more recent reports created with this tool.
For More Information: www.packtpub.com/learning-sql-server-2008-reporting-services/book
Chapter 6
[ 289 ]
New allows you to create a new report. When you click on Open, the following Open Report window gets displayed with the default location http://Hodentek2:8080/ReportServer_SANGAM/My Reports. You will also notice the message: This folder is not available because the My Reports feature is not enabled on the computer. Also the Open Reports window allows you look for reports with the extension .rdl.
Therefore, unless the My Reports feature is enabled, this window is unusable. This is supposed to be possible from Report Manager but there are no controls in Report Manager that would do this. An alternative was suggested by one of the MSDN forum moderators (see http://social.msdn.microsoft.com/forums/en-US/sqlreportingservices/thread/6c695160-29e8-4185-be6d-5fe027a6975c/). Hands-on exercise 6.1 describe how you may enable My Reports. The idea of My Reports is similar to My Documents where each user can keep his reports.
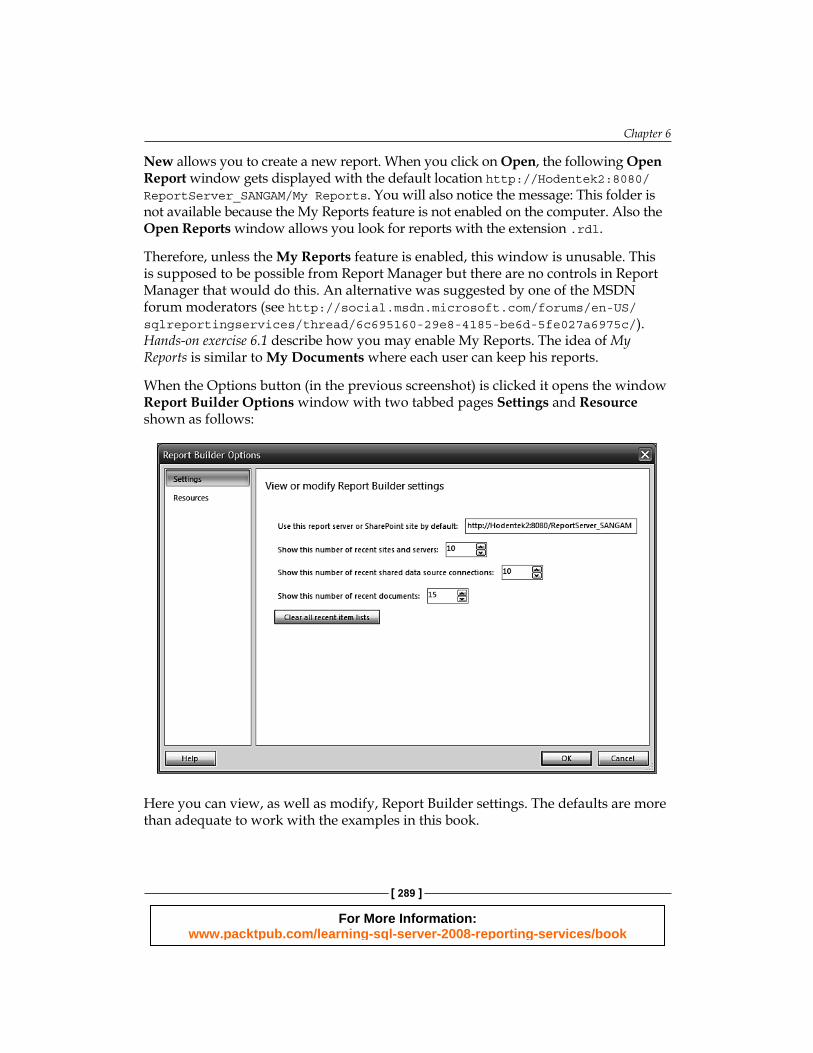
When the Options button (in the previous screenshot) is clicked it opens the window Report Builder Options window with two tabbed pages Settings and Resource shown as follows:
Here you can view, as well as modify, Report Builder settings. The defaults are more than adequate to work with the examples in this book.

For More Information: www.packtpub.com/learning-sql-server-2008-reporting-services/book
Working with the Report Builder
[ 290 ]
Clicking on the Resources button brings up this interesting window which enables you to interact with Microsoft regarding SSRS activities, concerns, community, and so on. If you are serious about Reporting Services, these are very valuable links. The About button when clicked can provide you with Report Builder version information.
The ribbon The main menu consists of Home, Insert, and View menu items which are part of the "ribbon". The ribbon introduced by Microsoft in Offi ce 2007 is actually a container for other toolbar items. The ribbon is the replacement for the classic menus, toolbars, and is supposed to be more effi cient and discoverable by the user. In fact you see a lot more on the "ribbon" than in the classic menu.
Home The next fi gure shows the Home menu with its toolbar arranged from left to right and divided into sections. The Run toolbar item with the title Views when clicked would run the report open in the design view (in fact, even without a report open in the design view, the report can be run. The result would be the current date and time getting displayed in the center of the screen of an untitled report which has just ExecutionTime as the only item in the report).

For More Information: www.packtpub.com/learning-sql-server-2008-reporting-services/book
Chapter 6
[ 291 ]
The Font, Paragraph, Border, and Number toolbar sections become enabled if parts of a report need editing. The formatting of textboxes in the report, the formatting of numbers in the report, and the alignment of components in the layout can all be independently managed using these toolbar items.
Insert When you click on the Insert menu item on the "ribbon", the tabbed page for this item is displayed as shown in the following screenshot:
It has four sections: Data Regions, Report Items, Subreports, and Header & Footer. These are all the normal items that are used either individually or together to make up a report. There can be more than one data region in a report.
Data Regions In the Data Regions section you have both the Tablix (Table, Matrix, and List) and the graphic controls that can be bound to data—the Chart and the Gauge. Gauge is new in SQL Server Reporting Services 2008. Chart and gauge implementations are the off shoot of collaboration with Dundas (http://www.dundas.com/). Report Builder is built in such a way that the dataset must be defi ned before any of the data regions are added to the report body. For the purpose of describing the various data regions in this section, it is assumed (in order to get the screen shots shown here) that a dataset has been defi ned and the default wizards on the design surface have been removed.
TableThe Table is meant for displaying data retrieved from a database either all data detailed in groups or a combination (some grouped and some detailed) of both. It has a fi xed number of columns which can be adjusted at design time. The table length expands to accommodate the rows.

For More Information: www.packtpub.com/learning-sql-server-2008-reporting-services/book
Working with the Report Builder
[ 292 ]
Data can be grouped by a single fi eld or by multiple fi elds. Expression designer can be used in grouping as well. The grouping is carried out by creating row groups. Static rows can be added for row headings (labels) and totals. Aggregates for groups can be added. Both detailed data as well as grouped data can be hidden initially and the user can interactively reveal the data needed by drill downs.
When you click on Insert | Table | Insert Table and then click on the design surface you can add a table to the design area. The table appears as shown with handles to adjust its dimensions. The table can be dragged to any other location on the design surface (the body of the report) as well.
After placing the table, which by default has three columns and two rows, when you click on any other part of the design area you will see the table as shown. When you hover over the cell marked Data on the table you will see a little icon. This icon is a minimized version of the dataset fi elds. The grayed out feature that surrounds the table indicate the position of the rows and columns of the table. It also shows such other features as whether it is a detail, or whether it is a group. In the case of group, within a group the feature would indicate the nesting schematically as well. When you want to increase the size of a column or a row you can drag the double headed arrow that gets displayed when your cursor is placed between two columns or between two cells as shown.

For More Information: www.packtpub.com/learning-sql-server-2008-reporting-services/book
Chapter 6
[ 293 ]
When you click on the dataset icon in the cell Data you get a drop-down list containing the fi elds in the dataset as shown. You can choose any of the fi elds to occupy the cell you clicked and the corresponding header will be added to the table. In this particular dataset there are nine fi elds and you can choose any of them to occupy the cell.

For More Information: www.packtpub.com/learning-sql-server-2008-reporting-services/book
Working with the Report Builder
[ 294 ]
When you right-click on a cell, a drop-down menu will be available. It can be used for the following:
Work with the highlighted textbox (each cell of the table is a textbox) • including to copy, cut, delete, and paste contents.Work with the properties of the Textbox.•
Populate the textbox with an expression using the expression builder. The • expression builder gets displayed when fx Expression is clicked.Use • Select to select the body or the Tablix.Insert a new column or a new row. Columns can be added to the right or the • left of the clicked cell and rows can be added above or below the clicked cell.Delete columns and rows.• Add a group. Both row and column groups can be added.•

For More Information: www.packtpub.com/learning-sql-server-2008-reporting-services/book
Chapter 6
[ 295 ]
When you click on the properties of the textbox, the Text Box Properties window is displayed. The textbox has several properties which are arranged on the left as a list with each item having its own page as shown. The Help button on any of the pages will take you directly to the defi nition of the properties and is extremely useful.

For More Information: www.packtpub.com/learning-sql-server-2008-reporting-services/book
Working with the Report Builder
[ 296 ]
In the General page, you can make changes to the elements in the Name, Value, and Sizing options page as shown. The Value is one which you choose among the column values (from the drop-down) from the dataset. You may also add a text for the ToolTip, which will display this text when the report is generated and this cell is accessed by hovering over it in the report. Alternatively you can set the Value and Tooltip using fx—the button that brings up the Expression window.
In the Number page you can set the number and date data type formatting options for the cell that contains a number or a date. This is what you normally would fi nd in most Microsoft products such as Excel and Access.
In the Alignment page you can choose the vertical and horizontal alignments as well as the padding of the textbox content from the edges of the cell.
Similarly the Font and Border properties are the same ones you fi nd in most Microsoft products.
The Fill property lets you add or change background color to the report as well as add a graphic element. The graphic element can be embedded, external, or originate from a database (being one of the fi elds accessed). Expressions can be developed to set a desired color for the Fill.
The Visibility of the textbox can be any of Show, Hide, Show or Hide based on an expression. In each of these cases the visibility can be toggled when another table cell is clicked (which can be chosen). This page also gives access to the Expression window which is similar to the MS Access expression builder.
The Interactive Sorting page allows you to defi ne interactive sorting options on the textbox.
Matrix Matrix provides a similar functionality (roughly speaking rows against columns) to cross-tab reports in MS Access (http://aspalliance.com/1041_Creating_a_Crosstab_Report_in_Visual_Studio_2005_Using_Crystal_Reports.all) and Pivot Table dynamic views (http://www.aspfree.com/c/a/MS-SQL-Server/On-Accessing-Data-From-An-OLAP-Server-Using-MS-Excel/3/). The matrix should have at least one row group and one column group. The matrix can expand both ways to accommodate the data, horizontally for column groups and vertically for row groups. The matrix cells (intersection of rows and columns) display summary information (aggregates).

For More Information: www.packtpub.com/learning-sql-server-2008-reporting-services/book
Chapter 6
[ 297 ]
When you click on Insert Matrix in the Insert menu and drop it on the design area of Report Builder 2.0, it gets displayed as shown in the next fi gure.
Now if you click inside the boundary of the (2x2) empty matrix you will see more features of the matrix as shown in the following screenshot. The basic elements are the ColumnGroup (Column Groups), the RowGroup (Row Groups), and the Data. The group information is also displayed as shown by overlaid lines pointing to them. There needs to be a minimum of one group and one column for the matrix and there could be a hierarchy of column and row groups.

For More Information: www.packtpub.com/learning-sql-server-2008-reporting-services/book
Working with the Report Builder
[ 298 ]
The row and column group cells have their own properties which can be displayed when you right-click on them as shown in the next screenshot for the row group. When you right-click on the cell marked Rows, the following drop-down menu pops up.
In addition to the properties that you can set for the textbox in that cell, you have additional submenu items that work with the grouping and totaling. These are part of representing data in a matrix.
Each of the Tablix for the Rows and Columns has the additional submenu items which are shown here for the Rows. Similar ones apply for the Columns as well. These are useful when you want to create nested groups as you shall see in the hands-on exercises in Chapter 7. With the Matrix design interface in SQL Server 2005 this would not have been possible.

For More Information: www.packtpub.com/learning-sql-server-2008-reporting-services/book
Chapter 6
[ 299 ]
Add Group
Row Group•
Parent Group... °
Child Group... °
-------------------- °
Adjacent Above °
Adjacent Below °
Row Group
Delete Group•
Group Properties•
Add Total
Before•
After•
In addition to the above, each of the items Rows and Columns cells has the following items as well. These specify how new columns and rows are inserted with reference to the current cell as shown. The differences are due to the geometrical positions that are allowed for the new columns or rows as shown.
For the "Columns" cell:
Insert Column
Inside Group-Left•
Inside Group-Right•
------------------•
Outside Group-Left•
Outside Group-Right•
Insert Row
Inside Group-Above•
Inside Group-Below•
------------------•
Outside Group_Above•

For More Information: www.packtpub.com/learning-sql-server-2008-reporting-services/book
Working with the Report Builder
[ 300 ]
For the "Rows" cell:
Insert Column
Inside Group-Left•
Inside Group-Right•
------------------•
Outside Group-Left•
Insert Row
Inside Group-Above•
Inside Group-Below•
------------------•
Outside Group_Above•
Outside Group_Below•
Besides using a cell as a starting point, one could also use the rows as a whole or column as a whole to add further structure as shown in the next fi gure. Of course you need to use the proper submenu option to arrive at a particular matrix structure. Clicking at the indicated points would let you choose the structure you want for your matrix. If you click at the location shown for the Tablix you could choose to the delete the whole matrix. The Tablix graphical arrangement gives you the maximum fl exibility in extending the matrix in 2-dimensions.

For More Information: www.packtpub.com/learning-sql-server-2008-reporting-services/book
Chapter 6
[ 301 ]
List The list data region repeats for each row of data. List element provides a single container for the data which can be used to generate what are called Free Form Reports. In this kind of report there is no rigid structure such as a table for the data. You can also place a list inside another list or even a chart inside a list. You can drag a column from a dataset and drop it into the list. You can work with the list using the properties of the Rectangle it contains as well as its Tablix properties.
As described earlier, the design interface is very fl exible and you can leverage all features provided by the Tablix structure like displaying details and adding groups either independent, or nested. The properties pages described earlier allow you to sort and fi lter grouped data.
When you drop a List on the design surface you will see just a single cell as shown. You can change its dimensions to suit your needs.
When you click on the List you can access its handles as shown.

For More Information: www.packtpub.com/learning-sql-server-2008-reporting-services/book
Working with the Report Builder
[ 302 ]
When you add a List, there is one column and one row (just one cell). This can be extended in both directions by choosing the appropriate submenu items. These can be displayed by right-clicking on the handles as shown.
In Chapter 7, you will be creating free form reports using the List data region.
ChartA picture tells lot more than a bunch of numbers, and charts (graphs) aggregate the whole range of data that is highly informative and aesthetically pleasing. Charts have a myriad of properties, both with regard to how they are linked to data as well as their visual properties that it is hard to justify describing them in an abbreviated fashion. This section and the hands-on exercise deal mostly with the basic principles of implementing charts in Report Builder 2.0.
Charts are basically used while creating a graph from the data to summarize important and relevant information. There are two ways you can work with chart in Report Builder 2.0. The easiest is to use the Chart Wizard. The other way is to start with a chart template and then associate it with a dataset.
There are many chart types such as bar charts, column charts, line charts, pie charts, area charts, polar charts, range charts, scatter charts and so on. The following screenshot schematically shows the various supported chart types. The chart type would depend on the data that it represents. Generally a chart should help visualize the data. A chart has its data region as well, its Tablix properties.
You can insert a chart on the report body by clicking Insert | Chart |Insert Chart and clicking again on the body of the report. This brings up the Select Chart Type window as shown:

For More Information: www.packtpub.com/learning-sql-server-2008-reporting-services/book
Chapter 6
[ 303 ]
Here you have number of options as shown. For each of these choices you have a number of other options as shown on the right-hand side when you choose the Column type.
Assuming you choose the default (the one highlighted in the above fi gure) and click on the OK button, the type of chart you chose gets added to the design area of the report as shown. You can increase the size of the chart both ways by dragging the handles.

For More Information: www.packtpub.com/learning-sql-server-2008-reporting-services/book
Working with the Report Builder
[ 304 ]
When you double-click inside the chart, you see the drop-zones on its three sides as shown. These are the areas into which you can drag-and-drop columns from the Dataset or use the minimized dataset icon that gets displayed when you hover over this area.
When you right-click on any of these areas, you can access the various ways you can work with the charts as shown:

For More Information: www.packtpub.com/learning-sql-server-2008-reporting-services/book
Chapter 6
[ 305 ]
The important chart related items are category fi elds, series fi elds, and data fi elds. You can work with all properties of the chart from this drop-down menu and even change the type of chart you want to develop.
In Hands-on exercise .6.3, a rather long one, you will be creating a chart and modify some of its properties and use the Expression tool to set the number of properties. It is not necessary to complete this exercise in one sitting as you can save the report to the report server and bring it back and forth to work on it.
Gauge This is new in Reporting Services 2008. Like chart, gauge is also a data region. Gauge has only a single data region unlike a chart. It has the look of any industrial meters (measuring instrument) with a range of values and the indicator showing the present value or some confi gurable value. They can be used together with both table and matrix elements.
When you add a gauge to a report, it comes up positioned within a gauge panel. The properties of this can be accessed when you click outside the boundary of the gauge. When you want the gauge to display data, you should associate its data property with the dataset. Gauge, like chart also has a myriad of properties which can be accessed from its Properties window.
In Hands-on exercise 6.3, you will be adding a radial gauge to display the data and a linear gauge to display an average.
Report Items Textbox, image, line, and rectangle are the items you fi nd in the Report Items section of Insert. You will be using textbox and image both of which may be bound to related as well as unrelated database variables. In the case of textbox, you have an option to use a static text, a fi eld from the built-in fi elds, or connected to one of the fi elds from the dataset. A table added to a report has textboxes in its cells, but you can add a textbox outside the table and bind it to an aggregate value related to the dataset.
Similar to the textbox, an image added to the report can be embedded, originate from an external source; or being one of the dataset fi elds. An image can be added to the current report by right-clicking the Images folder in Report Builder and picking an image from your hard drive which can then be simply embedded in the report using the Image report item. This way you can add a logo to your report.

For More Information: www.packtpub.com/learning-sql-server-2008-reporting-services/book
Working with the Report Builder
[ 306 ]
A line cannot be bound to the dataset. Its purpose is purely to provide support as a graphic separator element. The rectangle is also used to improve the visible appeal. However, it can contain other items, even data regions. You can control the rendering behaviour of items placed inside a rectangle (parent control) for the controls placed inside the rectangle. The rectangle will be an anchor for the items placed within it and move when the rectangle is moved in the report design.
When the line or the rectangle is used inside data regions you may use their RepeatWith property to allow them to be rendered when the report gets displayed.
In the next chapter you will use images in a database to get displayed in the report.
Subreports A subreport is a child of a main report. The main report is a container for the subreport (s). The Subreport section in the Insert menu item of the "ribbon" allows you to add a subreport. The parent report and the subreport are stored usually in the same folder on the report server. The main report can be designed to pass parameters to the subreport. The parameter then fi lters the subreport for it to be displayed in a data region of the main report. You will be doing a hands-on, where you will be designing a Main Report/Subreport pair to learn about passing parameters in the next chapter.
Subreports can be separated from main data region of the main report or they can be placed within the data region of the main report. A report can contain more than one subreport.
As described above, the subreport may be placed inside the main report several ways as shown in the following screenshot:

For More Information: www.packtpub.com/learning-sql-server-2008-reporting-services/book
Chapter 6
[ 307 ]
Header and footer A report page can contain a header and footer. In Report Builder 2.0 there is page footer by default which contains the built-in parameter ExecutionTime.
Some of the common features of page headers and footers are the following:
Headers go at the top of the page and footers go to the bottom and they • repeat on each page of the report.They both can contain static text, images, lines and rectangles, borders, • expressions (lookup the properties of these in Report Builder 2.0).The expressions can include fi eld references for reports from the dataset.You can easily add headers and footers from the • Insert menu item in the "ribbon". You can just, as easily, remove them by right-clicking the item and choose to remove the item.The most common use of headers and footers is to display page numbers, • report titles, and so on. There are number of built-in fi elds such as Page Number, Execution Time, Report Name, Total Pages and so on, which can be dragged-and-dropped on to headers and footers. To display variable data from a dataset in headers and footers you place a • textbox and set the value for the textbox using an expression. Choose the appropriate fi eld from the dataset. In a similar manner you can display aggregate values from the expression builder. For data from multiple datasets you cannot reference the fi elds, rather you should reference the objects in the report.
For More Information: www.packtpub.com/learning-sql-server-2008-reporting-services/book
Working with the Report Builder
[ 308 ]
You can suppress these on the fi rst and last pages of a report using the • PrintOnFirstPage, PrintOnLastPage properties which can be accessed from their properties. • Report headers and footer are not the same as the page headers and footers.Reports that you see with a browser are rendered by the HTML renderer, • but the report can be delivered in different formats. Each of them has their own renderer and you should optimize the report for the format you want to deliver.
You will be getting some practice adding headers and footers and working with them in the next chapter.
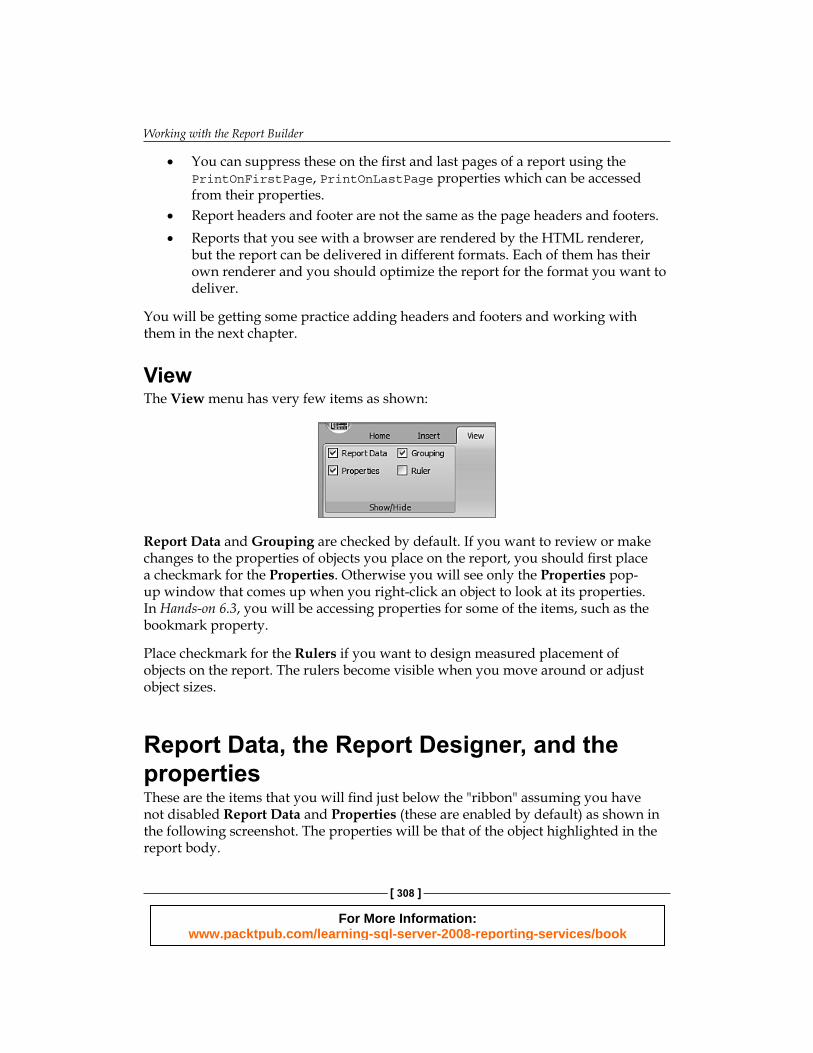
View The View menu has very few items as shown:
Report Data and Grouping are checked by default. If you want to review or make changes to the properties of objects you place on the report, you should fi rst place a checkmark for the Properties. Otherwise you will see only the Properties pop-up window that comes up when you right-click an object to look at its properties. In Hands-on 6.3, you will be accessing properties for some of the items, such as the bookmark property.
Place checkmark for the Rulers if you want to design measured placement of objects on the report. The rulers become visible when you move around or adjust object sizes.
Report Data, the Report Designer, and the properties These are the items that you will fi nd just below the "ribbon" assuming you have not disabled Report Data and Properties (these are enabled by default) as shown in the following screenshot. The properties will be that of the object highlighted in the report body.

For More Information: www.packtpub.com/learning-sql-server-2008-reporting-services/book
Chapter 6
[ 309 ]
Report Data As seen in the previous fi gure, you can create New report data; Edit an existing report data (the fi gure above has an existing report data in the C_Main. It also has three main folders. The built-in fi elds we saw earlier. The parameters will contain parameters associated with the report. The images folder contains images that can be imported into this folder, which you can embed in a report from your hard drive.
The Report Data is an excellent starting point to create a report from scratch without using wizards displayed in default. When you click on the drop-down handle New the following menu will be displayed.
All you need to do is to go and confi gure each of the items from top to bottom as follows:
The • Data Source…will bring up a window where you establish the connection to the datasource. After this, you click on • Dataset…to create a query to extract a set from the database which you want to display in your report. When you click on Dataset…you will display the properties of Dataset which you can use to design a query visually (only for SQL Server databases), an SQL Statement or import a saved SQL query or RDL fi le.

For More Information: www.packtpub.com/learning-sql-server-2008-reporting-services/book
Working with the Report Builder
[ 310 ]
You can then defi ne parameter(s) by clicking on • Parameters… to create a parameter from its Properties window. You add a parameter if you want to fi lter your query further to produce a smaller and morer manageable set of pertinent information.Click on • Images… to choose images from your machine if you need to embed them in the report.
On the other hand, if you already have these you can edit them or delete them.
Report Designer pane The various parts of this pane are shown in the following screenshot. This has been described earlier. The choices you make in the View pane will show or hide the Groupings at the bottom as well as in the Ruler. When you want to create a report from scratch and do not want to use the wizards, you can delete everything on the report and start from scratch.

For More Information: www.packtpub.com/learning-sql-server-2008-reporting-services/book
Chapter 6
[ 311 ]
For displaying groups of data, the underlying data must support this structure and it is necessary that there exists hierarchical relationships within the data. An example is shown in the following screenshot from the TestNorthwind database used in the exercises.

For More Information: www.packtpub.com/learning-sql-server-2008-reporting-services/book
Working with the Report Builder
[ 312 ]
In Report Builder 2.0, groupings show both row groupings as well as column groupings. If you are starting from the wizard, you will be setting up the row groups as well as column groups as seen in the Arrange Fields page of the wizard. The available fi elds were moved into column groups and row groups. One of the shortcomings of this wizard is that once you move a fi eld from the available to any of the other three, you cannot move it back. However you can only move between the three. If you go back and return, you have the same arrangement. If you Cancel, you need to start the wizard again. Another problem with this wizard step is that you must add a fi eld to the Value fi eld. What if one wants to show only a few columns of data in a table? However, it is well suited for matrix design. The above shortcomings in the earlier SQL Server 2008 RC0 version have been rectifi ed in the latest version of Report Builder 2.0 bundled with the Feature Pack (https://connect.microsoft.com/SQLServer/feedback/ViewFeedback.aspx?FeedbackID=371356).

For More Information: www.packtpub.com/learning-sql-server-2008-reporting-services/book
Chapter 6
[ 313 ]
The above arrangement would lead to a report's grouping as shown here:
Each of the groups shown above has its own properties which can be accessed by right-clicking the group. For example, the row group [ProductName] in the above. You can then review its Group Properties window as shown in the two following screenshots:
When you click on the drop-down item, Group Properties…, the Group Properties window shows up.

For More Information: www.packtpub.com/learning-sql-server-2008-reporting-services/book
Working with the Report Builder
[ 314 ]
Clicking on the Next button in the New Table or Matrix wizard's Arrange Fields page takes you to the window where you can arrange to show the group aggregates. You can show them in several ways depending on the choice you make as shown in the following screenshot:
You will be working with the groups and grouping in the next chapter.
Properties This window appears, by default, at the right of the report designer pane. It shows all confi gurable properties of the objects on the report body. You only need to click on the object. Most of the properties become effective as soon as you complete the property and leave that property or move to the next property in the Properties window. If you add custom assemblies, these are also shown in this window.

For More Information: www.packtpub.com/learning-sql-server-2008-reporting-services/book
Chapter 6
[ 315 ]
Server status and tools At the very bottom of the Report Builder you will get an indication as to the Report Server you are connected to (present case there is only one running) and its status as shown in the following screenshot. You can also change from design to run (preview) by clicking on the respective icons in this fi gure. You can also enlarge or reduce the size of the report both in design and in preview using the zoom slide.
Hands-on exercise 6.1: Enabling and reviewing My Reports As described previously the My Reports folder needs to be enabled in order to use the folder or display it in the Open Report dialogue. The RC0 version had a documentation bug which has been rectifi ed (https://connect.microsoft.com/SQLServer/feedback/ViewFeedback.aspx?FeedbackID=366413).
Getting ready In order to enable the My Reports folder you need to carry out a few tasks. This will require authentication and working with the SQL Server Management Studio. These tasks are listed here:
1. Make sure the Report Server has started.2. Make sure you have adequate permissions to access the Servers.3. Open the Microsoft SQL Server Management Studio as
described previously.4. Connect to the Reporting Services after making sure you have started the
Reporting Services.5. Right-click the Report Server node.
The Server Properties window is displayed with a navigation list on the left consisting of the following:
General•
Execution•

For More Information: www.packtpub.com/learning-sql-server-2008-reporting-services/book
Working with the Report Builder
[ 316 ]
History•
Logging•
Security•
Advanced•
In the General page the name, version, edition, authentication mode, and URL of Reporting Service is displayed. Download of an ActiveX Client Print control is enabled by default. In order to work with Report Builder effectively and provide a My Reports folder for each user, you need to place a check mark for the check box Enable a My Reports folder for each user. The My Reports feature has been turned on as shown in the next screenshot.In the Execution page there is choice for report timeout execution, with the default set such that the report execution expires after 1800 seconds.In the History page there is choice between keeping an unlimited number of snapshots in the report history (default) or to limit the copies allowing you to specify how many to be kept. In the Logging page, report execution logging is enabled and the log entries older than 60 days are removed by default. This can be changed if desired.In the Security page, both Windows integrated security for report data sources and ad hoc report executions are enabled by default.The Advanced page shows several more items including the ones described thus far as shown in the next fi gure.
6. In the General page enable the My Reports feature by placing a check mark.

For More Information: www.packtpub.com/learning-sql-server-2008-reporting-services/book
Chapter 6
[ 317 ]
7. Click on the Advanced list item in the left.The Advanced page is displayed as shown:

For More Information: www.packtpub.com/learning-sql-server-2008-reporting-services/book
Working with the Report Builder
[ 318 ]
8. Now expand the Security node of Reporting Services and you will see that the My Reports role is present in the list of roles as shown. This is also added to the ReportServer database.
The description of everything that a user with the assignment My Reports role can do is as follows:"May publish reports and linked reports, manage folders, reports, and resources in a users My Reports folder." As discussed in Chapter 5, this role may be assigned to a user in Report Manager.
9. Now bring up Report Builder 2.0 by clicking Start | All Programs | Microsoft SQL Server 2008 Report Builder | Report Builder 2.0.Report Builder 2.0 is displayed.

For More Information: www.packtpub.com/learning-sql-server-2008-reporting-services/book
Chapter 6
[ 319 ]
10 Click on Offi ce Button | Open.The Open Report dialogue appears as shown. When the report Server is offl ine, the default location is My Documents, like Microsoft products Excel and MS Access.
11. Choose the Recent sites and Servers.The Report server that is active should get displayed here as shown:

For More Information: www.packtpub.com/learning-sql-server-2008-reporting-services/book
Working with the Report Builder
[ 320 ]
12. Highlight the Server URL and click Open.All the folders and fi les on the server become accessible as shown:
13. Open the Report Manager by providing its URL address.Verify that a My Reports folder is created for the user (current user). For other users you need to go into Report Manager and assign the role as dis-cussed in Chapter 5.
There could be slight differences in the look of the interface depending on whether you are using the RTM or the fi nal version of SQL Server 2008 Enterprise edition.
Hands-on exercise 6.2: Modifying a basic report In this exercise, the report created in Chapter 4 will be modifi ed to illustrate the formatting, layout, and other capabilities built into the Report Builder. A number of other features of Report Builder will be taken up in the next chapter.

For More Information: www.packtpub.com/learning-sql-server-2008-reporting-services/book
Chapter 6
[ 321 ]
Getting ready This hands-on will be using a MS Access report that was imported using Visual Studio in Chapter 4 and hosted on the Report Server. The MS Access report will be modifi ed to use the new Report Items in Report Builder 2.0.
Follow the steps You will be carrying out the following steps:
1. Open Report Builder and open the ByOrders.rdl report imported in Chapter 4.
2. Review the imported MS Access report.3. Modify the properties.
Open Report Builder and open the ByOrders.rdl reportYou will be accessing the ByOrders.rdl fi le from the Report Builder in order to modify it in the Report Builder. The steps are listed here:
1. Start Report Builder from its shortcut.2. Click the Offi ce button and in the drop-down window click on Open.
The Open dialogue is displayed. 3. Click on Recent Sites and Servers in the left navigation area.
The Report Servers' URL is displayed.4. Highlight the Report Server URL and click on the Open button.5. Click on the MS Access folder and click on the Open button.

For More Information: www.packtpub.com/learning-sql-server-2008-reporting-services/book
[ 322 ]
Working with the Report Builder
6. Highlight the report ByOrders and click on the Open button.The ByOrders report gets displayed in the Report Builder as shown:
Review the imported MS Access reportThe dataset for the report is DataSet1 on the left and the report body is in the design area. The various report items and their data binding will be examined for one such control, the CompanyName. It will be instructive to study the others as well. In order to review the report we will follow these steps:
1. Highlight CompanyName and right–click on it.The properties of CompanyName are displayed as shown. CompanyName is inside a container textbox inside the Tablix and it is a place holder. You should also notice the large square bracket on the left ranging three rows. This is the grouping symbol.

For More Information: www.packtpub.com/learning-sql-server-2008-reporting-services/book
Chapter 6
[ 323 ]
2. Click on Placeholder Properties….This opens the Placeholder's Properties page as shown:
3. Change the Markup type to HTML – Interpret HTML tags as styles.4. Click on the fx symbol (which opens an Expression window) along
the Value.

For More Information: www.packtpub.com/learning-sql-server-2008-reporting-services/book
Working with the Report Builder
[ 324 ]
5. In the Expression window that is displayed, modify the expression as shown in the following screenshot:
You have added the HTML tags <u> and </u> on either side of the original CompanyName data that came from the dataset. Now it is slightly more than the data and in the design view (CompanyName) it is replaced by this ex-pression. A placeholder is the holding place of an expression. You can make a textbox into a placeholder by designating the textbox to hold an expression. For example there are two place holders for the time Now () and the expres-sion ="Page" & Globals.PageNumber & " of "& Globals.TotalPages.
6. Click on the OK button on the Expression window as well as the Placeholder Properties' window.

For More Information: www.packtpub.com/learning-sql-server-2008-reporting-services/book
Chapter 6
[ 325 ]
7. Click on the Run button in the Home menu.The report gets processed and you may need to provide the login for this report. The username is Admin and there is no password.
8. Click on the View Report button.The report is displayed in the Report Builder as shown:

For More Information: www.packtpub.com/learning-sql-server-2008-reporting-services/book
Working with the Report Builder
[ 326 ]
9. Click on the Address fi eld in the report design.The Address fi eld is highlighted in the report as shown:
You can see that this represents the detail (the data that comes in each of the rows). It is also a placeholder and its value is that of "Address". You can ap-ply Rich Text formatting by using HTML tags for textboxes as well as place-holder values. Note that only certain HTML tags and CSS attributes are supported. For the supported HTML tags refer to http://msdn.microsoft.com/en-us/library/dd207048.aspx. For an example of CSS rendering, refer to http://hodentek.blogspot.com/2009/01/can-you-use-css-style-attributes-in.html.
10. Change Report title ByOrders to Orders by editing the textbox.11. Extend the length of the <<Expr>> directly below the report title to
accommodate a longer string.12. Make the EmployeeID fi eld left aligned as well as formatted. Set the font
weight Bold.13. Click on the table that has the Address, City, and so on. Extend it to the
right by dragging the table handles so that the Required Date can be fully displayed.
14. Rearrange the positions of objects and the size of textboxes to fully display the data.

For More Information: www.packtpub.com/learning-sql-server-2008-reporting-services/book
Chapter 6
[ 327 ]
Both vertical and horizontal movements of objects can be very smooth and can be changed in Points as shown:
Highlighted objects can be expanded and moved using the Ctrl or Shift keys together with the arrow keys.
The modifi ed report design is shown in the following screenshot:
Hands-on exercise 6.3: Creating reports with charts and gauges In this exercise you will be connecting to an Excel spreadsheet with some data and will be creating a simple report. You will also add a chart and gauge data regions to the report to display the data. In authoring the report you will be creating a report using the New Table or Matrix wizard which is supposed to lead to the creation of a table or a matrix according to the documentation. What has been noted is that this wizard can only create a matrix report and if you need a table report you need to start from scratch. However, a workaround has been adopted to use it as is. Again this was another reported bug that was fi xed in the fi nal version.

For More Information: www.packtpub.com/learning-sql-server-2008-reporting-services/book
Working with the Report Builder
[ 328 ]
Getting ready In order to carry out the tasks make sure you have Microsoft Excel installed on the machine and that the Report Server is running.
Follow on In this exercise you will carry out the following steps:
1. Create a Microsoft Excel Spreadsheet with some data.2. Create an ODBC DSN to access the data.3. Create a datasource using this DSN in Report Builder 2.0.4. Create a dataset based on the data in the Excel fi le.5. Design a report to display the data.6. Create a chart to display the data.7. Add gauges to the report.
Creating a Microsoft Excel spreadsheet with some data In order to work with this exercise we will create a simple spreadsheet with data using the MS Excel program. The chart we will be creating will use this spreadsheet.
Open an empty MS Excel fi le and type in some numbers as shown in the following screenshot. Delete Sheet 2 and Sheet 3 from the fi le. Save this fi le after providing a name (herein RptChart.xls).
The fi le is quite simple and you can just type in the numbers shown or makeup your own data. All data are numbers. The fi le gets saved to the default folder MyDocuments on the C:\ drive.

For More Information: www.packtpub.com/learning-sql-server-2008-reporting-services/book
Chapter 6
[ 329 ]
Create an ODBC DSN to access the data The MS Excel data will be accessed by creating an ODBC DSN. The details of how to do it are listed here:
1. Click on Start | All Programs | Control Panel | Administrative Tools | Data Sources (ODBC) to open the ODBC Data Source Administrator.
2. If the tabbed page is not in User DSN, change the tab to User DSN and click on the Add button.
3. Scroll down and highlight Microsoft Excel Driver (*.xls) [Version 12.00] and click on the Finish button.This opens the ODBC Microsoft Excel Setup window as shown.
4. Provide a name (Gauges) and a Description. Click on the Select Workbook… button.
5. Use the controls on the Select Workbook window to locate the fi le you saved: the RptChart.xls fi le. Highlight the fi le. This will get the fi le into the Database Name window as shown.

For More Information: www.packtpub.com/learning-sql-server-2008-reporting-services/book
Working with the Report Builder
[ 330 ]
6. Click on the OK button.This creates the ODBC DSN as shown in the following screenshot. The DSN you created enters the USER DSN folder.
7. Click on the OK button to close the window.
Create a datasource using a DSN in Report Builder 2.0 After creating the ODBC DSN it will be possible to access the data using Report Builder. The following steps show how you may carry out this task.
1. Open Report Builder 2.0 just as you have done in other exercises.2. Click on the Offi ce button and choose New in the drop-down.
The design surface displaying the body of the report with the two wizards will be displayed.

For More Information: www.packtpub.com/learning-sql-server-2008-reporting-services/book
Chapter 6
[ 331 ]
3. Click on the Table or Matrix wizard to open the New Table or Matrix window.
4. Click on the New… button to open the Data Source Properties window.5. Provide a name for the datasource and replace the default DataSource1
(Herein GaugesSource).6. Click on the handle for Select connection type and choose ODBC as shown:
For More Information: www.packtpub.com/learning-sql-server-2008-reporting-services/book
Working with the Report Builder
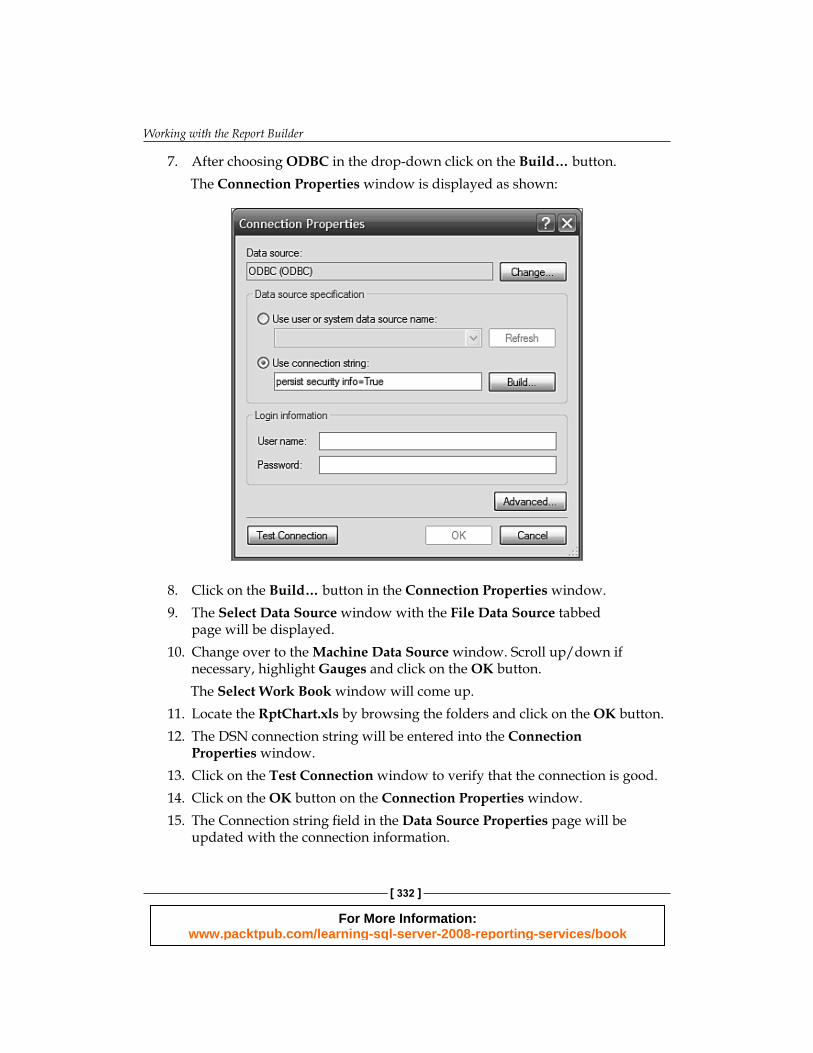
[ 332 ]
7. After choosing ODBC in the drop-down click on the Build… button.The Connection Properties window is displayed as shown:
8. Click on the Build… button in the Connection Properties window.9. The Select Data Source window with the File Data Source tabbed
page will be displayed. 10. Change over to the Machine Data Source window. Scroll up/down if
necessary, highlight Gauges and click on the OK button.The Select Work Book window will come up.
11. Locate the RptChart.xls by browsing the folders and click on the OK button.12. The DSN connection string will be entered into the Connection
Properties window.13. Click on the Test Connection window to verify that the connection is good.14. Click on the OK button on the Connection Properties window.15. The Connection string fi eld in the Data Source Properties page will be
updated with the connection information.

For More Information: www.packtpub.com/learning-sql-server-2008-reporting-services/book
Chapter 6
[ 333 ]
The Connection string is as follows: Dsn=Gauges; dbq=C:\DOCUMENTS AND SETTINGS\John Doe\MY DOCUMENTS\RptChart. xls; defaultdir=C:\DOCUMENTS AND SETTINGS\John Doe\MY DOCUMENTS; driverid=790;fil=excel 8.0; maxbuffersize=2048; pagetimeout=5
16. Click on the OK button in the Data Source Properties window.
The GaugesSource datasource is added to Data Source Connections list in the New Table or Matrix window and appears at the top of the list.
Create a Dataset based on the data in the Excel fi le Data that gets displayed in a report is obtained from a dataset. In this section you will see how you get a dataset by using a query.
1. Click on the Next button in the New Table or Matrix window.2. The Design a query page of the New Table or Matrix wizard is displayed. 3. Type in the following statement and hit on the (!)[Query run] button. Select * from [Sheet1$]
The query is executed and the result is displayed as shown:

For More Information: www.packtpub.com/learning-sql-server-2008-reporting-services/book
Working with the Report Builder
[ 334 ]
Design a report to display the data Once the dataset is available then the report can be laid out to display this data. Again you will follow the wizard to fashion the report to display the data.
1. Click on the Next button.The Arrange fi elds page of the New Table or Matrix wizard gets displayed.
2. Click on Time and drop it on the Values fi eld and drop each of First, Second_, (an underscore is appended to Second as it would represent a system variable otherwise) and the Third on the Row groups as shown:
3. Click on the Next button to display the Choose the layout page of the wizard.
4. Click on the Next button on the Choose the layout page.5. Choose a style (herein Mahogany) on the Choose a style page and click on
the Finish button.

For More Information: www.packtpub.com/learning-sql-server-2008-reporting-services/book
Chapter 6
[ 335 ]
The report design gets displayed in the design surface of Report Builder as shown:
6. Run the report from Home | Run (F5).The report is displayed as shown in the following fi gure:
Format a column based on some criterion In the above report in the third column, there is a wide variation in the value of the rows. The purpose of this is to demonstrate using a condition in the expression. This section shows how you may use the Expression to set the color of that textbox based on the value it contains when you run the report.
1. In the design of the report, select the textbox for the Third (third row second Column).

For More Information: www.packtpub.com/learning-sql-server-2008-reporting-services/book
Working with the Report Builder
[ 336 ]
2. Right-click to access the textbox's properties.3. In the Text Box Properties window, click on the navigation item Fill.4. In the Fill page, click on the symbol fx to open the Expression window for the
Fill Color.5. In the Expression window, type in the expression as shown in the following
screenshot. This screenshot has two windows superposed. By using this expression you are changing the background color of the textbox. The expression contains the value that will appear in the textbox. Now you are using the Program Flow function in the Expression window to coin the expression. The syntax of this function is also displayed in the Expression window. The expression contains a nested IIF function. If the value is greater than or equal to 10, the background will be Blue otherwise the color will depend on another condi-tion. If the value is greater than or equal to 1, (must be less than 10 because of nesting) it will be Yellow. If less than 1 it will be Red.

For More Information: www.packtpub.com/learning-sql-server-2008-reporting-services/book
Chapter 6
[ 337 ]
6. Click on the OK button in the Expression window and also on the OK button in the Text Box Properties window.
7. Run the report from the "ribbon".The report gets displayed as shown in the following screenshot:
Create a chart to display the data The chart you will be creating will be based on the data. You will be using the chart template to begin creating the chart. You will be using the placeholders on the chart to associate data with the details you will be displaying in the chart.
1. Return to the design view of the report by clicking on the Design button of the Run tab.
2. Enlarge the length of the report body by dragging down the bottom side of the report to create space for the chart.
3. Click on Insert | Chart | Insert Chart and then click in the space you created.

For More Information: www.packtpub.com/learning-sql-server-2008-reporting-services/book
Working with the Report Builder
[ 338 ]
4. The Select Chart Type window gets displayed as described earlier. Accept the default choice and click on the OK button.This adds a chart template to the report as shown. All objects shown on the chart can be confi gured.
5. On double-clicking inside the chart, the drop data fi elds appear on the three sides of the chart as shown:

For More Information: www.packtpub.com/learning-sql-server-2008-reporting-services/book
Chapter 6
[ 339 ]
6. Click on Time in the Report Data and drag it over and drop it on the Drop category fi elds here.
7. Click on First in Report Data and drag it over and drop it on the Drop data fi elds here.
8. Repeat the previous step for the Report Data fi elds Second_ and Third.9. The design of the chart now appears as shown in the following screenshot
showing the drop fi elds. The chart in the design view is not the data from the source but shows how the chart would look when rendered.
10. Run the report from the "ribbon".The chart in the report is displayed as shown:

For More Information: www.packtpub.com/learning-sql-server-2008-reporting-services/book
Working with the Report Builder
[ 340 ]
The chart data region has a large number of properties which allows you to fi ne tune the formatting of the chart. All properties are accessible in the design. The best place to obtain information is the online documentation (Help menu). In addition to the regular properties, the properties that you can assign using expressions provide even more options to format.
Add gauges to display the data Gauges add visual features to enhance the aesthetic appearance as discussed earlier. However, whether gauges are more appealing than just data is a matter open for discussion. We will see how to add gauges here:
1. Click on the report to display the report handles. Right-click the last column and from the drop-down menu that gets displayed click on Insert Column | Right.This inserts an extra column on the right.
2. Click on Insert | Gauge and click on the Data cell of the new column you created.The Select Gauge Type gets displayed.
3. Accept the default that shows up and click on the OK button.A gauge gets placed in the cell as shown:
The vertical side was extended to improve the display.4. Double-click the gauge to display its confi gurable features as shown:

For More Information: www.packtpub.com/learning-sql-server-2008-reporting-services/book
Chapter 6
[ 341 ]
Let us say that this Gauge should represent the data in the second column of our report table.
5. Drag Second_ from Report Data and drop it on the location Drop Data fi elds here.Alternatively you may also choose the drop-down from the data list icon that appears in that textbox when you hover over it.
6. Click on Home | Run to process and display the report.The report gets displayed as shown (only part of it shown).
Observe that the gauge needle is pointing at the values in the Second_column.

For More Information: www.packtpub.com/learning-sql-server-2008-reporting-services/book
Working with the Report Builder
[ 342 ]
Add a report item to display the average value of a column Gauges can show not only item data but they can also be used to show aggregates such as SUM, Average and so on. In this section, you will be creating another display type of a gauge and associating the average value of a column.
1. Right-click the data cell of second column (second column, second row).2. Choose from the drop-down menu Insert Row | Outside Group Below.3. Right-click the inserted textbox to access the properties of the Tablix as
shown and click on Outside Group Below.

For More Information: www.packtpub.com/learning-sql-server-2008-reporting-services/book
Chapter 6
[ 343 ]
This adds a textbox outside the group for the second column as shown in the following screenshot:
4. Right-click the inserted textbox and click on Expression….5. At the top, in the Set expression pane type in ="Avg= " &.6. Expand the category Common Functions. Click on Aggregate to expand. In
the Item fi eld double-click Avg.7. The Set expression for: Value gets fi led with "="Avg= "& Avg (".8. Now click on Fields (DataSet1) and in the Values: fi eld double-click Second_. 9. The expression now becomes "="Avg= " & Avg(Fields!Second_.Value".10 Close the parentheses to make the expression complete as shown: ="Avg= " & Avg (Fields!Second_.Value)
11. The textbox you created now gets this expression.12. Click Home | Run to run the report. It is displayed as shown in the
following screenshot, on the second page of the report.

For More Information: www.packtpub.com/learning-sql-server-2008-reporting-services/book
Working with the Report Builder
[ 344 ]
Add a gauge to display this average In this section you will add a single gauge in the same column as the others but outside the group, and set its value to represent the group average of the second column:
1. Click Insert | Gauge and drop it on the intersection of the last row. This row is outside the group and the column containing the gauge from the previous section.The Select Gauge Type gets displayed.
2. Select the default Linear type (the fi rst one).The linear type gauge gets added to the report.
3. From the dataset, click on Second_ to add it to the gauge as shown:
4. Now the Linear Pointer gets the value [Sum (Second_)].5. Right-click the Linear Pointer and choose to review the Pointer Properties….
The Linear Pointer Properties window gets displayed as shown:
6. Click fx to open the Expression window and alter the value displayed to the following.
=Avg(Fields!Second_.Value)
7. Close the Expression window and close the Linear Pointer Properties window.

For More Information: www.packtpub.com/learning-sql-server-2008-reporting-services/book
Chapter 6
[ 345 ]
8. Run the report from Home | Run.The report gets displayed as shown (only the relevant part is shown):
The linear gauge now displays the same average value as seen in the above screenshot. There is a row and a textbox that do not have any data shown in the above (row above and the textbox to the right of the average) and these may be prevented from showing up by using the hide property.
Create a bookmark and jump to it Bookmarks are also like hyperlinks in web pages but they jump to another part in the same document. Microsoft Word supports adding bookmarks to several locations in the document and makes a provision to jump to them. In web pages, the same is achieved by having links and anchors (http://www.w3.org/TR/REC-html40/struct/links.html). In this section you will create a bookmark for the title of Second Column. This way when you click on the Second series on the chart, the display changes to the second column title.
Create a bookmark using the Bookmark property You need to create a bookmark fi rst:
1. Click View and place a check mark in the Properties checkbox.This allows you to access the Properties window for all objects in the report. right-clicking on an object shows only a limited number of available properties.
2. In the design view of the report click on the Second column title. 3. In its Properties window type in the text Go to data for its Bookmark
property. This is shown in the following screenshot:

For More Information: www.packtpub.com/learning-sql-server-2008-reporting-services/book
Working with the Report Builder
[ 346 ]
Jump to bookmark using the Action property There are basically two steps in order to have the ability to jump to a known location. The fi rst step is to create a bookmark and the next step is jump to it. Different parts of the report builder are used and this section shows how you may do it.
1. In the design view of the chart, click on the series Second_ as shown and set its Action property to Go to Data as shown:

For More Information: www.packtpub.com/learning-sql-server-2008-reporting-services/book
Chapter 6
[ 347 ]
2. Run the report from Home | Run.3. Verify that only the series Second_ in the chart takes you to the top of
the report.
SummaryThe Report Builder 2.0 tool is described in full starting from the top to the bottom of this interface. Creating reports with this tool is described using an existing report and modifying it as well as creating a new report from data. Embedding charts and gauges are also described. Some of the interactive and rich text features are also discussed.
Report Builder 1.0 is briefl y mentioned but its utility for reports models created using VS 2008 or BIDS did not warrant an example due to current limitations. It may be possible to use this tool with Report Models created with an earlier version of SQL Server. One of the main features of Report Builder 2.0 is its ability to create Ad Hoc reports and this will be described in detail in the next chapter. The reader may notice slight differences in the look of the interfaces slightly at variance depending on the version of the SQL Server 2008 and Report Builder 2.0 used.

For More Information: www.packtpub.com/learning-sql-server-2008-reporting-services/book
Where to buy this book You can buy Learning SQL Server 2008 Reporting Services from the Packt Publishing website: http://www.packtpub.com/learning-sql-server-2008-reporting-services/book
Free shipping to the US, UK, Europe and selected Asian countries. For more information, please read our shipping policy.
Alternatively, you can buy the book from Amazon, BN.com, Computer Manuals and most internet book retailers.
www.PacktPub.com