learning races and dynamic capabilities
TRANSCRIPT

1
Learning Races and Dynamic Capabilities
Terry L. Amburgey Joseph L. Rotman School of Management
University of Toronto Phone: 416-978-4063
Fax: 416-978-4629 [email protected]
Tina Dacin
Department of Management Texas A&M University Phone: 409-845-4882
Fax: 409-845-9641 [email protected]
Jitendra V. Singh
Department of Management Wharton School
University of Pennsylvania Phone: 215-898-0401
Fax: 215-898-0401 [email protected]
We gratefully acknowledge the support of the Emerging Technologies Management Research Program, under the aegis of The Huntsman Center for Global Competition and the Sol C. Snider Center for Entreprenuership, both at the Wharton School, University of Pennsylvania. Special thanks to Ranjay Gulati for his many helpful comments and suggestions.

2
Learning Races and Dynamic Capabilities
ABSTRACT
This paper examines the initiation of strategic alliances by biotechnology firms. The literature on
organizational learning and strategic alliances suggests that, in many instances, alliances constitute
learning races where firms compete to learn as rapidly as possible. We conceptualize
biotechnology alliances as constituting sequential learning races and derive 7 hypotheses
concerning factors that influence the rate at which firms initiate alliances. We test the hypotheses
using event history data for 847 biotechnology firms for the period 1973 - 1997. Our analysis
indicates that biotechnology firms engage in learning races within alliances and also learn how to
race more effectively over multiple alliances.

1
INTRODUCTION
The interplay between competition and cooperation has become a central issue in strategic
management and organization theory. This interplay has been reflected in work on collusion,
political strategy, joint ventures, and more recently on strategic alliances. The surge in the use of
strategic alliances has sharpened the focus on competition and cooperation as theorists and
researchers observe competition within cooperative relationships. In particular, observers have
noted the emergence of races in the context of strategic alliances (Hamel, 1991).
Races between organizations occur in a variety of forms. Firms can race to introduce new
products or services (Schoonhoven, Eisenhardt, and Lyman, 1990), to acquire intellectual
property (Kamien and Schwartz, 1982), or to acquire capital (Amburgey, Singh, and Singh,
1996). In some cases, organizational races are winner-take-all situations where only one
organization receives benefits. In other cases, more than one organization can receive benefits,
with the level of benefits depending on the organization’s position relative to other organizations.
Analytically, any situation where the benefits received by an organization at some point in time
depend on its position relative to one or more other organizations constitutes a race (Khanna,
Gulati, and Nohria; 1998).
Learning races are an increasingly salient class of races, both because they appear to be increasing
in number and because theoretical developments are placing them in a more central role as an
explanation of organizational actions. Learning races (e.g. temporal competition to learn)
frequently occur in technologically intensive arenas with technological innovation and

2
obsolescence providing temporally dependent benefits to firms. However, increasing globalization
is stimulating learning races in which the valuable knowledge is cultural or institutional rather than
technical. Theoretically, learning races are salient because they can constitute the dynamic
acquisition of capabilities (Teece, Pisano, and Shuen; 1997). The resource- based theory of the
firm (Barney, 1986; Penrose, 1959; Wernerfelt, 1984) emphasizes the primacy of assets that are
valuable, rare, and inimitable. Intangible assets such as knowledge, skills, and capabilities tend to
have these characteristics, particularly if they result from path dependent processes since path
dependence implies that imitation requires a replication of an organization’s history. In this paper
we examine both intratemporal and intertemporal aspects of learning races and examine multiple
race situations where the races can be both simultaneous and temporally ordered. Furthermore,
while most attention has been on the learning as the acquisition of technical or market knowledge,
we expand our attention to the acquisition of capabilities for learning - learning how to effectively
and efficiently acquire knowledge. Thus, we make an important contribution by focusing on two
important and related issues: that firms race to learn and additionally, that firms learn how to race.
The most influential area of theorizing within strategic management in recent times is the dynamic
capabilities approach developed by Teece, Pisano and Shuen (1997). The resource based view of
the firm identifies organization-specific capabilities and assets and the existence of isolating
mechanisms as the primary determinants of performance. As Teece, et. al. (1997: 514-515) point
out, this perspective invites consideration of how firms develop new capabilities and propose the
dynamic capabilites model. They define dynamic capabilities as "...the firm's ability to integrate,
build, and reconfigure internal and external competences to address rapidly changing

3
environments" (1997: 516). Learning how to more effectively engage in learning races is clearly
an important dynamic capability (Teece, et. al., 1997:520).
STRATEGIC ALLIANCES AND LEARNING RACES
A number of studies have examined strategic alliances among biotechnology firms using a variety
of conceptual and methodological approaches. Much of the recent work on strategic alliances
focuses upon the organizational networks that result from the formation of formal alliances, while
another stream of work emphasizes alliances as a strategic choice of individual firms (Barley,
Freeman, and Hybels, 1992). One theme common to most of this research is the consolidation of
complementary assets through the formation of strategic alliances. The true competence of
biotechnology firms is applied research devoted to the exploitation of specific scientific
discoveries; not basic research of the kind conducted in universities and governmental
laboratories, nor the engineering capabilities and marketing system necessary for large scale
production and distribution found in conventional firms (Gambardella, 1995). This disparity in
competencies and assets led to a division of labor between universities and government
laboratories, biotechnology firms, and large traditional firms. The complementary assets held by
each type of organization could then be consolidated through interorganizational relationships
such as strategic alliances (Gambardella, 1995: 147-148).
The consolidation of complementary assets has provided a powerful explanation of strategic
alliances among biotechnology firms as well as alliances in other settings. However practitioners
and theorists have noted the importance of another process as well: organizational learning. In
many instances the primary purpose of an alliance is not the consolidation of complementary

4
assets with a partner but the acquisition of knowledge and know how from a partner (Powell,
Koput, and Smith-Doerr, 1996; Gambardella, 1995; Gulati, 1995). In fact, even when the primary
motivation is the consolidation of complementary assets, organizational learning can provide
substantial benefits.
The acquisition of knowledge and know how from a partner reintroduces competition to the
cooperation involved in the consolidation of complementary assets. Not surprisingly, the most
recent theoretical work has focused on learning races. Khanna, Gulati, and Nohria (1998) provide
a rigorous theoretical framework for understanding the dynamics of learning races. One specific
purpose of this work is to “...show how asymmetric incentives to allocate resources to learning
may arise, even when there are no ex ante asymmetries between firms” (1998: 193). In this model,
two types of benefits accrue to participants - private and common. Private benefits accrue to
individual firms as they acquire skills and know-how from their partner(s) and they can be
acquired unilaterally. Common benefits require the creative synthesis of knowledge held by all
partners and, therefore, their production and acquisition require the active participation of all
partners (Khanna, et. al., 1998: 195). The incentive for a firm to race (engage in temporal
competition for learning) is a function of the ratio of private benefits to common benefits. If only
common benefits occur, there is no incentive to race against the partner; if only private benefits
occur the firms will race against one another and the winner exits the alliance. As the ratio of
private benefits to common benefits increases, the incentive to race grows; as it declines the
incentive to race is reduced (Khanna, et. al., 1998: 201).
THEORY AND HYPOTHESES

5
Our approach to learning races is similar the framework proposed by Khanna, Gulati, and Nohria
(1998), but there are both minor and significant differences. The minor difference involves a shift
from a discrete stage based model to one operating in continuous time. The major differences
involve an extension to parallel and sequential races, a redefinition of private and common
benefits, and a redefinition of racing.
First, it is important to recognize that firms are frequently involved in multiple strategic alliances
at the same time and that they are involved in sequences of strategic alliances over time. In other
words firms are frequently involved in parallel races and temporally sequenced races. The
existence of parallel races allows interdependence between races at a given point in time. As a
consequence, the dynamics of one race can be affected by actions taken in another race. The
existence of sequences of races raises the possibility of intertemporal effects; the actions taken
within the context of a given race may have implications that extend into future races. As a
consequence, decisions made within the context of a given race may be influenced not only by
immediate consequences but perceptions of future consequences as well.
The second modification involves a redefinition of private and common benefits. Khanna, Gulati,
and Nohria (1995) define private benefits as benefits that can accrue to a firm without active
learning on the part of its partner. Common benefits, on the other hand, only accrue to a firm with
active learning by the partner. The pace at which private benefits are generated for each firm is
determined by its investment in learning; the pace at which common benefits are generated for
each firm is determined by the rate of learning of the slowest firm. This difference between private

6
and common benefits is at the core of their model. Private benefits encourage competition (racing)
since the pace of learning is under the control of the individual firms. Common benefits
discourage competition since no firm can learn faster than its partner can learn.
We propose a different approach. We define common benefits as the benefits made available to
the partners through cooperative interaction. These benefits can take a variety of forms including
the fruits of consolidated complementary assets as well as the rewards of learning. Since they
involve the benefits produced by the consolidation of complementary assets, they can continue to
accrue to the partners in a strategic alliance even after the partners have ceased to learn. We
define private benefits as the benefits which have been appropriated by individual firms and are
available for their use in a given alliance, parallel alliances, future alliances, or non-alliance
activities. They may include the income stream generated by consolidated assets or knowledge
that has been converted into a form useful to the firm. Since our interest is in learning and learning
races, we focus on the benefits of knowledge and learning while recognizing the existence of
other types of benefits.
The last modification involves a shift of focus from the termination of alliances to the formation of
alliances. Khanna, Gulati, and Nohria (1998) propose a model where the termination of an alliance
is always the result. Since the only benefits are learning benefits, alliances not producing learning
are not productive. As a consequence their focus is on whether firms race to learn and then
terminate the alliance or patiently wait until learning is completed and then terminate the alliance.
An extension of the model to include strategic alliances where learning is not the only (or even

7
primary) motivation requires a conceptual redefinition of competition within cooperative
relationships.
We define racing not as a temporal competition to learn as rapidly as possible and then to
terminate an alliance but rather as a temporal competition to learn as rapidly as possible and then
initiate a new alliance. The existence of common benefits produced by the consolidation of assets
suggests that an alliance will last as long as the consolidated assets produce benefits, not as long
as the partners continue to learn. On the other hand, the rapid pace of technological development
and the increasingly dense network structure of biotechnology indicates that it is important for
firms to constantly update their knowledge base through embeddedness within the network of
firms (Powell, Koput, and Smith-Doerr, 1996). We argue that firms will focus their investment in
learning in a particular alliance only as long as that ‘investment’ produces greater private benefits
than initiating a new alliance and a new round of learning. When the potential learning benefits of
a new alliance outweigh the learning benefits of the most recent alliance, firms will have an
incentive to initiate a new alliance.
Our approach to learning races gives the ability of firms to learn the key role. We focus on the
conversion of common benefits to private benefits. We propose that, within a given alliance, all
learning benefits begin as common benefits. Over time, firms convert common benefits to private
benefits with the rate of appropriation determined by a firm’s learning ability. Moreover, we
propose that the learning ability of a firm is history dependent across a temporal sequence of
alliances; biotechnology firms learn how to learn.

8
Hypotheses
A substantial amount of theorizing and empirical research indicates that, as in other settings, the
consolidation of complementary assets is an important determinant of the formation of strategic
alliances by biotechnology firms. However, in addition to the consolidation of assets, we propose
that learning and its benefits significantly affect the dynamics of strategic alliance formation. We
propose 7 hypotheses; the first hypothesis relates to intra-alliance dynamics (e.g. the dynamics of
alliance formation within the context of a given learning race) while the next three hypotheses
focus upon inter-alliance (across a sequence of races) dynamics. The final three hypotheses
incorporate variations among different types of partners and alliances.
When a firm initiates an alliance with another organization, it begins a process of information
exchange and interaction that provides a forum for learning. This forum provides both declarative
and procedural knowledge to the cooperating partners (Kogut and Zander, 1992: 387; Cohen and
Bacdayan, 1996: 557). The information exchanged between the organizations typically involves
declarative knowledge, knowledge of facts and propositions. For example an organization may
provide to its partner ‘the type of data provided by our system for screening serotonin receptor
sites’ or ‘the market potential for protease inhibitors in Japan’. The ongoing interaction between
the partners provides procedural knowledge, knowledge of how to do something. For example,
by observing the behavior of its partner a firm can see ‘how to minimize contamination when
processing samples’ or ‘how to structure licensing contracts with overseas distributors

9
A great deal of discussion about the differences between declarative and procedural knowledge
exists in the literature on organizational learning. At this point, we want to emphasize that both
declarative and procedural knowledge is produced as a common benefit that is available to all
participants in the cooperative alliance. A partner in the collaboration receives value only to the
extent that it can convert the available common benefits into private benefits. In other words,
common benefits are potential benefits; organizational learning involves the appropriation and
exploitation of these potential benefits. We argue that the conversion of common benefits to
private benefits drives the dynamic of individual learning races.
Although there are presumably large differences between procedural and declarative knowledge
and how they are converted to produce private benefits, the conversion of both types of
knowledge requires investment on the part of an organization. The conversion of external
procedural knowledge to internal procedures is an arduous task. Procedural knowledge tends to
be tacit and learned experientially. Moreover, the modifications of existing procedures and the
creation of new procedures requires ‘unlearning’ as well as learning - old procedures are
discarded as new procedures are adopted (Huber, 1991: 104). Within the context of strategic
alliances, the acquisition and conversion of procedural knowledge is a coevolutionary process
(von Krogh and Roos, 1996: 39). External procedures are not only observed directly but as an
organization converts procedural knowledge the interaction of its new procedures and the
procedures of its partner provides additional information.

10
The conversion of declarative knowledge to a form useful to an organization also presents
difficulties. Information which is codified requires the ability to decode so the syntactical rules
required to decipher information must exist in the firm (Kogut and Zander, 1992: 386). The
conversion of declarative knowledge depends on the existing knowledge base of the organization.
As Powell, Koput, and Smith-Doerr (1996: 120) point out, “Knowledge facilitates the use of
other knowledge. What can be learned is crucially affected by what is already known”. This
suggests that the conversion of declarative knowledge requires unlearning as well as learning and
occurs through a coevolutionary process.
We argue that the dynamic of organizational learning and alliance formation within a given period
of time is driven by the conversion of common benefits to private benefits and reflects the relative
values of exploitation and exploration over time. March (1991) provides a model of
organizational learning and action that distinguishes between the development and improvement
of existing knowledge and procedures (exploitation) and the discovery of new knowledge and
procedures (exploration). March (1991) proposes that both activities are necessary for an
organization but the two activities present a tradeoff. We propose that the conversion of common
benefits to private benefits within a strategic alliance represents exploitation while the initiation of
a new alliance represents exploration. Further, we propose that biotechnology firms resolve the
tradeoff by comparing the value that they would expect to receive from exploitation (focusing
their efforts on further conversion of common to private benefits within an alliance) from the
value they would expect to receive from exploration (initiation of a new alliance and a new pool
of common benefits).

11
What dynamic pattern of alliance formation would we expect if this representation of learning
races were accurate? Immediately after the formation of an alliance, the interaction of partners
begins to produce a pool of common benefits. Since little or no exploitation has taken place, the
tradeoff faced by the organization is a comparison of the current pool of common benefits to the
pool of common benefits that can be obtained by further exploration - the initiation of a new
alliance. The likelihood of a new alliance formation is little different than immediately preceding
the formation of the current alliance.
However, once the conversion of the present pool of common benefits begins, the situation faced
by the firm is different. As March (1991: 73) pointed out, “The certainty, speed, proximity, and
clarity of feedback ties exploitation to its consequences more quickly and more precisely than is
the case for exploration...These advantages for exploitation cumulate.” The coevolutionary
interaction between partners enhances the firm’s ability to convert common benefits to private
benefits and leads to increasing value from the current alliance (exploitation) compared to the
potential value from initiating an additional alliance (exploration). Since the value of continued
exploitation increases over time and the value of exploration decreases over time, the likelihood of
the formation of a new alliance decreases with the duration of the most recent alliance.
The pool of common learning benefits produced by cooperative interaction with an alliance
partner may be substantial but it is finite. We argue that the same is true of the firm’s competence
in learning from a given partner. In contrast to March (1991: 73) who proposes that
12
“...organizations exhibit increasing returns to experience...” we propose that organizations exhibit
marginally declining returns to experience within a given alliance. Experience improves the firm’s
ability to learn from its partner but, over time, the incremental improvements to competence
decline in magnitude. A ceiling on competency coupled with a finite pool of common learning
benefits suggests that, after some point, the conversion of common benefits to private benefits will
begin to decline. The value of continued investment in learning within the given alliance
(exploitation) declines relative to the potential value of a new pool of common benefits
(exploration). Consequently, the likelihood of the formation of a new alliance increases.
We propose that the value received from the conversion of common learning benefits to private
benefits (exploitation) increases and then decreases over time during a given strategic alliance;
conversely the value of exploration (initiation of a new alliance) declines and then rises. The
specific time path will undoubtedly vary among biotechnology firms, depending upon prior
experience, size, age, the stock of intellectual capital, et cetera. Nonetheless, we expect the rate of
alliance formation to have a U-shaped relationship with the elapsed time since the formation of the
last alliance. One way to capture this effect is to use a second order polynomial function of
elapsed time (elapsed time and its square). As a general hypothesis we propose:
Hypotheses 1. The rate of alliance formation decreases with the elapsed time since the most recent alliance was formed and increases with the square of the elapsed time since the most recent alliance was formed.
Intertemporal Effects Our first hypothesis relates to the dynamics of alliance formation within the context of a single
strategic alliance. Is this the only, or best, context to approach organizational cooperation and

13
learning? A substantial body of theory and research suggests that it is not. March (1991: 81)
pointed out that a “...major feature of the social context of organizational learning is the
competitive ecology within which learning occurs and knowledge is used”. More specifically
March (1991: 81-85) argues that the existence of a competitive ecology stimulates an emphasis on
relative position (learning races) and alters the relative value of exploitation and exploration
(within race conversion of common benefits to private benefits versus the creation of new pools of
common benefits). Empirically, recent research on strategic alliances among biotechnology firms
documents the existence of a competitive ecology of learning wherein firms are locked in a
struggle for relative position (Powell, Koput, and Smith-Doerr, 1996). The existence of a
competitive ecology is not idiosyncratic to biotechnology. Research on strategic alliances in other
industrial contexts leads to similar conclusions (Gulati, 1995).
What implications arise within the context of multiple sequentially ordered alliances? The most
obvious is that it shifts the theoretical focus of competition for relative position from within-race
position to across-race position If there are no important interdependencies across sequentially
ordered races then a firm’s cumulative position is a simple aggregate of its sequence of races. The
important factors are those that affect the rate at which firms learn from partners in a race and
examination of multiple races is valuable only to the extent that it provides more data points for
estimating within race effects. If there are interdependencies across races, then a simple pooling or
aggregation is misleading; a given race’s sequential position provides information above and
beyond its cumulative value. We argue that there are important interdependencies across
sequences of learning races.

14
One simple form of interdependence is order within the sequence. We argue that having a given
number of alliances at any point in time has an effect above and beyond the stock of knowledge
produced by that number of alliances (learning races). A number of scholars have suggested that,
as a result of experiential learning and the effects of reputation, the dynamic behavior of alliance
formation depends on sequential order (Powell, Koput, and Smith-Doerr, 1996; Gulati, 1995). To
the extent that experiential learning is responsible for the order effect observed in previous
research, the implication is that a firm’s ability to learn, its absorptive capacity, is not a relatively
stable characteristic but rather a function of prior experience in learning from partners. This leads
to the following hypothesis:
Hypotheses 2. The rate of alliance formation increases with the number of prior alliances.
If, as March (1991) argues, organizations exhibit increasing returns to experience, Hypothesis 2
should hold across the entire sequence of alliances experienced by a biotechnology firm. If
experience produces declining marginal returns across races as well as within a race, then there
will be an additional empirical pattern observed across a sequence of alliances; early experience
will provide greater incremental benefits than later experience. This leads to our third hypothesis:
Hypothesis 3. The effect of prior alliances on the rate of alliance formation declines with the number of prior alliances.
Although hypotheses 2 and 3 are plausible and grounded in prior theory and research, the effects
of reputation and access to complementary assets produce serious potential confounds. Powell,

15
Koput, and Smith-Doerr, (1996) and Gulati (1995) argue that a history of forming alliances with
other firms produces a reputation for cooperative behavior and trustworthiness. This good
reputation makes a firm a more desirable partner for a strategic alliance and increases the
likelihood of alliance formation over time.
Similarly, a greater number of strategic alliances embeds a firm more deeply in a network of
complementary assets and makes it a more desirable partner. Research on capital races indicates
that embeddedness in a network of complementary assets signals an enhanced capacity for
generating economic rents (Amburgey, Singh, and Singh, 1996) and the research of both Powell,
Koput, and Smith-Doerr (1996) and Gulati (1995) emphasize the importance of network
centrality above and beyond the simple number of alliances. In short, hypothesis 2 is entirely
consistent with the effects of both reputation and network embeddedness. To the extent that
reputation and access to complementary assets also exhibit declining marginal returns, hypothesis
3 is also confounded.
One way to analytically separate the effects of reputation and network embeddedness from
experiential learning across a sequence of alliances is to examine directly whether or not
sequential position affects intra-alliance dynamics. The effects of reputation and network
embeddedness operate to affect the base rate of alliance formation across a sequence of alliances;
each alliance increases the likelihood of a subsequent alliance. Notions of reputation and
embeddedness are mute with regard to the dynamics of alliance formation within the duration of a
given alliance. Experiential learning, on the other hand, leads to specific predictions regarding

16
intra-alliance dynamics. If, in fact, the absorptive capacity of a firm is dependent on its history of
alliance formation then the conversion of common benefits to private benefits is increasingly rapid
across a sequence of alliances. Each alliance will exhibit a U-shaped pattern but the slopes of the
‘U’ will be increasingly steep. This suggests our fourth hypothesis:
Hypothesis 4. The effects of elapsed time since the most recent alliance was formed and the square of the elapsed time since the most recent alliance was formed, increase with the number of alliances formed.
Types of Alliances and Partners
We expect a different dynamic of formation rates for commercial and research alliances since
there are substantial differences between the two types of cooperative activity. First, the
interaction between partners varies across the two types. Both research and commercial alliances
typically involve contracting but joint research involves more intense interaction than licensing and
distribution agreements. Second, research alliances involve the core competencies and assets of
the biotechnology firms in the alliance while commercial alliances do not. Broadly speaking,
research alliances require the firm to conduct research while commercial alliances involve the
commercialization of products or processes where the foundation research has already been
conducted (the licensing of patents from universities or government agencies are exceptions to the
general rule). Finally, the nature of the partners varies across the two types. Commercial alliances
generally involve downstream partners while research alliances involve a mix of upstream and
downstream partners and other biotechnology firms.
As a consequence of the more intense interaction, we expect that research alliances produce
common benefits more rapidly. Similarly, the greater involvement of the core capabilities and

17
assets in research alliances suggests that the conversion of common benefits to private benefits
will occur at a greater pace. . Consequently we propose the following hypothesis:
Hypothesis 5. In research alliances, the rate of alliance formation decreases more rapidly with the elapsed time since the alliance was formed and increases more rapidly with the square of the elapsed time since the alliance was formed.
Partner Specific Experience
Just as alliances can vary by type, so can alliance partners. One important way that alliance
partners can vary is by familiarity, i.e. whether or not the current partner has been an alliance
partner at a previous point in time. The nature of ‘repeated ties’ among alliance partners has been
the focus of both theoretical and empirical work by scholars. For example, this work has
emphasized the importance of trust and the social structuring of network relations in alliance
process (Eisenhardt and Schoonhoven, 1996;Gulati, 1995a ; Gulati, 1995b ; Ring and Van de
Ven, 1992). This stream of work suggests that the development of alliances and the type of
governing mechanism used to coordinate the activities of the partners depend on the trust existing
between allied companies.
A related, but analytically distinct, aspect of repeated ties between alliance partners is the role of
partner-specific experience in learning. For example Gulati (1995a: 92) argues that “The idea of
trust emerging from prior contact is based on the premise that through ongoing interaction firms
learn about each other and develop trust around norms of equity…”. We argue that firms learn
about each other and, in subsequent alliances, they more rapidly develop common benefits and

18
more rapidly convert common benefits to private benefits. Consequently we propose the following
hypothesis:
Hypothesis 6. In repeat alliances, the rate of alliance formation decreases more rapidly with the elapsed time since the alliance was formed and increases more rapidly with the square of the elapsed time since the alliance was formed.
Domestic and International Alliances
We believe that the learning dynamic proposed is also moderated by the nationality of the alliance
partner (same country or different country). We argue that cultural differences between alliance
partners inhibits organizational learning in a number of ways. Differences in the basic cultural
assumptions about social interaction coupled with differences in language inhibit effective
communication through errors in interpretation and other losses of meaning. Differences in
organizational structures and operating procedures and incompatible organizational practices slow
learning by inhibiting the integration of social networks and mismatches of personnel and skills.
Cultural differences between alliance partners are likely to have their strongest impact on the
conversion of procedural knowledge. In many respects a firm’s ability to appropriate declarative
knowledge is a function of its technical expertise rather than its cultural characteristics.
Organizational practices, on the other hand, are inevitably embedded within a larger matrix of
cultural practices and institutional arrangements. Since we believe that experiential learning and
the acquisition of procedural knowledge provide the basis of absorptive capacity and determine
the basic dynamic of learning races, learning in cross-cultural alliances should proceed at a much
slower pace. Consequently we propose the following hypothesis:

19
Hypothesis 7. In domestic alliances, the rate of alliance formation decreases more rapidly with the elapsed time since the alliance was formed and increases more rapidly with the square of the elapsed time since the alliance was formed. DATA AND METHODS
The data used in the study consists of 847 new biotechnology firms founded during the period
1973 to 1997. The significance of the beginning date was the major Cohen-Boyer breakthrough of
1973. We used two primary sources to compile the sample. The first was the BIOSCAN database
published by Oryx Press. The second source was the U.S. Companies Database compiled by the
North Carolina Biotechnology Center (now Bioworld). We purged the consolidated list of
companies of all firms which were founded before 1973, which were not U.S. firms, or which
were non-independent entities (subsidiaries, divisions and joint ventures) to arrive at 847
companies. During the period under study, 235 firms exited from the industry through either
liquidation or acquisition.
These data, and other sources, were used to construct an event history for each company. Event
histories are data structures that include information on the number, timing and sequence of the
events that are being examined. Our research on biotechnology firms currently includes, in
addition to strategic alliances, date of incorporation or authorization to do business, liquidations,
name changes, mergers and acquisitions, patents, initial public offerings, secondary public
offerings, and private placements of equity. Each firm's history began at the time of its
incorporation or qualification to do business and ended at the time of an event or at the end of the
month, whichever came first. The organization's second spell began on the following day and
ended at the time of an event or the end of the month. This pattern continued until the firm exited

20
(through failure or acquisition) or until the end of the observation period, in which case spells
were coded as "right censored." This, procedure allowed time-varying covariates to be updated
throughout the firm’s history at monthly intervals.
A wide variety of sources were used to augment the information in our two primary sources. We
examined the legal archives on the Lexis-Nexis service to obtain exact dates of incorporation or
qualification to do business as well as dates of mergers, acquisitions, and changes of name. A
search of the news archives on Lexis-Nexis (including specialized outlets such as Biotechnology
News Watch) was used to identify dates of events. Similarly, the online archives of Recombinant
Capital provided supplemental information on strategic alliances. Information from the U.S.
Patent and Trademark Office was the primary source for the assignment of patents. In those cases
where only the month and year of an event could be determined, the day was set at the midpoint
of the month to minimize errors in timing.
Measures
The dependent variables are the alliance formation rate λ(t). The rate is defined as
λ(t) = lim[q(t, t+∆t)/∆t], ∆t→0
where q is the discrete probability of the firm initiating an alliance between t and (t+∆t),
conditional on the history of the process up to time t. This rate summarizes the information on the
intervals of time between successive events, with higher values of the rate corresponding to
shorter times between events and vice versa.
Independent Variables

21
Two types of independent variables were used in the analysis: attributes of the environment and
attributes of individual firms. Contextual variables included population density, corporate patents
granted, values of the NASDAQ monthly composite index, a venture capital availability index,
and counts of alliances by other firms. Population density was defined as the total number of
biotechnology firms in existence at the beginning of a calendar year. The density variable was
adjusted to reflect the disappearance of firms through failure, acquisition, or merger.
The annual number of corporate patents granted in genetic engineering was also included. This
variable was used to measure cumulative patent activity. The U.S. Patent and Trademark Office
publishes information on the exact timing of every patent issued. The number of patents granted
to corporations each year was constructed from this source. Annual counts of strategic alliances
among all biotech firms in the sample were used to capture competitive rivalry produced by
cooperative strategies. These counts were adjusted for each firm to remove their alliances and
patents.
Three measures of resource munificence were used. The availability of venture capital was
measured by venture capital indices obtained from Venture Economics and Price-Waterhouse-
Coopers. The NASDAQ (National Association of Securities Dealers and Quotes) monthly stock
index was used to measure the flow of capital into small firm equity investments. The third
measure was the total number of private placements of equity each month by the biotechnology
firms in the population.

22
The second set of variables measured attributes of the firms themselves. The first such variable
was age, measured as the number of days since the founding or qualification of the firm. The
second was the cumulative number of prior patents. This variable was updated whenever a patent
was granted. Six research domains were used to categorize the firms: diagnostics, therapeutics,
agricultural, veterinary, food/fermentation, and other. The BIOSCAN database and information
from the North Carolina Biotechnology Center was used to classify each firm. The number of
research domains in which firms were active was a simple count. In addition to the number of
domains, we created two dummy variables indicating whether or not the firms operated in the
pharmaceutical sector (human therapeutics and diagnostics) and in the agbio sector (agricultural
and veterinarian).
Finally, the cumulative number of alliances of various types were calculated. Commercial
alliances consisted of licensing, marketing, distribution or production arrangements but not pure
supply contracts. Research alliances consist of research and/or development linkages or contracts.
International alliances involved partners outside of the United States while domestic alliances
involved partners within the U.S. Finally, repeat alliances involved partners that the focal firm had
allied with previously while initial alliances involved partners allied with for the first time.
Information on these alliances was taken from the BIOSCAN database, the Actions Database
compiled by the North Carolina Biotechnology Center, and the archives of Recombinant Capital.
These counts were updated in the same fashion as prior patents.
23
Two elapsed time variables were used in the analyses; the elapsed time since the most recent
formation of an alliance and the square of this elapsed time. The event history segments constitute
a sequence of alliance formations and the associated elapsed times between the formation of
alliances. The elapsed time from the most recent alliance was tracked. This elapsed time clock was
then reset to zero upon the initiation of a new alliance. Our first hypothesis predicted a U-shaped,
curvilinear relationship between the elapsed time in a given alliance and the probability of a new
alliance being formed. We modeled this relationship as a second order polynomial by including the
elapsed time and its square. Our fourth hypothesis predicted that this U-shaped relationship would
have steeper slopes as the number of alliances increased. Our remaining hypotheses predict
steeper slopes for research alliances, alliances with previous partners, and international alliances.
The effects of prior alliances, alliance type, and partner type on the alliance dynamic were
modeled by including interaction terms for elapsed time and its square.
Model
The event series was modeled as a stochastic point process (Amburgey, 1986). The alliance rate
λ(t) was specified as an exponential function of the independent variables and a set of parameters
capturing the effects of the variables on the founding rate such that: λ(t)=exp(βXt).
Parameters were estimated by the method of maximum likelihood using the STATA program. The
estimation procedure clustered observations by firm to reduce the impact of unobserved firm-
specific effects (White, 1982). The significance levels of the parameters were evaluated by
examination of t-ratios, whereas the goodness-of-fit of the different models was evaluated by
examination of likelihood ratio statistics. The analyses (of necessity ) utilize the event histories of

24
firms subsequent to their first alliance. Excluding firms with no alliances left 547 firms for
analyses. Excluding the first alliance (used to start the elapsed time clock) left 5459 alliance for
analyses.
RESULTS
Table 1 provides frequencies for selected events occurring in the population during the
observation period. As can be seen, strategic alliances represent the most frequent events and
organizational failures the most rare. Among the strategic alliances, research alliances occur more
frequently than commercial alliances, domestic alliances more often than international alliances,
and one time only alliances more often than repeat alliances.
-Table 1 About Here-
Table 2 provides descriptive statistics for the independent variables used in the analyses, other
than interaction terms. Means and standard deviations, and correlations are provided for the
variables. Almost all of the covariates are significantly correlated with one another. However the
majority of correlations are relatively low (with such a large number of observations used for the
correlations, even weak relationships with be statistically significant). There is substantial
multicollinearity among several pairs of variables but the number of alliances is large enough to
provide adequate statistical power. The most serious problem produced by the multicollinearity is
inflation in the standard error of estimates; the increase in power provided by the large number of
events deflates the standard error of estimates.
-Table 2 About Here-
Table 3 provides parameter estimates and standard errors of estimates for four models of strategic
alliances. The first model contains parameter estimates for the control variables only. The second

25
model adds the number of prior alliances, the elapsed time in the current alliance and the square of
elapsed time. The third model substitutes the natural logarithm of prior alliances for the
cumulative count. The fourth model adds interaction terms, the product of elapsed time and the
number of prior alliances and the product of the square of elapsed time and the number of prior
alliances. Likelihood ratio tests comparing all of the models to a constant rate model are provided
at the bottom of each column.
-Table 3 About Here-
The estimates in model 1 indicate that eight of the control variables have a significant effect on the
rate at which biotechnology firms initiate a new alliance. Three of the variables are contextual; the
number of firms, the NASDAQ index of capital availability, and the total number of alliances
among the population. The remaining five variables are organizational; age, the number of
research sectors, the number of patents held by the firm, the number of private placements of
equity, and being publicly owned. Most of these factors accelerate the rate at which the firms
initiate a subsequent alliance but age, the number of other biotech firms and increasing valuation
of NASDAQ firms retard the rate.
Model 2 provides the estimates for the model including prior alliances and the elapsed time
variables. The second model provides estimates used to evaluate Hypotheses 1, 2, and 3. The
number of other firms, the number of alliances by other firms, and the NASDAQ index all affect
the formation rate of alliances. Age, the number of research sectors, public ownership, prior
patents, and prior private placements are organizational variables with effects. Three variables are
included in model 2 that were not included in model 1, the variables used to test our first three

26
hypotheses. The elapsed time since the most recent alliance has a significant negative effect on
the formation rate and the square of the elapsed time has a significant positive effect on the
formation rate. Our analysis of alliances provides support for Hypothesis 1. The number of prior
alliances significantly affects the formation rate of alliances. Hypotheses 2 is also supported by our
analysis of alliances. A likelihood ratio test comparing model 2 with model 1 indicates that model
2 provides a significantly better fit with the data.
Model 3 substitutes the natural logarithm of prior alliances for the arithmetic count of prior
alliances. The parameter estimate for the logarithm of prior alliances is positive and statistically
significant. Models 2 and three are not hierarchically nested so we can't use a likelihood ratio test
to evaluate the realtive goodness-of-fit for the two models. However the chi-squared value for
model 3 is substantially less than the chi-squared value for model 2 and both models have the
same degrees of freedom. This indicates that model 2 is preferable (Aikaike, 1974). As a
consequence, hypothesis 3 is not supported by the analysis. In all remaining models, the arithmetic
count of prior alliances is used rather than the logarithm of the count.
Model 4 adds the interaction terms and provides parameter estimates used to test hypothesis 4.
The effects of the control variables are similar to the effects in model 2 except for participation in
the agricultural sector which has a significant positive effect. The elapsed time interaction with
prior alliances is negative and significant. Similarly the interaction of the squared term and prior
alliances is positive and significant. The increased slopes of the 'U-shaped' elapsed time effects

27
predicted by Hypothesis 4 are supported by the analysis. A likelihood ratio test comparing model
3 with model 2 indicates that model 3 provides a significantly better fit with the data.
The next three tables provides the results of the analyses for several additional models of strategic
alliance formation. Table 4 provides parameter estimates and standard errors of estimates for two
models. Model 5 contains parameter estimates for a model including a dummy variable and
interaction terms for research alliances (the comparison being with commercial alliances). Model 6
is similar but it disaggregates prior alliances into prior research alliances and prior commercial
alliances. Likelihood ratio tests comparing both of the models to a constant rate model are
provided at the bottom of each column. The results provided in Table 4 indicate that, consistent
with hypothesis 5, the U-shaped effect of elapsed time is more pronounced for research alliances
than for commercial alliances. The estimates for the effects of the disagregated counts in model 6
indicate that prior research and prior commercial alliances have effects that are similar in
magnitude to each other and to the effect of the aggregate count of alliances. There doesn't
appear to be an analytic benefit to disaggregation and the chi-squared vales for the two models
suggest that there is no improvement in the goodness-of-fit of the models.
-Table 4 About Here-
Table 5 provides parameter estimates and standard errors of estimates for two models. Model 7
contains parameter estimates for a model including a dummy variable and interaction terms for
repeat alliances (the comparison being alliances with new partners). Model 8 is similar but it
disaggregates prior alliances into prior alliances with the current partner and prior alliances with
other partners. Likelihood ratio tests comparing both of the models to a constant rate model are

28
provided at the bottom of each column. The results provided in Table 5 indicate that, consistent
with hypothesis 6, the U-shaped effect of elapsed time is more pronounced for repeat partners
than for new partners. The estimates for the effects of the disagregated counts in model 8 indicate
that prior alliances with the current partner and with other partners have effects that are not
similar in magnitude to each other; the effects of prior experience with the same firm is
substantially greater. The effect of prior experience with other partners is similar to the effect of
the aggregate count of alliances. In this case there does appear to be an analytic benefit to
disaggregation and the chi-squared vales for the two models suggest that there is improvement in
the goodness-of-fit of the models.
-Table 5 About Here-
Table 6 provides parameter estimates and standard errors of estimates for two models. Model 9
contains parameter estimates for a model including a dummy variable and interaction terms for
international alliances (the comparison being with domestic alliances). Model 8 10 similar but it
disaggregates prior alliances into prior alliances with the international partners and prior alliances
with domestic partners. Likelihood ratio tests comparing both of the models to a constant rate
model are provided at the bottom of each column. The results provided in Table 5 indicate that
the U-shaped effect of elapsed time is more pronounced for international partners than for
domestic partners. The results of the analysis do not support hypothesis 7. The estimates for the
effects of the disagregated counts in model 10 indicate that prior alliances with international
partners and with domestic partners have effects that are not similar in magnitude to each other;
the effects of prior experience with domestic partners is larger. The effect of prior experience with
other partners is similar to the effect of the aggregate count of alliances. In this case there does

29
appear to be an analytic benefit to disaggregation (albeit in a pattern we find puzzling), and the
chi-squared vales for the two models suggest that there is improvement in the goodness-of-fit of
the models.
-Table 6 About Here-
In order to graphically display the pattern of results in our analyses, we've provided a set of
figures corresponding to the models in Tables 3, 4, 5, and 6. Each figure plots the multiplier of the
rate provided by elapsed time and appropriate interactions over the observed range of elapsed
time. The multiplier of the rate reflects the multiplicative effect of a variable or variables on the
rate net of other factors. Since it is multiplicative, values greater than 1 reflect an increase in the
rate while values less than 1 indicate a decrease in the rate. We truncated the value of the
multiplier at the value of 5 to facilitate comparisons.
Figure 1 displays the U-shaped elapsed time effect reflected in the estimates of Model 2. Figures
2, 3, and 4 display the U-shaped elapsed time effect reflected in the estimates of Model 4. In order
to display the prior experience interaction in the estimates of Model 4, we used three values for
number of prior alliances; 1, 10, and 20. The mean number of alliances among the spells used in
the analysis was approximately 9 with a standard deviation of approximately 13. The values used
roughly correspond to the mean plus/minus one standard deviation. As Figures 2, 3, and 4
indicate, experience substantially moderates the 'U-shaped' elapsed time effect.
-Figures 1, 2, 3, and 4 About Here-

30
The next set of figures display the elapsed time effects reflected in the estimates of Table 4.
Figures 5 and 6 display the different patterns for research and commercial alliances; the learning
dynamic for research alliances is substantially more rapid than for commercial alliances.
-Figures 5 and 6 About Here-
Figures 7 and 8 display the different patterns for repeat and first-time alliances; the learning
dynamic for repeat alliances is dramatically more rapid than for alliances with new partners.
-Figures 7 and 8 About Here-
Finally, Figures 9 and 10 display the different patterns for international and domestic alliances.
Contrary to our expectations the learning dynamic is more rapid with partners from other
countries than for partners from the United States.
-Figures 9 and 10 About Here-
DISCUSSION
A number of different theories predict that biotechnology companies should be involved in the
formation of strategic alliances with other firms. Similarly, there are good theoretical reasons to
believe that organizations will use strategic alliances as forums for learning and that strategic
alliances constitute learning races; a temporal competition with other firms to acquire knowledge
and capabilities. A substantial empirical literature, both quantitative and qualitative, supports these
proposals.
We believe that this research makes a contribution not by showing that firms race to learn, but
rather that firms learn to race. If, as Powell, Koput, and Smith-Doerr (1996) and others have
argued, biotechnology firms gain important benefits by becoming embedded in a network of

31
alliances, how can this be successfully accomplished? Typically, the answer given by organization
theorists is experiential learning; organizations develop a facility for creating alliances by creating
alliances. We adopted this view in Hypothesis 2 and the analyses supported the existence of
experientially based procedural know-how. Moreover, reliance on experiential learning sensitizes
us to the importance of intertemporal effects in organizational action. However, we believe that a
simple invocation of experiential learning is not an adequate response to the question.
First, an exclusive focus on experiential learning detracts our attention from the important trade-
off between exploitation and exploration delineated by March (1991) and Lant and Mezias
(1992). The benefits of embeddedness within a wide-ranging network of alliances are largely the
benefits of exploration. However, to be of use they must be exploited. The simple accumulation of
potential benefits is of little value if it comes at the expense of exploitation.
Our resolution of this conundrum was to propose that exploration does not, over time, come at
the expense of exploitation. Our fourth hypothesis proposed that experiential learning not only
provides procedural knowledge with regard to the efficient formation of alliances but that it also
increases the absorptive capacity of the organization. At any point in time, the organization faces
a tradeoff between exploitation and exploration and, within the bounds of organizational
rationality, chooses between the two according to relative value. Over time, exploitation and
exploration are mutually supportive. More efficient exploitation (e.g. conversion of common to
private benefits) allows for more exploration per unit of time; greater exploration provides

32
proficiency at exploitation. It is in this sense that we argue that the critical element of learning
races is learning how to race.
We believe that this research contributes to the dynamic capabilities perspective in two ways.
First, it provides empirical substantiation. Teece, et. al., (1997: 530) pointed out that their work
sketched an outline but that further theoretical work was needed to tighten the framework and
that empirical research was critical. The framework argues that a firm's competence and dynamic
capabilities are founded in it's processes which are shaped in turn by its asset positions and its
evolutionary path (1997: 524). Although our research is largely mute regarding assets other than
know-how, it shows not just that 'history matters' but speciifically where and how that it matters.
The second contribution involves theoretical 'tightening' of the framework. Teece, et. al., (1997:
520) define learning as "...a process by which repetition and experimentation enable tasks to be
performed better and quicker". We believe that conceptualizing exploitation (repetition) and
exploration (experimentation) as complements rather than mutually exclusive choices is an
important theoretical extension of the role of learning in the dynamic capabilities model.
Our research has several limitations, both conceptual and emprirical. Our finding that the
U-shaped pattern of time dependence in the formation rate of alliances is steeper in international
alliances than domestic alliances indicates a conceptual limitation to our work. We don't believe
that the lack of support for Hypothesis 7 results from a confound with other aspects of alliances.
International alliances are significantly more likely to involve repeat partners than new partners
(which would accelerate the intra-race dynamic) but they are also significantly more likely to

33
involve commercial alliances than research alliances (which would decelerate the intra-race
dynamic). We conducted a supplementary analysis including controls for both repeat/new partner
and research/commercial alliance and the results are virtually identical with the estimates of Model
9 in Table 6. Similarly, there is too large a body of work documenting differences in basic cultural
assumptions about social interaction, organizational structures, practices and operating
procedures across nations to believe that such differences don't exist in the organizational field of
biotechnology.
We believe the conceptual limitation to our work involves the formation of expectations about
future value. Our argument is that organizations face a tradeoff between exploitation and
exploration and resolve the tradeoff by comparing the value that they expect to receive from
exploitation to the value they would expect to receive from exploration. Our findings are
consistent with a world where U. S. firms have systematically lower expected values for learning
from partners in other countries than domestic partners. However, our approach does not
systematically include the formation of expectations - a conceptual limitation that will need to be
addressed in future work.
Two empirical limitations exist in our research. Organizational size is an important aspect of
biotechnology firms linked to the formation of strategic alliances but only partial information on
size is available. Moreover, the availability of information on size is not random; information is
more available in recent years than in earlier years, more likely to be found for public firms than
private firms, and more likely to be found for large firms than smaller firms. Moreover, different

34
measures of size (total employees, scientific staff, and square footage of physical facilities) vary in
their pattern of availability. We are in the process of collecting information on total capitalization,
another plausible indicator of size, but it is not available at this time. Another empirical limitation
is our inability to differentiate alliances involving partners with different degrees of network
centrality and to differentiate between partners of different institutional type. We would expect
alliances with centrally located firms to proceed at a slower pace than alliances with firms in the
periphery of the industry network. The length of time necessary to convert common benefits to
private benefits is not just a function of absorptive capacity but also the size of the pool of
common benefits. We would also expect alliances with non-for-profit organizations to exhibit a
different dynamic than alliances with firms. We are in the process of collecting additional
information on alliance partners, but it is not available at this time.
CONCLUSIONS
The existence of competition within the context of cooperation has been a concern for many
scholars and practitioners. If cooperation between organizations has important benefits and
competition threatens cooperative ventures, then this concern is well founded. We believe that
this concern may be misplaced. The prevailing view among scholars is that competition arises
between partners in cooperative relationships. We would argue that the critical competition, at
least within knowledge intensive domains such as biotechnology, arises across cooperative
relationships. To the extent that organizations focus on winning learning races within alliances
rather than across sequences of alliances, they attend to winning battles rather than winning wars.
A number of practitioners within knowledge intensive domains have come to recognize the

35
importance of long term competition for knowledge (Powell, Koput, and Smith-Doerr, 1996:
120). We hope that our research will develop a similar appreciation among scholars.

36
REFERENCES
Amburgey, Terry L. 1986. "Multivariate Point Processes in Social Research". Social Science Research. 15:190-206. Amburgey, Terry L., Wejian Shan, Jitendra V. Singh, and Harbir Singh. 1996. "Cashing in and Cashing Out: Organizational and Environmental Determinants of Initial Public Offerings in Biotechnology". 1996 Annual Meeting of the Academy of Management, Cincinnati, OH. Barley, Stephen R., John Freeman, and Ralph C. Hybels. 1992. " Strategic Alliances in Commercial Biotechnology", in Networks and Organizations: 311-347. N. Nohria and R. Eccles (eds.). Boston: Harvard University Press. Barney, Jay. 1991. “Firm Resources and Sustained Competitive Advantage”. Journal of Management, 17: 99-120. Bioscan. Phoenix, AZ. 1984, 1985, 1986, 1987, 1988, 1989, 1990, 1992, 1993, 1994, 1995. Cohen, Michael D., and Paul Bacdayan. 1994. “Organizational Routines are Stored as Procedural Memory: Evidence from a Laboratory Study”. Organization Science, 5: 554-568. Cohen, Wesley, and Daniel Levinthal. 1990. “Absorptive Capacity: A New Perspective on Organizational Learning and Innovation”. Administrative Science Quarterly. 35: 128-152. Cox, David R. 1962. Renewal Theory. London: Methuen. Dibner, M. 1990. Biotechnology Guide University of North Carolina, Biotechnology Actions Database, Stockton Press. Gambardella, Alfonso. 1995. Science and Innovation: The U. S. Pharmaceutical Industry During the 1980s. Cambridge: Cambridge University Press. Gomes-Casseres, Benjamin. 1988. "Joint-Venture Cycles: The Evolution of Ownership Strategies of U.S. MNEs, 1945-75", in Farok J. Contractor and Peter Lorange (eds.), Cooperative Strategies in International Business, Lexington, MA: D.C. Heath. Gulati, Ranjay. 1995. “Does Familiarity Breed Trust? The Implications of Repeated Ties for Contractual Choice in Alliances”. Academy of Management Journal. 38: 85-112. Gulati, Ranjay. 1995. “Social Structure and Alliance Formation Patterns: A Longitudinal
Administrative Science Quarterly, 40: 619-652. Hamel, Gary. 1991. “Competition for Competence and Inter-Partner Learning within International Strategic Alliances”. Strategic Management Journal, 12: 83-104.

37
Hannan, Michael T. and John Freeman. 1984. “Structural Inertia and Organizational Change”. American Sociological Review. 49: 149-164. Harrigan, Kathryn. 1985. Strategies for Joint Ventures. Lexington, MA: D.C. Heath. Huber, George P. 1991. “Organizational Learning: The Contributing Processes and the Literatures”. Organization Science, 2: 88-115. Inkpen, Andrew. 1995. “Organizational Learning and International Joint Ventures”. Journal of International Management, 1: 165-198. Kamien, Morton I. and Nancy L. Schwartz. 1982. Market Structure and Innovation. Cambridge: Cambridge University Press. Khanna, Tarun, Ranjay Gulati, and Nitin Nohria. 1995. “The Dynamics of Learning Alliances: Competition, Cooperation, and Relative Scope”. Unpublished paper. Kogut, Bruce, Weijian Shan, and Gordon Walker. 1992. "The Make-or-Cooperate Decision in the Context of an Industry Network", in Networks and Organizations: 348-365. N. Nohria and R. Eccles (eds.). Boston: Harvard University Press. Kogut, Bruce, and Udo Zander. 1992. “Knowledge of the Firm, Combinative Capabilities, and the Replication of Technology”. Organization Science, 3: 383-397. Lant, Teresa K., and Stephen J. Mezias. 1992. “An Organizational Learning Model of
Organization Science, 3: 47 - 71. Liebeskind, Julia, Amalya Oliver, Lynne Zucker, and Marilyn Brewer. 1993. "Hierarchies, Markets, and Networks: Sourcing Scientific Knowledge Among New Biotechnology Firms". Unpublished Paper. March, James G. 1991. “Exploration and Exploitation in Organizational Learning”. Organization Science, 2: 71-87. Penrose, Edith T. 1959. The Theory of the Growth of the Firm. New York: Wiley. Philips, A. 1971. Technology and Market Structure. Cambridge: Lexington Books. Powell, Walter W., and Peter Brantley. 1992. "Competitive Cooperation in Biotechnology: Learning Through Networks?", in Networks and Organizations: 366-394. N. Nohria and R. Eccles (eds.). Boston: Harvard University Press.

38
Powell, Walter W., Kenneth W. Koput, and Laurel Smith-Doerr. 1996. “Interorganizational Collaboration and the Locus of Innovation: Networks of Learning in Biotechnology”. Administrative Science Quarterly. 41: 116-145. Rohwer, Goetz. (1994). TDA Version 5.7. Schoonhoven, Claudia B., Kathleen M. Eisenhardt, and Katherine Lyman. 1990. “Speeding Products to Market: Waiting Time to First Product Introduction in New Firms”. Administrative Science Quarterly. 35: 177-207. Schumpeter, Joseph A. 1934. The Theory of Economic Development. Cambridge: Harvard University Press. Shan, Weijian. 1990. "An Empirical Analysis of Organizational Strategies by Entrepreneurial High-Technology Firms". Strategic Management Journal. 11: 129-139. Teece, David J., and Gary Pisano.1994. "The Dynamic Capabilities of Firms: An Introduction". Industrial and Corporate Change, 3: 537-556. Teitelman, Robert. 1989. Gene Dreams: Wall Street, Academia, and the Rise of Biotechnology. New York: Basic Books. Tushman, Michael L., and Philip Anderson. 1986. “Technological Discontinuities and
Administrative Science Quarterly, 31: 439-465. U.S. Patents and Trademarks Office, CASSIS/CD-ROM Bibliographic Information Files. 1969-96. Wernerfelt, Birger. 1984. “A Resource-based View of the Firm”. Strategic Management Journal, 5: 171-180. White, Halbert. 1982. "Maximum Likelihood Estimation of Misspecified Models". Econometrica, 50: 1-25 von Krogh, Georg, and Johan Roos. 1996. “Imitation of Knowledge: A Sociology of Knowledge
Managing Knowledge: Perspectives on Cooperation and Competition: 32-54. G. von Krogh and J. Roos (eds.). Thousand Oaks: Sage Publications. Zander, Udo, and Bruce Kogut. 1995. “Knowledge and the Speed of the Transfer and Imitation of Organizational Capabilities: An Empirical Test”. Organization Science, 6: 76-92.

39
Table 1. Frequencies of Events Entries 847 Exits 235 Biotechnology Patents 2467 Commercial Strategic Alliances 2920 Research Strategic Alliances 3086 International Alliances 1521 Domestic alliances 4485 One time only Alliances 4613 Repeat Alliances 1393 Initial Public Offerings 323 Private Placements 1593 Acquisitions 339 Name Changes 320

40
Table 2. Descriptive Statistics
Variable Mean S.D. 2 3 4 5 6 7 8 9 10 11 12 13 14 15 16 1. # of Firms 549.3 82.32 .74 .11 .62 -.04 -.24 .07 .26 .74 .36 -.21 .13 .18 .16 .17 .15 2. Total Alliances 454.3 138.6 .58 .88 -.03 -.22 .09 -.16 -.11 .35 -.18 .12 .23 .12 .15 .16 3. Venture Capital 686.7 265.9 .78 -.01• -.10 .06 -.84 .39 .18 -.07 .04 .18 .02 .07 .10 4. NASDAQ Index 749.7 381.0 -.02 -.22 .09 -.47 .77 .35 -.18 .10 .26 .11 .17 .18 5. Pharmaceutical 0.836 0.370 -.06 .09 -.01• -.01 -.02 .39 .11 .12 .04 -.07 -.03 6. Agbio 0.291 0.454 .10 .00• -.22 .14 .59 .30 .16 .17 -.06 -.04 7. Public 0.509 0.500 -.02 .06 .25 .16 .41 .44 .29 -.22 -.17 8. Total Patents 172.0 145.3 -.11 -.03 -.01 .01• -.09 .05 -.00• -.04 9. Total Private Placements
66.90 39.68 .32 -.18 .09 .21 .15 .17 .16
10. Age 2865 1549 .10 .36 .29 .39 .32 .31 11. # of Research Areas 2.16 1.10 .35 .23 .17 -.10 -.07 12. Prior Alliances 9.14 13.40 .57 .60 -.34 -.24 13. Prior Private Placements
1.92 2.58 .39 -.19 -.13
14. Prior Patents 1.455 5.192 -.09 -.07 15. Elapsed Time 478.4 662.2 .93 16. Elapsed Time2 66738
3 1896913
l Not significant at p < .05. Based on 48,238 spells

TABLE 3
The Effects of Environmental and Organizational Variables on the Rate of Alliance Formation Variables Model 1 Model 2 Model 3 Model 4 Number of Firms -.0011045• -.0011861• -.002• -.00121• (.0003588) (.0005042) (.000475) (.00052) Total Patents -.0000976 .0001398 .000304 .000162 (.0003954) (.0003267) (.000314) (.000327) Total Strategic Alliances .0028659• .0021985• .002051• .002172• (.0009503) (.000344) (.000323) (.000341) Total Private Placements -.0000598 .0005941 .000747 .000777 (.0002226) (.0007985) (.000762) (.000794) Venture Capital Index .0004423 .0003848 .000391 .000365 (.0002226) (.0001978) (.000195) (.000194) NASDAQ Index -.0009847• -.0006749• -.00056• -.00065• (.000228) (.0001792) (.000169) (.000179) Age -.0002502• -.0001557• -.00021• -.00015• (.0000333) (.0000218) (.00002) (.00002) Number of Market Sectors .1282854• .0749701• .073769• .070173• (.0428187) (.0208512) (.021802) (.020937) Pharmaceutical Sector .1661466 .0867104 .011884 .098473 (.1270147) (.0704228) (.061038) (.071707) Agricultural Sector .1929852 .1104871 .038273 .128017• (.1292002) (.0614828) (.062674) (.062701) Public Firm .6869963• .419773• .22244• .433215• (.0656488) (.046247) (.040394) (.047094) Number of Prior Patents .0123126• -.0061702• .00051• -.00628• (.0037834) (.0026445) (.002534) (.002377) Number of Prior Placements .0861805• .0324524• .019364• .032503• (.0136015) (.0090621) (.008781) (.00878) Number of Prior Alliances .0168188• .020663• (.0017661) (.001841) Ln (Number of Prior Alliances) .410746• (.029581) Elapsed Time -.0025586• -.0022305• -.0022• (.000115) (.000106) (.000113) Prior Alliances X Elapsed Time -.00006• (.000008) Elapsed Time2 .0000005• .0000005• .0000004• (.00000004) (.00000004) (.00000005) Prior Alliances X Elapsed Time2 .00000004• (.0000000) Number of Events 5459 5459 5459 5459 Chi2 391.80 2197.70 1667.01 2630.99 Degrees of Freedom 13 16 16 18 Probability Value P < .05 P < .05 P < .05 P < .05

42
TABLE 4 The Effects of Environmental and Organizational Variables on the Rate of Alliance Formation by Type of
Alliance: Research and Commercial Alliances Variables Model 5 Model 6 Number of Firms -.001168• -.0012076• (.0004667) (.0004931) Total Patents .0001333 .000078 (.0003179) (.0003262) Total Strategic Alliances .0023095• .0022877• (.0003461) (.000346) Total Private Placements .0004604 .0008523 (.0007987) (.0007993) Venture Capital Index .0003428 .0003742 (.000192) (.0001991) NASDAQ Index -.0006779• -.0007725• (.0001775) (.0001723) Age -.000154• -.0001383• (.0000216) (.0000207) Number of Market Sectors .0693809• .0736084• (.021187) (.0207892) Pharmaceutical Sector .1016292 .0605144 (.0677415) (.0696775) Agricultural Sector .1164386 .0992516 (.0628272) (.0621133) Public Firm .4011185• .4249192• (.0459849) (.0443663) Number of Prior Patents -.0047623 -.0068411• (.0025141) (.0023868) Number of Prior Placements .0267317• .0305795• (.0087208) (.0085712) Number of Prior Alliances .0156584• (.0018329) Number of Prior Research Alliances .0177825• (.0045849) Number of Prior Commercial Alliances .0128088• (.0030125) Research Alliance Dummy Variable .5711655• .4319013• (.0520887) (.0466147) Elapsed Time -.0020809• -.0019314• (.0001077) (.0001339) Research Alliance X Elapsed Time -.001732• -.0010851• (.0002377) (.0001937) Elapsed Time2 .0000004• .0000004• (.00000004) (.00000005) Research Alliance X Elapsed Time2 .0000004• .0000003• (.00000008) (.00000008) Chi2 2849.40 2701.82 Degrees of Freedom 19 20 Probability Value P < .05 P < .05

43
TABLE 5 The Effects of Environmental and Organizational Variables on the Rate of Alliance Formation by Type of Partner:
Repeat Partners and New Partners Variables Model 7 Model 8 Number of Firms -.0014261• -.0015253• (.0004997) (.0005066) Total Patents .0002499 .0002609 (.0003221) (.0003272) Total Strategic Alliances .0021413• .0021388• (.0003394) (.000339) Total Private Placements .0004466 .0005284 (.000793) (.0007997) Venture Capital Index .0003804 .0003838 (.0001958) (.0001997) NASDAQ Index -.0006355• -.0006602• (.0001775) (.0001787) Age -.0001484• -.000159• (.0000209) (.0000217) Number of Market Sectors .0699353• .067403• (.0195642) (.0197043) Pharmaceutical Sector .0678398 .0562823 (.0675924) (.0661624) Agricultural Sector .0729041 .0579723 (.0641188) (.0672241) Public Firm .3966869• .3964594• (.0434009) (.042585) Number of Prior Patents -.0048804 -.0048922 (.0023089) (.0023034) Number of Prior Placements .0313461• .0308578• (.0085665) (.0085723) Number of Prior Alliances .0151436• (.0017692) Number of Prior Alliances With Partner .1021744• (.0175966) Number of Prior Alliances With Other Partners
.0140599•
(.0015928) Repeat Partner Dummy Variable .737398• .6855986• (.0507735) (.0508575) Elapsed Time -.0021595• -.0021169• (.0001047) (.000104) Repeat Partner X Elapsed Time -.0029741• -.0030629• (.0003142) (.0003146) Elapsed Time2 .0000004• .0000004• (.00000004) (.00000004) Repeat Partner X Elapsed Time2 .000002• .000002• (.0000002) (.0000002) Chi2 2830.23 3005.17 Degrees of Freedom 19 20

44
Probability Value P < .05 P < .05 TABLE 6
The Effects of Environmental and Organizational Variables on the Rate of Alliance Formation by Type of Partner: International Partners and Domestic Partners
Variables Model 9 Model 10 Number of Firms -.001168• -.001273• (.0004667) (.0004629) Total Patents .0001333 .0001428 (.0003179) (.000315) Total Strategic Alliances .0023095• .0023232• (.0003461) (.000346) Total Private Placements .0004604 .0005672 (.0007987) (.000804) Venture Capital Index .0003428 .0003402 (.000192) (.000192) NASDAQ Index -.0006779• -.0006822• (.0001775) (.0001757) Age -.000154• -.0001571• (.0000216) (.0000214) Number of Market Sectors .0693809• .0637974• (.021187) (.0201162) Pharmaceutical Sector .1016292 .0935702 (.0677415) (.0682012) Agricultural Sector .1164386 .1177697 (.0628272) (.060687) Public Firm .4011185• .3952683• (.0459849) (.0458264) Number of Prior Patents -.0047623 -.0063845• (.0025141) (.0026097) Number of Prior Placements .0267317• .0255647• (.0087208) (.0084089) Number of Prior Alliances .0156584• (.0018329) Number of Prior International Alliances .0091193• (.0036977) Number of Prior Domestic Alliances .0213441• (.0034788) International Partner Dummy Variable .5711655• .5927718• (.0520887) (.0515714) Elapsed Time -.0020809• -.0020603• (.0001077) (.0001077) Repeat Partner X Elapsed Time -.001732• -.0017375• (.0002377) (.0002376) Elapsed Time2 .0000004• .0000004• (.00000004) (.00000004) Repeat Partner X Elapsed Time2 .0000004• .0000004• (.00000008) (.000000080) Chi2 2357.71 3072.63 Degrees of Freedom 19 20

45
Probability Value P < .05 P < .05
Figure 1. Multiplier of the Alliance Formation Rate: Baseline Model

46
Figure 2. Multiplier of the Alliance Formation Rate: 1 Prior Alliance

47
Figure 3. Multiplier of the Alliance Formation Rate: 10 Prior Alliances
Elapsed Time in Days730 1460 2190 2920 3650 4380 5110
0
1
2
3
4
5

48
Figure 4. Multiplier of the Alliance Formation Rate: 20 Prior Alliances

49
Figure 5. Multiplier of the Alliance Formation Rate: Commercial Alliance

50
Figure 6. Multiplier of the Alliance Formation Rate: Research Alliance
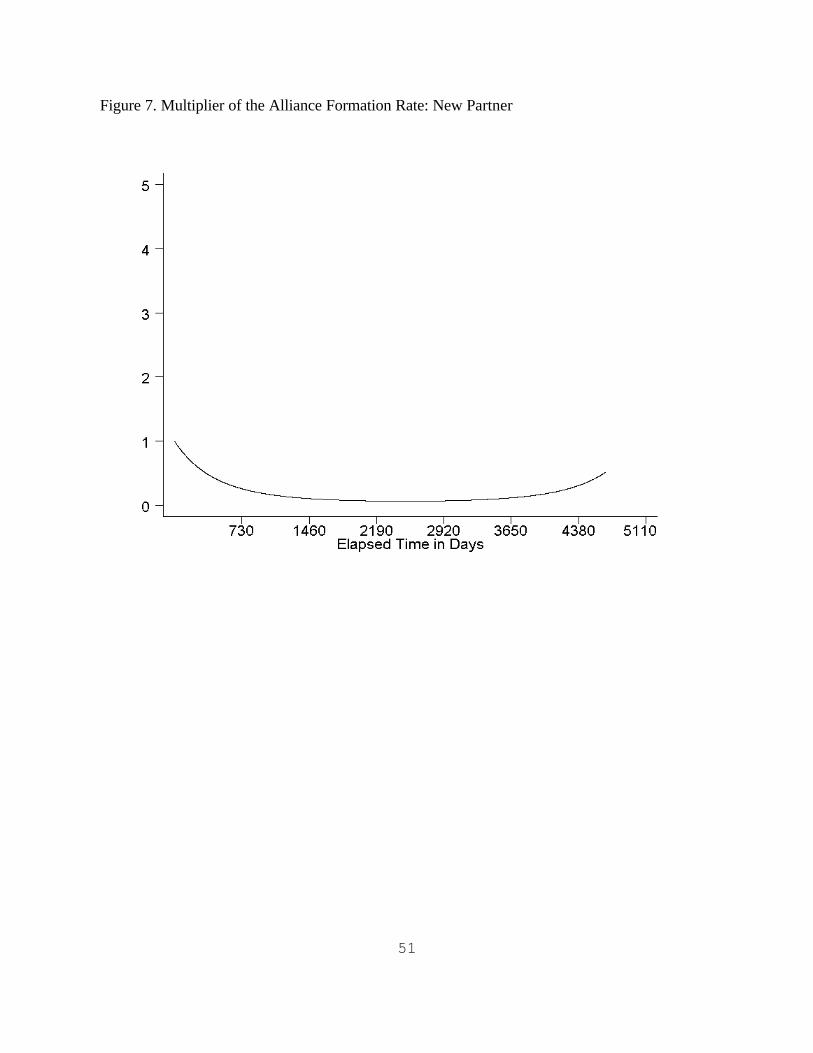
51
Figure 7. Multiplier of the Alliance Formation Rate: New Partner

52
Figure 8. Multiplier of the Alliance Formation Rate: Repeat Partner

53
Figure 9. Multiplier of the Alliance Formation Rate: Domestic Partner

54
Figure 10. Multiplier of the Alliance Formation Rate: International Partner