learning job skills from colleagues at work: evidence from a field
TRANSCRIPT
Learning Job Skills from Colleagues at Work:
Evidence from a Field Experiment Using Teacher Performance Data
John Papay
Brown University
Eric S. Taylor†
Harvard Graduate
School of Education
John Tyler
Brown University
and NBER
Mary Laski
Brown University
July 2015
We study on-the-job learning among classroom teachers, especially learning skills from
coworkers. Using data from a new field experiment, we document meaningful improvements in
teacher productivity when high-performing classroom teachers work with a low-performing
colleague at the school to improve that colleague’s teaching skills. At schools randomly assigned
to the treatment condition, low-performing teachers were matched to high-performing partners
using micro-data from prior performance evaluations, including separate ratings for many
specific instructional skills. The low-performing “target” teachers had low prior evaluation
scores in one or more specific skill areas; their high-performing “partner” coworker had high
prior evaluation scores in (most of) the same skill areas. Each pair of teachers was encouraged to
work together on improving teaching skills over the course of a school year. We find that
treatment improved teacher job performance, as measured by student test score growth in math
and reading. At the end of the treatment year, the average student in a treatment school,
regardless of assigned teacher, scored 0.055σ (student standard deviations) higher than the
control. Job performance gains were concentrated among “target” teachers where student gains
were 0.12σ. Empirical tests suggest the improvements are likely the result of target teachers
learning skills from their partner. Learning new skills on-the-job from coworkers is an intuitive
method of human capital development, but has received little empirical attention. This is the first
study, of which we are aware, to demonstrate such learning using experimental variation and
direct measures of worker job performance. For schools specifically, the results contrast a largely
discouraging lack of performance improvements generated by formal on-the-job training for
teachers.
JEL No. J24, M53, I2
† Corresponding author, [email protected], Gutman Library, 6 Appian Way, Cambridge, MA 02138. We
thank the Bill & Melinda Gates Foundation for their financial support of this research; we benefitted greatly from
discussions with our program officer Steven Cantrell. We are equally indebted to the Tennessee Department of
Education, and particularly Nate Schwartz, Tony Pratt, Luke Kohlmoos, Sara Heyburn, and Laura Booker, for their
collaboration throughout this research. Finally, we thank Verna Ruffin, superintendent in Jackson-Madison County
Schools, and the principals and teachers who participated in the program. All opinions and errors are our own.

1
“Some types of knowledge can be mastered better if simultaneously
related to a practical problem.” Gary Becker (1962)
Can employees learn job skills from their coworkers? Whether and how peers contribute
to on-the-job learning, and at what costs, are practical questions for personnel management.
Economists’ interest in these questions dates to at least Alfred Marshall (1890) and, more
recently, Gary Becker (1962) and Robert Lucas (1988). Yet, despite the intuitive role for
coworkers in human capital development, empirical evidence of learning from coworkers is
scarce.2 In this paper we present new evidence from a random-assignment field experiment in
U.S. public schools: low-performing classroom teachers in treatment schools were each matched
to a high-performing colleague in their school, and pairs were encouraged to work together on
improving their teaching skills. We report positive treatment effects on teacher productivity, as
measured by contributions to student achievement growth, particularly for low-performing
teachers. We then test empirical predictions consistent with peer learning and other potential
mechanisms.
While there is limited evidence on learning from coworkers specifically, there is a
growing literature on productivity spillovers among coworkers generally. Morreti (2004) and
Battu, Belfield, and Sloane (2003) document human capital spillovers broadly, using variation
between firms, but without insight to mechanisms. Several other papers, each focusing on a
specific firm or occupation as we do, also find spillovers; the apparent mechanisms are shared
production opportunities or peer influence on effort (Ichino and Maggi 2000, Hamilton,
Nickerson and Owan 2003, Bandiera, Barankay and Rasul 2005, Mas and Moretti 2009,
Azoulay, Graff Zivin, and Wang 2010). Moreover, these spillovers may be substantial. Lucas
2 We are focused in this paper on coworker peers and learning on-the-job. A large literature examines the role of
peers in classroom learning and other formal education settings (for a review see Sacerdote 2010).

2
(1988) suggests human capital spillovers, broadly speaking, could explain between-country
differences in income.
One example of apparent learning from coworkers comes from the study of classroom
teachers. Jackson and Bruegmann (2009) find a teacher’s productivity, as measured by
contribution to her students’ test score growth, improves when a new higher-performing
colleague arrives at her school; then, consistent with peer learning, the improvements persist
after she is no longer working with the same colleague (i.e., teaching the same grade in the same
school). The authors estimate that prior coworker quality explains about one-fifth of the variation
in teacher performance.
In this paper we also focus on classroom teachers. While we believe the paper makes an
important general contribution, a better understanding of on-the-job learning among teachers
specifically has sizable potential value for students and economies. Classroom teaching
represents a substantial investment of resources: one out of ten college-educated workers in the
U.S. is a public school teacher, and public schools spend $285 billion annually on teacher wages
and benefits (U.S. Census Bureau 2015, Table 6).3 And there is substantial variability in teacher
job performance: measured both in the short-run with students’ test scores (see Jackson, Rockoff,
and Staiger 2014 for a review) and the long-run with students’ economic and social success years
later as adults (Chetty, Friedman, and Rockoff 2014). One seemingly consistent source of
differences in teacher performance is experience on the job (Rockoff 2004, Papay and Kraft
forthcoming). Estimated differences due to experience are much larger than differences in formal
pre-service or in-service training (Jackson, Rockoff, and Staiger 2014).
We report here on a field experiment in Tennessee designed to study on-the-job, peer
learning between teachers who work at the same school. Schools were randomly assigned to
3 Authors’ calculations of workforce share from Current Population Survey 1990-2010.

3
either treatment or a business-as-usual control. In treatment schools, low-performing teachers
were each matched to a high-performing partner using detailed micro-data from prior
performance evaluations. In Tennessee, teachers are observed in the classroom multiple times
per year and scored in 19 specific skills (e.g., “questioning,” “lesson structure and pacing,”
“managing student behavior”). Each low-performing “target” teacher was identified as such
because his prior evaluation scores were particularly low in one or more of the 19 skill areas.
Then his high-performing “partner” was chosen because she had high scores in (many of) the
same skill areas. Each pair of teachers was encouraged by their principal to work together during
the school year on improving teaching skills identified by evaluation data. Thus the topics and
skills teachers worked on were specific to each pair and varied between pairs. More generally,
pairs were encouraged to examine each other’s evaluation results, observe each other teaching in
the classroom, discuss strategies for improvement, and follow-up with each other’s commitments
throughout the school year.4
We find that treatment—pairing classroom teachers to work together on improving
skills—improves teachers’ job performance, as measured by their students’ test score growth. At
the end of the school year, the average student in a treatment school, regardless of assigned
teacher, scores 0.055σ (student standard deviations) higher on standardized math and
reading/language arts tests than she would have in a control school. The gains are concentrated
among “target” teachers; in target teachers’ classrooms students score 0.12σ higher. These are
meaningful gains. One standard deviation in teacher performance is typically estimated to be
0.15-0.20σ (Hanushek and Rivkin 2010). In other words, a gain of 0.12σ is roughly equivalent to
the difference between being assigned to a median teacher instead of a bottom quartile teacher.
4 The treatment was designed in a collaboration between the research team and several people at the Tennessee
Department of Education. TNDOE also played key roles in carrying out the experiment and collecting data.

4
Interpreting these differences as causal effects of treatment rests mainly on the random
assignment of schools. While the “target” and “partner” roles were not randomly assigned, the
roles were assigned by algorithm for both treatment and control schools prior to randomization,
as we detail in Section 1. The estimates in the previous paragraph are intent-to-treat estimates
based on algorithm-assigned roles.
After documenting average treatment effects, we turn to examining mechanisms. In
particular we ask: Can the performance improvements be attributed to growth in teachers’ skills
from peer learning, or are other changes in behavior or effort behind the estimated effects?
Larger effects for target teachers are highly suggestive of skill growth, but could also result if
partnering increased target teachers’ motivation or effort, or provided new opportunities to share
resources or tasks (Jackson and Bruegmann 2009). In Section 3, we test a number of empirical
predictions motivated by these potential mechanisms. If the underlying mechanism is skill
growth, we would predict larger treatment effects for target teachers when the high-performing
partner’s skill strengths match more of the target teacher’s weak areas. We find this is the case
empirically. If the mechanism is shared production or resources, we would predict larger effects
when teacher pairs teach the similar grade-levels or subjects. If the mechanism is effort or
motivation, we would predict larger effects when there were larger gaps in prior performance
between paired teachers, on the assumption that the comparison of performance induces greater
effort. Neither of these latter predictions is borne out in the data. In short, the available data
suggest target teachers learned new skills from their partner.5
One contextual feature of the experiment is also important to interpreting these results.
The detailed micro-data with which teachers were paired are taken from the state’s performance
5 We plan to follow the study teachers over time. Thus, one future test of skill growth is the persistence of
performance improvements in the years after treatment ends.

5
evaluation system for public school teachers, which the Tennessee Department of Education
introduced in 2011. Locally the treatment was known as the “Evaluation Partnership Program.”
These connections to formal evaluation, and its stakes, likely influenced principals’ and teachers’
willingness to participate and the nature of their participation.6 The evaluation context also
affects the counterfactual behavior of control schools and teachers. This context may partly
explain why we find positive effects in this case while other research dose not consistently find
effects of formal mentoring or formal on-the-job training for teachers (see reviews by Jackson,
Rockoff, and Staiger 2014, and Yoon et al. 2007).7 More generally, this paper also belongs to a
small literature on how evaluation programs affect teacher performance (Taylor and Tyler 2012,
Steinberg and Sartain 2015, Bergman and Hill 2015). Taylor and Tyler (2012) study veteran
teachers who were evaluated by and received feedback from experienced, high-performing
teachers; the resulting improvements in teacher productivity persisted for years after the peer
evaluation ended.
The performance improvements documented in this paper suggest teachers can learn job
skills from their colleagues—empirical evidence of the intuitive benefit of skilled coworkers in
human capital development. The magnitude of those improvements suggests peer learning may
be as important as on-the-job experience in teacher skill development (Rockoff 2004, Papay and
Kraft forthcoming); indeed, peer learning may be a key contributor to the oft-cited estimates of
returns to experience in teaching. Most practically, the treatment and results suggest promising
ideas for managing the sizable teacher workforce.
6 In one-on-one interviews, some participating teachers said they were willing to participate because teacher pairs
were matched based on specific skills and not on a holistic measure of performance. 7 Exceptions include an example of mentoring studied by Rockoff (2008) and an example of training studied by
Angrist and Lavy (2001).

6
Next, in Section 1, we describe the treatment in detail, along with other features of the
experimental setting and data. In Section 2 we describe the average treatment effects and
treatment effects by teachers’ assigned partnership role. Section 3 discusses potential
mechanisms and presents tests of empirical predictions related to those mechanisms. We
conclude in Section 4 with some further discussion of the results.
1. Treatment, Setting, and Data
1.1 Treatment
We report on a field experiment designed to study on-the-job, peer learning between
teachers who work at the same school. At schools randomly assigned to the treatment
condition—known in the schools as the “Evaluation Partnership Program”—low-performing
“target” teachers were paired with a high-performing “partner” teacher, and each pair was
encouraged to work together on improving each other’s teaching skills over the course of the
school year. Importantly, teachers were matched using micro-data from state-mandated
performance evaluations. As described further in the next section, these prior evaluations include
separate performance ratings for many specific instructional skills (e.g., “questioning,” “lesson
structure and pacing,” “managing student behavior”). Each target teacher was identified as such
because he had low scores in one or more specific skill areas; his matched partner was selected
because she had high scores in (many of) the same skill areas. Pairs were approached by their
school principal and asked to work together for the year focusing on the strength-matched-to-
weakness skill areas, with the goal of improving instructional skills. Thus the topics and skills
teachers worked on were specific to each pair and varied between pairs. More generally, pairs
were encouraged to scrutinize each other’s evaluation results, observe each other teaching in the

7
classroom, discuss strategies for improvement, and follow-up with each other’s commitments
throughout the school year.
While individual teacher pairings were the focus of the intervention, treatment was
assigned at the school level. Thus the success of individual pairs may have been influenced by
the principal’s role or support, or influenced by other teacher pairs in the school working in the
same kinds of ways. Certainly the extensive margin of treatment take-up was in the hands of the
school principal, as described below.
1.1.1 Teacher Evaluation in Tennessee
All public school teachers in Tennessee are evaluated annually. Beginning in the 2011-12
school year, the state introduced new, more-intensive requirements for teacher evaluation. The
new evaluations include both (i) direct assessments of teaching skills in classroom observations,
and (ii) measures of teachers’ contributions to student achievement. We focus in this section on
the classroom observation scores because they are the micro-data used in matching target and
partner pairs, and the motivation for each pair’s work together.
Each teacher is observed while teaching and scored multiple times during the course of
the school year, typically by the school principal or vice-principal. Observations and scores are
structured around a rubric known as the “TEAM rubric” which measures 19 different
instructional skill areas or “indicators.”8 The rubric is based in part of the work of Charlotte
Danielson (1996). Skill areas include things like “managing student behavior,” “instructional
plans,” “teacher content knowledge,” and many others. As an example, Figure 1 reproduces the
rubric for “Questioning.” Teachers are scored from 1-5 on each skill area: 1 significantly below
8 TEAM stands for Tennessee Educator Acceleration Model. Most Tennessee districts, including the district where
this paper’s data were collected, use the TEAM rubric. Some districts use alternative rubrics. The full TEAM rubric
is available at: http://team-tn.org/wp-content/uploads/2013/08/TEAM-General-Educator-Rubric.pdf.

8
expectations, 2 below expectations, 3 at expectations, 4 above expectations, 5 significantly above
expectations. As the Figure 1 example suggests, the rubric language describes relatively specific
skills and behaviors, not vague general assessments of teaching effectiveness. As described in
the next section, we use these micro-data on 19 different skill areas to match high- and low-
performing teachers in working pairs.
At the end of the school year, the classroom observation micro-data are aggregated to
produce a final, overall, univariate observation evaluation for each teacher. In the 2011-12 school
year, the first under the state’s new requirements, teachers scored quite high in classroom
observations: more than three-quarters received an overall rating of 4 or 5, while just 2.4 percent
received a 1 or 2.9 By contrast, and critically for this study, there was substantial variation
between and within teachers at the 19-skill micro-data level. One out of eight teachers received a
score of 1 or 2 in at least one of the 19 skill areas; and, among that 13 percent, the average
number of skills scored 2 or below is 3 (s.d. 3.4). The overall observation rating is combined
with student achievement data to produce a summative score for each teacher. It is important to
note that, while certainly used in the state’s formal evaluation scores, student achievement data
were not used in the matching of teachers or communication with teachers about the goals of the
teacher partnerships.
1.1.2 Identifying and Matching High- and Low-Performing Teachers
For the purposes of this experiment, a teacher was identified as a “low-performing” or
“target” if he had a score less than 3 in one or more of the 19 skill areas. Similarly, a teacher was
identified as a “high-performing” potential “partner” if she had a score of 4 or higher in one or
more skill area. Both the set of target and the set of potential partners were identified based on
9 That is 2.4 percent received a 1 or 2 on the final overall evaluation score. The small percentage of “low” final
overall scores is not a-typical, even after the revisions in teacher evaluation programs in recent years (Wiesberg
2009, New York Times, March 30, 2013)

9
pre-experiment evaluation scores: the average of a teacher’s scores from the prior school year
2012-13 and the first observation of 2013-14.10
Our matching algorithm followed these steps and rules: (1) Consider each possible
pairing of a target and a partner teacher who work in the same school, and calculate the total
number of skill areas (out of 19 possible) where there is a strength-to-weakness skill match for
that pairing. A strength-to-weakness match occurs when the target teacher has a score less than 3
in a given skill, and the partner has a score of 4 or higher in the same skill. (2) For each school,
list all possible configurations of pairings where each potential partner is matched to just one
target teacher. (3) Choose the set of pairings which maximizes the number of strength-to-
weakness matches (out of 19 * T possible, where T is the number of target teachers).11
This
algorithm produced a set of “recommended” matches for each school. We created recommended
match lists for both treatment and control schools pre-experiment, but the lists were only
provided to principals in the treatment schools.12
The principal in each treatment school was responsible for introducing each target-
partner pair, explaining why the two had been paired, and encouraging the pair in their work
together. Each teacher, target or partner, ultimately decided to what extent she would participate
10
If a teacher was identified as both a “target” and “partner” by these rules, the teacher was included only on the
target list. Additionally, any potential “target” teacher with an overall observation rating of “above expectation” (4)
or “significantly above expectations” (5) was excluded from the target teacher list.
Two schools had few or no teachers identified as “target” by these rules. In those two cases, after random
assignment, we used a threshold of less than or equal to 3, instead of strictly less than 3. One school had many
teachers identified as “target.” In that school we limited the set of target teachers to those with 8 or more skill areas
(out of 19) with a score less than 3. While these adjustments aided in the practical implementation of the program,
our ITT estimates use only the original assignments of teachers not the assignments after these school-specific
adjustments. 11
The core of this matching approach is sometimes called the Hungarian Algorithm or Method. 12
We can say definitively that no control school received a list of target teachers and proposed partners. However,
we discussed the idea of the program with all principals, and we cannot ensure that the kernel of the idea was not
adopted by principals in the control schools. Because principals conduct the observations, they had on hand all of
the information necessary to conduct such pairings. Our discussions with district officials, though, suggest that
principals in control schools did not undertake such a program. Any such activities would bias downward our
estimated average treatment effects.

10
and, in that sense, the experiment is best thought of as an encouragement-style design.
Additionally, principals were encouraged to review the recommended list of matches and make
changes as they saw fit. This latitude for principals was intended to help improve matches using
local knowledge not observed in the evaluation data; for example, a recommended match may
have paired two individuals known to not work well together. To encourage data-driven
adjustments, we provided principals with a list of additional potential matches for each target
teacher. These additional matches were the five potential partners with the highest strength-to-
weakness scores from step (1) above, regardless of the optimization and constraints in steps (2)
and (3). Principals received a spreadsheet listing the 19 skill areas for each teacher to show
where target and potential partner teachers matched. An example is shown in Figure 2. We
provided the proposed matches and information for participating principals and teachers to
principals in early November 2013.13
1.2 Sample and Random Assignment
The experiment was conducted at 16 schools (8 treatment, 8 control) in a medium-sized
district in Tennessee. The district, Jackson-Madison County School System, is the 12th largest in
the state enrolling approximately 13,000 students. Across the district, 77 percent of students are
economically disadvantaged, 61 percent are African-American, 32 percent are white, and 7
percent are Hispanic. The district spends about $9,750 per pupil annually. In 2013-14, the state
of Tennessee’s measure of student test score growth ranked Jackson-Madison as a Level 1
district, the lowest-performing category in the state.
13
Participating principals and teachers mainly communicated directly with the research team. The exception is that
lists of proposed matches were emailed to principals by the TNDOE. The research team prepared the match reports
using de-identified data, where teachers were only known by randomly generated ID numbers. The TNDOE then
replaced the random IDs with actual names and sent the reports to principals.

11
In the summer of 2013, principals from all 24 of the district’s schools were briefed on the
Evaluation Partnership Program and 16 agreed to participate in the study.14
We blocked the 16
schools in 8 pairs based on level (elementary, middle, high) and student enrollment, and
randomly assigned one to treatment within each pair.
During the experiment year 2013-14, the 16 schools enrolled 7,300 students with
approximately 600 teachers. In treatment schools, we identified 90 teachers as “target” and 117
as potential “partner” (either a recommended partner or additional potential partner). Descriptive
information on the students and teachers is provided in Table 1. Unless otherwise stated, our test-
score estimates come from the 14 elementary and middle schools where we have pre and post
scores, and all other estimates come from the full sample of 16 schools.
Interpreting the results of this experiment as causal effects rests largely on the success of
randomly assigning schools to treatment and control conditions. Table 1 reports the traditional
test of randomization, comparing pre-treatment characteristics of students and teachers. These
tests include fixed effects for the randomization block pairs. We read the results as evidence of
successful randomization. Most differences are substantively quite small.15
Only 2 of the 20
characteristics show a statistically significant difference between treatment and control means:
the proportion of English language learner students, and the difference in baseline observation
scores for teacher pairs. Additionally, in Appendix Table 1, we check for covariate balance
separately for teachers (and their students) in each assigned program role: low-performing target
teachers, high-performing partners, and teachers not assigned a role. The results are similar.
14
A 17th
school also agreed to participate. That school served pre-kindergarten students; no second pre-K school
was available to serve as a counterfactual, so we exclude that school from our analysis. 15
Note that the teacher value-added scores are in teacher standard deviation units, not student standard deviations as
is often the case. In student standard deviations the differences are roughly one-tenth to one-fifth the magnitudes in
Tables 1 and A1.

12
1.3 Data
The Tennessee Department of Education provided two sources of data for this paper.
First, we use the teacher evaluation micro-data described above. The pre-randomization
evaluation data are used in matching target and partner teachers; the post-randomization
evaluation data are used as outcome measures of observed teacher job performance. Second, we
use state administrative records from 2012-13 and 2013-14 that include (i) student scores from
annual state standardized tests in math and reading/language-arts in grades 3 through 8, (ii)
information on student demographics and special educational programs, (iii) records linking each
student to her assigned teacher(s) for each subject each year, (iv) and information about teacher
experience and prior performance. We standardize all test scores (mean zero, standard deviation
one) within year-grade-subject cells using the statewide distribution (as opposed to the district
specific mean and standard deviation).
2. Effects on Student Achievement
In this paper, we ask two primary empirical questions: First, did the treatment—pairing
classroom teachers to work together on improving skills—benefit (harm) teacher performance?
Second, if there were improvements, is there evidence that those improvements are the result of
growth in teachers’ skills from peer learning?
Our primary measure of teacher performance is growth in student achievement test
scores. Student learning that is measurable in standardized tests is, to be certain, only one aspect
of a teacher’s job responsibilities. Nevertheless, existing empirical evidence suggests student test
scores capture important variation in teacher performance (Jackson, Staiger, and Rockoff 2014
provide a review of the literature). Notably, evidence from Chetty, Friedman, and Rockoff

13
(2014b) demonstrates that between-teacher differences in students’ elementary and middle-
school test scores can predict between-teacher differences in students’ long-run economic and
social outcomes.
2.1 Average Treatment Effects on Student Achievement
Our most straightforward treatment effect estimates simply compare mean test scores in
treatment and control schools. The treatment-control difference in means, 𝛿, is estimated by
fitting the regression specification
𝐴𝑖𝑗𝑘𝑡 = 𝛿𝐸𝑃𝑃𝑠(𝑗) + 𝑋𝑖𝛽 + 𝜋𝑏(𝑠) + 휀𝑖𝑗𝑘𝑡
(1)
where 𝐴𝑖𝑗𝑘𝑡 is the end-of-year 𝑡 (the experiment year) test score in subject 𝑘 (math or reading)
for student 𝑖 assigned to teacher 𝑗 in school 𝑠.16
The treatment indicator, 𝐸𝑃𝑃𝑠(𝑗), varies only at
the school-level 𝑠. Throughout the paper, all estimates include randomization block fixed effects,
𝜋𝑏(𝑠).
Throughout the paper all statistical inference accounts for error clustering within schools.
We report p-values obtained by the wild cluster bootstrap-t method suggested by Cameron,
Gelbach, and Miller (2008). This approach provides asymptotic refinement when the number of
clusters is small, as in our setting with 14 clusters in the test score analysis. Cameron and
coauthors show that rejection rates can be as high as 10 percent for a nominally 𝛼 = 0.05 test
using conventional clustering methods; using the wild cluster bootstrap-t method rejection rates
16
The student-teacher link records allow students to be linked to more than one teacher for a given subject, though
three-quarters in our sample are linked to just one teacher. When a student has more than one teacher, the state
assigns a “percent responsibility” to each teacher. When a student has two or more teachers, we include one
observation for each student-by-teacher pairing and weight by the “percent responsibility.” But our results are robust
to assigning students to the one teacher with the highest weight.
14
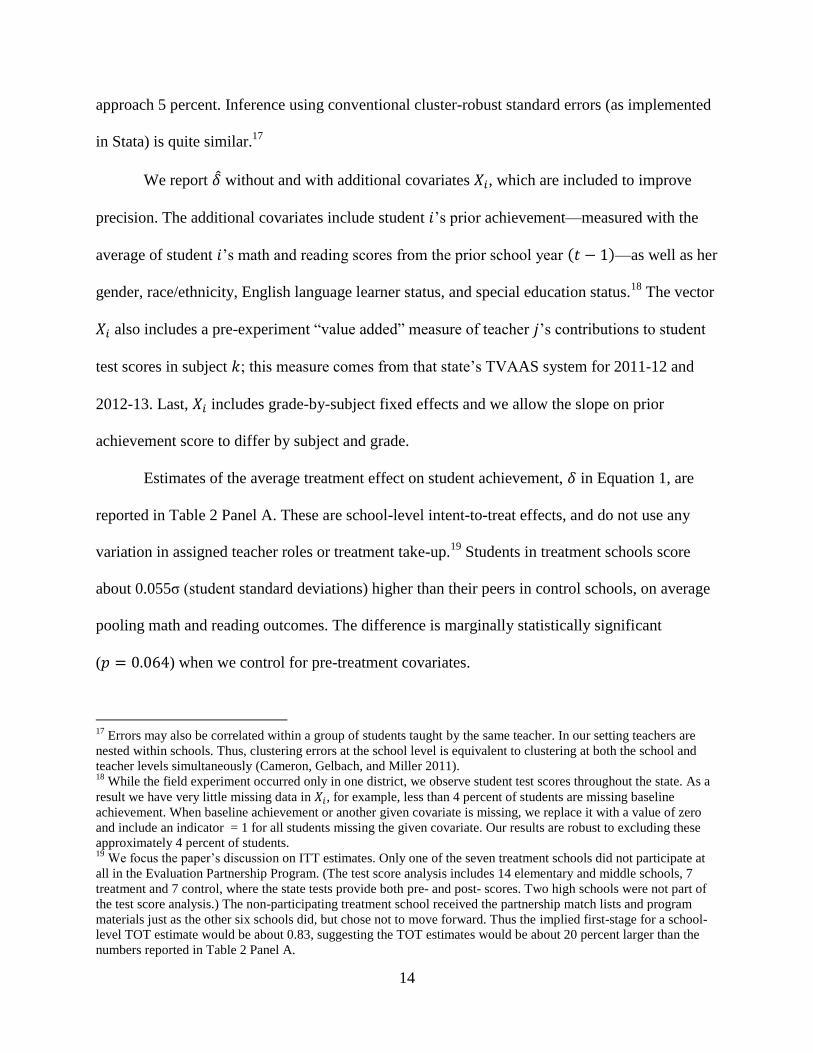
approach 5 percent. Inference using conventional cluster-robust standard errors (as implemented
in Stata) is quite similar.17
We report 𝛿 without and with additional covariates 𝑋𝑖, which are included to improve
precision. The additional covariates include student 𝑖’s prior achievement—measured with the
average of student 𝑖’s math and reading scores from the prior school year (𝑡 − 1)—as well as her
gender, race/ethnicity, English language learner status, and special education status.18
The vector
𝑋𝑖 also includes a pre-experiment “value added” measure of teacher 𝑗’s contributions to student
test scores in subject 𝑘; this measure comes from that state’s TVAAS system for 2011-12 and
2012-13. Last, 𝑋𝑖 includes grade-by-subject fixed effects and we allow the slope on prior
achievement score to differ by subject and grade.
Estimates of the average treatment effect on student achievement, 𝛿 in Equation 1, are
reported in Table 2 Panel A. These are school-level intent-to-treat effects, and do not use any
variation in assigned teacher roles or treatment take-up.19
Students in treatment schools score
about 0.055σ (student standard deviations) higher than their peers in control schools, on average
pooling math and reading outcomes. The difference is marginally statistically significant
(𝑝 = 0.064) when we control for pre-treatment covariates.
17
Errors may also be correlated within a group of students taught by the same teacher. In our setting teachers are
nested within schools. Thus, clustering errors at the school level is equivalent to clustering at both the school and
teacher levels simultaneously (Cameron, Gelbach, and Miller 2011). 18
While the field experiment occurred only in one district, we observe student test scores throughout the state. As a
result we have very little missing data in 𝑋𝑖, for example, less than 4 percent of students are missing baseline
achievement. When baseline achievement or another given covariate is missing, we replace it with a value of zero
and include an indicator = 1 for all students missing the given covariate. Our results are robust to excluding these
approximately 4 percent of students. 19
We focus the paper’s discussion on ITT estimates. Only one of the seven treatment schools did not participate at
all in the Evaluation Partnership Program. (The test score analysis includes 14 elementary and middle schools, 7
treatment and 7 control, where the state tests provide both pre- and post- scores. Two high schools were not part of
the test score analysis.) The non-participating treatment school received the partnership match lists and program
materials just as the other six schools did, but chose not to move forward. Thus the implied first-stage for a school-
level TOT estimate would be about 0.83, suggesting the TOT estimates would be about 20 percent larger than the
numbers reported in Table 2 Panel A.

15
These positive average treatment effects are educationally and economically meaningful.
Gains of 0.055σ represent roughly one-third of a standard deviation in teacher performance,
which is typically estimated at 0.15-0.20σ in math and somewhat smaller in reading (Hanushek
and Rivkin 2010, Jackson, Staiger, and Rockoff 2014). Put differently, the 0.055σ difference is
roughly equivalent to the difference between being assigned to a median teacher and a 63rd
percentile teacher. Additionally, these average treatment effects are also roughly one-quarter the
estimated gain from reducing class size by 30 percent in elementary grades (Kruger 1999), or the
estimated gain from doubling the amount of class time middle and high school students spend in
math (Taylor 2014, Cortes, Goodman, and Nomi 2015). However, unlike reducing class size or
increasing class time, the current treatment—pairing classroom teachers to work together on
improving skills—does not require a substantial increase in teacher salary expenditures.
These average differences in student achievement can be interpreted as causal effects of
treatment under the traditional experimental design assumption: At the beginning of the
experiment, there was no difference in potential outcomes—student achievement growth, teacher
or school performance, etc.—between treatment and control samples. This assumption rests
largely on the success of random assignment; evidence in support of successful random
assignment is presented in Table 1.
The estimated average treatment effect is somewhat larger when we focus on math
achievement alone and somewhat smaller for reading and language arts alone. This is consistent
with the typical pattern in empirical research on schooling: most general interventions affect
reading achievement less than math achievement. Additionally, the reading estimates are more
sensitive to the inclusion of pre-treatment covariates, though we cannot reject that the reading
estimates in Column 1 and 2 are equivalent statistically.

16
2.2 Treatment Effects for Target Teachers and Other Teachers
Next we estimate treatment effects separately for teachers with different roles in the
partnership program. The experiment was designed to improve the job performance of “target”
teachers; thus, the estimates in the top panel of Table 2 may mask important heterogeneity by
role. Teachers were assigned to one of three roles: (i) low-performing target teachers, (ii) high-
performing potential partner teachers, and (iii) all other teachers who were not assigned a role in
partnerships.
Building on Specification 1, we estimate the following regression to test for differences
by assigned teacher role:
𝐴𝑖𝑗𝑘𝑡 = 𝛿𝑇(𝐸𝑃𝑃𝑠(𝑗) ∗ 𝑇𝑎𝑟𝑔𝑒𝑡𝑗(𝑖)) + 𝛿𝑃(𝐸𝑃𝑃𝑠(𝑗) ∗ 𝑃𝑎𝑟𝑡𝑛𝑒𝑟𝑗(𝑖)) + 𝛿𝑁(𝐸𝑃𝑃𝑠(𝑗) ∗ 𝑁𝑜𝑅𝑜𝑙𝑒𝑗(𝑖))
+ 𝛼𝑃𝑃𝑎𝑟𝑡𝑛𝑒𝑟𝑗(𝑖) ++𝛼𝑁𝑁𝑜𝑅𝑜𝑙𝑒𝑗(𝑖) + 𝑋𝑖𝛽 + 𝜋𝑏(𝑠) + 휀𝑖𝑗𝑘𝑡
(2)
where 𝑇𝑎𝑟𝑔𝑒𝑡𝑗, 𝑃𝑎𝑟𝑡𝑛𝑒𝑟𝑗, and 𝑁𝑜𝑅𝑜𝑙𝑒𝑗 are a set of mutually-exclusive and exhaustive indicator
variables varying between teachers. This specification is algebraically equivalent to a more
conventional specification with a main effect of treatment and interactions with two of the three
teacher roles. 𝑇𝑎𝑟𝑔𝑒𝑡𝑗 = 1 if teacher 𝑗 was listed as a low-performing target teacher on the
principal’s Evaluation Partnership Program report. Recall that the report was created for both
treatment and control schools, but only provided to treatment schools. Similarly, 𝑃𝑎𝑟𝑡𝑛𝑒𝑟𝑗 = 1 if
teacher 𝑗 was listed as a high-performing potential partner (either in the recommended pairings
list or list of other potential partners). All other teachers have 𝑁𝑜𝑅𝑜𝑙𝑒𝑗 = 1, and were not listed
on the principal’s report. Our student-test-score sample includes 23 percent target teachers and
43 percent potential partner teachers. The estimates from Specification 2 are best interpreted as
intent-to-treat because the role indicators are based on the original reports created by the research

17
team, and not based on any post-randomization endogenous decisions. All other details of
estimation are the same as for Specification 1.
Treatment effects are largest for low-performing target teachers. As reported in the
bottom panel of Table 2, treatment leads to test-score gains of 0.12σ in target teachers’
classrooms (compared to students of teachers who would have been target teachers in control
schools, pooling math and reading). The estimates for high-performing partner teachers are
positive, but much smaller and not statistically significant. Indeed the estimates for partner
teachers are quite similar to the estimates for teachers who were not assigned a role in the
program.
Again, these improvements are meaningful. A gain of 0.12σ is an improvement of nearly
one standard deviation in the distribution of teacher performance and is at least as large as the
difference in performance between a novice teacher and a 5 to 10 year veteran (Rockoff 2004,
Papay and Kraft 2015).20
A gain of 0.12σ is roughly equivalent to the difference between being
assigned to a median teacher instead of a bottom quartile teacher.
Moreover, 0.12σ likely underestimates the effect of treatment on teachers who actually
participate in the program. Table 3 reports estimates of program take-up by teacher role (the first
stage results from a traditional 2SLS estimate of TOT).21
Among treatment teachers assigned by
the research team to the target role, 61 percent participated in the program in the target role,
suggesting a treatment-on-the-treated estimate of about 0.20σ (= 0.12/0.61). These
improvements are large but similar to the gains documented by Taylor and Tyler (2012) studying
20
The gains for target teachers are not necessarily substituting for experience gains. In results available on request,
we find the treatment effect is about 0.12σ for target teachers with more than five years experience, but one-third
smaller for teachers with five years or less experience. The difference is not statistically significant. Larger gains for
mid-career and experienced teachers are consistent with the results in Taylor and Tyler (2012) whose sample
includes only mid-career teachers. 21
The sample and specification are identical to Table 2 Panel B Column 1 following Equation 2, except that the
dependent variables are indicators for participation in a specific role.

18
a program of evaluation and feedback, especially the gains Taylor and Tyler estimate for the ex-
ante lowest performing teachers.
3. Growth in Teachers’ Skills and Other Potential Mechanisms
While the previous section documents educationally meaningful and economically
significant impacts, the average effect estimates do not shed light on the mechanisms through
which the peer pairings influence productivity. We now move on to our second empirical
question: Can the improvements in student learning—the positive average treatment effects—be
attributed to growth in teachers’ skills from peer learning? Or are other changes in behavior or
effort behind the effects reported in Table 2?
In treatment schools, low-performing teachers were paired with a high-performing
partner, and each pair was explicitly asked to work together on improving teaching skills. Thus
our first hypothesized mechanism is teacher skill growth. Nevertheless, there are at least two
other potential mechanisms contributing to the treatment effects: changes in teachers’ motivation
or effort, and changes in shared tasks (joint production) or resources. These three categories of
mechanism are not mutually exclusive; all three could be contributing, to varying extents, to the
average treatment effects. Jackson and Bruegmann (2009) describe how these three categories of
teacher spillovers likely affect performance in a typical school context. Our discussion of these
three mechanisms focuses on how the treatment’s pairing of teachers may have changed that
typical context. The experimental setting and control counterfactual rule out many first-order
features of these mechanisms as we highlight in the next paragraphs. Later we present empirical
tests of predictions from these three hypothesized mechanisms. We cannot test all predictions
empirically, especially in the case of the effort or motivation hypothesis, and thus the analysis is

19
not definitive. However, the tests we can conduct are a step toward sorting out the relative
contributions of different mechanisms.
While the stated purpose (to participating teachers) of the intervention was to improve
teacher instructional skills, a second potential mechanism is changes in teachers’ motivation or
effort. Asking a low-performing teacher to spend more time with a high-performing colleague,
and talk together about performance explicitly, may have made her more optimistic or
enthusiastic about work or made her more embarrassed about her poor performance. Similarly,
treatment teachers may have felt more accountability to their new partner. These interactions
may, in turn, lead to increased effort—either transitory increases in effort (e.g., motivated by
specific accountability to ones’ partner or direct monitoring by ones’ partner) or lasting increases
in effort (e.g., finding a new preferred equilibrium level of effort as a result of interacting with
ones’ partner). For the purposes of this paper we do not (cannot) distinguish between different
kinds of effort changes.22
There is evidence for coworker effects on effort outside the education
sector (for example, Mas and Moretti 2009). However, the scope for changes in optimism,
embarrassment, or accountability is limited in the current experimental comparison: the
treatment likely increased the degree of interaction with one coworker, but the mix of coworkers
and typical coworker interactions were the same in treatment and control schools. Furthermore,
teachers (and particularly low-performing teachers) in Tennessee already face fairly strong
extrinsic incentives to increase their performance, as their schools are under substantial test-
based accountability pressures and they are (as individuals) at risk of losing their jobs for low
evaluation ratings. The effect of any marginal accountability to one’s partner is likely to be
small.
22
Indeed, we cannot currently distinguish empirically between transitory and lasting changes because at present we
only have one year of data—the treatment year.

20
The third potential mechanism to consider is changes in teachers’ opportunities to share
resources or production tasks. Teacher partnerships formed by the treatment program may have
expanded to activities outside the original program scope. For example, teachers paired by the
treatment may have been more likely to share existing lesson plans or cooperate in creating new
lessons in ways that benefited productivity. Again, the control counterfactual rules out the
typical, first-order resource or task sharing among teachers within a school. For example,
teachers in treatment and control schools could exchange lessons and have group collaboration
time; thus, to explain treatment effects, the shared production must be a specific result of the new
partnership.
If teacher skill growth is a first-order mechanism then we should expect treatment effects
to be largest for the low-performing target teachers. As reported in Table 2 Panel B, that is what
we find empirically. However, the pattern of larger effects for low-performing target teachers
could also result from an asymmetric change in teachers’ motivation or effort or an asymmetric
change in resource or tasks sharing as a result of treatment.
In the remainder of this section, we present several empirical tests to help discriminate
among these three potential mechanisms. In short, we examine whether treatment effects vary
with the characteristics of teachers or characteristics of teacher pairings in ways that are most
consistent with skill growth or with either of the other two potential mechanisms.
3.1 Learning Skills
First, if low-performing target teachers did learn new skills from their high-performing
partner, we would expect larger treatment effects when the partner teacher’s specific skill
strengths matched the target teacher’s specific weaknesses. In Table 4 Columns 2 and 3 we test
this prediction. (Table 4 shows estimates pooling math and reading achievement; parallel

21
estimates for math and reading separately are provided in the appendix.23
) For ease of
comparison, we produce our main results from Table 2 in Column 1. In Column 2, for the target
teachers, we interact the treatment indicator with the proportion of teacher 𝑗’s weak skill areas
matched by her recommended partner’s strong skill areas.24
The “proportion skills matched”
measure is based on the one-to-one pairings recommended in the original principal reports; in the
spirit, again, of intent-to-treat estimates. We have standardized the “proportion skills matched”
(mean 0, s.d. 1) for comparison with other measures of pair characteristics in Table 4. Consistent
with peer learning, the coefficient is positive and statistically significant (𝑝 = 0.044). Student
achievement gains were larger in pairs where the high-performing teacher was better suited to
teach new skills to her low-performing partner.
In Column 3 we replace the continuous proportion matched with an indicator = 1 if the
proportion skills matched is above the pair median (about 0.5). This less-parametric approach
also shows larger performance improvements when target and partner teachers are better
matched on skills, though the estimates are not statistically significant at conventional levels.
The treatment effects appear concentrated among target teachers who were better matched to
partners with relevant skills to share. By contrast, if low-performing target teachers’ motivation,
effort, or joint production behavior changed, we would likely see positive treatment effects even
when there are few or no strength-to-weakness skill matches. This is apparently not the case. The
estimated treatment effect when the proportion skills matched is below median (Column 3 Row
23
We focus on math and reading pooled partly for simplicity, and partly motivated by concerns about statistical
power. The separate results are noisier. 24
Recall that proposed pairings were determined algorithmically based on matches in 19 specific skill areas
measured in each teacher’s prior evaluation micro-data. We count up the number of skill areas in which there is a
match: the target teacher has a score less than 3 and the recommended partner has a score of 4 or greater (see
Section 1). Then, we divide the number of matches by the number of areas in which the target teacher scored less
than 3.

22
1) is positive, but not statistically significant and similar in size to the point estimates for partner
and no assigned role teachers.
Skill growth may also be measurable in other aspects of teacher performance. To this
point we have focused on performance as measured by student test score growth. Table 5 reports
treatment effects for a second measure of teacher performance: evaluation scores from direct, in-
class observations of teaching practices. In Table 5 Column 1, we simply average all of teacher
𝑗’s post-randomization classroom observation scores, and regress that average on a treatment
indicator and randomization block fixed effects.25
The remaining columns report effects for sub-
scores, defined by the state’s evaluation system, that group specific sets of skills into three areas:
instruction, planning, and classroom environment.26
All outcome variables are standardized
(mean 0, s.d. 1) using the statewide teacher distribution. In all cases the point estimates are
positive, suggesting improvements in evaluation scores, but generally not statistically significant.
When we limit the sample to teachers who also have student test score data, the point estimates
are larger with tighter confidence intervals.
While the estimates are imprecise, these improvements in observed teaching practices are
consistent with skill growth. However, we interpret these results with caution. First, they are
imprecise. Second, many of the observations are conducted by the school principal who, in
treatment schools, was certainly aware of the program and its goals of improved practices and
improved evaluation scores. Treatment principals may have, consciously or unconsciously,
inflated observations scores to recognize participation in the program; or, alternatively,
principals may have been more critical or more aware of low-performance as a result of the
25
As described in Section 1, teachers are scored on 19 skills multiple times per year. We first calculate an average
score for each skill then average the skill scores to obtain the overall average. 26
The number of observations varies because not all teachers were scored on all sub-scores post-randomization. The
pattern of results is the same if we limit the sample to teachers with all three sub-scores.

23
program. Third, these estimates likely understate the true impact because they include
observation scores that were assessed shortly after the pairs were matched. If we restrict the
analysis to observations late in the school year, say after March 1 or April 1, they are even less
precise. The results in Table 5 are important to document, but we prefer the test-score-based
measures of performance.
3.2 Motivation or Effort
Second, being paired with a higher-performing colleague may generate increased
motivation or effort that can improve performance even if the target teacher’s skills do not
change. If this kind of mechanism contributed to the treatment effects, we might expect the
treatment effect to be positively correlated with the size of the gap between the target teacher’s
baseline job performance and her partner’s baseline performance. For example, Mas and Moretti
(2009) find that low-performing grocery check-out clerks increase their work effort when a
higher-performing peer works at the same time and can observe the low-performer’s effort; but
high-performers are not affected by other high-performers. We test this prediction in Table 4
Columns 4-7. Looking across the estimates in these columns, we do not find evidence of such a
positive correlation. In fact, the imprecise point estimates are all negative. Moreover, while a
positive correlation would be consistent with motivation, it might also be consistent with peer
learning. A larger gap in skills may indicate a pair where the high-performer has more things to
teach her partner.
In Column 4, for target teachers, we interact the treatment indicator with the difference in
prior-year classroom observation scores (partner teacher minus target teacher). These
observation scores are the TEAM rubric scores gathered in the formal evaluation process

24
described in Section I.27
The point estimate is negative, but small and not statistically significant.
In Column 5 we include interactions for both difference in observation scores and proportion
skills matched. Both measures have been standardized (mean 0, s.d. 1 throughout Table 4) to
facilitate comparisons like Column 5. If anything, the coefficient on proportion skills matched is
more positive, and the coefficient on observation scores more negative.
In Columns 6 and 7 we use an alternative measure of the gap between the target and
partner baseline performance: the difference in prior “value added scores”.28
Value added scores
are designed to measure each individual teacher’s contribution to student test score growth. The
pattern for difference in value added is quite similar to the pattern for difference in observation
scores.
3.3 Sharing Resources or Tasks
The third mechanism category concerns new opportunities to share productive resources
or job tasks. Being paired with another teacher may foster willingness or opportunities to
collaborate at work in ways that improve performance even if the target teacher’s skills do not
change. Under this hypothesis we would expect the treatment effect to be greater when teacher
pairs teach the same grade-level or subject area. The assumption motivating this test is that, even
absent the treatment, shared production activities are easier or higher-return when teachers teach
the same (similar) grade level or subject. Sharing lesson plans is a simple, but concrete, example.
To test this mechanism we interact the treatment indicator with the absolute value of the
difference between the grade level target teacher 𝑗 is teaching and the grade level her assigned
27
We calculate an overall classroom observation score for each teacher by (i) calculating her average score across
different observations and observers for each of the 19 skill areas, then (ii) taking the average of the 19 skill scores.
We use pre-experiment data: observations conducted in the 2012-13 school year and early in the 2013-14 school
year before random assignment. The data are missing observation scores for some partner teachers. We set the
target-partner difference to zero and include an indicator for missing difference score. 28
We use value added scores provided by the state’s TVAAS evaluation system. We calculate an overall value
added score for each teacher by averaging all her subject-by-year value added scores from 2011-12 and 2012-13.

25
partner is teaching.29
The result, reported in Column 8, is not consistent with this prediction. We
estimate smaller treatment effects when pairs teach the same (similar) grade level, though the
estimate is not statistically significant. Column 9 reports the result of a similarly-motivated test:
we interact the treatment indicator with an indicator = 1 if the target and partner teacher are both
teaching the tested subject 𝑘. We do estimate larger treatment effects when pairs teach the same
subject, supporting the collaboration hypothesis, though again the estimate is not statistically
significant. And, as above, this effect could derive in part from improved peer learning among
teachers in the same subject. In short, we do not find strong evidence for a shared production
mechanism.
To summarize the results across the three mechanism categories, first, we find evidence
consistent with the hypothesis that low-performing target teachers learn new skills from their
high-performing partner. Predictions for other mechanisms, by contrast, are not borne out in our
data. We do not find evidence consistent with a motivation or effort hypothesis, nor a shared
resources or task hypothesis. Our empirical tests are partial and the three mechanisms are not
mutually exclusive, so we cannot rule out any of these mechanisms. However, the available
evidence suggests skill growth accounts for part of, perhaps much of, the average treatment
effect.
4. Discussion and Conclusion
In this paper we study on-the-job learning among classroom teachers, especially learning
skills from coworkers, in a field experiment. We document meaningful improvements in job
performance among treatment teachers, and the patterns of performance gains suggest teachers
29
As with the other pair characteristics, the difference in grade level is standardized (mean zero, s.d., one) for
comparability within Table 4. Some teachers have students at more than one grade level. In those cases we use the
student weighted average of grade level.

26
learned job skills from their colleagues. The gains are empirical evidence of the intuitive, long-
theorized benefits of coworkers in human capital development. Indeed, this paper contributes the
first experimental evidence, of which we are aware, of peer learning at work.
Our estimates are consistent with prior evidence of learning from coworkers among
teachers. Jackson and Bruegmann (2009) find that when a teacher begins working with higher-
performing colleagues her own performance improves as a result. A one standard deviation
increase in peer performance, as measured by prior contributions to student test score growth,
generates a 0.03-0.04σ improvement in own performance, also measured with current student
test scores. Importantly, Jackson and Bruegmann define “working with” as teaching in the same
grade and school as the peer; the peer work we study is more direct, and the effects are larger.
Taylor and Tyler (2012) find that teacher performance improves 0.05σ during a school year in
which a peer teacher conducts classroom-observation-based evaluations and subsequently
provides feedback. Both Jackson and Bruegmann (2009) and Taylor and Tyler (2012) report that
the gains in performance are sustained into the future; indeed in the latter case the effects grow
from 0.05σ during the peer evaluation year to 0.10σ in the years after the peer evaluation year.
As of this writing, test scores are not yet available to study whether our experiment’s effects
persist, fade, or grow.
The experiment and results suggest practical alternatives to formal on-the-job training,
especially in professional occupations. The contrast in approaches is particularly strong in the
case of teachers. Formal courses, called “professional development,” are today the primary
approach to on-the-job training for public school teachers. Collectively K-12 schools spend
about $18 billion per year on professional development courses, of which $3 billion is paid to
external providers (Gates Foundation 2014); the average teacher spends at least 20 hours each

27
year in “professional development”.30
Despite the substantial commitment of resources, the
empirical evidence suggests little effect on teacher performance (see reviews by Jackson,
Rockoff, and Staiger 2014, and Yoon et al. 2007). Similarly, public school systems spend
tremendous resources paying for teachers’ graduate tuition, and paying higher salaries once
teachers’ obtain their graduate degree. There is limited evidence that such degrees significantly
improve teacher effectiveness (Jackson, Rockoff, and Staiger 2014).
By contrast, the one-on-one personalized approach to on-the-job training we study in this
paper is apparently much more successful and much less costly. The primary marginal cost for
treatment schools was the time that target and partner teachers allocated to working with each
other. The opportunity cost of that time is important, although it could plausibly substitute for the
time teachers would have spent in formal professional development courses. The cost is low in
part because the high-performing coworker provides the teaching expertise. There could be
additional costs if higher-performing partners substitute away from other activities, especially
attention to their own students. However, we do not find evidence of reduced performance
among the higher-performing partners. If anything, the high-performers may have also benefited
from participating in the pairings.
One important contextual feature of the experiment is the formal teacher evaluation
system. All teachers in our study—treatment and control, target and partner and no role—are
subject to Tennessee’s new formal performance evaluation system. Teacher pairs were identified
based on prior evaluation results, and teacher pairs were encouraged, in part, to work on
improving evaluation results. These connections to formal evaluation likely influenced
principals’ and teachers’ willingness to participate, and the nature of their participation. For these
reasons we think this study has contributions for the small, still-developing literature on how
30
Author’s calculation from the Schools and Staffing Survey 2011-12.

28
evaluation affects teacher performance (Taylor and Tyler 2012, Steinberg and Sartain 2015,
Bergman and Hill 2015). One final result on this subject comes from a survey of teachers at the
end of the experiment. Teachers were asked a series of questions to measure their attitude toward
formal evaluation, for example, “I have a favorable impression of the teacher evaluation system”
rated on a six point agree/disagree scale.31
Judging from survey responses, teachers in treatment
schools left with more favorable opinions of evaluation: attitudes about evaluation were 0.23
standard deviations more positive, as measured by a composite of the four survey questions.
However, survey response rates were lower in treatment schools (approximately 45 percent
versus 66 percent), and thus this result should be interpreted with caution. If treatment
suppressed responses from teachers with negative opinions, then the treatment effect on attitudes
could easily be negative, but the empirical direction of any non-response bias is not clear.
The teacher job performance improvements documented in this paper suggest learning
from colleagues is at least as valuable as formal on-the-job training or the gains from experience
in developing teaching skills. Indeed peer learning may be a key contributor to the oft-cited
estimates of returns to experience in teaching. Most practically, the treatment and results suggest
promising ideas for managing the sizable teacher workforce.
31
The other three questions on this topic were: “In general, my colleagues have a favorable impression of the
teacher evaluation system” and “I receive valuable feedback and guidance through teacher evaluation that helps me
improve” both rated in the six point agree/disagree scale. And “What do you feel is the primary purpose of the
teacher evaluation system? To help teachers improve. To rate teachers. Some of both.” Surveys were collected by
the authors working directly with participating schools.
To create a composite score for evaluation attitudes we conducted a factor analysis of these questions and use the
predicted first factor as our dependent variable. The factor analysis inputs were the three agree/disagree responses
and separate binary indicators for “To help teachers improve” and “To rate teachers”. The first factor explains nearly
100 percent of the variation in responses to these four questions.

29
References
Angrist, J. & Lavy, V. (2001). Does Teacher Training Affect Pupil Learning? Evidence from
Matched Comparisons in Jerusalem Public Schools. Journal of Labor Economics, 19(2),
343–69.
Azoulay, P., Zivin, J. S., & Wang, J. (2010). Superstar Extinction. Quarterly Journal of
Economics, 125(2), 549-589.
Bandiera, O., Barankay, I., & Rasul, I. (2005). Social Preferences and the Response to
Incentives: Evidence from Personnel Data. Quarterly Journal of Economics, 120(3), 917-
962.
Battu, H., Belfield, C. R., & Sloane, P. J. (2003). Human Capital Spillovers within the
Workplace: Evidence for Great Britain. Oxford Bull Econ & Stats Oxford Bulletin of
Economics and Statistics, 65(5), 575-594.
Becker, G. S. (1962). Investment in Human Capital: A Theoretical Analysis. Journal of Political
Economy, 70(5 part 2), 9-49.
Bergman, P., & Hill, M. J. (2015). The Effects of Making Performance Information Public:
Evidence From Los Angeles Teachers and a Regression Discontinuity Design. CESifo
Working Paper 5383.
Cameron, A. C., Gelbach, J. B., & Miller, D. L. (2008). Bootstrap-Based Improvements for
Inference with Clustered Errors. Review of Economics and Statistics, 90(3), 414-427.
Cameron, A. C., Gelbach, J. B., & Miller, D. L. (2011). Robust Inference with Multiway
Clustering. Journal of Business and Economic Statistics, 29(2), 238-249.
Chetty, R., Friedman, J. N., & Rockoff, J. E. (2014). Measuring the Impacts of Teachers II:
Teacher Value-Added and Student Outcomes in Adulthood. American Economic Review,
104(9), 2633-2679.
Cortes, K. E., Goodman, J. S., & Nomi, T. (2015). Intensive Math Instruction and Educational
Attainment: Long-Run Impacts of Double-Dose Algebra. Journal of Human Resources,
50(1), 108-158.
Danielson, C. (1996). Enhancing Professional Practice: A Framework for Teaching. Alexandria,
VA: Association for Supervision and Curriculum Development.
Gates Foundation. (2014). Teachers Know Best: Teachers Views on Professional Development.
Seattle: Bill & Melinda Gates Foundation.

30
Hamilton, B. H., Nickerson, J. A., & Owan, H. (2003). Team Incentives and Worker
Heterogeneity: An Empirical Analysis of the Impact of Teams on Productivity and
Participation. Journal of Political Economy, 111(3), 465-497.
Hanushek, E. A., & Rivkin, S. G. (2010). Generalizations about Using Value-Added Measures of
Teacher Quality. American Economic Review, 100(2), 267-271.
Ichino, A., & Maggi, G. (2000). Work Environment and Individual Background: Explaining
Regional Shirking Differentials in a Large Italian Firm. Quarterly Journal of Economics,
115(3), 1057-1090.
Jackson, C. K., & Bruegmann, E. (2009). Teaching Students and Teaching Each Other: The
Importance of Peer Learning for Teachers. American Economic Journal: Applied
Economics, 1(4), 85-108.
Jackson, C. K., Rockoff, J. E., & Staiger, D. O. (2014). Teacher Effects and Teacher-Related
Policies. Annu. Rev. Econ. Annual Review of Economics, 6(1), 801-825.
Krueger, J. (1999). Experimental Estimates of Education Production Functions. Quarterly
Journal of Economics, 114(2), 497-532.
Lucas, R. E. (2988). On the Mechanics of Economic Development. Journal of Monetary
Economics, 22(1), 3-42.
Marshall, A. (1890). Principles of Economics. London: Macmillan.
Mas, A., & Moretti, E. (2009). Peers at Work. American Economic Review, 99(1), 112-145.
Moretti, E. (2004). Workers' Education, Spillovers, and Productivity: Evidence from Plant-Level
Production Functions. American Economic Review, 94(3), 656-690.
Kraft, M.A. & Papay, J.P. (2014). Do Supportive Professional Environments Promote Teacher
Development? Explaining Heterogeneity in Returns to Teaching Experience. Educational
Evaluation and Policy Analysis, 36(4), 476-500.
Papay, J. P. & Kraft, M. A. (2015). Productivity Returns to Experience in the Teacher Labor
Market: Methodological Challenges and New Evidence on Long-Term Career
Improvement. Journal of Public Economics, forthcoming.
Rockoff, J. E. (2004). The Impact of Individual Teachers on Student Achievement: Evidence
from Panel Data. American Economic Review, 94(2), 247-252.
Rockoff, J. E. (2008). Does Mentoring Reduce Turnover and Improve Skills of New Employees?
Evidence from Teachers in New York City. Columbia Business School Working Paper.

31
Sacerdote, B. I. (2011). Peer Effects in Education: How Might They Work, How Big Are They
and How Much Do We Know Thus Far? In Handbook of Economics of Education Volume
3, Hanushek, E. A., Machin, S., & Woessmann, L. eds. Amsterdam: North Holland.
Steinberg, M. P., & Sartain, L. S. (2015). Does Teacher Evaluation Improve School
Performance? Experimental Evidence from Chicago’s Excellence in Teaching Pilot.
Education Finance and Policy, forthcoming Winter 2015.
Taylor, E. S. (2014). Spending More of the School Day in Math Class: Evidence from a
Regression Discontinuity in Middle School. Journal of Public Economics, 117, 162-181.
Taylor, E. S., & Tyler, J. H. (2012). The Effect of Evaluation on Teacher Performance. American
Economic Review, 102(7), 3628-3651.
U.S. Census Bureau. (2015). Public Education Finances: 2013. Educational Finance Branch
G13-ASPEF. Washington, D.C.: United States Census Bureau
Weisberg, D., Sexton, S., Mulhern, J., & Keeling, D. (2009). The Widget Effect: Our
National Failure to Acknowledge and Act on Teacher Effectiveness. New York: The New
Teacher Project.
Yoon, K. S., Duncan, T., Lee, S. W., Scarloss, B., & Shapley, K. (2007). Reviewing the
Evidence on How Teacher Professional Development Affects Student Achievement: Issues
& Answers Report, REL 2007–No. 033. Washington, DC: US Department of Education,
Institute of Education Sciences.

32
Questioning
Significantly Above Expectations (5) At Expectations (3) Significantly Below Expectations (1)
Teacher questions are varied and high-
quality, providing a balanced mix of
question types:
o knowledge and comprehension;
o application and analysis; and
o creation and evaluation.
Questions require students to regularly cite
evidence throughout lesson.
Questions are consistently purposeful and
coherent.
A high frequency of questions is asked.
Questions are consistently sequenced with
attention to the instructional goals.
Questions regularly require active
responses (e.g., whole class signaling,
choral responses, written and shared
responses, or group and individual
answers).
Wait time (3-5 seconds) is consistently
provided.
The teacher calls on volunteers and non-
volunteers, and a balance of students based
on ability and sex.
Students generate questions that lead to
further inquiry and self-directed learning.
Questions regularly assess and advance
student understanding.
When text is involved, majority of
questions are text based.
Teacher questions are varied and high-
quality providing for some, but not all,
question types:
o knowledge and comprehension;
o application and analysis; and
o creation and evaluation.
Questions usually require students to cite
evidence.
Questions are usually purposeful and
coherent.
A moderate frequency of questions asked.
Questions are sometimes sequenced with
attention to the instructional goals.
Questions sometimes require active
responses (e.g., whole class signaling,
choral responses, or group and individual
answers).
Wait time is sometimes provided.
The teacher calls on volunteers and non-
volunteers, and a balance of students based
on ability and sex.
When text is involved, majority of
questions are text based
Teacher questions are inconsistent in
quality and include few question types:
o knowledge and comprehension;
o application and analysis; and
o creation and evaluation.
Questions are random and lack coherence.
A low frequency of questions is asked.
Questions are rarely sequenced with
attention to the instructional goals.
Questions rarely require active responses
(e.g., whole class signaling, choral
responses, or group and individual
answers).
Wait time is inconsistently provided.
The teacher mostly calls on volunteers and
high-ability students.
Figure 1—Example from TEAM rubric, “Questioning” skills

33
Figure 2—Sample report for school principals showing potential partner matches for target teachers
Teacher Name
Potential Match
Teacher Name Instr
uctional P
lans (
IP)
Stu
dent
Work
(S
W)
Assessm
ent
(AS
)
Expecta
tions (
EX
)
Managin
g S
tudent
Behavio
r (M
SB
)
Environm
ent
(EN
V)
Respectf
ul C
ulture
(R
C)
Sta
ndard
s a
nd O
bje
ctives (
SO
)
Motivating S
tudents
(M
S)
Pre
senting I
nstr
uctional C
onte
nt
(PIC
)
Lesson S
tructu
re a
nd P
acin
g (
LS
)
Activitie
s a
nd M
ate
rials
(A
CT
)
Questionin
g (
QU
)
Academ
ic F
eedback (
FE
ED
)
Gro
upin
g S
tudents
(G
RP
)
Teacher
Conte
nt
Know
ledge (
TC
K)
Teacher
Know
ledge o
f S
tudents
(T
KS
)
Thin
kin
g (
TH
)
Pro
ble
m S
olv
ing (
PS
)
Jane Blue o o o o o
Jane Brown x x x x x x x x x x x x x x x x x x
Jane Yellow x x x x x x x x x x x x x x x x
John Red x x x x x x x x x x x x x
Jane Orange x x x x x x x x x x x x x x
John Pink x x x x x x x x x x x x x
John Green o o o
John Black x x x x x x x x x x x x x x x x x x x
Jane Yellow x x x x x x x x x x x x x x x x
Jane Orange x x x x x x x x x x x x x x
John Pink x x x x x x x x x x x x x
Jane White x x x x x x x x x x x x
Note: An 'x' indicates that the teacher had an average score of 4 or higher on that element, an 'o' indicates an average
score of less than 3.

34
Table 1—Student and teacher characteristics,
and pre-treatment balance
Cont.
mean
(st.dev.)
Treat.
mean
(st.dev.)
Diff = 0
p-value
(1) (2) (3)
Student characteristics
Baseline test scores
Mathematics 0.077 0.034 0.200
(0.552) (0.654)
Reading/language arts 0.066 0.045 0.636
(0.530) (0.668)
Average 0.070 0.039 0.344
(0.528) (0.646)
Female 0.491 0.487 0.816
Race/ethnicity
White 0.333 0.299 0.752
African-American 0.596 0.587 0.856
Latino(a) 0.047 0.087 0.240
Other 0.024 0.027 0.624
English language learner 0.015 0.038 0.024
Special education 0.116 0.128 0.628
Retained in grade 0.001 0.002 0.300
Teacher characteristics
Years of experience 12.179 13.756 0.140
(11.904) (10.326)
Baseline job performance
Value-added math -0.040 0.038 0.668
(0.759) (0.668)
Value-added reading -0.010 0.246 0.144
(0.777) (0.848)
Classroom observation score 3.653 3.843 0.428
(0.596) (0.552)
Teacher pair characteristics
Proportion skills matched 0.579 0.611 0.636
Difference in baseline
Value-added 0.123 0.688 0.192
(0.561) (0.840)
Observation score 1.158 1.018 0.004
(0.412) (0.423)
Difference in grade level taught 0.803 1.192 0.272
(0.430) (0.337)
Teach same subject 0.767 0.906 0.420
Note: Means and standard deviations net of randomization block fixed effects. Baseline student test scores and
baseline teacher value-added standardized (mean 0 s.d. 1) using the statewide distributions for students and teachers
respectively. Teacher value-added scores are in teacher standard deviation units. Observation scores in natural units
(1-5 scale). Column 3 reports wild cluster bootstrap-t p-values (Cameron, Gelbach, and Miller 2008) with 500
replications.

35
Table 2—Treatment effect on student achievement (intent to treat)
Observations
Treatment effect
Student Teacher
(1) (2)
(3) (4)
(A) Average treatment effect
Math and reading 0.052 0.055
2948 137
[0.268] [0.064]
Math 0.088 0.065
2875 87
[0.060] [0.036]
Reading 0.016 0.052
2638 89
[0.752] [0.080]
(B) Treatment effect by teacher role
Math and reading
Low-performing target teachers 0.082 0.124
2948 137
[0.016] [0.000]
High-performing partner teachers 0.031 0.028
[0.576] [0.272]
No assigned role 0.014 0.028
[0.824] [0.512]
Pre-experiment covariates
√
Note: Panel A: Each cell is an estimate from a separate regression. The dependent variable is a student test score,
standardized (mean 0, standard deviation 1) within subject by grade-level cells using the statewide student
distribution. All regressions include randomization block fixed effects. The vector of pre-experiment covariates
includes: (i) Baseline student achievement: the average of each student's prior year math and reading scores. Prior
test-score slope is allowed to vary by outcome subject and grade-level. (ii) Teacher pre-experiment value-added in
the outcome subject: the average of 2012-13 and 2011-12 TVAAS scores. (iii) Indicators for student gender,
race/ethnicity, English language learner status, special education status, and whether the student is repeating the
grade. When baseline test scores or value-added are missing we set the value to zero and include an indicator = 1 for
missing. If the student had two or more teachers in a given subject, we include one observation per teacher and
weight each observation by the proportion of responsibility allocated by the state to the teacher. Three quarters of
students had one teacher in a given subject.
Panel B: Each column reports estimates from a separate regression. Estimation is identical to Panel A, except that
the single treatment indicator is replaced with three indicators: treatment * target teacher, treatment * partner
teacher, and treatment * no assigned role. The specification also includes main effects for teacher role (i.e., "partner"
and "no assignment" with "target" the omitted category).
P-values in brackets for the test that the coefficient equals zero. P-values estimated using wild cluster (school)
bootstrap-t methods (Cameron, Gelbach, and Miller 2008) with 500 replications.
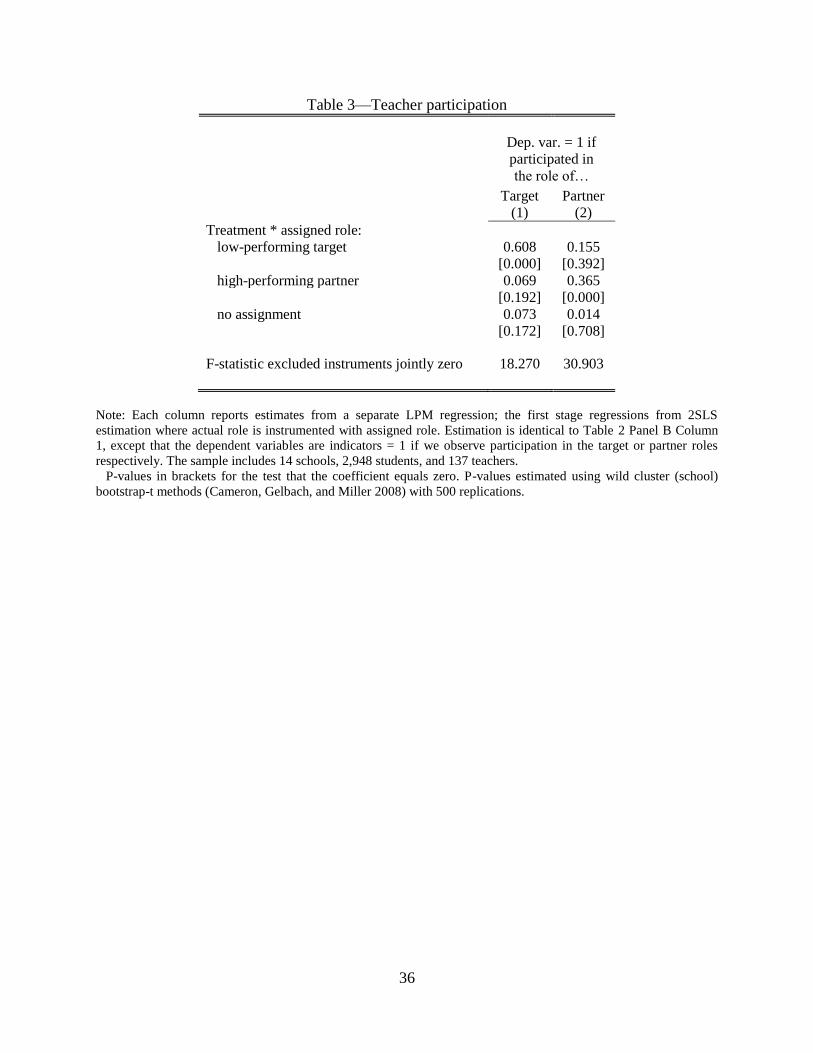
36
Table 3—Teacher participation
Dep. var. = 1 if
participated in
the role of…
Target Partner
(1) (2)
Treatment * assigned role:
low-performing target 0.608 0.155
[0.000] [0.392]
high-performing partner 0.069 0.365
[0.192] [0.000]
no assignment 0.073 0.014
[0.172] [0.708]
F-statistic excluded instruments jointly zero 18.270 30.903
Note: Each column reports estimates from a separate LPM regression; the first stage regressions from 2SLS
estimation where actual role is instrumented with assigned role. Estimation is identical to Table 2 Panel B Column
1, except that the dependent variables are indicators = 1 if we observe participation in the target or partner roles
respectively. The sample includes 14 schools, 2,948 students, and 137 teachers.
P-values in brackets for the test that the coefficient equals zero. P-values estimated using wild cluster (school)
bootstrap-t methods (Cameron, Gelbach, and Miller 2008) with 500 replications.

37
Table 4—Treatment effect heterogeneity by assigned teacher role and teacher pair characteristics
Dep. var. = student math and reading test scores
(1) (2) (3) (4) (5) (6) (7) (8) (9)
Treatment low-performing target 0.124 0.134 0.037 0.126 0.139 0.124 0.139 0.123 0.113
[0.000] [0.000] [0.368] [0.000] [0.000] [0.000] [0.000] [0.000] [0.040]
Treatment high-performing partner 0.028] 0.029 0.028 0.028 0.029 0.027 0.029 0.027 0.027
[0.272] [0.212] [0.228] [0.280] [0.208] [0.272] [0.224] [0.272] [0.268]
Treatment no assignment 0.028 0.027 0.027 0.028 0.026 0.028 0.027 0.028 0.028
[0.512] [0.540] [0.516] [0.520] [0.572] [0.492] [0.524] [0.508] [0.492]
Treatment target
proportion skills matched (std)
0.055
0.060
0.066
[0.044]
[0.016]
[0.020]
proportion skills matched, above median (binary)
0.156
[0.120]
difference in prior observation scores (std)
-0.015 -0.031
[0.872] [0.520]
* difference in prior value-added scores (std)
-0.016 -0.039
[0.596] [0.444]
* difference in grade level currently
0.029
teaching (absolute value, std)
[0.404]
* both currently teaching the tested subject (binary)
0.036
[0.632]
Note: Each column reports estimates from a separate regression. Column 1 is identical to Table 2 Panel B Column 2. The dependent variable is a student test
score, standardized (mean 0, s.d. 1) within subject by grade-level cells using the statewide distribution. All regressions include randomization block fixed effects,
and the vector of pre-experiment covariates described in Table 2. Additionally, all regressions include main effects for teacher role (i.e., "partner" and "no
assignment" with "target" the omitted category). For target teachers, Columns 2-9 interact the treatment indicator with various characteristics of the assigned
teacher pair; in each case the regression includes a main effect of the pair characteristic. A "skill match" occurs when the target teacher has a score below 3 in the
skill and the assigned partner has a score of 4 or higher (19 skills possible). The denominator in "proportion skills matched" is the number of skills where the
target has a low score. "Difference" measures are assigned partner score minus target score. The "proportion" and "difference" measures have been standardized
(mean 0, s.d. 1) within the sample. "Both currently teaching" is an indicator = 1 if assigned partner and target both teach the subject of the outcome score (math
or reading). When a pair characteristic is missing we set the value to zero and include an indicator = 1 for missing. Regressions are weighted as described in
Table 2. The sample includes 14 schools, 2,948 students, and 137 teachers.
P-values in brackets for the test that the coefficient equals zero. P-values estimated using wild cluster (school) bootstrap-t methods (Cameron, Gelbach, and
Miller 2008) with 500 replications.

38
Table 5—Treatment effect on teaching skills scored in classroom observations
Observation
average
(19 skills)
Sub-scores
Instruction
(12 skills)
Planning
(3 skills)
Classroom
environment
(4 skills)
(1) (2) (3) (4)
(A) All teachers
Treatment 0.133 0.169 0.046 0.099
[0.716] [0.672] [0.856] [0.760]
Observations 464 459 349 444
(B) Teachers with student test scores (grade 4-8, math and reading)
Treatment 0.286 0.351 0.317 0.069
[0.180] [0.108] [0.280] [0.716]
Observations 115 113 87 111
Note: Each cell within panels is an estimate from a separate regression. The dependent variable is a post-random-
assignment measure of observed teaching practices from formal classroom observations conducted as part of the
teacher's performance evaluation (see text for more details). Dependent variables are standardized (mean 0, standard
deviation 1) using the statewide teacher distribution. All regressions include randomization block fixed effects.
P-values in brackets for the test that the coefficient equals zero. P-values estimated using wild cluster (school)
bootstrap-t methods (Cameron, Gelbach, and Miller 2008) with 500 replications

39
Appendix Table 1—Pre-treatment balance by teacher role
Treat. - cont. mean difference [p-value]
by teacher's assigned role
Target Partner No role
(1) (2) (3)
Student characteristics
Baseline test scores
Mathematics -0.108 -0.024 -0.061
[0.248] [0.672] [0.432]
Reading/language arts -0.068 0.006 -0.060
[0.392] [0.944] [0.192]
Average -0.088 -0.006 -0.061
[0.368] [0.916] [0.304]
Female 0.025 -0.018 -0.012
[0.392] [0.376] [0.640]
Race/ethnicity
White -0.075 -0.042 -0.019
[0.616] [0.724] [0.836]
African-American 0.043 -0.012 -0.031
[0.740] [0.912] [0.860]
Latino(a) 0.029 0.059 0.040
[0.392] [0.000] [0.472]
Other 0.003 -0.004 0.011
[0.760] [0.784] [0.652]
English language learner 0.016 0.023 0.043
[0.092] [0.004] [0.248]
Special education 0.028 0.023 -0.034
[0.384] [0.544] [0.236]
Retained in grade 0.003 0.001 0.000
[0.228] [0.616] [0.960]
Teacher characteristics
Years of experience 0.935 0.867 2.341
[0.864] [0.672] [0.412]
Baseline job performance
Value-added math -0.164 0.028 0.170
[0.608] [0.960] [0.528]
Value-added reading -0.266 0.032 0.755
[0.640] [0.864] [0.000]
Classroom observation score 0.184 0.244 -0.072
[0.236] [0.324] [0.792]
Note: Each cell reports a treatment minus control difference in means. The three estimates in each row come from a
single regression. The dependent variable described by the row label. All regressions include randomization block
fixed effects, and main effects for teacher role (i.e., "partner" and "no assignment" with "target" the omitted
category). P-values in brackets for the test that the difference equals zero. P-values estimated using wild cluster
(school) bootstrap-t methods (Cameron, Gelbach, and Miller 2008) with 500 replications.