learning growth model chelsie, laura, emily. what is learning growth model? chelsie dobberstein
TRANSCRIPT
Learning Growth Model Chelsie, Laura, Emily
What is Learning Growth Model?
Chelsie Dobberstein
LGM or Learning Growth Model✾Allowed Indiana to be waved from NCLB✾Takes a student’s ISTEP+ scores from
year 1 and finds other student with the same score to form peer groups.
✾In year 2 of testing, the students in each peer group’s scores are compared to see how each student scored based on their peers.
Goal of LGM✾ Focus on outputs of education and expect
progress from all students not just those close to passing
✾“Catch up, Keep up, Move up”
DOE and UsageDOE
Shows which students show typical, low and high growth
Shows if students are making appropriate progress
UsageCan be used to display students, school and
district results to educators and/or the publicThis allows parents, teachers and administrators
to see the progress made my a student year to year.
Public ReleaseStarted February 10th
Divided into 3 phases to roll out the data to the public
Phase 1Administration has received the data
and it is currently being examined internally

Phase 2Takes off later in the winterAllows school to receive more detailed
reports of their students and corporation
Phase 3Takes off in late springUses the Learning Connection website
to provide educators and schools with a secure access to individual students growth data
Question 1
In a student’s peer group, what are their peers scores compared to their own?
a. Higherb. Lowerc. The Same
Question 2What state is Indiana’s model based on?
a. Illinoisb. Californiac. Texasd. Colorado
Question 3
LGM’s goal is to focus on ______________ from all students not just those close to passing
a. Outputs of education and expect progressb. Outputs of educationc. Progress
Question 4When was the LGM’s model launched?
a. Feb. 1st
b. Feb. 10th
c. Mar. 1st
d. Jan. 23rd
Question 5 Who has access to the students’ scores from year to year?
a. Teachersb. Parents, Teachers and Administratorsc. Administratorsd. Government officials
Question 6How many phases are there in the process of releasing the data to the schools and public?
a. 3b. 4c. 5d. 2
What does the Learning Growth Model Do?
Laura Francis
What does the Learning Growth Model do?
✾It is a statistical model to calculate each student’s progress on state assessments from year to year.
✾The Learning Growth Model answers more than whether a student passes or fails

Question 1
In what grade is the Learning Growth Model implemented?
A. 5th Grade B. KindergartenC. 1st Grade D. 3rd Grade
What does the Learning Growth Model do? What is the peer group?
All the students with the same exact scores on one section of the ISTEP in the third grade become a peer group.
Each peer group may be made up of several students.
Through the Learning Growth Model the students in each peer group are compared with each other throughout state assessments.
Question 2 This model answers more than if a
student passes or fails.
True or False
What does the LGM compare? Can only students be compared through the
Learning Growth Model? No, in fact the Learning Growth Model can
compare schools’ and districts’ growth as well. The Learning Growth Model can highlight
teachers’ abilities. Since most state assessments can only
determine whether a student passes or fail, it is usually assumed that the teacher did not fulfill his/her duty if one of their students fails.
Question 3Only students’ growth is compared in
the Learning Growth Model.
True or False

How the Learning Growth Model works…
Emily Spencer

Learning Growth Model GraphThree Categories
HighTypical Low
If school is continuing in high percentile there is no improvement.
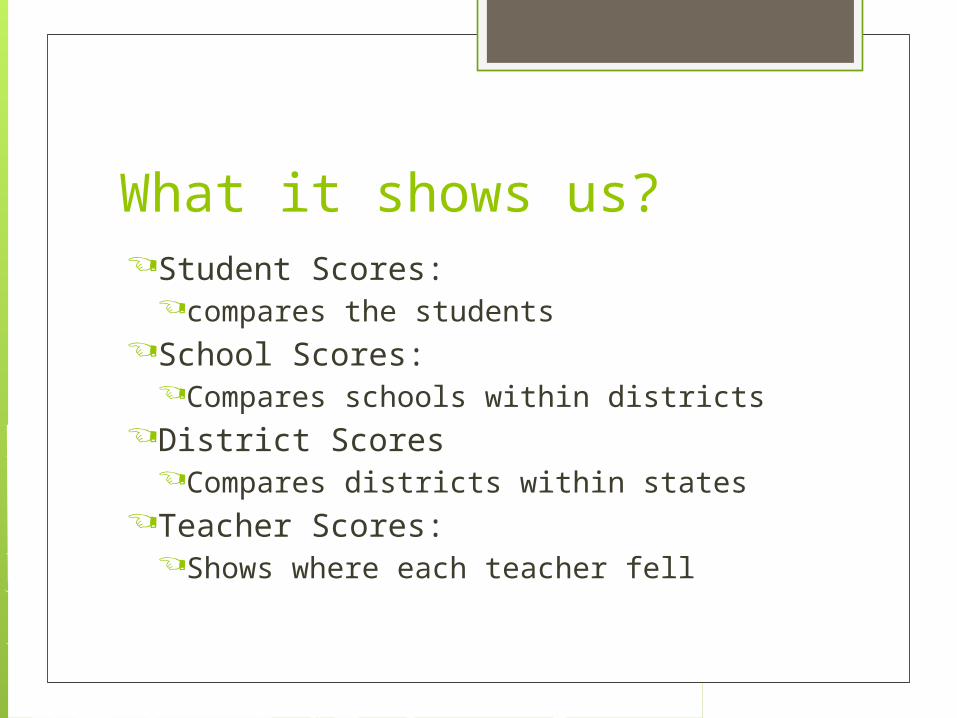
What it shows us? Student Scores:
compares the studentsSchool Scores:
Compares schools within districtsDistrict Scores
Compares districts within statesTeacher Scores:
Shows where each teacher fell
What it shows us? Mathematics
Language Arts
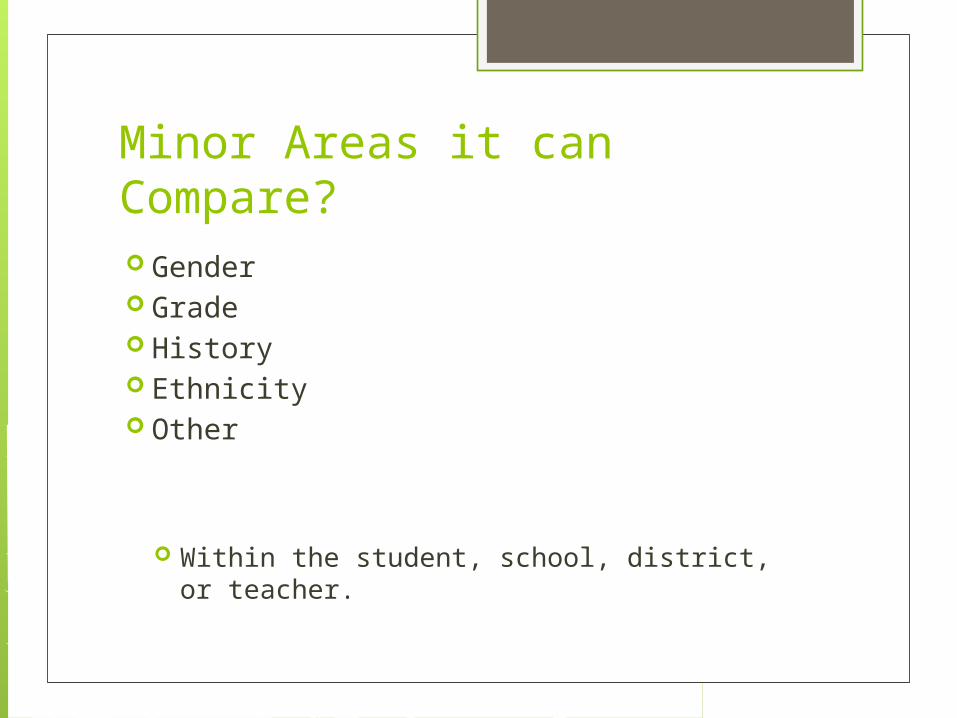
Minor Areas it can Compare? Gender Grade History Ethnicity Other
Within the student, school, district, or teacher.
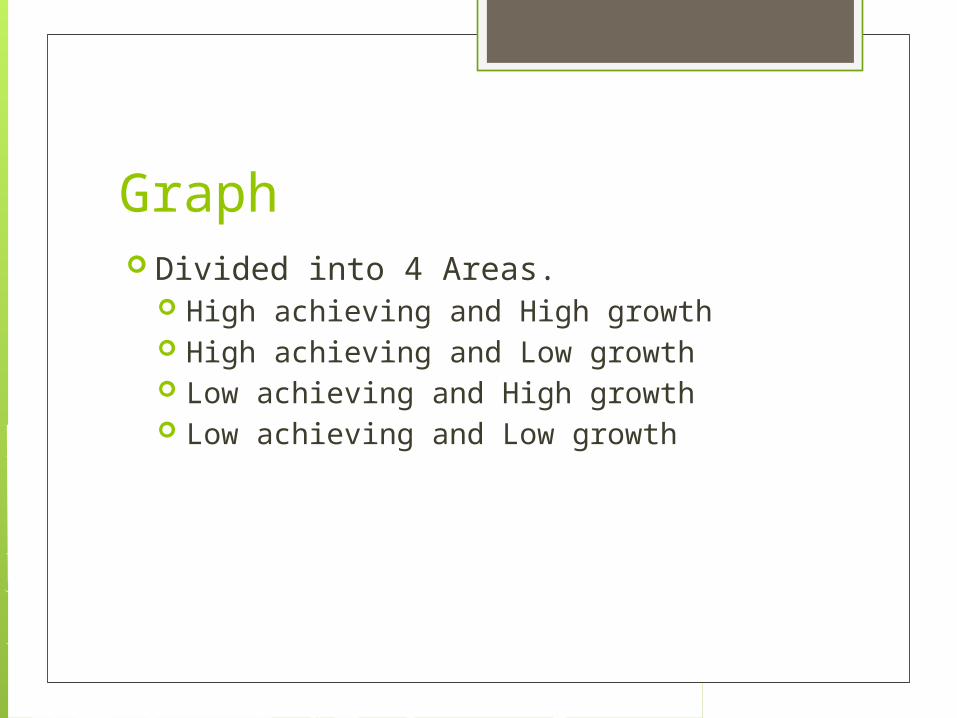
Graph Divided into 4 Areas.
High achieving and High growth High achieving and Low growth Low achieving and High growth Low achieving and Low growth
Schools Northern Indiana
East Allen County Schools Central Indiana
Delaware Community Schools Central Indiana
Carmel Clay Schools Southern Indiana
Mitchell Community Schools
Learning Growth Websitehttps://learningconnection.doe.in.gov/GrowthModel/Search.aspx
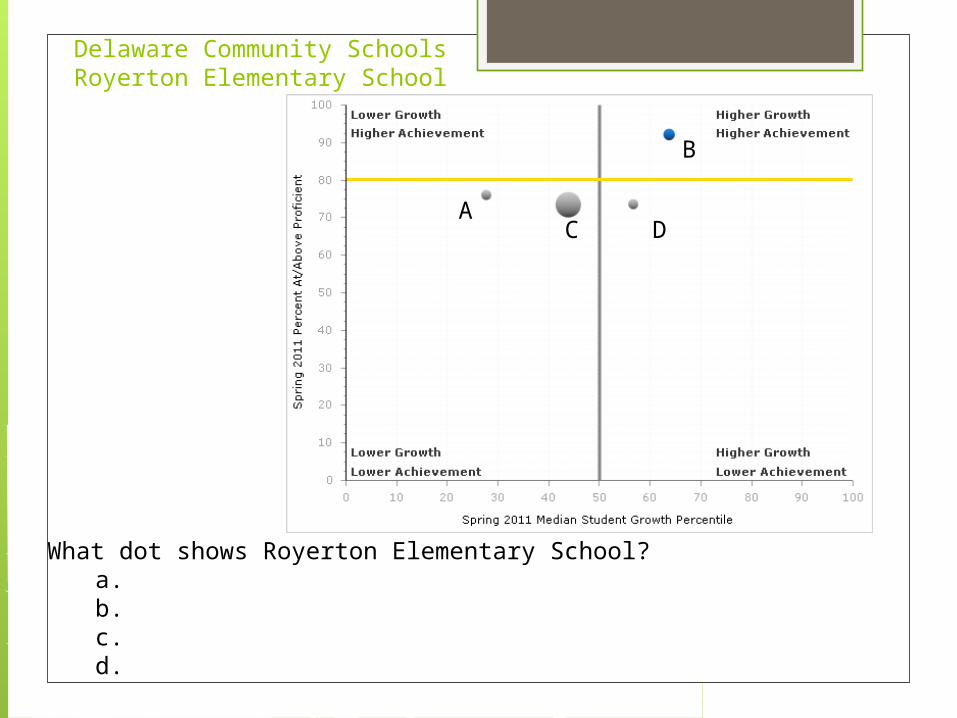
Delaware Community Schools Royerton Elementary School
What dot shows Royerton Elementary School? a. b. c.d.
A
B
C D
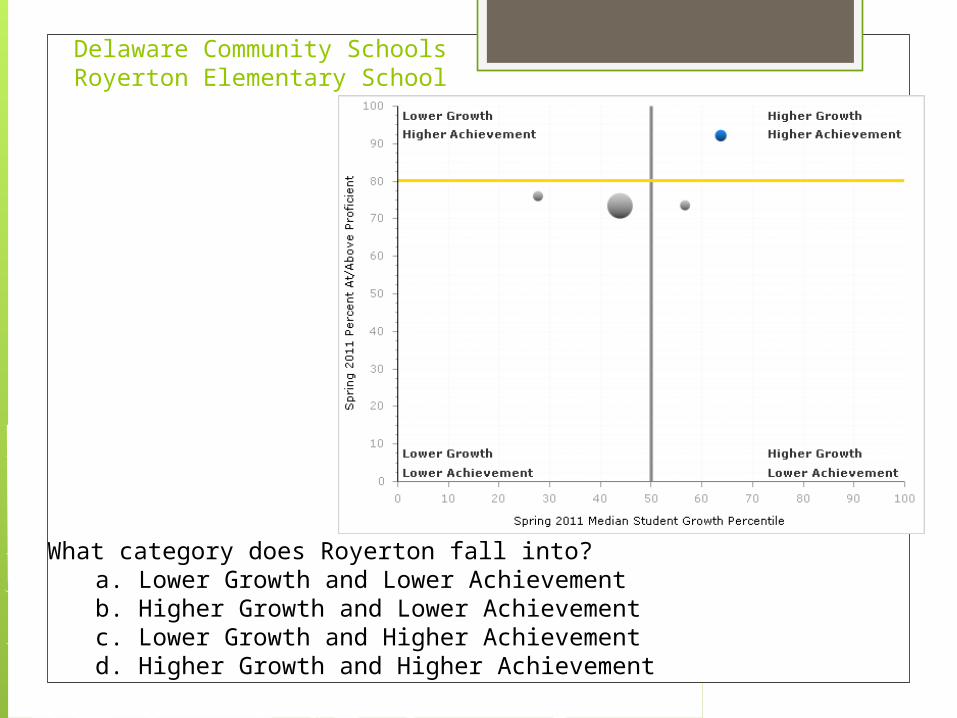
Delaware Community Schools Royerton Elementary School
What category does Royerton fall into? a. Lower Growth and Lower Achievement b. Higher Growth and Lower Achievementc. Lower Growth and Higher Achievement d. Higher Growth and Higher Achievement
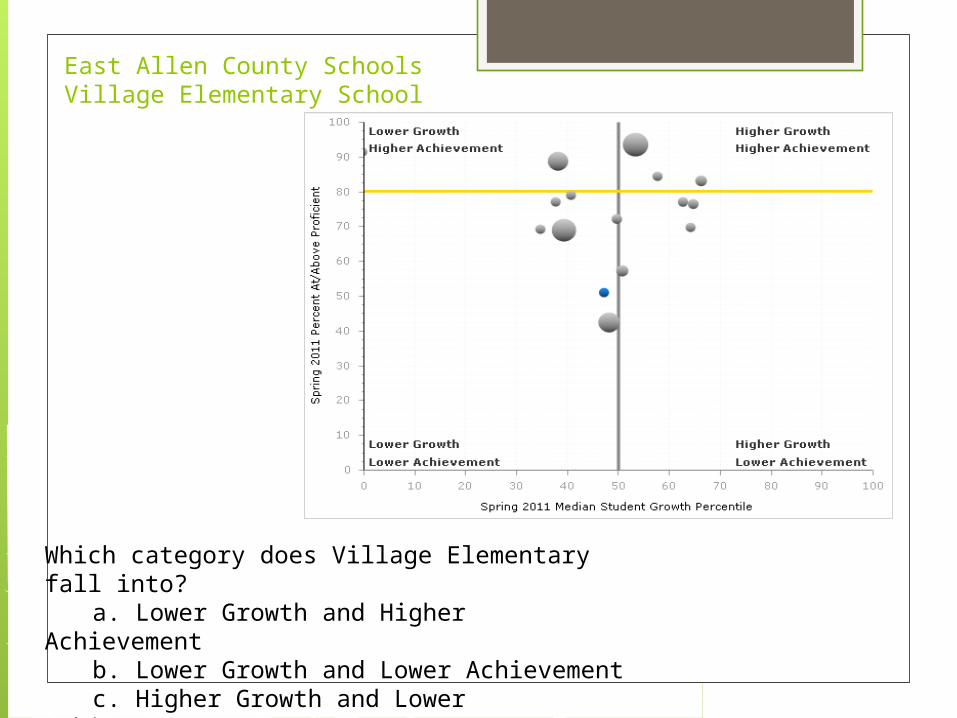
East Allen County SchoolsVillage Elementary School
Which category does Village Elementary fall into?
a. Lower Growth and Higher Achievement
b. Lower Growth and Lower Achievement
c. Higher Growth and Lower Achievement
d. Higher Growth and Higher Achievement
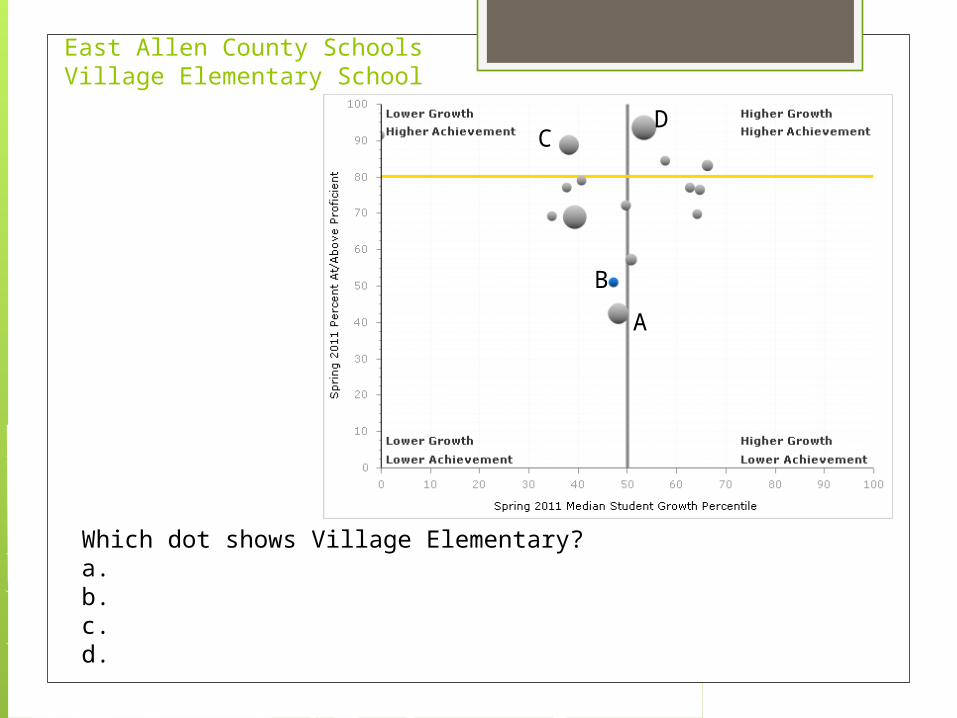
East Allen County SchoolsVillage Elementary School
Which dot shows Village Elementary?a.b.c.d.
A
B
CD
Graphic from:Learning Growth Model Website:https://learningconnection.doe.in.gov/GrowthModel/Search.aspx