learning from the experience of accountable care
TRANSCRIPT

Rapid Synthesis
Learning from the Experience of Accountable Care Organizations in the U.S.
18 July 2019


Rapid-Improvement Support and Exchange
1
Rapid Synthesis: Learning from the Experience of Accountable Care Organizations in the U.S.
30-day response
18 July 2019

Learning from the experience of accountable care organizations in the U.S.
2 Evidence >> Insight >> Action
Rapid-Improvement Support and Exchange RISE’s mission is to contribute to the Ontario Ministry of Health’s ‘one window’ of implementation supports for Ontario Health Teams by providing timely and responsive access to Ontario-based ‘rapid-learning and improvement’ assets.
Authors
Kerry Waddell, MSc, Focal point, Rapid-Improvement Support and Exchange (RISE); and Lead, Evidence Synthesis, McMaster Health Forum Michael G. Wilson, PhD, Assistant Director, McMaster Health Forum, and Assistant Professor, McMaster University Cara Evans, PhD student, Health Policy PhD Program, McMaster University John N. Lavis, MD PhD, Co-lead, Rapid-Improvement Support and Exchange (RISE); Director, McMaster Health Forum; and Professor, McMaster University
Timeline Rapid syntheses can be requested in a three-, 10-, 30-, 60- or 90-business day timeframe. This synthesis was prepared over a 30-business-day timeframe. An overview of what can be provided and what cannot be provided in each of the different timelines is provided on McMaster Health Forum’s Rapid Response program webpage (www.mcmasterforum.org/find-evidence/rapid-response).
Funding
RISE is supported by a grant from the Ontario Ministry of Health to the McMaster Health Forum. The opinions, results, and conclusions are those of RISE and are independent of the Ministry. No endorsement by the Ministry is intended or should be inferred.
Conflict of interest The authors declare that they have no professional or commercial interests relevant to the rapid synthesis. The funder played no role in the identification, selection, assessment, synthesis or presentation of the research evidence profiled in the rapid synthesis.
Merit review
The rapid synthesis was reviewed by a small number of policymakers, stakeholders and researchers in order to ensure its scientific rigour and system relevance.
Acknowledgements
The authors wish to thank Sonya Streeter and Greg Kennedy for their insightful comments and suggestions.
Citation
Waddell K, Wilson MG, Evans C, Lavis JN. Rapid synthesis: Learning from the experiences of accountable care organizations in the U.S. Hamilton: McMaster Health Forum, 18 July 2019.
Product registration numbers ISSN 2292-7999 (online)

McMaster Health Forum
3 Evidence >> Insight >> Action
KEY MESSAGES
Questions • What are accountable care organizations (ACOs) and how have they evolved in the U.S.?• How do general features of public ACOs differ from the proposed design for Ontario Health Teams?• What effects have been achieved through ACOs and what can we learn from their implementation in the
U.S.?• What types of technical support has been provided to ACOs and what can we learn from its
implementation?
Why the issue is important • In February 2019, the Government of Ontario revealed its plans to reform the Ontario health system,
including the creation of a ‘super agency’ (Ontario Health) and a plan to create Ontario Health Teams(OHTs) that will deliver the full continuum of care to a defined patient population.
• The description of the OHTs at maturity closely resembles that of accountable care organizations in theU.S., which were formally implemented as part of the changes to the U.S. Patient Protection andAffordable Care Act, with the goals of linking payment for healthcare to quality outcomes, encouragingintegrated health systems, reducing the cost of care and administration, and understanding and addressinghealth disparities.
• Given these similarities between OHTs at maturity and ACOs in the U.S., we examined the design,evolution and effects of U.S. ACOs to identify lessons that can be learned for OHTs.
What we found • We identified four significant features that evolved between the Pioneer and Next Generation models
(question 1), including: 1) increasing the use of payment models with downside risk; 2) changingapproaches to benchmarking and remuneration; 3) enhancing benefits; and 4) focusing on fewer andgreater alignment of quality measures.
• We identified a number of similarities between ACOs and the proposed OHTs (question 2), including: adefined patient populations for which ACOs are responsible for providing integrated care to a definedpopulation; collaborative governance; value-based incentives to encourage high-quality care and excellentpatient outcomes; involvement of patients and providers in ACO governance; and operating under asingle clinical and fiscal accountability framework.
• Effects of ACOs were compared against the quadruple aim and include the following four key findings: 1)quality indicators may improve after ACO implementation, but changes are often small and metrics suchas hospital readmissions or care for specific disorders may not be affected; 2) results for improving healthwere mixed with some evaluations of ACOs finding improvements in the health of patients receiving carefrom them and other evaluations finding no improvements or poorer population health outcomes; 3)ACOs may help to reduce costs without reducing quality, and the cost reductions may be largelyattributable to savings in outpatient expenses among the most medically complex patients, and toreductions in the use of low-value services; 4) little evidence was found on the effects of ACOs onprovider experiences, with two studies finding that improved collaboration as part of ACOs may help toincrease providers’ available time, however another suggested that primary-care providers find that qualitytargets associated with ACOs hinder their focus on patient needs.
• Four key observations about technical supports are work noting, including: 1) technical assistance toACOs was highly segmented; 2) timing of technical support, particularly in the beginning of thedevelopment process, is critical in supporting ACOs to think through the significant changes that will berequired to organize themselves accordingly; 3) modalities for technical support have generally includedlearning collaboratives, one-on-one coaching, cross-ACO working sessions, an annual conference, and adashboard; 4) technical support to date has largely focused on sharing tacit and experiential knowledgewith relatively few supports giving explicit attention to research evidence.

Learning from the experience of accountable care organizations in the U.S.
4 Evidence >> Insight >> Action
QUESTIONS • What are ACOs and how have they evolved in the
U.S.?• How do the general features of public ACOs differ
from the proposed design for Ontario HealthTeams?
• What effects have been achieved through ACOs andwhat can we learn from their implementation in theU.S.?
• What types of technical assistance has been providedto ACOs and what can we learn from itsimplementation?
WHY THE ISSUE IS IMPORTANT
In February 2019, the Government of Ontario revealed its plans to reform the Ontario health system. The plans include the amalgamation of the province’s six provincial agencies (i.e., Cancer Care Ontario, Health Quality Ontario, eHealth Ontario, Trillium Gift of Life Network, Health Shared Services Ontario and HealthForceOntario Marketing and Recruitment Agency) and its 14 Local Health Integration Networks into one central agency responsible for planning, delivering and improving the quality of care in Ontario.(1) In addition, the province announced its intention to support the development of a number of Ontario Health Teams (OHTs), which would have providers and organizations work together in networks to deliver the full continuum of care to a defined patient population.
A guidance document and readiness assessment released in April 2019, by the Ontario Ministry of Health identified 8 requirements that groups of providers and organizations wishing to become an OHT candidate much demonstrate. Since the release of the guidance document, these 8 requirements have been repositioned as 8 building blocks that will be critical to the development of OHTs.(2) Each building block is accompanied by a brief description of the expectation of OHTs after the first year and at maturity (for the full description of building blocks and their associated 58 domains see RISE brief 1: OHT building blocks). These eight building blocks include: 1) defined patient population;2) in-scope services3) patient partnership and community engagement;4) patient care and experience;5) digital health;6) leadership, accountability and governance;7) funding and incentive structure; and8) performance measurement, quality improvement, and continuous learning.
Box 1: Background to the rapid synthesis
This rapid synthesis mobilizes both global and local research evidence about a question submitted to the McMaster Health Forum’s Rapid Response program. Whenever possible, the rapid synthesis summarizes research evidence drawn from systematic reviews of the research literature and occasionally from single research studies. A systematic review is a summary of studies addressing a clearly formulated question that uses systematic and explicit methods to identify, select and appraise research studies, and to synthesize data from the included studies. The rapid synthesis does not contain recommendations, which would have required the authors to make judgments based on their personal values and preferences.
Rapid syntheses can be requested in a three-, 10-, 30-, 60- or 90-business-day timeframe. An overview of what can be provided and what cannot be provided in each of these timelines is provided on the McMaster Health Forum’s Rapid Response program webpage (www.mcmasterforum.org/find-evidence/rapid-response)
This rapid synthesis was prepared over a 30-business day timeframe and involved five steps: 1) submission of a question from a policymaker
or stakeholder (in this case, the Governmentof Ontario);
2) identifying, selecting, appraising andsynthesizing relevant research evidence aboutthe question;
3) conducting key informant interviews4) drafting the rapid synthesis in such a way as to
present concisely and in accessible languagethe research evidence; and
5) finalizing the rapid synthesis based on theinput of at least two merit reviewers.

McMaster Health Forum
5 Evidence >> Insight >> Action
Based on these building blocks, OHTs at maturity will share many features with what are called ‘accountable-care organizations’ (ACOs) in the U.S. (further described in the section below), including: • an overall aim of improving integration and meeting the
quadruple aim of improving patient experience, population health and provider experiences while reducing per capita costs;
• development of networks of providers or organizations who are accountable for the delivery of care to a defined patient population; and
• benchmarking the quality of care according to a set of key indicators.(3)
As OHTs develop, they can build on what has gone well with ACOs and improve on what has gone less well. For example, ACOs’ effects on the quadruple aim can give insights into where OHTs may need to pay particular attention in order to achieve desired effectives. Given the learning potential, we sought to examine the design, development, evolution and effects of U.S. accountable care organizations. To do so, we have updated a rapid synthesis conducted in 2016 that examined the key characteristics of ACOs,(4; 5) their impact on the triple aim outcomes, and how these impacts have been achieved. In this updated synthesis we examine how OHTs can learn from: 1) ACOs evolution over time; 2) ACOs similarities to and differences from what OHTs
are anticipated to look like at maturity; 3) ACOs effects on the quadruple aim; and 4) ACOs technical supports at maturity compared to
OHTs’ supports at launch.
WHAT WE FOUND Question 1: What are ACOs and how have they evolved in the U.S.? Accountable care organizations emerged from the model used for commercial health-maintenance organizations in the U.S., but their growth accelerated rapidly with the introduction of the Patient Protection and Affordable Care Act, 2010 (which is often shorted to the Affordable Care Act and nicknamed ‘Obamacare’).(4) While the change was initially pursued by the private sector, it has been an important innovation in the publicly-financed part of the health system in the U.S. as a means of meeting the Triple (now Quadruple) Aim of improving patient experiences and health outcomes while reducing per capita costs, and achieving positive provider experience.(4) An ACO is a sponsored a mix of providers and organizations who work together to deliver care through their network to a defined population group. ACOs vary significantly in their structure and leadership and may be physician (or practice)-led, hospital-led, have joint leadership, or be established as an integrated delivery system (e.g., a parent or overarching governance structure).(6) ACOs also differ in the extent to which they have relationships with hospitals and with different specialties. These connections dictate the scope of services that an ACO can provide within their network and those that must be sought through other providers.(6-8) As mentioned above, both private (also called commercial) and public ACOs are in place in
Box 2: Identification, selection and synthesis of research evidence We identified research evidence (systematic reviews and primary studies) by searching (in June 2019) Health Systems Evidence (www.healthsystemsevidence.org) and PubMed. In both databases we used the following combination of search terms: accountable care organization OR accountable care organisation OR accountable-care organization. The searches included literature since our last search was conducted in June 2017 as part of the previous rapid synthesis. The results from the searches were assessed by one reviewer for inclusion. A document was included if it fit within the scope of the questions posed for the rapid synthesis. For each systematic review we included in the synthesis, we documented the focus of the review, key findings, last year the literature was searched (as an indicator of how recently it was conducted), methodological quality using the AMSTAR quality appraisal tool (see the Appendix for more detail), and the proportion of the included studies that were conducted in Canada. For primary research (if included), we documented the focus of the study, methods used, a description of the sample, the jurisdiction(s) studied, key features of the intervention, and key findings. We then used this extracted information to develop a synthesis of the key findings from the included reviews and primary studies.

Learning from the experience of accountable care organizations in the U.S.
6 Evidence >> Insight >> Action
the U.S. Commercial ACOs are frequently run by private insurance companies, whereas public ACOs have been largely stewarded by the Centre for Medicare and Medicaid. Beneficiaries are attributed to public ACOs based on being a Medicare beneficiary that also meets an agreed-upon definition, typically reliant on seeking a certain amount of care from providers included in the ACO.(3) However, providers attached to the ACO may also be delivering care to non-ACO beneficiaries. ACOs are reimbursed using shared-savings arrangements which are outlined in a shared-savings contract between the payer (in the public system this is Medicare or Medicaid, and in the commercial, a private insurer) and the ACO. The shared savings contract defines the terms of the arrangement including a common understanding of the baseline cost of care from which improvements are benchmarked, as well as the extent of risk taken on by the ACO.(3) Providers attached to the ACO have been traditionally reimbursed for their services using traditional fee-for-service payments, although this is increasingly shifting towards a capitated model.(9) At the end of a given year, the total cost of care for the ACOs aligned beneficiaries is calculated and compared to the baseline cost. A percentage of the difference between the two is then paid out from the insurer to the ACO (or vice versa) based on an agreement in the shared savings contract. There are currently more than 900 ACOs in the U.S. As of 2017, the annual survey on ACOs revealed that these cover 32.4 million people. Of these, 19.1 million in commercial ACOs, 9.4 million in ACOs supported by Medicare, and 3.9 million in ACOs supported by Medicaid.(10) For the purpose of this rapid synthesis (i.e., learning from the experience of ACOs to inform the development of OHTs), we have chosen to focus on the evolution of public ACOs. In particular, we focus on Medicare ACOs as they are more easily compared than either commercial or Medicaid ACOs, which vary considerably in their design based on state legislation and regulations. ACOs supported by Medicare (which funds care for people who are 65 and older, certain younger people with disabilities, and people with end-stage renal disease) have evolved since their initial emergence in the Medicare Shared Savings Program in 2010. In addition to the permanent program that encourages the formation of ACOs (the Medicare Shared Savings Program), three time-limited Medicare ACO programs have been supported: • Pioneer ACOs, which operated from 2012 to 2016, with an option to extend to 2018; • Advance Payment ACOs, which operated from 2012 to 2015 and were designed specifically to address
challenges in rural and northern areas; and • Next Generation ACOs, which began in 2016 and are ongoing. Details about the features of each of these ACOs is included in Table 1.
Table 1. Features of each of the Medicare ACOs in the U.S
ACO model Distinctive features Medicare Shared Savings Program (permanent program)
• Accept risk for a minimum of 5,000 beneficiaries (3) • Providers are paid through a traditional fee-for-service model for a minimum of three
years (3) • Two risk options: 1) one-sided option for less experienced ACOs who will share in
savings but not in the losses; and 2) two-sided model whereby ACOs participate in both the savings and losses following participation in risk option 1.(3)
• Prospective alignment of beneficiaries, with a final assignment list determined at the end of the year (3)
• Alignment of beneficiaries is based on use of allowed charges associated with a primary-care physician and then charges associated with a specialist who provides care in the place of a primary-care physician for at least 12 months (3)
Pioneer ACO (2012 to 2016 with option to extend to 2018)
• Minimum of 15,000 beneficiaries (8; 9)

McMaster Health Forum
7 Evidence >> Insight >> Action
• Less initial risk with no obligation to pay CMS for any losses during first two-year period, following by ACOs having the option of five shared plans of savings and losses up to 60-75% (8; 9)
• ACO savings must exceed the minimum savings rate to share in savings or the minimum loss rate to be accountable (8)
• Benchmarks are calculated on a three-year historic baseline trend (9) • Medicare-enrolled providers and suppliers • Beneficiaries are prospectively aligned through claims, with voluntary alignment in year
four (9) • Process of aligning beneficiaries is similar to MSSP (8) • Claims are largely paid through fee-for-service, however if savings are achieved after
the first two performance periods (and the ACO remains in the pilot) they will be transitioned to a population-based payment (8; 9)
• Benefit enhancement of waiver of the skilled nursing facility three-day stay rule (8) Advance payment ACO (2012-2015)
• Must have at least 5,000 beneficiaries • Must be an ACO without any inpatient facility and have less than $50 million in total
annual revenue, or have an inpatient facility that are critical-access hospitals or low-volume rural hospitals and have less than $80 million in total annual revenue
• Receive three types of upfront payments: 1) an upfront fixed payment; 2) an upfront, variable payment; and 3) monthly payment of varying amount depending on the size of the ACO
• CMS will recoup advance payments through offset of an ACOs earned shared savings Next generation ACO (2016 – ongoing)
• Offers two risk options: 1) shared savings and losses of up to 80% or 2) shared savings and losses of up to 100% (9)
• Four payment mechanisms: 1) normal fee-for-service claims; 2) normal fee-for-service plus additional population-based payment mechanism infrastructure payment; 3) population-based payment; and 4) capitation (9)
• Benchmarks are calculated using a one-year historic baseline but includes a discount that incorporates quality and efficiency adjustments and rewards both attainment and improvement (rather than quality changing the share of savings/losses received) (9)
• Beneficiaries are aligned prospectively through claims with voluntary alignment in year 2
• Introduction of preferred providers who are able to operate across multiple Medicare ACOs and allow the ACO to extend the network by supplementing and complementing the types of care that can be provided (9)
• Benefit enhancements: waiver for skilled-nursing facilities three-day rule (requirement that Medicare beneficiaries be admitted as an inpatient for at three consecutive days to qualify for coverage of a stay in in skill nursing facility); telehealth expansion; and post-discharge home visits (9)
• Next Generation ACOs must already meet 50% primary care EHR criteria to qualify Throughout the development and implementation of each of these programs of ACOs, changes in ACO design features took shape in four area, including: 1) increased use of payment models with downside risk; 2) changes to benchmarking and remuneration; 3) enhancements to benefits; and 4) focusing on fewer, and greater alignment of quality measures. These are each summarized in the narrative below. First, despite designing Pioneer ACOs to move towards a two-way model of risk, relatively few ACOs actually ended up making this change.(8) In the second round of models, the Next Generation model offers two (instead of five) risk arrangements whereby ACOs either take on shared savings and losses of up to 80% or shared savings and losses up to 100%. Further, Next Generation ACOs are responsible for first-dollar shared savings for spending below the benchmark and are accountable for first-dollar shared losses for spending above the benchmark. This is a movement away from the model two-way model of risk proposed as part of the Pioneer ACOs where savings had to exceed a minimum savings or minimum loss rate.(9)

Learning from the experience of accountable care organizations in the U.S.
8 Evidence >> Insight >> Action
The second change is a shift in how the benchmark (basis for calculating gains or losses) is developed and how providers are remunerated. With regards to the benchmark, the biggest change is a shift from a retrospective calculation (e.g., the benchmark was finalized at the end of the performance year) to a prospective calculation.(9) Further, the benchmark is now calculated using a one-year historic baseline, rather than the three-year historic baseline used in the Pioneer model. Moreover, the benchmark now also includes a discount that incorporates quality and efficiency adjustments as well as rewards to allow ACOs to benefit as they progress.(9) These changes are designed to encourage ACOs to make incremental adjustments throughout the year to try meet the financial benchmark, rather than waiting until the end of the year to assess performance.(8) Select states have added additional incentives, such as in Vermont where contracted ACOs are required to distribute quality incentives to network providers based on performance to ensure that the payments do not remain at the executive or administrative levels.(11) There have also been significant changes made to the way in which providers are remunerated. While the Pioneer model paid the majority of claims through fee-for-service (FFS), Next Generation ACOs offer four payment mechanisms, including: 1) normal FFS claims; 2) normal FFS plus an infrastructure payment that is recouped against shared savings or in addition to losses; 3) population-based payments (which were also available through Pioneer); and 4) capitation.(9) Third, in addition to the benefit enhancement of waiving the three-day stay rule for skilled-nursing facilities, Next Generation ACOs have added benefits including telehealth expansion and post-discharge home visits.(9) Finally, as public ACOs have evolved there has been an increased focus on using fewer quality metrics that better align with system priorities. Table 2 provides an overview of how the quality indicators have changed since 2012 according to the four categories of indicators (i.e., patient/caregiver experience; care coordination/patient safety; preventative health; and at-risk populations). However, the two most dramatic changes are a reduction in the number of indicators under the care coordination and patient safety category and at-risk populations category. There has also been an expansion in the number of measurements of caregiver and patient experience (particularly the addition of patient assessments of care coordination as an outcome rather than system indicator). Table 2. Evolution of quality-performance standards
Quality indicators 2012 2013 2014 2015 2016 2017 2018 2019 Patient/caregiver experience • Getting timely care, appointments, and
information
• How well your providers communicate • Patient rating of provider • Access to specialist • Health promotion and education • Shared decision making • Health status and functional status • Stewardship of patient resources • Courteous and helpful office staff • Care coordination Care coordination/patient safety • Risk-standardized, all condition readmission • Skilled Nursing Facility 30-day all-cause
readmission
• All-cause unplanned admissions for patients with multiple chronic conditions

McMaster Health Forum
9 Evidence >> Insight >> Action
Quality indicators 2012 2013 2014 2015 2016 2017 2018 2019 • All-cause unplanned admissions for patients with
diabetes
• All-cause unplanned admissions for patients with heart failure
• Ambulatory sensitive condition acute composite • Ambulatory sensitive condition COPD or asthma
in older adults
• Ambulatory sensitive conditions admissions – heart failure
• Percent of primary care physicians who meet meaningful use requirement
• Percent of primary care physicians who successfully qualify for an EHR program incentive
• Use of certified EHR technology • Documentation of current medications in the
medical record
• Medication reconciliation • Screening for future fall risk • Use of imaging studies for low-back pain Preventative health • Influenza immunization • Pneumonia vaccination status for older adults • Tobacco use – screening and cessation
intervention
• Body mass index screening and follow-up • Screening for high-blood pressure and follow-up • Screening for clinical depression and follow-up • Colorectal cancer screening • Breast cancer screening • Statin therapy for prevention and treatment of
cardiovascular disease
At-risk populations • Depression remission at 12 months • Diabetes – hemoglobin A1c poor control • Diabetes – eye exam • Diabetes composite • Hypertension - controlling high blood pressure • Ischemic vascular disease – lipid panel and LDL
control
• Ischemic vascular disease – use of aspirin or another antithrombotic
• Heart failure – beta-blocker therapy for left ventricular systolic dysfunction
• Coronary artery disease - composite • Coronary – angiotensin-converting enzyme
inhibitor
• Coronary artery – lipid control

Learning from the experience of accountable care organizations in the U.S.
10 Evidence >> Insight >> Action
In addition to the four areas of evolution described above, evaluations of Pioneer ACOs reveal a number of trends that could be important to consider in planning for the OHTs. The key trends have been summarized according to each of the 8 building blocks. Table 3. Trends in the evolution of Pioneer ACOs (8)
OHT building blocs
Evolution of Pioneer ACOs
Defined patient population (who is covered and what does ‘covered’ mean?)
• Approximately two-thirds of beneficiaries were located in large urban areas, with about half aligned to 11 ACOs in California and Massachusetts
• Between 2012 and 2014 the mean number of aligned beneficiaries increased from 25,620 to 35,494 associated with each ACO, with eight ACOs moving between year one and year four to having over 100,000 beneficiaries
• Significant turnover was observed among beneficiaries, with only 33% aligned for all three years (however, this may be the result of either provider turnover or may be an initiative by the beneficiary through changes in patterns of provider use)
In-scope services (what is covered?)
• Generally speaking, larger ACOs were better able to cover the continuum of care, however the expansion of behavioural health services (referred to as mental health and addictions services in Ontario) was noted as service that required greater focus from ACOs
Patient partnership and community engaged (how are patients engaged?)
• While no trends were observed across the three years, common methods of engaging patients included the using of care managers, engaging with community-based organizations and providers; preparing educational materials; and improving access to primary care
Patient care and experience (how are patient experiences and outcomes measured and supported?)
• Pioneer ACOs report using a number of different methods to coordinate care (e.g., embedding care managers in practice), while others had a centralized approach for outreach when coupled with home visits or care management conferences with multi-disciplinary teams for high-risk patients, however no trends were observed in adopting one method for coordination over another throughout the performance period
Digital health (how are data and digital solutions harnessed?)
• While ACOs were chosen in part based on their advanced IT systems, ACOs continued to augment their operations and analytic capacity throughout the three performance years including the integration of claims and clinical data to quickly determine where improvements should be made.
Leadership, accountability and governance (how are governance and delivery arrangements aligned and how are provider’s engaged?)
• Integrated Delivery Systems were the most commonly represented among Pioneer ACOs, accounting for 15 of 32 of the original cohort, while other leadership structures included partnerships between hospitals and medical practices,(6) networks of individual practices,(4) and independent practice associations.(4)
• While Integrated Delivery Systems provided more established infrastructure and a greater level of resources, the incentives between hospitals and ACOs were contradictory in many cases (i.e., wanting to increase the number of procedures for hospitals compared to reducing costs in ACOs)
• 10 ACOs in the original cohort had no in-network connection with a hospital, leaving them potentially vulnerable to hospital spending for aligned beneficiaries that is out of their control.
• The median number of providers associated with ACOs increased by 25% over the four-year performance period from 492 in 2012 to 613 in 2014, however there was significant turnover with only 46% of providers remaining in the same ACO for all three performance years (2012-2014)
Funding and incentive structure (how are financial arrangements aligned?)
• Pioneer ACOs generally opted for arrangements with less risk, with a significant number of ACOs either exiting the program before switching to downside risk (after performance year two) or opting in year 3 for the payment arrangements with the least down-side risk.
• Leadership of ACOs reported hesitance to begin population-based payments following year two, given the changes to contractual arrangements with providers that it would require.

McMaster Health Forum
11 Evidence >> Insight >> Action
Performance measurement, quality improvement, and continuous learning (how is rapid learning and improvement supported?)
• Summarized in the section above and in Table 2
Question 2: How do ACOs differ from the proposed design for OHTs? ACOs have four features that they will share with OHTs at maturity, including: • voluntary participation; • goal of achieving the quadruple aim of improving care experiences and health outcomes at manageable per
capita costs, and with positive provider experiences; • focus on delivering integrated care to a defined population; and • operating under a single clinical and fiscal accountability framework. They will also share many, but not all features related to the eight OHT building blocks (see table 4) While table 4 considers the general features of ACOs, it is important to note that there is significant variation in the attributes across these ACOs, even within the same model (e.g., Medicare Shared Savings Program and Pioneer models). Therefore, the list aligned to each of the eight building blocks is far from comprehensive, but rather represents distinguishing features of the public-sector ACOs more broadly. Table 4. Features of Medicare ACOs in the U.S. mapped on to the OHT building blocks
OHT readiness criteria
Key features of the current Ontario health system (pre-OHT implementation)
Key features of OHTs at maturity
Examples of key features of ACOs
Defined patient population (who is covered and what does ‘covered’ mean?)
• No defined patient population
• OHTs will be responsible for the health outcomes and other quadruple-aim metrics of a population within. Geographic area that is defined based on local factors and how patients typically access care (with no targets set for population size)(2)
• Responsible for meeting the care needs of individuals who meet Medicare requirements for beneficiary alignment:
• Numbers of aligned Medicare beneficiaries include:
o 17.2% less than 10,000 o 57.2% between 10,000 and
50,000 o 14.9% between 50,001 and
100,000 o 10.7% greater than 100,000
(12) In-scope services (what is covered?)
• Medically necessary hospital-based and physician-provided care
• OHTs will provide a full and coordinated continuum of care for all but the most highly specialized conditions (2)
• Large ACOs (commercial, Medicare or Medicaid) offer on average 11 of a possible 15 service types, while smaller (usually physician-led ACOs) offer an average of five of 15 service types (12)
• The five most common in-scope services are: primary care (94%); labs and imaging (77%); specialty care (74%);

Learning from the experience of accountable care organizations in the U.S.
12 Evidence >> Insight >> Action
OHT readiness criteria
Key features of the current Ontario health system (pre-OHT implementation)
Key features of OHTs at maturity
Examples of key features of ACOs
inpatient care (71%); and emergency department (62%)1 (12)
Patient partnership and community engaged (how are patients engaged?)
• Formally recognized voice in their own care (and in research) through informed consent requirement and in some aspects of care provision (e.g., complaints) but it is rarely systematically or transparently elicited
• Ad hoc involvement in shared decision-making
• Select citizens play a formal governance role on government boards, government committees, and governing boards of professional regulatory bodies, hospitals, community governed primary- and community-care models (e.g., community health centres), and other organizations
• OHTs will uphold the principles of patient partnership, community engagement, and system co-design, which include appointing patients, families and caregivers to boards and leadership positions (2)
• Medicare and Medicaid ACOs must involve patients in governance (8)
Patient care and experience (how are patient experiences and outcomes measured and supported?)
• Ad hoc patient experience surveys are conducted by international organizations such as the Commonwealth Fund, arms-length government agencies such as Health Quality Ontario, and care organizations such as hospitals and community-based providers
• OHTs will provide high-quality integrated care, including 24/7 coordination and system navigation services (2)
• 95% of all Medicare ACOs. employ a care coordinator to fill a range of roles from follow-up after discharge from hospital or other facilities to health education phone calls (8; 12)
Digital health (how are data and digital solutions harnessed?)
• Ontario Telemedicine Network helps to address the difficulties faced by hard-to serve residents across large rural and northern geographic areas, however only 24% of Ontario physicians indicate having used this technology in their practice
• Some examples of patient portals are in place that allow patients to access and
• OHTs will use digital-health solutions (e.g., patient portal, electronic health record, and e-consultations for patients among providers) to support effective healthcare delivery, ongoing quality and performance improvement, and better patient experience (2)
• Widespread adoption of EMRs, however connectivity between them remains an issue (8)
• Requirement to join Pioneer or Next Generation ACOs that at least 50% of primary care providers included in the ACO to have electronic health records (EHRs) (i.e., interoperable between providers and sites)
1 Fifteen in-scope services include: primary care; routine specialty care, specialized care, hospital inpatient care, emergency care, nonemergency urgent care, inpatient rehabilitation services, behavioural health, skilled nursing facility, pediatric health, palliative/hospice care, home health, outpatient pharmacy, and other.(4)

McMaster Health Forum
13 Evidence >> Insight >> Action
OHT readiness criteria
Key features of the current Ontario health system (pre-OHT implementation)
Key features of OHTs at maturity
Examples of key features of ACOs
manage their health information, however these remain relatively uncommon
• Widespread adoption (83%) of electronic medical records (EMRs), however there is relatively little connectivity or use for patients
Leadership, accountability and governance (how are governance and delivery arrangements aligned and how are provider’s engaged?)
• Some examples of team-based care in place in Family Health Teams, Family Health Groups, Family Health Networks, Family Health Organizations and in Community Health Centres
• Relatively little active communication beyond referrals between care providers
• OHTs will determine their own governance structure, have physicians and other clinical leaders in governance and/or leadership positions, and work within a single clinical and fiscal accountability framework (2)
• Medicare ACOs have a range of governance/leadership models:
o jointly (coalition)-led o hospital-led o physician-led o integrated delivery system
(e.g., parent or overarching governance structure) (8)
• Physicians and other clinical leaders typically hold governance and/or leadership positions in Medicare and Medicaid ACOs
• Medicare and Medicaid ACOs work within a single clinical and fiscal accountability framework
Funding and incentive structure (how are financial arrangements aligned?)
• Reliance on fee-for-service and alternative payments (e.g., capitation; salary) for physicians
• Reliance on global budgets and select alternative payments (HBAM and QBP) funneled through Local Health Integration Networks
• OHTs will be prospectively funded through an integrated funding envelop based on the care needs of their attributed patient populations
• ACOs face both upside and downside risk sharing
Performance measurement, quality improvement, and continuous learning (how is rapid learning and improvement supported?)
• Rapid learning and improvement remains focused on on problem and condition-focused efforts such as cancer and mental health and addictions
• Performance-measurement and quality-improvement efforts vary significantly by sector and organization
• OHTs will provide care according to the best available evidence and clinical standards, with an ongoing focus on quality improvement (2)
• OHTs will have their performance measured according to a standard set of indicators aligned with the quadruple aim
• Medicare and Medicaid ACOs report annually on a series of quality metrics.
• Medicare metrics are grouped into four domains: patient/carer experience, care coordination, preventive health, and chronic disease management (13)

Learning from the experience of accountable care organizations in the U.S.
14 Evidence >> Insight >> Action
What effects have been achieved through ACOs and what can we learn from their implementation in the U.S.? The rapid synthesis that we previously conducted and recently published (5) included one medium-quality systematic reviews and 28 primary studies, and our updated searches yielded an additional 32 primary studies that have been published since June 2017. The review and the 60 studies evaluate the outcomes of implementing a private or public ACO model compared to traditional fee-for-service payment models, or address how ACO goals were achieved. We provide detailed findings from these evaluations in Table 5, which is an updated version of a table published in the original synthesis.(5) The newly included studies from our updated searches do not significantly change our original findings. The inclusion of the new studies suggest that ACOs reduce costs without reducing quality. Taken together, four key messages (related to each of the elements of the quadruple aim) emerged from the literature, these include: 1) quality indicators (e.g., access to care, level of coordination and communication, length of stay, etc.) may
improve after ACO implementation, but changes are often small and metrics such as hospital readmissions or care for specific disorders may not be affected;
2) results for improvements in health outcomes appear to be mixed, with some evaluations of ACOs finding improvements in the health of patients receiving care rom them (e.g., slight reductions in mortality among cancer patients and pneumonia patients, fewer depressive symptoms, and better physical health scores, among others), and other evaluations finding no improvements or poorer population health outcomes;
3) ACOs may help reduce costs without reducing quality, and the cost reductions may be largely attributable to savings in outpatient expenses among the most medical complex patients, and to reductions in the use of low-value services; and
4) little evidence was found on the effects of ACOs on provider experiences, with two studies finding that improved collaboration as part of ACOS may help to increase providers’ available time, however, in another study primary-care providers suggested that quality targets associated with ACOs hinder their focus on patient needs.

McMaster Health Forum
15 Evidence >> Insight >> Action
Table 5. Key findings from evaluations of ACOs in the U.S. (table updated from Wilson et al. 2019)
ACO Quadruple-Aim Outcomes Patient experience of care (including quality of care)
Population health Per capita costs of care Provider experience
Medicare Physician Group Practice Demonstration (PGP)
Key findings from 2 included studies • Improved quality
indicators for diabetes, congestive heart failure, coronary artery disease, and preventive care.(14)
• Did not limit discretionary use of carotid and coronary imaging or revascularization.(15)
• No effect on non-discretionary cardiovascular imaging.(15)
Key findings from 1 included study • 5.6% reduction in
mortality among cancer patients.(16)
Key findings from 3 included studies • 2% combined savings per
assigned beneficiary per year during five-year demonstration.(14)
• $114 mean annual savings per beneficiary, with a skewed distribution of savings for those dually eligible for Medicare and Medicaid ($532 annually per beneficiary versus $59 annually per beneficiary).(17)
• $721 annual spending reductions across 10 PGP sites on cancer patient beneficiaries and 3.9% annual reduction per cancer patient.(16)
• No studies included
Alternative Quality Contract (AQC)
Key findings from 3 included studies • 3% and 0.7% increase in
the proportion of eligible enrollees meeting chronic care management and pediatric care thresholds, respectively.(18)
• Improvements in five evidence-based performance standards of care were found.(19)
• Not associated with improvements in quality of care for cardiovascular disease, diabetes-related measures, readmissions or low-density lipoprotein (LDL) testing in year one but results improved in year two for both LDL testing and diabetes measures.(20)
• No studies included Key findings from 6 included studies • No statistically significant
cost savings were found.(19)
• Cost savings ranged between $34 per beneficiary in year one to $51 in year two. The greatest savings were found for beneficiaries with five or more conditions compared to those with fewer conditions ($125 per beneficiary per year versus $61).(20)
• $15.51 decrease in quarterly spending per enrollee and 1.9% savings per quarter, most of which is attributable to reduced cost of procedures, imaging and testing. Enrollees with the highest risk attributed 95% of savings.(18)
• $62.21 average savings were reported from one AQC group per enrollee per quarter, with savings
• No studies included

Learning from the experience of accountable care organizations in the U.S.
16 Evidence >> Insight >> Action
(4.0% in professional spending) concentrated in the outpatient-facility settings.(21)
Medicare Shared Savings Program (MSSP)
Key findings from 11 included studies: • In comparison with low-
performing ACOs, high performing ACOs had formed collaborative relationships with local hospitals that enabled access to more timely information about admissions and discharge.(22)
• ACOs serving a high proportion of minority patients perform worse than other ACOs on quality performance measures, associations that are not entirely explained by patient characteristics (e.g., higher risk, higher severity of illness, or disadvantaged in other ways).(23)
• ACO beneficiaries had more appropriate use of cancer screening than fee-for-service recipients. This included reduction in breast cancer screening for women over the age of 75 who are less likely to benefit, as well as increased colorectal cancer screening.(24) Prostate screening rates were lower among ACO beneficiaries, which may reflect the lack of evidence-based guidelines for prostate screening.(25; 26)
• Rates of prostate cancer treatment for those unlikely to benefit were lower among ACO beneficiaries than FFS patients.(24)
• Improved appropriateness of end-of-life care for ischemic stroke(27), but mixed findings for end-of-life cancer care(28)
Key findings from 2 included studies: • Patients receiving
care from ACO-affiliated teams with a greater focus on patient-centered culture were more likely to have fewer depressive symptoms and better physical health scores.(33)
Key findings from 8 included studies: • No significant change was
found for the differential spending per beneficiary of those enrolled in MSSP ACOs when compared to control groups.(34)
• Estimated savings among independent primary care groups seen in the 2012 and 2013 MSSP ACO cohorts were significantly greater than savings in hospital-integrated groups.(34)
• Estimated savings were significantly higher for ACOs that had baseline spending above local averages than those below, suggesting that providers with more opportunities to reduce spending can do so more easily.(34)
• Costs of cancer care for ACO beneficiaries did not differ from non-ACO beneficiaries, for multiple types of cancer(35) and end-of-life care.(36) One study found equal costs for prostate cancer care(24) while another found higher costs.(37)
• No significant differences were found for spending on post-acute care when comparing MSSP and non-ACO hospitals.(38)
• Rural Health Clinics had higher costs of care per visit in the first two years of ACO implementation, with an increase of $11.41-$15.33 in the per-visit cost.(39)
Key findings from 2 included studies: • High-performing
ACOs were able to effectively integrate care coordinators into the team, however effects on other providers’ practice and satisfaction at work was not assessed (22)
• Higher scores for team work were not associated with improved patient-reported outcomes (33)

McMaster Health Forum
17 Evidence >> Insight >> Action
• ACO hospitals had reduced 30-day readmissions for heart failure and pneumonia.(29; 30)
• No difference for acute myocardial infarction (AMI) readmissions between ACO-attributed patients and other patients was found in one study,(29) while another found that ACO hospitals achieved greater reductions in readmission rates for AMI than non-ACOs.(30)
• ACO hospitals were more likely to discharge patients to highly-rated (five star) skilled nursing facilities, but equally likely to discharge patients to low-rated (one star) skilled-nursing facilities.(31)
• ACO beneficiaries had minimal or no difference in their use of and adherence to diabetic and cardiovascular medications when compared with fee-for-service beneficiaries.(32)
Advanced Payment ACO
No studies were found that evaluated the Triple Aim in Advance Payment models on their own, but this model was included in studies that evaluated multiple types of ACO (see below).
Pioneer ACO model
Key findings from 4 included studies • Similar satisfaction of care
was found between Pioneer ACO and fee-for-service beneficiaries, but ACO report higher satisfaction with clinician communication.(40)
• 10% of survey respondents identified the need for more focus on patient activation and/or patient skills for self-managing chronic conditions and 29% indicated that there is too much focus on quality metrics and not enough on patient needs.(41)
Key findings from 2 included studies • Two phases on
an evaluation of 32 Pioneer ACOs identified gaps in current data collection that limit the ability to analyze beneficiary data from a population perspective.(6; 7)
Key findings from 7 included studies • 4.5% reduction in
spending on low-value were found after the first year of operation of a Pioneer ACO.(43)
• Cost savings of $384 million was found in the first two-years of operation across 32 Pioneer ACOs.(6)
• A sample of Pioneer ACOs increased their spending by $385 million in the first two years, although this total was less than increases in traditional fee-for-service models.(40)
Key findings from 1 included study • Primary care
providers expressed feeling that quality targets hinder their focus on patient needs, and that pay-for-performance unfairly penalized providers for their patients’ choices (41)

Learning from the experience of accountable care organizations in the U.S.
18 Evidence >> Insight >> Action
• Significant reduction of hospital admissions related to chronic obstructive pulmonary disease, older adult asthma, and heart failure and increased rates for post discharge follow-up in the week following discharge across 32 ACOs between 2012-2013.(6)
• Survey of patient experience in 32 ACOs reported little change over initial two-year period based on Consumer Assessment of Health care Providers and Systems (CAHPS) surveys.(6)
• Pioneer ACO hospitals did not differ from other Medicare hospitals in their total performance score under the Medicare Value-Based Purchasing Program, nor for any of the component parts (process, patient experience, outcome, or efficiency).(42)
• Pioneer ACOs have been found to produce additional savings of: reduced spending of $29.2 per beneficiary per quarter; a 1.2% reduction in total costs per beneficiary per quarter in 2012; and smaller increase per beneficiary per month when compared to fee-for-service comparison.(44)
• 36% of physicians sampled at a Pioneer ACO found the compensation model too complex and felt that patients’ lifestyle behaviors, which they cannot control, influenced their salary.(41)
Studies including multiple types of ACOs
Key findings from 13 included studies • In one study, overall
ratings of care and interactions with physicians did not change significantly between the ACO and control groups.(26) In another study, Pioneer ACO hospitals were associated with better ratings for provider communication compared to non-ACO hospitals, and high-quality Pioneer ACOs had better scores for patient recommendation, while MSSP hospitals were not significantly associated with any domain of patient experience.(45)
• Improvements were seen in self-reports of timely access to care among complex beneficiaries with
Key findings from three included studies • Hospitals that
became more centralized through a Pioneer or Advance Payment ACO model had significantly larger reductions in mortality compared to those that remained free standing.(56)
• ACOs with tightly integrated physician-hospital linkages were associated with increased mortality.(56)
• MSSP and Pioneer ACO pneumonia patients had
Key findings from 10 included studies • Growth of per member
cost per month in a pediatric ACO was less ($2.40) per year compared to Medicaid fee-for-service ($16.15) and managed care ($6.47).(51)
• Of diverse ACOs, 26% calculated a return on investment from targeted patient and family activation and engagement, reporting ratios of between 2:1 and 4:1 based primarily on reduced emergency-room visits and hospitalizations.(47)
• Pioneer ACO contracts were associated with a reduction of $170 per beneficiary in total mental health spending in 2012 as compared to MSSP contracts, with the reduction largely a result of
Key findings from 2 included studies • ACOs
implemented approaches including interdisciplinary teamwork, care coordinators, and provider training in motivational interviewing to address provider barriers including lack of provider time (47)
• Collaboration (which in some instances was enabled through co-location) between primary care and behavioural health providers was well received by health providers as it
McMaster Health Forum
19 Evidence >> Insight >> Action
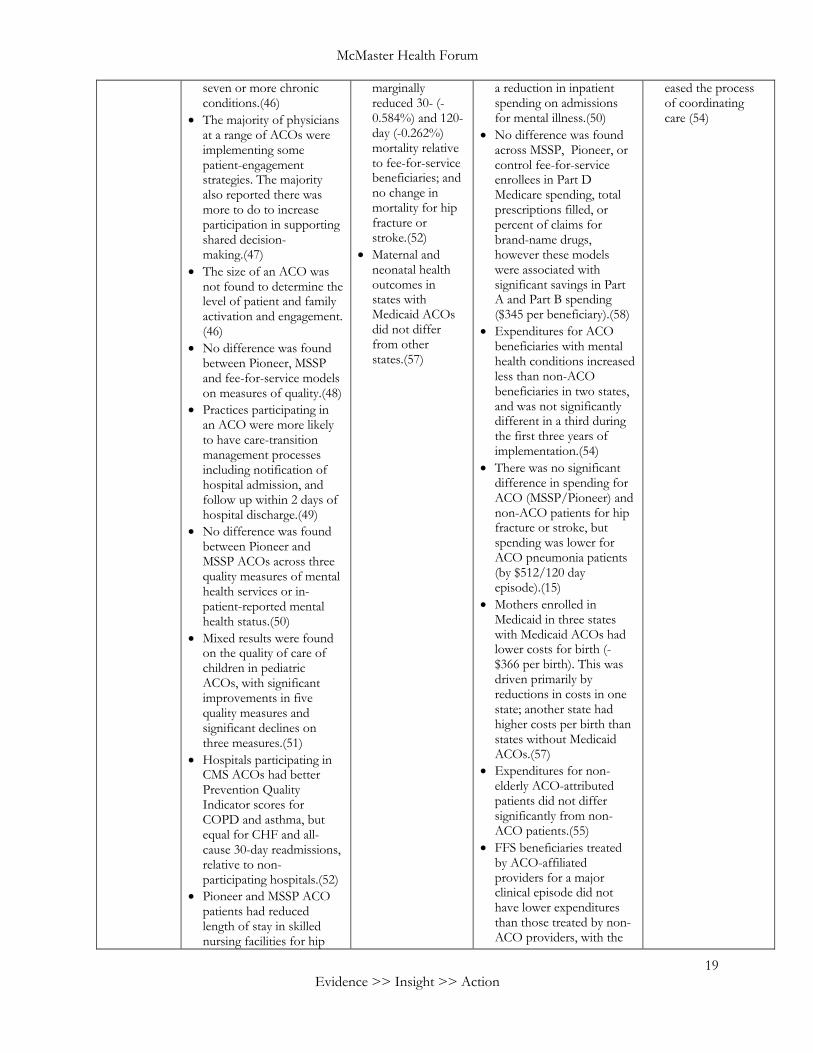
seven or more chronic conditions.(46)
• The majority of physicians at a range of ACOs were implementing some patient-engagement strategies. The majority also reported there was more to do to increase participation in supporting shared decision-making.(47)
• The size of an ACO was not found to determine the level of patient and family activation and engagement. (46)
• No difference was found between Pioneer, MSSP and fee-for-service models on measures of quality.(48)
• Practices participating in an ACO were more likely to have care-transition management processes including notification of hospital admission, and follow up within 2 days of hospital discharge.(49)
• No difference was found between Pioneer and MSSP ACOs across three quality measures of mental health services or in-patient-reported mental health status.(50)
• Mixed results were found on the quality of care of children in pediatric ACOs, with significant improvements in five quality measures and significant declines on three measures.(51)
• Hospitals participating in CMS ACOs had better Prevention Quality Indicator scores for COPD and asthma, but equal for CHF and all-cause 30-day readmissions, relative to non-participating hospitals.(52)
• Pioneer and MSSP ACO patients had reduced length of stay in skilled nursing facilities for hip
marginally reduced 30- (-0.584%) and 120-day (-0.262%) mortality relative to fee-for-service beneficiaries; and no change in mortality for hip fracture or stroke.(52)
• Maternal and neonatal health outcomes in states with Medicaid ACOs did not differ from other states.(57)
a reduction in inpatient spending on admissions for mental illness.(50)
• No difference was found across MSSP, Pioneer, or control fee-for-service enrollees in Part D Medicare spending, total prescriptions filled, or percent of claims for brand-name drugs, however these models were associated with significant savings in Part A and Part B spending ($345 per beneficiary).(58)
• Expenditures for ACO beneficiaries with mental health conditions increased less than non-ACO beneficiaries in two states, and was not significantly different in a third during the first three years of implementation.(54)
• There was no significant difference in spending for ACO (MSSP/Pioneer) and non-ACO patients for hip fracture or stroke, but spending was lower for ACO pneumonia patients (by $512/120 day episode).(15)
• Mothers enrolled in Medicaid in three states with Medicaid ACOs had lower costs for birth (-$366 per birth). This was driven primarily by reductions in costs in one state; another state had higher costs per birth than states without Medicaid ACOs.(57)
• Expenditures for non-elderly ACO-attributed patients did not differ significantly from non-ACO patients.(55)
• FFS beneficiaries treated by ACO-affiliated providers for a major clinical episode did not have lower expenditures than those treated by non-ACO providers, with the
eased the process of coordinating care (54)

Learning from the experience of accountable care organizations in the U.S.
20 Evidence >> Insight >> Action
fractures, stroke, and pneumonia compared to pre-ACO and non-ACO patients. 30-day readmission rates did not vary for stroke or pneumonia, and were marginally reduced for hip fracture.(52)
• Both recommended and non-recommended cancer screening rates were higher in patients attributed to Medicare ACOs than fee-for-service beneficiaries.(53)
• ACO-attributed patients with behavioural health conditions had equal rates of hospital readmission and post-discharge follow-up when compared with fee-for-service beneficiaries in three states implementing integrated behavioural health services. Findings for inpatient admissions were mixed, but emergency room visits declined more for ACO than non-ACO patients with behavioural health conditions in all three states.(54)
• Findings on antidepressant use and adherence in ACO beneficiaries are mixed.(50; 54)
• ACO attribution was not associated with satisfaction with care or use of preventive care for non-elderly patients.(55)
exception of marginally significant cost savings for three age-associated conditions.(59)
• Early (index admission-90 day) cardiovascular spending did not differ significantly between ACO and non-ACO beneficiaries. Late (91-365 day) spending was reduced by $889 for CHF and $680 for AMI. Savings were driven by reduced readmissions relative to non-ACO beneficiaries.(60)
• High-quality Pioneer and MSSP ACOs achieved cost savings in the first year of implementation, while low-quality ACOs experienced financial losses.(61)
McMaster Health Forum
21 Evidence >> Insight >> Action
What types of technical support has been provided to ACOs and what can we learn from its implementation?
While we were unable to identify any primary studies or systematic reviews that directly addressed this question, we interviewed nine key informants to understand their experience in providing technical supports to ACOs both in their initial development and throughout their maturity.
Four key observations are worth noting: 1) technical support to ACOs was highly segmented:
a) Medicare ACOs have been supported through a national effort led by CMS Innovation (part of the U.S. government) as well as specific contracts to deliver specific supports such as that held by Mathematica on behalf of a number of partners to develop a ‘learning system’,
b) Medicaid ACOs have been supported largely through state-level efforts and through a Commonwealth-funded grant to the Centre for Health Care Strategies to provide a national infrastructure,
c) commercial ACOs and some Medicare and Medicaid ACOs have also been supported by independent initiatives that emerged over time (e.g., National Association for ACOs that supports the ACO Learning Collaborative);
2) timing of technical support, particularly the front-end loading of support for applications and early development, is critical in supporting ACOs to think through the significant changes that will be required to organize themselves accordingly;
3) modalities for technical support have generally included the use of learning collaboratives (or communities of practice), webinars to connect with other ACOs and external experts, development of tools for planning, one-on-one coaching as well as cross-ACO working sessions, an annual ACO conference, and a dashboard to allow ACOs to benchmark against one another; and
4) technical support to date has largely focused on sharing tacit and experiential knowledge with relatively few supports giving explicit attention to research evidence.
Finally, key informants repeatedly noted the importance of a graded approach to technical support and making available one-on-one coaching. They stressed that while there were similarities in the challenges that ACOs face, the resources they had available and their experience with population-health management differed significantly requiring different (and different amounts of) support.
Learning from the experience of accountable care organizations in the U.S.
22 Evidence >> Insight >> Action
REFERENCES
1. Legislative Assembly of Ontario. People's Healthcare Act, 2019, S.O. 2019, c.5. Toronto: Queen's Printer for Ontario: 2019. https://www.ola.org/en/legislative-business/bills/parliament-42/session-1/bill-74 (accessed 01 August 2019)
2. Ministry of Health and Long-Term Care. Ontario Health Teams: Guidance for health care providers and organizations. Toronto; 2019.
3. Boyarsky V, Parke R. The Medicare Shared Savings Program and the Pioneer Accountable Care Organization Milliman Healthcare Reform Briefing Papers. 2012.
4. Guta A, Wilson M, Lavis J. Rapid synthesis: Examining the impacts of accountable care organizations on patient experience, population health and costs. Hamilton: McMaster Health Forum; 2016.
5. Wilson M, Guta A, Waddell K, Reid R, Lavis J. Impacts of accountable care organizations on patient experience, population health and costs: A rapid review. Journal of Health Services Research & Policy Forthcoming.
6. L&M Policy Research. Evaluation of CMMI Accountable Care Organization Initiatives Centers for Medicare & Medicaid Services. L&M Policy Research; 2015.
7. L&M Policy Research. Pioneer ACO Evaluation Findings from Performance Years One and Two. Centers for Medicare & Medicaid Services; 2013.
8. L&M Policy Research. Pioneer ACO final report. L&M Policy Research; 2016.
9. Centres for Medicare and Medicaid Innovation. Pioneer ACO model and Next Generation model: Comparison across key design elements. Washington D.C.: Centres for Medicare and Medicaid Innovation; 2015.
10. Muhlestein D, Saunders R, McClellan M. Growth of ACOs and alternative payment models in 2017. Health Affairs; 2017. https://www.healthaffairs.org/do/10.1377/hblog20170628.060719/full/ (accessed 01 August 2019).
11. Matulis R, Lloyd J. The history, evolution, and future of medicaid accountable care organizations. Centre for Health Care Strategies; 2014.
12. Shortell SM, Wu FM, Lewis VA, Colla CH, Fisher ES. A taxonomy of accountable care organizations for policy and practice. Health Services Research 2014;49(6): 1883-99.
13. Centres for Medicare and Medicaid Innovation. Program guidance and specification. Washington D.C.: Centres for Medicare and Medicaid Services; 2019. https://www.cms.gov/Medicare/Medicare-Fee-for-Service-Payment/sharedsavingsprogram/program-guidance-and-specifications.html (accessed 24 June 2019).
14. Pope G, Kautter J, Leung M, Trisolini M, Adamache W, Smith K. Financial and Quality Impacts of the Medicare Physician Group Practice Demonstration. Medicare & Medicaid Research Review 2014;4(3): mmrr2014-004-03-a01.
15. Colla CH, Goodney PP, Lewis VA, Nallamothu BK, Gottlieb DJ, Meara ER. Implementation of a Pilot ACO Payment Model and the Use of Discretionary and Non-Discretionary Cardiovascular Care. Circulation 2014;130(22): 1954-1961.
16. Colla CH, Lewis VA, Gottlieb DJ, Fisher ES, editors. Cancer spending and accountable care organizations: Evidence from the Physician Group Practice Demonstration. Healthcare; 2013: Elsevier.

McMaster Health Forum
23
17. Colla CH, Wennberg DE, Meara E, et al. Spending differences associated with the medicare physician group practice demonstration. Journal of the American Medical Association 2012;308(10): 1015-1023.
18. Song Z, Safran DG, Landon BE, et al. Health Care Spending and Quality in Year 1 of the Alternative Quality Contract. New England Journal of Medicine 2011;365(10): 909-918.
19. Salmon RB, Sanderson MI, Walters BA, Kennedy K, Flores RC, Muney AM. A Collaborative Accountable Care Model In Three Practices Showed Promising Early Results On Costs And Quality Of Care. Health Affairs 2012;31(11): 2379-2387.
20. McWilliams J, Landon BE, Chernew ME. Changes in health care spending and quality for medicare beneficiaries associated with a commercial aco contract. Journal of the American Medical Association 2013;310(8): 829-836.
21. Song Z, Rose S, Safran DG, Landon BE, Day MP, Chernew ME. Changes in Health Care Spending and Quality 4 Years into Global Payment. New England Journal of Medicine 2014;371(18): 1704-1714.
22. D'Aunno T, Broffman L, Sparer M, Kumar SR. Factors that distinguish high-performing accountable care organizations in the Medicare shared savings program. Health Services Research 2016.
23. Lewis VA, Fraze T, Fischer E, Shortell S, Colla C. ACOs serving high proportions of racial and ethnic minorities lag in quality performance. Health Affairs 2016;36(1): 57-66.
24. Borza T, Kaufman SR, Yan P, et al. Early effect of Medicare Shared Savings Program accountable care organization participation on prostate cancer care. Cancer 2018;124(3): 563-570.
25. Resnick MJ, Graves AJ, Gambrel RJ, Thapa S, Buntin MB, Penson DF. The association between Medicare accountable care organization enrollment and breast, colorectal, and prostate cancer screening. Cancer 2018;124(22): 4366-4373.
26. Resnick MJ, Graves AJ, Thapa S, et al. Medicare Accountable Care Organization Enrollment and Appropriateness of Cancer Screening. Journal of the American Medical Association Internal Medicine 2018;178(5): 648-654.
27. Kaufman BG, O'Brien EC, Stearns SC, et al. Medicare Shared Savings ACOs and Hospice Care for Ischemic Stroke Patients. Journal of the American Geriatrics Society 2019.
28. Kim H, Keating NL, Perloff JN, Hodgkin D, Liu X, Bishop CE. Aggressive Care near the End of Life for Cancer Patients in Medicare Accountable Care Organizations. Journal of the American Geriatrics Society 2019;67(5): 961-968.
29. Kim Y, Thirukumaran CP, Li Y. Greater Reductions in Readmission Rates Achieved by Urban Hospitals Participating in the Medicare Shared Savings Program. Medical Care 2018;56(8): 686-692.
30. Ryan AM, Krinsky S, Adler-Milstein J, Damberg CL, Maurer KA, Hollingsworth JM. Association Between Hospitals' Engagement in Value-Based Reforms and Readmission Reduction in the Hospital Readmission Reduction Program. Journal of the American Medical Association Internal Medicine 2017;177(6): 862-868.
31. Bain AM, Werner RM, Yuan Y, Navathe AS. Do Hospitals Participating in Accountable Care Organizations Discharge Patients to Higher Quality Nursing Homes? Journal of Hospital Medicine 2019;14(5): 288-289.
32. McWilliams JM, Hatfield LA, Landon BE, Hamed P, Chernew ME. Medicare Spending after 3 Years of the Medicare Shared Savings Program. The New England Journal of Medicine 2018;379(12): 1139-1149.
33. Shortell SM, Poon BY, Ramsay PP, et al. A multilevel analysis of patient engagement and patient-reported outcomes in primary care practices of accountable care organizations. Journal of General Internal Medicine 2017;32(6): 640-647.

Learning from the experience of accountable care organizations in the U.S.
24 Evidence >> Insight >> Action
34. McWilliams JM, Hatfield LA, Chernew ME, Landon BE, Schwartz AL. Early performance of accountable care organizations in medicare. New England Journal of Medicine 2016;374(24): 2357-66.
35. Lam MB, Figueroa JF, Zheng J, Orav EJ, Jha AK. Spending Among Patients With Cancer in the First 2 Years of Accountable Care Organization Participation. Journal of Clinical Oncology: Official Journal of the American Society of Clinical Oncology 2018;36(29): 2955-2960.
36. Lam M, Zheng J, Orav EJ, Jha A. Early Accountable Care Organization Results of End of Life Spending among Cancer Patients. Journal of the National Cancer Institute 2019.
37. Hollenbeck BK, Kaufman SR, Borza T, et al. Accountable care organizations and prostate cancer care. Urology Practice 2017;4(6): 454-461.
38. Navathe AS, Bain AM, Werner RM. Do Changes in Post-acute Care Use at Hospitals Participating in an Accountable Care Organization Spillover to All Medicare Beneficiaries? Journal of General Internal Medicine 2018;33(6): 831-838.
39. Hofler R, Ortiz J, Coté B. Cost of Practice Transformation in Primary Care: Joining an Accountable Care Organization. Journal of Health Care Finance 2018;44(3).
40. Nyweide DJ, Lee W, Cuerdon TT, et al. Association of pioneer accountable care organizations vs traditional medicare fee for service with spending, utilization, and patient experience. Journal of the American Medical Association 2015;313(21): 2152-2161.
41. Hibbard JH, Greene J, Sacks R, Overton V. Does Compensating Primary Care Providers to Produce Higher Quality Make Them More or Less Patient Centric? Medical Care Research and Review 2015: 1077558715586291.
42. Jones RS, Ramirez AG, Stukenborg GJ, Tracci MC, Turrentine FE. Observations on the Medicare Value-Based Ranking of Hospitals During Fiscal Years 2015 and 2016. American Journal of Medical Quality: The Official Journal of the American College of Medical Quality 2019;34(2): 136-143.
43. Schwartz AL, Chernew ME, Landon BE, McWilliams J. CHanges in low-value services in year 1 of the medicare pioneer accountable care organization program. Journal of the American Medical Association Internal Medicine 2015;175(11): 1815-1825.
44. McWilliams JM, Chernew ME, Landon BE, Schwartz AL. Performance Differences in Year 1 of Pioneer Accountable Care Organizations. The New England Journal of Medicine 2015;372(20): 1927-1936.
45. Diana ML, Zhang Y, Yeager VA, Stoecker C, Counts CR. The impact of accountable care organization participation on hospital patient experience. Health Care Management Review 2019;44(2): 148-158.
46. McWilliams JM, Landon BE, Chernew ME, Zaslavsky AM. Changes in Patients' Experiences in Medicare Accountable Care Organizations. New England Journal of Medicine 2014;371(18): 1715-1724.
47. Shortell SM, Sehgal NJ, Bibi S, et al. An Early Assessment of Accountable Care Organizations’ Efforts to Engage Patients and Their Families. Medical Care Research and Review 2015;72(5): 580-604.
48. Singh S, Khosla S, Sethi A. Comparison of Healthcare Quality Outcomes Between Accountable Care Organizations and Physician Group Practices. Journal of Medical Practice Management: MPM 2015;30(4): 261-264.
49. Huber TP, Shortell SM, Rodriguez HP. Improving Care Transitions Management: Examining the Role of Accountable Care Organization Participation and Expanded Electronic Health Record Functionality. Health Services Research 2017;52(4): 1494-1510.
50. Busch A, Huskamp H, McWilliams J. Early efforts by medicare accountable care organizations have limited effect on mental illness care and management. Health Affairs 2016;35(7): 1247-56.
51. Kelleher KJ, Cooper J, Deans K, et al. Cost Saving and Quality of Care in a Pediatric Accountable Care Organization. Pediatrics 2015;135(3): e582-e589.

McMaster Health Forum
25
52. Colla CH, Lewis VA, Stachowski C, Usadi B, Gottlieb DJ, Bynum JPW. Changes in Use of Postacute Care Associated With Accountable Care Organizations in Hip Fracture, Stroke, and Pneumonia Hospitalized Cohorts. Medical Care 2019;57(6): 444-452.
53. Meyer CP, Krasnova A, Sammon JD, et al. Accountable care organizations and the use of cancer screening. Preventive Medicine 2017;101: 15-17.
54. Beil H, Feinberg RK, Patel SV, Romaire MA. Behavioral Health Integration With Primary Care: Implementation Experience and Impacts From the State Innovation Model Round 1 States. The Milbank Quarterly 2019;97(2): 543-582.
55. Hong Y-R, Sonawane K, Larson S, Mainous AG, Marlow NM. Impact of Provider Participation in ACO Programs on Preventive Care Services, Patient Experiences, and Health Care Expenditures in US Adults Aged 18-64. Medical Care 2018;56(8): 711-718.
56. Chukmaitov A, Harless DW, Bazzoli GJ, Carretta HJ, Siangphoe U. Delivery system characteristics and their association with quality and costs of care: Implications for accountable care organizations. Health Care Management Review 2015;40(2): 92-103.
57. Henke RM, Karaca Z, Gibson TB, et al. Medicaid Accountable Care Organizations and Childbirth Outcomes. Medical Care Research and Review: MCRR 2019: 1077558718823132.
58. Zhang Y, Caines K, Powers C. Evaluating the effects of pioneer accountable care organizations on Medicare part D drug spending and utilization. Medical Care 2017;55(5).
59. Post B, Ryan AM, Moloci NM, Li J, Dupree JM, Hollingsworth JM. Physician Participation in Medicare Accountable Care Organizations and Spillovers in Commercial Spending. Medical Care 2019;57(4): 305-311.
60. Sinha SS, Moloci NM, Ryan AM, et al. The Effect of Medicare Accountable Care Organizations on Early and Late Payments for Cardiovascular Disease Episodes. Circulation Cardiovascular Quality and Outcomes 2018;11(8): e004495.
61. Parasrampuria S, Oakes AH, Wu SS, Parikh MA, Padula WV. VALUE AND PERFORMANCE OF ACCOUNTABLE CARE ORGANIZATIONS: A COST-MINIMIZATION ANALYSIS. International Journal of Technology Assessment in Health Care 2018;34(4): 388-392.
