learning from closed institutions - ticua from closed... · learning from closed institutions:...
TRANSCRIPT
Securing
Tennessee’s
Future Learning from Closed
Institutions: Indicators of
Risk for Small Private
Colleges and Universities


Learning from Closed Institutions: Indicators of Risk for Small Private Colleges and Universities
Dawn Lyken-Segosebe
Justin Cole Shepherd
Higher Education Leadership and Policy Studies
Peabody College of Education and Human Development
Vanderbilt University
© July 2013
Paper prepared for the Tennessee Independent Colleges and Universities Association (TICUA)
DAWN LYKEN-SEGOSEBE is a doctoral student in the Higher Education Leadership and
Policy Studies program at Vanderbilt University. Her research focuses on faculty (codes of
conduct, scholarship, and interaction with students), and the college outcomes of commuter
students. Previously, she lectured in the Economics departments of the University of Guyana and
the United Arab Emirates University, and was a Principal Technical Education Officer at the
Ministry of Education in Botswana.
JUSTIN COLE SHEPHERD is a doctoral candidate in the Higher Education Leadership and
Policy Studies program at Vanderbilt University. His research focuses on budgeting, public
management, governance, and politics in higher education. Prior to his work at Vanderbilt, he
worked as a budget analyst for Broward County, Florida.

1
Introduction
For small colleges and universities, risks to their financial health have become a chronic
issue in the aftermath of the financial crisis of the early 2000s. Small colleges and universities
tend to be among – or at serious risk of joining – the one-third of higher education institutions
that face financial statements significantly weaker than before the recession (Selingo, 2013).
“Expenses are growing at such a pace that colleges don’t have the cash or the revenue to cover
them for much longer,” says Jeff Denneen, Partner at Bain & Company and head of the
management consulting firm’s Americas Higher Education practice. “A growing number of
colleges are in real financial trouble.”
Many of the problems surrounding declining revenues can be attributed to issues
stemming from enrollment struggles. Moody’s 2012 Tuition Survey recognizes that enrollment
declines tend to be concentrated in colleges with smaller total enrollment, weak selectivity/yield
rates, high tuition dependence, small endowments, and soft regional demographics.
Furthermore, private colleges and universities with small enrollments fall among the 97% of the
country’s 1,600 institutions with endowments less than $1 billion (National Association of
College and University Business Officers and Commonfund Institute (2013). The economic
recession has put a strain on endowments, which, on average, reported losses during the 2012
fiscal year (FY2012). This renders small institutions even more tuition-dependent as they have
little cushion against unexpected revenue shortfalls through alternate revenue sources (Van Der
Werf, 2002).
On average, five private 4-year non-profit colleges and universities have closed per year
over the last ten years, with as many as 9 institutions closing in 2009 (The Digest of Education
Statistics 2013). What lessons can we learn from the closure of these institutions? What are the
key indicators that were common to these institutions? This paper examines the literature and
institutional data on small colleges and universities that closed over the last ten years, seeking to
identify the contributing factors to institutional failure and present these as risks to the financial
health of small institutions.
Challenges to Small Institutions
The challenges faced by small colleges and universities are presented in the extant
literature primarily as case studies. While the literature does not examine recent institutional
closures in great detail, the snapshots provided succinctly captures the reasons for their closure.
The Chronicle of Higher Education highlights the challenges faced by:
Urban College of Boston, 2012 – “600 students”, “financial troubles”, “failed merger
with Endicott College”, “$250,000 deficit” (DeSantis, 2012);
Antioch College, 2007 – “dwindling enrollment and expensive campus maintenance”,
“small endowment of $36.2 million”, “annual deficit of $5-million for several years”
(Carlson, 2007; Fain, 2007; Jaschik, 2007);
William Tyndale College, 2004 – “college was running out of money and could not
operate past December 31”, “cannot maintain an enrollment high enough to make ends
meet”, “292 students” (Gravois, 2004);
Trinity College, 2000 – low enrollment with “225 returning undergraduates”,
“endowment is only about $700,000”, “cumulative operating deficit of $2.7-million, and
its long-term debt stands at about $5.6-million” (Van der Werf, 2000).
2
The literature indicates that low enrollment, low endowment levels, high debt and deficit
positions, and deferred maintenance were challenges common to small colleges and universities
at the time of their closure.
Low Enrollment
Falling enrollment is a real threat for these institutions since tuition, fees, and room and
board generally account for two-thirds or more of their revenue (Chabotar, 2010). Falling
matriculation figures reduce overall tuition revenue, a situation institutions need to be wary of
given that net tuition revenue in recent years has either been flat or falling at 73% of colleges
(Selingo, 2013).
Low Endowment Levels
The deleterious effect of tuition-dependence becomes magnified when institutions are
also endowment-dependent. Small institutions depend on endowment and fund-raising as major
alternate sources of revenue. Private giving to American colleges in FY2008 was reported at
$31.6 billion according to findings of the annual Voluntary Support of Education (VSE) survey.
The following year demonstrated a decline of 12% in total giving, the steepest decline in the
survey’s 50-year history (Chabotar, 2010). However, the February 2013-released VSE survey
indicates that philanthropic giving to U. S. colleges and universities grew by a modest 2.3%
percent during FY2012 with total giving reaching $31 billion, nearly recovering to the FY2008
level (Council for the Advancement and Support of Education, 2013).
It is unclear whether small colleges and universities are the direct beneficiaries of these
philanthropic increases, particularly given that the VSE results indicate the continued decline in
the percentage of alumni who contribute to their alma mater. The percentage of alumni
participating in their alma mater's annual giving campaigns in FY2012 fell 0.3 percentage points,
and the average alumni gift declined 1.4 percent. This could be especially detrimental to small
institutions that rely on fewer alumni for gifts than larger or public institutions. During the first
six months of FY2012, the New York Stock Exchange dropped 11.2 percent. This sharp drop,
along with relatively high rates of unemployment among recent college graduates, may have
limited the ability or willingness of individuals to participate in campus fundraising efforts
(Council for the Advancement and Support of Education, 2013). Indeed, alumni giving, which
accounts for about one quarter of the aforementioned $31 billion in total giving, fell by
approximately $100 million during this time.
Debt and Deficit Problems
The literature recognizes a liquidity crisis as another common challenge faced by small
institutions. Years of over-commitment to capital and associated operating expenses have
worsened their financial positions. Denneen and Dretler (2012) of Bain & Company provide a
good summary of the situation. They point out institutional struggles with falling equity ratios
(equity in relation to total assets), increasing expense ratios (expenses in relation to total
revenues), increasing liabilities, and increasing payments to debt service. These poor financial
indicators are reflective of an embedded assumption in higher education “that the more
[institutions] build, spend, diversify and expand, the more they will persist and prosper.”
Instead, the rapid expansion of capital facilities and over-commitment to operating expenses puts
a major financial strain on these institutions, particularly as revenues decline and these
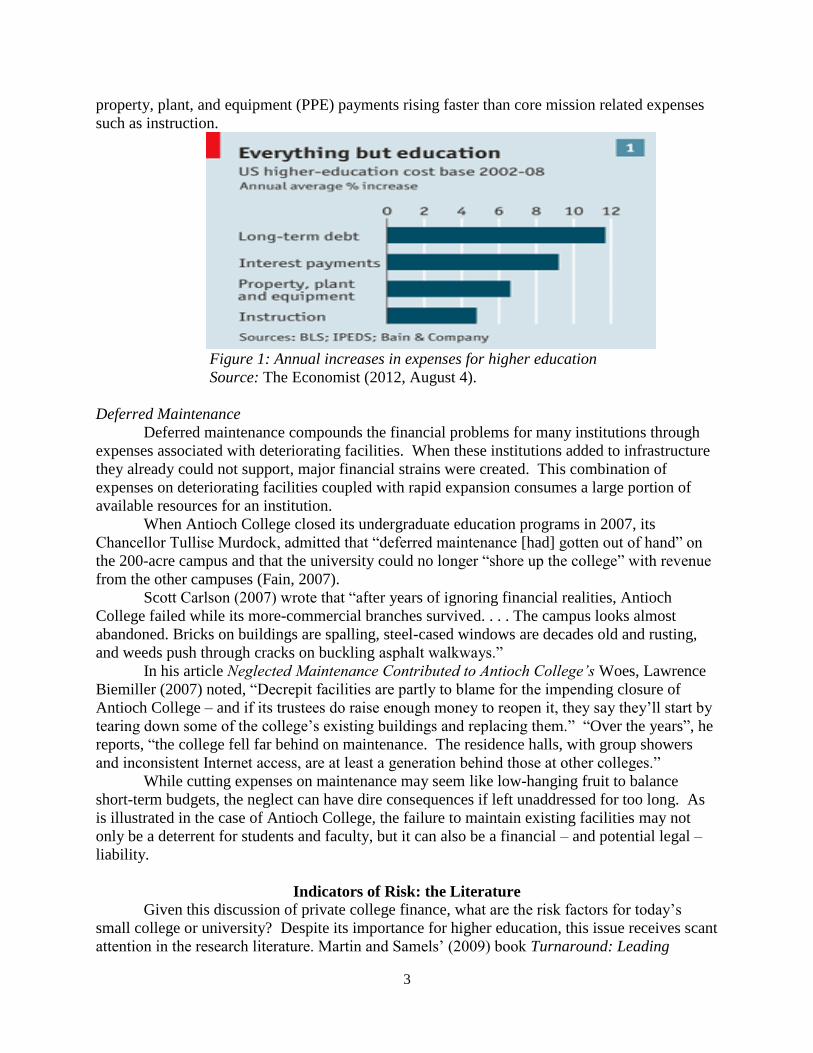
commitments take up an increasing share of institutional budgets. In Figure 1 below, provided
by The Economist, these rapidly increasing expenses are illustrated with debt, interest, and
3
property, plant, and equipment (PPE) payments rising faster than core mission related expenses
such as instruction.
Figure 1: Annual increases in expenses for higher education
Source: The Economist (2012, August 4).
Deferred Maintenance
Deferred maintenance compounds the financial problems for many institutions through
expenses associated with deteriorating facilities. When these institutions added to infrastructure
they already could not support, major financial strains were created. This combination of
expenses on deteriorating facilities coupled with rapid expansion consumes a large portion of
available resources for an institution.
When Antioch College closed its undergraduate education programs in 2007, its
Chancellor Tullise Murdock, admitted that “deferred maintenance [had] gotten out of hand” on
the 200-acre campus and that the university could no longer “shore up the college” with revenue
from the other campuses (Fain, 2007).
Scott Carlson (2007) wrote that “after years of ignoring financial realities, Antioch
College failed while its more-commercial branches survived. . . . The campus looks almost
abandoned. Bricks on buildings are spalling, steel-cased windows are decades old and rusting,
and weeds push through cracks on buckling asphalt walkways.”
In his article Neglected Maintenance Contributed to Antioch College’s Woes, Lawrence
Biemiller (2007) noted, “Decrepit facilities are partly to blame for the impending closure of
Antioch College – and if its trustees do raise enough money to reopen it, they say they’ll start by
tearing down some of the college’s existing buildings and replacing them.” “Over the years”, he
reports, “the college fell far behind on maintenance. The residence halls, with group showers
and inconsistent Internet access, are at least a generation behind those at other colleges.”
While cutting expenses on maintenance may seem like low-hanging fruit to balance
short-term budgets, the neglect can have dire consequences if left unaddressed for too long. As
is illustrated in the case of Antioch College, the failure to maintain existing facilities may not
only be a deterrent for students and faculty, but it can also be a financial – and potential legal –
liability.
Indicators of Risk: the Literature
Given this discussion of private college finance, what are the risk factors for today’s
small college or university? Despite its importance for higher education, this issue receives scant
attention in the research literature. Martin and Samels’ (2009) book Turnaround: Leading
4
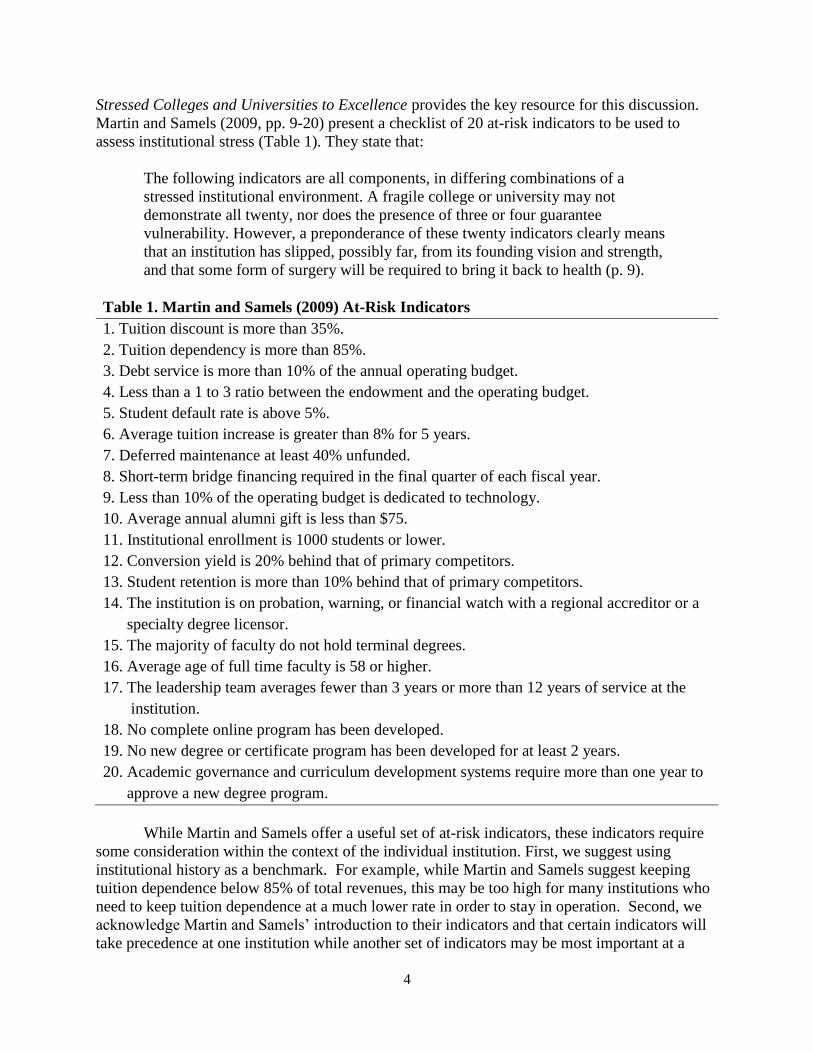
Stressed Colleges and Universities to Excellence provides the key resource for this discussion.
Martin and Samels (2009, pp. 9-20) present a checklist of 20 at-risk indicators to be used to
assess institutional stress (Table 1). They state that:
The following indicators are all components, in differing combinations of a
stressed institutional environment. A fragile college or university may not
demonstrate all twenty, nor does the presence of three or four guarantee
vulnerability. However, a preponderance of these twenty indicators clearly means
that an institution has slipped, possibly far, from its founding vision and strength,
and that some form of surgery will be required to bring it back to health (p. 9).
Table 1. Martin and Samels (2009) At-Risk Indicators
1. Tuition discount is more than 35%.
2. Tuition dependency is more than 85%.
3. Debt service is more than 10% of the annual operating budget.
4. Less than a 1 to 3 ratio between the endowment and the operating budget.
5. Student default rate is above 5%.
6. Average tuition increase is greater than 8% for 5 years.
7. Deferred maintenance at least 40% unfunded.
8. Short-term bridge financing required in the final quarter of each fiscal year.
9. Less than 10% of the operating budget is dedicated to technology.
10. Average annual alumni gift is less than $75.
11. Institutional enrollment is 1000 students or lower.
12. Conversion yield is 20% behind that of primary competitors.
13. Student retention is more than 10% behind that of primary competitors.
14. The institution is on probation, warning, or financial watch with a regional accreditor or a
specialty degree licensor.
15. The majority of faculty do not hold terminal degrees.
16. Average age of full time faculty is 58 or higher.
17. The leadership team averages fewer than 3 years or more than 12 years of service at the
institution.
18. No complete online program has been developed.
19. No new degree or certificate program has been developed for at least 2 years.
20. Academic governance and curriculum development systems require more than one year to
approve a new degree program.
While Martin and Samels offer a useful set of at-risk indicators, these indicators require
some consideration within the context of the individual institution. First, we suggest using
institutional history as a benchmark. For example, while Martin and Samels suggest keeping
tuition dependence below 85% of total revenues, this may be too high for many institutions who
need to keep tuition dependence at a much lower rate in order to stay in operation. Second, we
acknowledge Martin and Samels’ introduction to their indicators and that certain indicators will
take precedence at one institution while another set of indicators may be most important at a

5
different institution. Again, context is important in evaluating the short-term and long-term
viability of institutional plans.
In addition to the above indicators, Denneen and Dretler (2012) offer additional
suggestions. They state that a college or university might be at risk if bond ratings have recently
declined, tuition prices have increased markedly to try to offset changes in enrollment,
admissions standards have been lowered, or the number of faculty has been reduced.
In another study, Porter and Ramirez (2009) examined institutional closures from 1975-
2005 and found that schools with large endowments and greater selectivity of students had the
highest rates of survival. Alternatively, they identified the following factors as contributors to
institutional closure:
Wealth: Institutions with a lower endowment per student were more likely to close.
Enrollments: Institutions with lower enrollments were more likely to close.
Selectivity: The less selective a college is in admissions, the less likely it is to survive.
Porter and Ramirez’ (2009) finding with regard to religion is of particular interest to our
study. They found that religious colleges were less likely than secular institutions to close. The
researchers speculate that there may be an enrollment advantage: even if religious affiliation
means that some colleges have a smaller pool of potential students, those students may be more
likely to enroll at a religious institution (Jaschik, 2009; Koon, 2009).
Indicators of Risk: the Data
Within the literature, Martin and Samels (2009) provide the only depth discussion
of at-risk indicators, albeit for colleges and universities in general. To elicit information more
pertinent to the closure of “small” private institutions, we therefore also approached the data on
institutions of this size, looking for insight into why they failed.
Methodology & Data
The data, for the comparative aspect of this report, are drawn from Integrated
Postsecondary Education Data System (IPEDS) of the National Center for Education Statistics
(NCES), housed at the U. S. Department of Education. All institutions receiving federal funding
(e.g. federal financial aid) are required to report admissions, enrollment, graduation, and
financial information to NCES, which is then published as the IPEDS data center. The data
reported for the institutions that closed was drawn from the last year of full reporting to IPEDS,
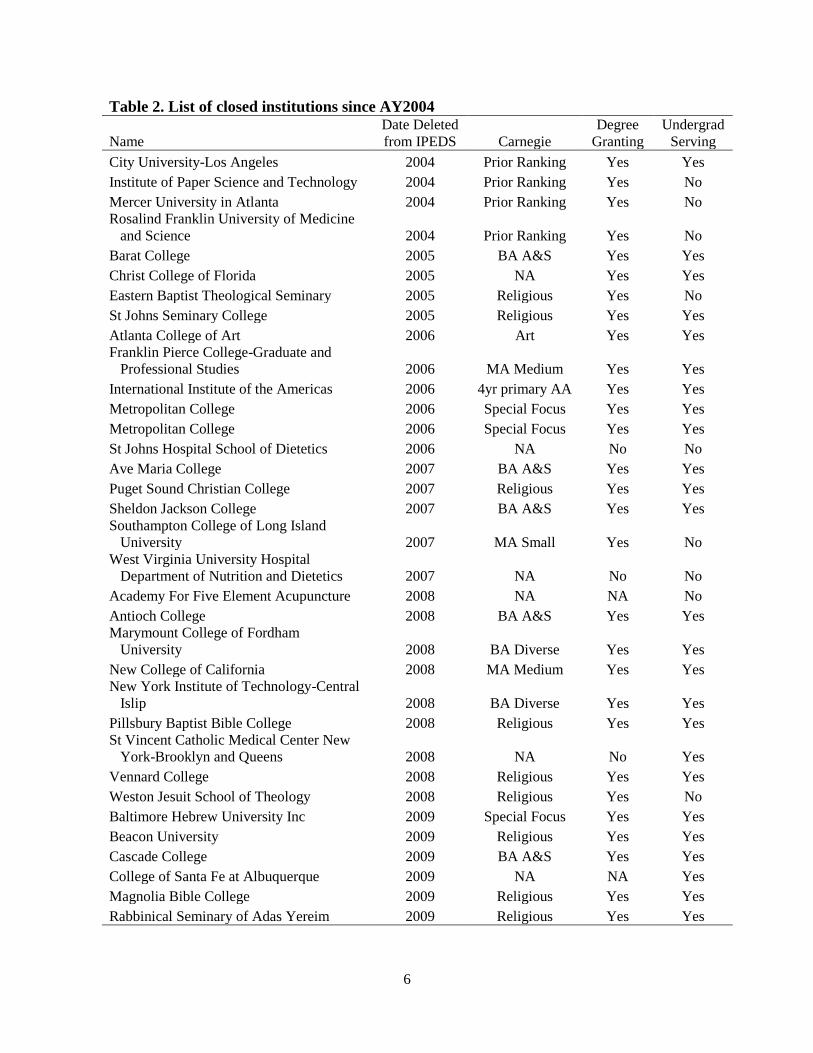
typically 2 years prior to the date of closure. We narrowed our analysis to four-year private
institutions and looked for those who reported as closed in the last 10 years, 2004 to 2013. This
resulted in 57 institutions, listed overleaf in Table 2.
The data was used to compare institutions that failed to similar institutions throughout the
nation that remain in operation. We looked into the descriptive statistics for institutions that
have closed and predictably found small enrollments, averaging roughly 250 with a maximum
enrollment of just over 1000. Therefore, we again consulted IPEDS and drew comparison groups
of similar private colleges and universities. One comparison group included institutions with
enrollment below 250 while the other comparison group included institutions with enrollment
below 1000. The comparison institutions include the most recent data reported by IPEDS.
We compared these groups, looking for major differences in enrollment, revenues, expenses, and
accounting statistics. Unlike the case studies found in the literature, this comparison was cross-
sectional, comparing different institutions at a single point in time rather than longitudinally.
6
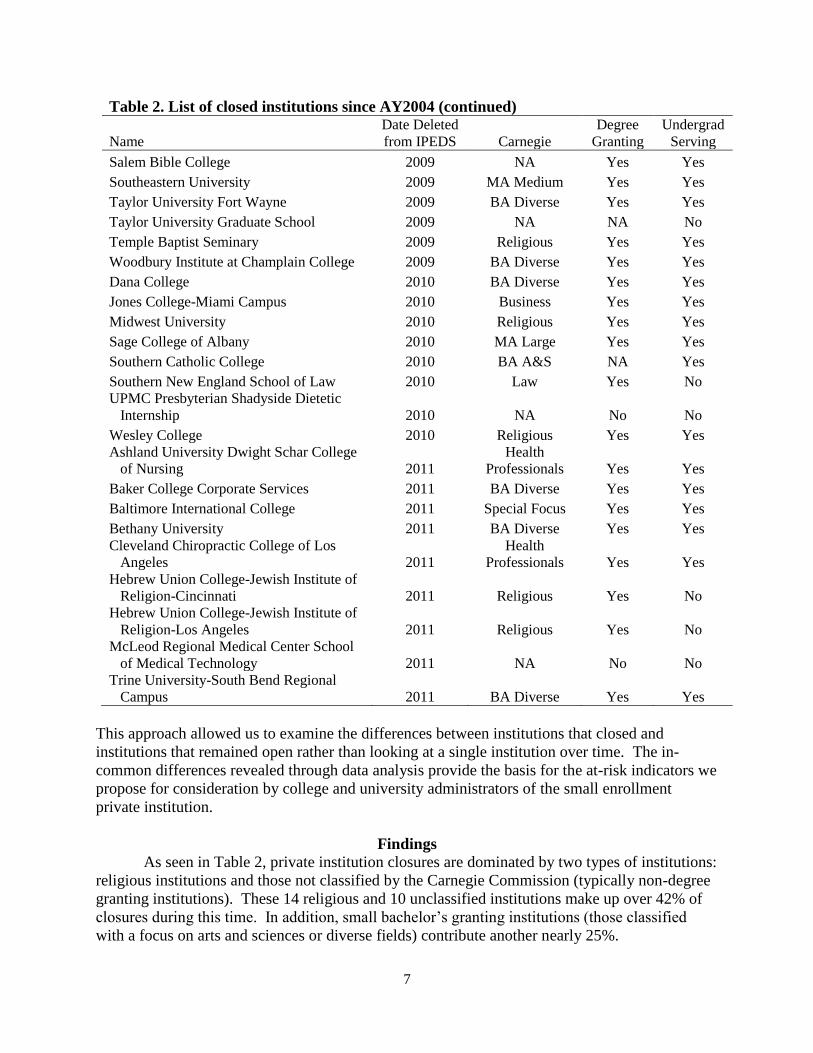
Table 2. List of closed institutions since AY2004
Name
Date Deleted
from IPEDS Carnegie
Degree
Granting
Undergrad
Serving
City University-Los Angeles 2004 Prior Ranking Yes Yes
Institute of Paper Science and Technology 2004 Prior Ranking Yes No
Mercer University in Atlanta 2004 Prior Ranking Yes No
Rosalind Franklin University of Medicine
and Science 2004 Prior Ranking Yes No
Barat College 2005 BA A&S Yes Yes
Christ College of Florida 2005 NA Yes Yes
Eastern Baptist Theological Seminary 2005 Religious Yes No
St Johns Seminary College 2005 Religious Yes Yes
Atlanta College of Art 2006 Art Yes Yes
Franklin Pierce College-Graduate and
Professional Studies 2006 MA Medium Yes Yes
International Institute of the Americas 2006 4yr primary AA Yes Yes
Metropolitan College 2006 Special Focus Yes Yes
Metropolitan College 2006 Special Focus Yes Yes
St Johns Hospital School of Dietetics 2006 NA No No
Ave Maria College 2007 BA A&S Yes Yes
Puget Sound Christian College 2007 Religious Yes Yes
Sheldon Jackson College 2007 BA A&S Yes Yes
Southampton College of Long Island
University 2007 MA Small Yes No
West Virginia University Hospital
Department of Nutrition and Dietetics 2007 NA No No
Academy For Five Element Acupuncture 2008 NA NA No
Antioch College 2008 BA A&S Yes Yes
Marymount College of Fordham
University 2008 BA Diverse Yes Yes
New College of California 2008 MA Medium Yes Yes
New York Institute of Technology-Central
Islip 2008 BA Diverse Yes Yes
Pillsbury Baptist Bible College 2008 Religious Yes Yes
St Vincent Catholic Medical Center New
York-Brooklyn and Queens 2008 NA No Yes
Vennard College 2008 Religious Yes Yes
Weston Jesuit School of Theology 2008 Religious Yes No
Baltimore Hebrew University Inc 2009 Special Focus Yes Yes
Beacon University 2009 Religious Yes Yes
Cascade College 2009 BA A&S Yes Yes
College of Santa Fe at Albuquerque 2009 NA NA Yes
Magnolia Bible College 2009 Religious Yes Yes
Rabbinical Seminary of Adas Yereim 2009 Religious Yes Yes
7
Table 2. List of closed institutions since AY2004 (continued)
Name
Date Deleted
from IPEDS Carnegie
Degree
Granting
Undergrad
Serving
Salem Bible College 2009 NA Yes Yes
Southeastern University 2009 MA Medium Yes Yes
Taylor University Fort Wayne 2009 BA Diverse Yes Yes
Taylor University Graduate School 2009 NA NA No
Temple Baptist Seminary 2009 Religious Yes Yes
Woodbury Institute at Champlain College 2009 BA Diverse Yes Yes
Dana College 2010 BA Diverse Yes Yes
Jones College-Miami Campus 2010 Business Yes Yes
Midwest University 2010 Religious Yes Yes
Sage College of Albany 2010 MA Large Yes Yes
Southern Catholic College 2010 BA A&S NA Yes
Southern New England School of Law 2010 Law Yes No
UPMC Presbyterian Shadyside Dietetic
Internship 2010 NA No No
Wesley College 2010 Religious Yes Yes
Ashland University Dwight Schar College
of Nursing 2011
Health
Professionals Yes Yes
Baker College Corporate Services 2011 BA Diverse Yes Yes
Baltimore International College 2011 Special Focus Yes Yes
Bethany University 2011 BA Diverse Yes Yes
Cleveland Chiropractic College of Los
Angeles 2011
Health
Professionals Yes Yes
Hebrew Union College-Jewish Institute of
Religion-Cincinnati 2011 Religious Yes No
Hebrew Union College-Jewish Institute of
Religion-Los Angeles 2011 Religious Yes No
McLeod Regional Medical Center School
of Medical Technology 2011 NA No No
Trine University-South Bend Regional
Campus 2011 BA Diverse Yes Yes
This approach allowed us to examine the differences between institutions that closed and
institutions that remained open rather than looking at a single institution over time. The in-
common differences revealed through data analysis provide the basis for the at-risk indicators we
propose for consideration by college and university administrators of the small enrollment
private institution.
Findings
As seen in Table 2, private institution closures are dominated by two types of institutions:
religious institutions and those not classified by the Carnegie Commission (typically non-degree
granting institutions). These 14 religious and 10 unclassified institutions make up over 42% of
closures during this time. In addition, small bachelor’s granting institutions (those classified
with a focus on arts and sciences or diverse fields) contribute another nearly 25%.
8
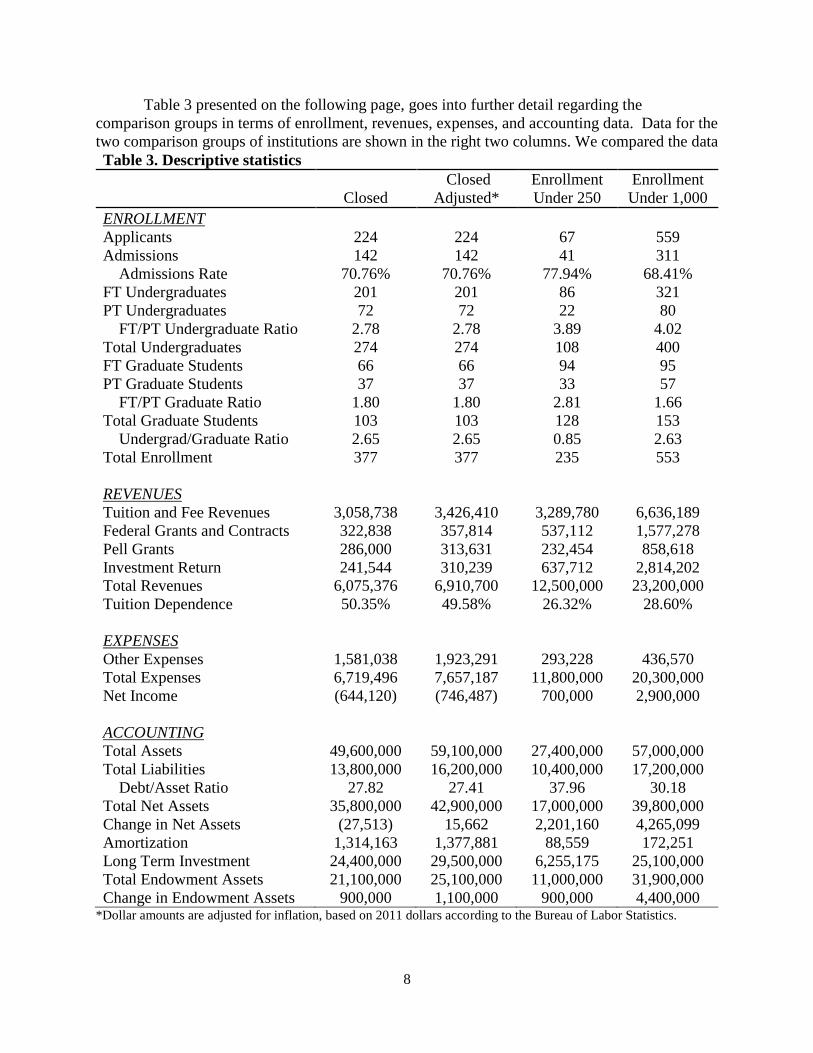
Table 3 presented on the following page, goes into further detail regarding the
comparison groups in terms of enrollment, revenues, expenses, and accounting data. Data for the
two comparison groups of institutions are shown in the right two columns. We compared the data
Table 3. Descriptive statistics
Closed
Closed
Adjusted*
Enrollment
Under 250
Enrollment
Under 1,000
ENROLLMENT
Applicants 224 224 67 559
Admissions 142 142 41 311
Admissions Rate 70.76% 70.76% 77.94% 68.41%
FT Undergraduates 201 201 86 321
PT Undergraduates 72 72 22 80
FT/PT Undergraduate Ratio 2.78 2.78 3.89 4.02
Total Undergraduates 274 274 108 400
FT Graduate Students 66 66 94 95
PT Graduate Students 37 37 33 57
FT/PT Graduate Ratio 1.80 1.80 2.81 1.66
Total Graduate Students 103 103 128 153
Undergrad/Graduate Ratio 2.65 2.65 0.85 2.63
Total Enrollment 377 377 235 553
REVENUES
Tuition and Fee Revenues 3,058,738 3,426,410 3,289,780 6,636,189
Federal Grants and Contracts 322,838 357,814 537,112 1,577,278
Pell Grants 286,000 313,631 232,454 858,618
Investment Return 241,544 310,239 637,712 2,814,202
Total Revenues 6,075,376 6,910,700 12,500,000 23,200,000
Tuition Dependence 50.35% 49.58% 26.32% 28.60%
EXPENSES
Other Expenses 1,581,038 1,923,291 293,228 436,570
Total Expenses 6,719,496 7,657,187 11,800,000 20,300,000
Net Income (644,120) (746,487) 700,000 2,900,000
ACCOUNTING
Total Assets 49,600,000 59,100,000 27,400,000 57,000,000
Total Liabilities 13,800,000 16,200,000 10,400,000 17,200,000
Debt/Asset Ratio 27.82 27.41 37.96 30.18
Total Net Assets 35,800,000 42,900,000 17,000,000 39,800,000
Change in Net Assets (27,513) 15,662 2,201,160 4,265,099
Amortization 1,314,163 1,377,881 88,559 172,251
Long Term Investment 24,400,000 29,500,000 6,255,175 25,100,000
Total Endowment Assets 21,100,000 25,100,000 11,000,000 31,900,000
Change in Endowment Assets 900,000 1,100,000 900,000 4,400,000 *Dollar amounts are adjusted for inflation, based on 2011 dollars according to the Bureau of Labor Statistics.
9
for these two groups with that of the small four-year private institutions that closed in the last 10
years, 2004 to 2013, looking for major differences in enrollment, revenues, expenses, and
accounting statistics.
These statistics lead to the following findings:
Enrollment
In terms of enrollment, applications at institutions that closed were higher than
comparable institutions, on average. However, the admissions rate is slightly lower,
though comparable to larger enrollment institutions.
One of the clear differences is the full-time to part-time enrollment ratio. At institutions
that closed, there is a large part-time enrollment when compared to full-time
undergraduates. For other institutions, the ratio averaged roughly 4 full-time
undergraduates for every part-time enrollee, while this was less than 3 at institutions who
failed.
Graduate student enrollment was similar, but not as drastic, especially when compared to
larger enrollment institutions. For the undergraduate to graduate enrollment ratio,
institutions that closed had large undergraduate enrollments when compared to their
graduate offerings, similar to larger enrollment institutions. However, small enrollment
institutions that are still in operation tend to average larger graduate enrollments, likely
because of specific degree offerings in law and medicine.
Revenues
The next major category of comparison was institutional revenues. While overall tuition
revenue at closed institutions is comparable to other institutions, tuition per student
enrolled is much smaller at only $9,089 per student enrolled as compared to $13,973 at
other small institutions and $12,002 at larger institutions.
This is consistent for the other types of revenues as well. For example, closed institutions
reported federal grants and contracts per student less than 40% of what is reported at
other small enrollment institutions.
Investment returns are also quite small. As a percentage of total revenues, investment
returns at closed institutions are on par with other small enrollment institutions, but in
terms of real dollars, they are small and show great variability between institutions.
Most importantly, tuition dependency appears highly related to financial viability.
Private institutions currently in operation average just over 25% of their revenues coming
from tuition. Institutions that failed reported a tuition dependency of over 50%.
Expenses
For expenditures, the amount spent on services such as instruction and student services
was comparable across all three types of institutions.
“Other Expenditures” was significantly higher at institutions that closed. While the
specifics of these expenditures are unavailable, the accounting figures that follow indicate
that it may be attributable to capital projects, large interest payments, or a combination of
the two.

10
Most importantly, however, is the fact that expenses exceed total revenues for closed
institutions. Institutions that failed were operating in the red, reporting expenses that
exceeded revenues by $644,120 on average – even higher, at nearly $750,000 after
adjusting for inflation. Institutions of a similar size reported net income of $700,000, a
total difference of over $1.3 million. Institutions with larger enrollments reported net
income of $2.9 million. These stark differences are indicative of the financial struggles
illustrated in case studies and newspaper reports.
Accounting data
Going into more financial detail, the accounting information provides more specifics about
assets, liabilities, and institutional financial portfolios.
Assets at closed institutions averaged near $50 million with liabilities approaching $14
million at the time of closure.
While the amount of liabilities is higher than those reported at other small institutions, the
debt to asset ratio is lower. Instead, other types of institutions averaged liabilities that
were over 30% of their total assets, while institutions that closed only averaged 28%.
This would appear encouraging, however the makeup of these liabilities could be
problematic.
Amortization, which includes debt payments, is very high at institutions that closed. This
could be due to poor terms on their long term liabilities or too rapid of expansion for
capital projects. For example, long term investments at failed institutions was an adjusted
$29.5 million, exceeding larger enrollment institutions, and nearly 5 times the amount at
other small institutions.
On the asset side, the change in net assets was negative for institutions that closed – or
very small after adjusting for inflation - while other small institutions reported gains of
$2.2 million while large enrollment institutions reported increases of $4.2 million.
In addition, total endowment assets averaged over $25 million at small institutions that
failed while only $11 million at comparable small institutions or nearly $32 million at
larger enrollment institutions.
The major difference between the three being that the change in endowment assets was
only $1.1 million at failed institutions, similar to the amount reported at other small
institutions who report half the total endowment. This resulted in only a 4.3% change at
failed institutions while other small institutions reported an 8.2% change and larger
institutions reported a 13.8% change.
These indicators suggest that institutions that closed may have over-expanded too rapidly,
taken out debt with poor terms, and/or failed to properly manage their assets.
At-Risk Indicators for Small Four-Year Private Institutions
Based on the findings in the IPEDS comparison of data, the following 10 risk factors are
indicated for small private institutions.
1. Institutions with small enrollment are potentially at risk.
2. Religious and non-degree granting institutions are now potentially at risk given the
financial circumstances.
11
3. Institutions reliant on part-time enrollees are potentially at risk and these institutions
could benefit from pushing part-time enrollees into full-time status.
4. Rapid expansion of graduate and certificate programs could put an institution at risk if
they are not aligned with an intuition’s academic and financial portfolio.
5. Tuition per student may be related to financial viability, putting institutions that are
inefficient in their tuition setting at risk.
6. Institutions with large tuition dependency are potentially at risk.
7. Large expenses on interest payments put institutions at risk.
8. Large capital expenses without long-term financial stability put institutions at risk.
9. Institutions operating with expenses that exceed total revenues are at risk of failure.
10. Institutions without strong support from private donations and investment returns put a
strain on overall revenue diversity that can put institutions at risk.
Discussion and Conclusion
In this study, we sought to investigate the existing data literature and institutional data on
small colleges and universities that closed within the last decade. We sought to identify the key
indicators that were common to these closed institutions. The ten factors indicated above are
consistent with Martin and Samels’ (2009) at-risk indicators. They also mirror the three themes
most reflective of at-risk behavior found within the literature on institutional closure. First, a
high dependence on tuition as a primary source of revenue can be risky. This indicates the lack
of a diverse portfolio, making an institution susceptible to fluctuations in enrollment that have
the potential to drastically influence total revenues. Second, the flip-side to the tuition revenue
coin is enrollment. Small or declining enrollments can put an institution at risk of failure both in
terms of revenue and expenses. On the revenue side, small enrollments tend to be associated
with lower tuition revenues and smaller amounts of private giving. On the expense side, many
fixed and overhead costs are deferred through economies of scale that happen with larger
enrollment institutions. When institutions are small, this expense is not minimized on a per
student basis, meaning there is room for more students at little additional cost but a lack of
demand. Third, payments on capital projects, their associated operating expenses, maintenance,
and debt service overall can take up large portions of resources. This recurring long-term
expense, much like entitlement programs at the federal and state level, can limit discretionary
spending, particularly on mission oriented programs such as instruction.
The at-risk indicators we present above are derived from patterns observed within the
IPEDS institutional data for the last ten years, 2004 to 2013. They must be considered within the
contexts of individual institutional situations and the recent global financial crisis. All indicators
will not be relevant to every institution; the list is intended to be informational so that college
leaders obtain a holistic picture of the contributory factors to the closures. For instance, the data
indicates that religious colleges and universities are potentially at risk. Risk was indicated
among the 14 of 57 institutions, nearly 25% of the small religious institutions in our sample.
This best finding is significant because of its timing. It represents a stark contrast to Porter and
Ramirez’s (2009) finding that, for the 1975-2005 period, religious colleges were less likely than
secular institutions to close. What our indicator suggests is that a different time-related reality is
now at play – for small religious higher education institutions, the magnitude of the recent
financial crisis appears to have overridden any ‘enrollment advantage’ previously synonymous
with these institutions. This presents a reality check for all small institutions that have identified
with a prior comparative enrollment advantage, be it gender, religion, race, or other
demographic.
12
The data supports calls for part-time enrollees to be pushed to enroll full-time, and for
graduate degrees to be offered strategically and in line with mission orientation. These practices
are particularly consistent with the situation at Antioch College prior to its 2007 closure where
its more commercially-driven graduate programs were relied on to provide a financial lifeline to
its failing undergraduate program. Indeed, the IPEDS enrollment statistics indicate that the issue
with closure is more than lack of interest or enrollment. Applications and enrollments at the
closed institutions are shown to actually exceed other small institutions, on average, but the
degree offerings (graduate degrees) and student makeup (part-time enrollment) appear to play a
much larger role in determining institutional viability and success.
Institutions with large tuition dependency are potentially at risk. The lack of revenue
diversity, particularly in terms of federal grants and contracts and investment return, places
institutions at risk of relying too heavily on tuition to support their operations. This, combined
with the tuition per student figures and part-time enrollment, implies that these institutions are
not being fully supported by their students. Instead, they need to try to convert part-time
students into full-time enrollees and look for other sources of revenue to support their operations.
In particular, they may be better able to leverage federal grants by improving full-time
enrollment rather than focusing on part-time instruction.
Large expenses on interest payments and large capital expenses without long-term
financial stability put institutions at risk. If institutions are to survive in the long-term, they must
be mindful of both their short-term and long-term needs. While capital projects may seem
attractive to boost enrollments, the financial commitment associated with expansion is long-term
and can have dire consequences if they take up too large a percent of total resources. Similarly,
undergoing capital expansion is unwise if it is done at the expense of existing facilities.
The literature abounds with reports of failed institutions at which expenses exceeded total
revenues. According to Denneen & Dretler (2012):
Universities simply cannot afford to increase costs in nonstrategic areas and take
on more debt, if they want to survive. It is imperative that universities become
much more focused on creating value from their core. That will require having a
clear strategy, streamlined operations, a strong financial foundation, trust and
accountability, and a willingness to invest only in innovations that truly create
value for the institution. Higher education in the United States is at a tipping
point. In its time of need, the leaders of our colleges and universities have a
tremendous opportunity to reshape and reinvent an industry that is directly linked
to our economic prosperity and the hopes and dreams of millions.
We seek to bring these key indicators of financial health to the attention of college and
university administration. The indicators are drawn from small institutions that closed within the
last decade. More than any other indicators, these are pertinent in that they reflect current
financial challenges facing higher education in this country. While nothing new, the ten risk
factors teased out from IPEDS data suggest critical focal points for institutional leadership, the
strategies for which need to be fleshed out based on unique institutional features. As institutions
move forward in this new economic climate for higher education, we stress that they be mindful
of both short-term and long-term plans, mission orientation, ability to adapt, and fiscal
responsibility in order to not only sustain their operations, but thrive in the modern higher
education environment.
13
REFERENCES
Biemiller, L. (2007, June 21). Neglected maintenance contributed to Antioch college’s woes. The
Chronicle of Higher Education. Retrieved from
http://chronicle.com/blogs/buildings/neglected-maintenance-contributed-to-antioch-
colleges-woes/4677
Carlson, S. (2007, June 29). A house divided. Chronicle of Higher Education, 53(43), A.20-
A.22. Retrieved from http://chronicle.com/article/A-House-Divided-How-Antioc/123134/
Chabotar, K. J. (2010). What about the rest of us? Small colleges in financial crisis. Change,
Change: The Magazine of Higher Learning, 42, 4, 6-12.
Council for Advancement and Support of Education (2013). Statement on the Results of the
2012 Voluntary Support of Education Survey: Statement by CASE President John
Lippincott. Retrieved from
http://www.case.org/About_CASE/Newsroom/Press_Release_Archive/Statement_on_the
_Results_of_the_2012_Voluntary_Support_of_Education_Survey_.html
Denneen, J & Dretler, T. (2012). The financially sustainable university: A focused strategy can
help colleges and universities reinvent their industry and stop spending beyond their
means. Boston, MA: Bain & Company, Inc. and Sterling Partners. Retrieved from
http://www.bain.com/Images/BAIN_BRIEF_The_financially_sustainable_university.pdf
De Santis, N. (2012, July 19). Small college in Mass. that serves low-income women faces
closure. The Chronicle of Higher Education. Retrieved from
http://chronicle.com/blogs/ticker/small-college-in-mass-that-serves-low-income-women-
faces-closure/45781
Fain, P. (2007, June 22). Antioch's closure signals the end of an era. The Chronicle of Higher
Education. Retrieved from http://chronicle.com/article/Antioch-s-Closure-Signals-
the/4921
Gravois, J. (2004, November 22). William Tyndale College to close its doors. The Chronicle of
Higher Education. Retrieved from http://chronicle.com/article/William-Tyndale-College-
to/20096
Higher education: The college-cost calamity. (2012, August 4). The Economist. Retrieved from
http://www.economist.com/node/21559936
Jaschik, S. (2007, June 13). Antioch to close main college. Inside Higher Ed. Retrieved from
http://www.insidehighered.com/news/2007/06/13/antioch
Jaschik, S. (2009, April 17). Survival of the wealthiest. Inside Higher Ed. Retrieved from
http://www.insidehighered.com/news/2009/04/17/closing
14
Koon, D. J. (2009, August 20). On the Brink of Disaster? The John William Pope Center for
Higher Education Policy. Retrieved from
http://www.popecenter.org/commentaries/article.html?id=2220
MacTaggart, T. (2007, October). The realities of rescuing colleges in distress. Chronicle of
Higher Education, 54(7), B11. Retrieved from http://chronicle.com/article/The-Realities-
of-Rescuing/16705
Martin, J., Samels, J.E & Associates (2009). Turnaround: Leading stressed colleges and
universities to excellence. Baltimore, Maryland: The Johns Hopkins University Press.
Moody’s Investor Services. (2012, January 10). More US Colleges face stagnating enrollment
and tuition revenue, According to Moody’s Survey. Retrieved from
http://www.careercollegecentral.com/pdf/moodysreport.pdf
National Association of College and University Business Officers and Commonfund Institute
(2013). 2012 NACUBO-Commonfund Study of Endowments. Washington DC: NACUBO.
Selingo, J. J. (2013, April 12). Colleges struggling to stay afloat. The New York Times.
Retrieved from http://www.nytimes.com/2013/04/14/education/edlife/many-colleges-
and-universities-face-financial-problems.html?pagewanted=all&_r=0
Troop, D. (2013, February 1). In a volatile economy, colleges’ endowment returns fall flat.
Chronicle of Higher Education. Retrieved from http://chronicle.com/article/In-a-Volatile-
Economy/136941/
National Center for Education Statistics, (2011). Integrated Postsecondary Education Data
System. Washington, D.C.: U. S. Department of Education.
Van Der Werf, M. (2000, May 12). The death of a small college. Chronicle of Higher Education,
46(36) A40, A42. Retrieved from https://chronicle.com/article/The-Death-of-a-Small-
College/18748/#!/subscriptions/offers/?PK=M1224&cid=MH2WPW1
Van Der Werf, M. (2001, March 23). More colleges are seeing the virtues of merging. Chronicle
of Higher Education, 47(28) A26-A30. Retrieved from http://chronicle.com/article/More-
Colleges-Are-Seeing-the/20069
Van Der Werf, M. (2002, March 1). Recession and reality set in at private colleges. Chronicle of
Higher Education, 48(25) A26-A28. Retrieved from
http://chronicle.com/article/RecessionReality-Set-In/15403


Learning from Closed
Institutions: Indicators
of Risk for Small Private
Colleges and Universities
1031 17th
Avenue, South • Nashville, TN 37212-2201 • Telephone 615-242-6400 • Fax 615-242-8033
www.ticua.org