learning and the economics of small decisionseeh017200/papers/learningchapter.pdflearning and the...
TRANSCRIPT

1
Learning and the Economics of Small Decisions
Ido Erev and Ernan Haruvy1
Technion and University of Texas at Dallas
To appear in the second volume of “The Handbook of Experimental Economics” edited
by John H. Kagel and Alvin E. Roth.
August, 2013
Introduction
Mainstream analysis of economic behavior assumes that economic incentives can
shape behavior even when individual agents have limited understanding of the
environment (see related arguments in Nash2, 1950; Smith3, 1962). The shaping process
in these cases is indirect: The economic incentives determine the agents’ experience, and
this experience in turn drives future behavior. Consider, for example, an agent that has to
decide whether to cross the road at a particular location and time. The agent (say a
chicken) is not likely to understand the exact incentive structure and compute the implied
equilibria. Rather, the agent is likely to rely on experience with similar situations. The
economic environment shapes this decision because it determines the relevant
experience.
The current chapter reviews experimental studies that examine this shaping process.
In order to clarify the relationship of the research reviewed here to classical research in
behavioral and experimental economics it is constructive to consider the distinction
1 Much of this paper was written when Erev was a Marvin Bower Fellow at Harvard Business School. We thank Olivier Armantier, Greg Barron, Gary Bolton, Eyal Ert, Dan Friedman, Glenn Harrison, Teck Ho, John Kagel, Elena Katok, Steven M. Kemp, Amnon Rapoport, Al Roth, Andrew Schotter, Uri Simonsohn, Trent Smith, Dale Stahl, Nat Wilcox, and Eldad Yechiam for useful comments. 2 “It is unnecessary to assume that the participants have full knowledge of the total structure of the game,
or the ability and inclination to go through any complex reasoning process” (Nash, 1950, p. 21) 3Smith showed that competitive equilibrium could be attained with small numbers of buyers and sellers
with no knowledge of others' costs or values.

2
between "decisions from description" and "decisions from experience" (Hertwig et al.,
2004) exemplified in Figure 1. Classical studies in behavioral economics tend to focus
on decisions from description: They examine how people decide when they can rely on a
complete description of the incentive structure. In contrast, the research reviewed here
focuses on decisions from experience. In a pure decision from experience task (like the
one demonstrated in Figure 1) the decision makers do not receive a prior description of
the incentive structure. Rather, they have to rely on past experience, and gain relevant
experience in the course of the experiment.
<Insert Figure 1>
The two lines of decision research have similar goals, but take very different routes
towards achieving these goals. As a result, the two routes often identify and focus on
different behavioral regularities. The main difference between the two routes is reflected
by the relationship of the two lines of research to rational economic theory. The classical
studies of decisions from description were designed to test the rationality assumption.
The most influential papers in that research stream (e.g., Allais, 1953; Kahneman &
Tversky, 1979; Fehr and Schmidt, 1999; Bolton & Ockenfels, 2000) present interesting
deviations from rational choice, and elegant refinements of the rational models that
capture these deviations. Gigernzer and Selten (2001) broadly refer to this line of
research as the "subjective expected utility correction project." In contrast, the studies of
decisions from experience focus on situations for which rational decision theory does not
have clear predictions. When decisions makers rely on past experience, almost any
behavior could be justified as rational given certain prior beliefs. Thus, the study of
decisions from experience is not designed to test or refine rational decisions theory; it is
rather intended to expand the set of situations that can be addressed with economic
models that provide clear and useful predictions.
The significance of the difference between the behavioral regularities discovered in
the two line of decision research is demonstrated by the effect of rare (low probability)
events. Experimental studies reveal that people exhibit oversensitivity to rare events in
decisions from description (Kahnemna & Tversky, 1979), and the opposite bias when
they rely on experience (see Barron & Erev, 2003, and Section 1.1.3 below). This

3
"experience-description gap" suggests that the common efforts to use models that were
calibrated to capture decisions from description in order to address decisions from
experience can lead to mismatched conclusions.
Many natural decision problems fall in-between decisions from description, and
decisions from experience. For example, in 2003 when the USA President George W.
Bush had to decide whether or not to engage militarily in Iraq he could rely on a
description of the incentive structure, prepared by his consultants, but he could also rely
on historical experiences in similar situations. And it is possible that these experiences
could suggest that the description can be biased.
The importance of past experience is particularly clear in the context of small
decisions. Small decision problems are defined here as situations in which the
performance of a task requires decisions, and the expected consequence of each decision
is relatively small. Many natural activities involve small decisions. For example, the
road crossing task, described earlier, implies several small decisions. The agent can
choose whether to start crossing in several points in time, and can then choose to change
his or her mind.
We believe that small decisions can be of large economics importance. In many
cases, small decisions can be highly consequential in the aggregate, and they can also be
consequential in some rare specific cases. For example, small driving-related decisions
lead to traffic jams, costly accidents, injuries and even fatalities. Moreover, in many
cases small decisions shape subsequent big decisions. For instance, the small decisions
between "doing homework" or "watching TV" as a kid, can affect the available
alternatives in the big decisions among different career paths. Similarly, the big decision
between different investment portfolios is only made if the agent has made the small
decision to spend time (at a particular point in time) on evaluating her investments.4
4Another reason for our interest in small decisions is the feeling that external validity of laboratory research is larger in the context of small decisions that are similar to the laboratory tasks in many ways (e.g., low stakes, limited decision time), than in the context of large decisions. So, we have more to say about small decisions.

4
Economics, psychology, and the clicking paradigm. Most of the studies of learning
and decisions from experience were conducted by psychologists, and were not designed
to evaluate of the effect of the quantitative features of the incentive structure; they
typically used non-monetary reinforcements like food, electric shocks, unpleasant noises,
and verbal recognition. In order to clarify the economic implications of these studies we
try to replicate the main results using the clicking paradigm presented in Figure 1. As
demonstrated in Figure 1, the clicking paradigm focuses on the effect of experiencing
monetary payoffs. The subjects do not receive prior description of the incentive
structure, and have to base their decisions on the feedback (observed monetary outcomes)
of previous decisions. To facilitate evaluation of the effect of this experience, each
experiment includes many trials.
In order to illustrate the relationship of the current replications to the original
demonstrations of the classical phenomena, we start the discussion of the key phenomena
with a description of the original studies. Yet, we pay agreater attention to the clicking
experiments.
Another advantage of the clicking replications involves the standardization of the
experimental conditions (Hertwig & Ortmann, 2002). For example, it allows the use of
the same instructions, same experimental design, and same subject population in all the
replications. Since we focus on phenomena that were already documented in a wide set
of conditions with wide set of subject populations (including very different animals), the
focused standardization should not impair external validity.5 The standardization is
expected to clarify the role of the key factor: the effect of experiencing the incentive
structure, and facilitate the development of models that capture this effect.
5 Erev and Livene-Tarandach (2005) showed that the attractive features of standard experimental
paradigms could be used to reduce one of the differences between the natural and the social sciences. The difference they considered involves the frequency of exam questions that require predictions of the outcome of a particular experiment. Many of the questions in the natural sciences (about 64% in the sample of a physics GRE exams, used to evaluate applicants to graduate school), and very few questions in the social sciences (about 10% of the questions in Psychology GRE exam) require predictions. The focus on standard experimental paradigms can be used to reduce this gap by facilitating the development of short and clear prediction questions in the social sciences.

5
Three cognitive factors and the organization of the current review. Decisions from
experience are likely to be affected by three classes of cognitive factors (see Erev &
Roth, 1999). The first factor involves the "cognitive strategies" considered by the agents;
that is, the strategies from which the agents learn. The cognitive strategies includes the
possible actions (stage game strategies, "Select the left Key" or "Select the right key" in
the basic clicking paradigm), but can also include other strategies like "Try to
reciprocate" (see Section 3.3) or "Select best reply to the instructions" (see Section 1.9).
The second factor involves the "exploration policy". That is, the tradeoff between
collecting information and using the available information in order to get the best
outcomes (see March, 1991). The third factor is the "choice rule": the evaluation of past
experiences that determines which strategy is preferred.
We believe that all three factors are important, but we also think that better
understanding of the choice rule is likely to be most useful. Our belief is based on the
observation that the "cognitive strategies" and the "exploration policy" tend to be
situation specific. Small changes in the environment can change the strategies available
and considered by the agents, and can change the value of exploration. In contrast, it is
possible that the choice rule reflects a more robust cognitive process that is stable over
situations and maybe also over species.
This belief led us start the current review with a focus on phenomena that can be
replicated even when the effect of the first two factors is minimized. Specifically, we
start with a focus on situations in which (1) it is reasonable to assume that the strategies
considered by the agents can be approximated by the possible actions, and (2) exploration
does not add information. The most important part of the current review is Section 1.1
that presents six robust behavioral phenomena that emerge in this setting, and a simple
model that summarizes them. We consider situations in which exploration is important in
Section 1.2, and delay the discussion of situations in which more sophisticated strategies
are likely to be important to Sections 2 and 3.
Section 2 reviews studies of learning in dynamic environments, and Section 3
reviews studies of learning among of large number of alternatives. The results highlight
interactions between the basic properties of learning, summarized in Section 1, and other
factors that can be abstracted as "cognitive strategies" that are implied by the task.

6
Section 4 reviews studies that examine the effect of social interactions on learning.
The first part of this section highlights the generality of the basic properties of learning
reviewed in first sections. There are many situations in which social behavior can be
accurately predicted based on simple models that were designed to capture behavior in
individual choice tasks. Yet, there are also interesting exceptions to this generality. The
main exceptions can be summarized with the assertion that in certain settings prior
information changes the strategies that are considered in the learning process.
The chapter concludes with a discussion of the practical implications of
experimental learning research. The discussion focuses on the economics of small
decisions.
1. The basic properties of decisions from experience
The current section reviews the learning phenomena that we consider to be "most
basic." They are most basic in the sense that they can be reliably replicated in the most
basic versions of the clicking paradigm. We try to summarize the experimental result
with the set of "sufficient regularities." That is, we hope that models that best capture
these regularities will provide useful ex-ante predictions of behavior in any set of
problems drawn from the population of decision problems considered here. Section 1.1
presents the regularities that can be replicated when the role of exploration is minimized,
and Section 1.2 examines the effect of an increase in the value of exploration. Section
1.3 presents two choice prediction competitions that compare alternative models, and
explore their predictive value.
1.1 Six basic regularities, and a model
Recall that the current review is based on the distinction between three cognitive
factors that drive decisions from experience: The cognitive strategies, the exploration
policy, and the choice rule. The present sub-section tries to clarify the basic properties of
the choice rule. In order to achieve this goal it focuses on phenomena that can be
replicated even when the role of sophisticated cognitive strategies and of the exploration
policy is minimized. This "minimization" is achieved by using the 2-alternative clicking
paradigm with complete feedback (cf. Figure 1), and a static payoff rule. After each

7
choice in the clicking experiments, considered here, the agents receive feedback
concerning their obtained payoff (the payoff from the key they selected), and the forgone
payoff (the payoff that she could obtained had they selected the second key). The payoff
of each key is drawn from a payoff distribution associated with that key. For example, if
the key is associated with payoff distribution "11 with probability .5, -9 otherwise," it
payoff will be 11 in 50% of the trials, and -9 in the other 50%. The fact that payoff rule
is static implies that the distributions do not change during the experiment.
Our review uncovers six robust behavioral regularities that emerge in this setting.
All six regularities imply deviations from maximization of expected return. Yet we
believe that they do not imply deviations from “ecologically reasonable” behavior. In
order to clarify this assertion we conclude the presentation of each behavioral regularity
with an “ecological justification.” Section 1.7 presents a model that quantifies these
justifications, and the subsequent sections clarify the model’s relationship to other
models, and its predictive value.
1.1.1 The Law of Effect
Thorndike (1898) studied how cats learn to escape from puzzle boxes. The
experiments included several trials: Each trial started with a placement of a cat in a
puzzle box and ended when the cat exited the box. Evaluation of the learning curves
(time to escape as a function of trial number) led Thorndike to conclude that the learning
was gradual and stochastic. There was no evidence for sudden jumps in performance.
Thorndike summarized this observation with the law of effect: Choices that have led to
good outcomes in the past are more likely to be repeated in the future.
Studies that use the clicking paradigm reveal a similar pattern. Subjects tend to
select the alternative that led to good outcome in the past, and the learning curves appear
to reflect a gradual and stochastic process. Figure 2 demonstrates this pattern. Each
curve in this figure summarizes the behavior of one participant in the first 25 trials of a
simple experiment. The experiment involved a trivial choice task: One option, referred to
as 'H' (High payoff) always provided a payoff of 1 Shekel, and the second option always
led to a payoff of 0. The experiment used the basic clicking paradigm. That is, the
participants did not receive prior information concerning the payoff rule, and could rely

8
on feedback concerning the obtained and forgone payoffs. The results, presented in five
blocks of five trials each, reveal that by the last block all three subjects learned to prefer
the better option (H). Yet, the learning process is noisy. For example, the proportion of
optimal choices of the “circle” subject go up to 100% by the second block, then go down
to 60% in the third block, and then go up to 100% in the fifth block.
<Insert Figure 2>
An ecological justification: Exploration. Recall that the current analysis focuses
on conditions that minimize the value of exploration. The agents' actions did not affect
their feedback. However, the subjects could not know with certainty that this is the case.
Thus, the observed deviations from "best reply to past experiences," can be an indication
of an exploration the effect of selecting the "0" key.
1.1.2 The payoff variability effect
Myers and Sadler (1960) studied decisions from experience using a "card
flipping" paradigm. In each trial of their studies, the participant saw one side of a card
and had to decide whether to accept the payoff written on that side (the safe alternative),
or the payoff written on the unobserved side of the card (the riskier option). Participants
received feedback concerning their payoffs after each choice (the card was flipped only if
the participant chose the riskier option). The results revealed that an increase in the
payoff variability of the risky option (the variability of the payoff distribution on the
unobserved side) reduced the proportion of choices that maximized expected payoff.
Busemeyer and Townsend (1993) termed this pattern the "payoff variability effect" and
highlighted its robustness.
We replicated this pattern in the clicking paradigm with the study of Problems 1,
2 and 3 (the H-rate in the brackets on the right are the proportion of H choices over all
trials, EV is the expected value of the gamble):
Problem 1: (r=200, n=20, FB=complete, payoff in shekels in a randomly selected trial)
H 1 with certainty [H-rate: 96%]
L 0 with certainty

9
Problem 2 (same procedure as in Problem 1)
H +11 with probability 0.5
-9 otherwise (EV = 1)
[H-rate: 58%]
L 0 points with certainty
Problem 3 (same procedure as in Problem 1)
H 0 with certainty [H-rate: 53%]
L 9 with probability 0.5
-11 otherwise (EV = -1)
Problems 1, 2 and 3 were run in the same experiment in a within-participant
design. Each of 20 participants (n=20) faced each problem for 200 rounds (r=200) under
the clicking paradigm with complete feedback (FB = complete). The order of the three
problems was random. The participants did not receive a description of the problems, but
were informed that the experiment includes three independent parts, and when a new part
starts. The final payoff for the experiment was the sum of a show-up fee of 30 Shekels
and the outcome of one randomly selected trial.
Notice that Problems 1 and 2 involve a choice between alternative H, with an EV
of 1 shekel, and alternative L, with an EV of 0. The higher EV maximization rate (H-
rate) in Problem 1 (96%) compared to Problem 2 (58%) can be described as indication of
risk or loss aversion: H was less attractive (in Problem 2) when it increased the variance
and was associated with losses. However, this “risk and/or loss aversion” explanation is
inconsistent with a comparison of Problem 2 and Problem 3. In Problem 3, risk aversion
and loss aversion implies maximization (H choices). The results show H-rate of only
53%. Figure 3 presents the observed choice rate of H in blocks of 20 trials. It shows that
the differences between the three conditions are relatively robust over time.
<Insert Figure 3>

10
Additional studies, reviewed in Erev and Barron (2005), demonstrate the
robustness of the payoff variability effect. These studies reveal robustness to the payoff
sign, to incomplete feedback, and to the number of possible outcomes. 6
Chasing, the big eyes effect, and contingent loss aversion. One reasonable
explanation of the results in Problems 1, 2 and 3 involves the assertion of large individual
difference in risk attitude and/or in the attitude toward losses. For example, the
aggregated results are consistent with the hypothesis that about half the participants are
risk averse, and the other half are risk seekers. However, this explanation has important
shortcomings. One clear shortcoming is the fact that the correlation between the R-rate
in Problems 2 and 3 is not large (see Section 1.1.6). A more interesting shortcoming is
suggested by studies that examine investment decisions. These studies show that
investors tend to “chase” past returns (see Kliger, Levy & Sonsino, 2003; Grinblatt,
Titman, & Wermers, 1995). That is, they tend to invest in assets that led to high earnings
in the past. Grosskopf et al. (2006) shows that this "big eyes effect" implies that payoff
variability can lead most agents to behave as if they are risk and/or loss seekers. Ben
Zion et al. (2010) clarify the robustness of this observation in a study that focuses on the
following problem:
6 The payoff variability effect is related to the role of flat payoff functions. Harrison (1989) notes that the deviation from maximization (and equilibrium) observed in many experimental studies can be a product of the low expected cost of these deviations relative to the required effort to find the optimal choice. Merlo and Schotter (1992) refine this assertion and note that there may be large differences between the expected and the experienced costs. The payoff variability effect suggests that the best predictor of these deviations is the relative cost: the average cost relative the payoff variance. This suggestion is consistent with Harrison assertion under the assumption that payoff variability is one of the factors that increases the effort required to find the optimal choice.

11
A simplified investment problem (r=100, n=30, FB=complete, 1 point=¢0.25, pay rule
= random trial)
R1 4x (EV=0) R2 2y –2x (EV = 0) S x+y+5 (the mean of R1 and R2 plus 5, EV = 5) [S-rate = 25%]
where x is a draw from a normal distribution with a mean of 0 and standard deviation of 300 (x~N(0,300)), and y is a draw from a normal distribution with a mean of 0 and standard deviation of 10 (y~N(0,10)).
Ben Zion's et al.'s study can be described as a simulation of a simplified
investment task. Options R1 and R2 simulates two risky stocks, and Option S simulates
an attractive index fund that provides the mean of R1 and R2 plus a small bonus. Thus,
Option S has the highest mean and lowest variance. The experiment used the clicking
paradigm with complete feedback. In addition, the participants received a complete
description of the payoff rule. The description emphasized the fact that S provides the
mean of R1 and R2 plus 5.
The results reveal random choice in the first trial (S-rate of 33%), and a decrease
in the tendency to select S with experience. That is, experience with the high payoff
variability investment problem impaired maximization. The S-rate in the last block of 20
trials was only 18%. This value is much lower than the 50% rate implied by the assertion
that about half of the participants are risk and/or loss averse, and lower that the 33%
implied under random choice.
The correlation effect. Diederich and Busemeyer (1999) highlight an important
boundary condition for the payoff variability effect. When the payoffs of the different
alternatives are positively correlated, the availability of information concerning foregone
payoffs eliminates the payoff variability effect. In the extreme case in which Alternative
H dominates L in all trials, payoff variability has little effect.
Grosskopf, Erev and Yechiam (2006) demonstrate the robustness of this
"correlation effect” in the clicking paradigm. They focused on the following two
problems:
Problem 4 (r=200, n=10, FB=complete, accumulated payoffs, 10 units=.01 Shekel)
H N(120,10) +ct (EV = 120) [H-rate: 75%]
L N(100,10) +dt (EV = 100)

12
Problem 5 (same procedure as in Problem 4)
H N(120,10) +ct (EV = 120) [H-rate = 98%]
L N(100,10) +ct (EV = 100)
The exact payoffs were the rounded sum of two terms: A draw from a normal
distribution with a mean of 100 or 120 and standard deviation of 10, and (ct or dt) a draw
the distribution (-50 with p = 1/3; 0 with p=1/3; +50 otherwise). The values of ct and dt
were independent. Thus the payoffs of the two alternatives are positively correlated in
Problem 5, but are not correlated in Problem 4. The feedback after each trial was
complete: The participants saw the obtained and the foregone payoffs. The final payoff
was the sum of the obtained payoffs with the conversion rate of 1 Shekel per 1,000
points. The results show a clear correlation effect. The correlation increased the
maximization rate from 75% (in Problem 4) to 98% (in Problem 5). Thus, when the
correlation is high subjects can learn to maximize expected return.
Probability learning, matching and overmatching. Many of the early studies of
decisions from experience used the probability learning paradigm. In each trial of a
typical study the participants are asked to guess if a target light bulb will flash. The
probability of a flash is kept constant throughout the experiment. Correct predictions lead
to a small gain, and incorrect prediction lead to a lower payoff (0 or a small loss). Grant
et al. (1951) found an almost perfect match between the true flash probability and the
probability of the choice “yes” in trials 55 to 60 of their “training phase.” For example,
when the probability of a flash was 0.75, the proportion of “yes” choices in the last block
was 75%. Notice that this behavior reflects deviation from maximization: When the
probability of flash is 0.75, maximizing reinforcement requires 100% “yes” choices.
This deviation from maximization, known as “probability matching,” triggered
influential studies and lively debates (see Estes, 1950, 1964; Bush & Mosteller, 1955;
Suppes & Atkinson, 1960; Edwards, 1961; Siegel & Goldstein, 1959; Lee, 1970; and
recent analysis in Bereby-Meyer & Erev, 1998; Vulkan, 2000; Shanks, Tunney, &
McCarthy, 2002). The accumulated results demonstrate that probability matching is not a
steady state. That is, longer experience slowly moves choice toward maximization. It

13
seems that behavior reflects overmatching: it falls between probability matching and
maximization. In animal studies as well (e.g., Sutherland & Mackintosh, 1971; Kagel et
al., 1995) the frequency with which the better alternative is chosen usually exceeds the
probability of reinforcement of that alternative. These results imply that behavior in
probability learning tasks can be described as an example of the payoff variability effect:
When the payoff variability is large, learning is slow and the decision makers do not learn
to maximize expected return.
A demonstration of the common findings using the basic clicking paradigm is
provided with the study (Ert and Bereby-Meyer, in prep.) of the following problem:
Problem 6 (r=500, n=20, FB=complete, accumulated payoffs, 1 unit=0.01 Shekel)
H 4 if Event E occurs
0 otherwise (EV = 2.8)
[H-rate: 90%]
L 4 if Event E does not occur
0 otherwise (EV = 1.2)
where P(E) = .7 The observed H rate was 70% in the first 50 trials, around 90% between
trial 51 and 150, and 93% between trial 401 and trial 500.
An ecological justification: Reliance on small samples and similarity based
reasoning. The payoff variability and correlation effects can be captured with the
assertion that the subjects tend to rely on small sample of past experiences (see Erev &
Barron 2005, and related observation in Fiedler, 2000; Kareev, 2000; Osborne &
Rubinstein, 1998). For example, a subject that relies on a sample of 4 observations in
trial t, recalls 4 past trials and selects the option that led to the best mean payoff in these
trials. The expected H-rate (proportion of H choices) of this hypothetical subject is 100%
in Problem 1, 69% in Problem 2 and 3, 74.6% in Problem 4, 99.8% in Problem 5, and
90% in Problem 6.
Reliance on small sample is ecologically reasonable under two common set of
conditions. First, in many settings reliance on small samples saves cognitive efforts
(Fiedler, 2000; Hertwig & Pleskac, 2010; Kareev, 2000). It is easier to recall small
samples, and it is easier to reach clear conclusions. This cognitive benefit is particularly

14
clear when people rely on the small set of the most recent past experiences. A second set
of involves conditions in which the payoff rule depends on the state of the word, and the
world can be in one of many states. The optimal strategy in this setting is to focus on
past experiences that were obtained under the current state, and ignore other past
experiences. Whereas this strategy requires rich memory based and complex
computations, people appear to follow it (see Gonzalez et al., 2003; Plonsky & Erev,
2013). And when the state of the world does not change (the situations considered
above) it can lead to deviations from maximization.
1.1.3 Underweighting of rare events and the experience-description gap
Kahneman and Tversky (1979) demonstrate that two of the best known violations
of mainstream economic theory, the tendency to buy both insurance and lotteries
(Friedman & Savage, 1948), and the Allais paradox (Allais, 1953 and see a description in
the next section), can be explained as indications of overweighting of rare events. Their
influential analysis includes two steps: They first replicated the classical violations in a
standardized experimental paradigm, and then proposed a model (prospect theory) that
captures the two phenomena. Prospect theory captures the two phenomena with the
assumption of a weighting function that reflects oversensitivity to rare events (events
whose probability is below 0.25).
The standardized paradigm used by Kahneman and Tversky focuses on "decisions
from description": The subjects were presented with a precise description of two
prospects, and were asked to select (once, and without any feedback) the prospect they
prefer. Barron and Erev (2003) have examined if the phenomena documented in this
decisions under risk paradigm, also emerge in the clicking paradigm. Their original
hypothesis was that experience will reduce the magnitude of the deviations from
maximization. The results surprised them: In several of the problems that they examined,
experience did not enhance maximization. In some cases experience led to a reversal of
the deviations captured by prospect theory: It leads to underweighting of rare events.
This pattern is known as the experience-description gap (see review in Hertwig & Erev,
2009).

15
Problems 7 and 8 demonstrate the evidence for underweighting of rare events in
decisions from experience. These problems were studied by Nevo and Erev (2012) using
the clicking paradigm with complete feedback. The participants were paid (in Shekels)
for one randomly selected trial:
Problem 7 (r=100, n=24, FB=complete, payoff in shekels in a randomly selected trial)
S 0 with certainty [S-rate = 43%]
R +1 with probability 0.9;
-10 otherwise (EV = -0.1)
Problem 8 (same procedure as in Problem 7)
S 0 with certainty [S-rate = 72%]
R +10 with probability 0.1;
-1 otherwise (EV = +0.1)
Notice that in Problem 7, the safer option has higher expected value, but the participants
tend to select the gamble. Problem 8 reflects the opposite risk preference: The gamble
has higher expected value, but the participants tend to select the safer option. As noted
by Barron and Erev this pattern can be a reflection of insufficient sensitivity to the rare
and extreme outcomes (the extreme outcomes that occur in 10% of the trials). Thus, the
participants behave as if they believe that “it wont happen to me.”
The reversed certainty effect (reversed Allais paradox). A clear demonstration of
the significance of the difference between decisions from experience and decisions from
description is provided by the study of variants of Allais’ (1953) common ratio problems.
Expected utility theory (von Neumann & Morgenstern, 1947) implies that if prospect B is
preferred to A, then any probability mixture (B, p)7 must be preferred to the mixture (A,
p). In his classic research, Allais (1953) found a clear violation of this prediction. He
constructed an example in which the more risky of two prospects becomes relatively
more attractive when the probability of winning in both prospects is transformed by a
common ratio. Kahneman and Tversky (1979) refer to this pattern as the “certainty
7 The “Probability mixture” (B,p) means: win Prospect B with probability p; win 0 otherwise.

16
effect.” Barron and Erev (2003) demonstrate that decisions from experience (in the
clicking paradigm with incomplete feedback) reflect the opposite pattern. We chose to
demonstrate this effect here in a study that uses the clicking paradigm with complete
feedback (this study was run by Barron & Erev but was not reported in their paper). The
study considers the following problems (these problems are variants of the problems used
by Kahneman and Tversky, 1979):
Problem 9 (r=400, n=24, FB=complete, accumulated payoff 1 point=.01 Shekel)
S 3 with certainty [S-rate = 36%]
R 4 with probability 0.8;
0 otherwise (EV = 3.2)
Problem 10 (same procedure as in Problem 9)
S 3 with probability 0.25;
0 otherwise (EV= 0.75) [S-rate = 51%]
R 4 with probability 0.2;
0 otherwise (EV = 0.80)
The results reveal a reversed certainty effect. The Safe option (S) was less
attractive in Problem 9-- when it was associated with certainty-- than in Problem 10—
when it was not. This pattern is consistent with the assertion that in decisions from
experience the least likely events (probability of 0.2) are underweighted.
Additional studies of the certainty effect reveal and apparent difference between
rats, bees and human subjects. MacDonald, Kagel, and Battalio (1991) show that rats
exhibit the original certainty effect: They studied variants of problems 9 and 10 with
payoff in caps of water, and found more S choices when S provides medium pay with
certainty. In contrast, Shafir et al. (2008) show that honey bees exhibit the reversed
certainty effect. Their study examined variants of problems 9 and 10 with payoff in term
of percentage of sugar in water reward, and found less S choices when S provides
medium pay with certainty. Shafir et al. suggest that the difference can be related to
perceptual noise (rather than to a specie effect): According to this accounts the rats (but

17
not the bees) had difficulty in discriminating the medium and high payoffs, and for that
reason preferred S in the variant of Problem 9. The value of this explanation was
demonstrated in a study with human subjects that reveal that a reduction of the clarity of
the feedback (in a study of Problem 9 and 10) leads to the emergence of the original
certainty effect.
Underweighting and overestimation. The suggestion that people underweight rare
events appears to be inconsistent with previous research that demonstrates overestimation
of rare events (e.g., Viscusi, 2002; Erev et al., 1994). For example Viscusi (2002) found
that smokers and nonsmokers tend to overestimate the probability that smokers will
develop lung cancer. Barron and Yechiam (2009) examined if this difference is mediated
by different settings (e.g., clicking vs. smoking), or different tasks (deciding or
estimating). They studied Problem 11 using the clicking paradigm with complete
feedback, and one addition: Starting at trial 201, the participants were asked to estimate
the probability of the rare outcome (1 point with probability 0.15) before each choice.
The results reveal a strong tendency to prefer the risky prospect (R) in all 400 trials
(mean R-rate of 79%). This result is consistent with underweighting of rare events. The
estimations, on the other hand, reflected oversensitivity to rare events. The average
estimate (of the 10% event) was 21%. Thus, participants appear to exhibit over-
sensitivity to rare events in estimation, and under-sensitivity to rare events in choice
(similar results are reported by Friedman & Massaro, 1998).
Problem 11 (r=400, n=24, FB=complete, accumulated payoffs, 1 unit=0.01 Shekel): R 3 with probability 0.85,
1 otherwise
[R-rate = 79%]
S 2.7 with certainty
The sampling paradigm and robustness to the number of repeated gamble
realizations. Hertwig et al., (2004) note that the “experience-description gap”
summarized above can be attributed to three differences between the experimental
paradigms: the source of the information (experience or description), the number of
repeated realizations of the gambles (one or many), and the stakes (low real payoffs,

18
versus high hypothetical payoffs). To evaluate the role of the three factors, they
examined some of the problems considered by Barron and Erev (2003) under two
conditions: one-shot decisions from description, and one-shot decisions from experience.
The two conditions differed only with respect to how the decision makers learned
about the options’ outcomes and likelihoods. In the description group, options were
described as in Kahneman and Tversky’s studies.
In the sampling group, the information describing the options was not displayed.
Instead, participants were shown two buttons on the computer screen and were told that
each button was associated with a payoff distribution. Clicking on a given button elicited
the sampling of an outcome (with replacement) from its distribution. In Problem 9, for
example, drawing from one distribution led to the outcome “4” in 80% of all draws and
to the outcome “0” in 20% of all draws. Sampling from the other distribution always
resulted in the outcome “3”. Participants could sample however often they wished. By
repeatedly experiencing the contingency between choices and outcomes, participants
could gradually acquire knowledge about the options’ payoff structure. Once they
stopped sampling, they indicated their preferred option, and, after completing all
problems, participants received monetary payoffs according to their choices and the
outcomes of the draws.
The observed choice proportions in the sampling group exhibit the pattern
observed under the clicking paradigm. That is, the participants behave “as if” they
underweight rare events. The correlation between the sampling and the clicking results
was 0.92. The observed choice proportion in the description group exhibits the pattern
predicted by prospect theory- the participants behave “as if” they overweight rare events.
The correlation between the sampling and the description group was -0.67. These results
(and similar findings reported in Weber et al. , 2004; Ungemach et al., 2008; Erev et al.,
2010a; Hau et al., 2008; and in reviews by Hertwig & Erev, 2009 and Rakow & Newell,
2010) suggest that the tendency to underweight rare events in decisions from experience
is not driven by the number of repeated realizations of the gambles.
Robustness to prior information. Lejarraga and Gonzalez (2011) have examined
the effect of prior information of concerning the payoff distributions on the tendency to
underweight rare events in the clicking paradigm. Thus, they examined the joint effect of

19
description and experience. In one of their studies the participants were asked to select
between a safe prospect that provides "3 with certainty" and a gamble that provides "64
with probability .05; and 0 otherwise." Their results reveal that the initial behavior
reflects high sensitivity to the rare events, and the emergence of underweighting of rare
events with experience. The proportion of gamble choice after 10 trials was below 30%.
Jessup, Bishara & Busemeyer (2008) document a similar pattern in a study in which the
exact value of the gamble varied from trial to trial. Alternative explanations of the weak
effect of description of the incentive structure, in the current setting are discussed in
Section 1.1.9 below.
Sensitivity to expected values. An extreme interpretation of the results
summarized above would be to hypothesize that decision makers tend to neglect rare
events; i.e., in most cases they fail to consider these events. Ert and Erev (2012) show a
shortcoming of this extreme explanation by examining the following problems:
Problem 12 (r=400, n=24, FB=complete, accumulated payoffs, 1 unit=0.01 Shekel)
H 2.52 with certainty [H-rate = 40%]
L 2.53 with probability 0.89;
2.43 otherwise
Problem 13 (same procedure as in Problem 12)
H 2.52 with certainty [H-rate = 72%]
L 2.53 with probability 0.89;
2.03 otherwise
The results show a deviation from maximization consistent with underweighting
of rare events in Problem 12, but not in Problem 13. This pattern suggests that the rare
events are not neglected. When they are sufficiently important they are taken into
account.8
8 Additional research suggests that importance is best approximated by the difference in expected values
relative to payoff variance.
20
Sensitivity to the coefficient of variance. Shafir (2000) reviews experimental
studies of animal risk attitude in a binary choice task. The results suggest that under
normal conditions the tendency to select the safer alternative is better predicted by the
coefficient of variance (CV) than by the variance of the risky alternative. CV is defined
as the payoff standard deviation divided by the payoff mean. Weber, Shafir and Blais
(2004) show that this pattern is consistent with underweighting of rare events.
Underweighting of rare events implies risky choices when the CV is low (relatively high
mean) and risk aversion when the CV is high (relatively low mean).
Signal detection tasks. In binary signal detection tasks an observer is asked to
classify stimuli that belong to one of two distributions. In a typical experiment (see
review in Erev, 1998), the two distributions are normal with equal variance, and they
represent the state of the world. For example, the state may be the gender of a candidate
(male or female), and the signal may be the candidate’s height. After each response
(guessing male or female) the observer receives immediate payoff determined by a fixed
2x2 payoff matrix that gives the payoff for each of the four possible outcomes (correct
detection of a male, correct detection of a female, incorrect male response, and incorrect
female response). Assuming that the male’s mean is higher, the optimal choice rule is a
cutoff strategy of the type “respond male if the signal exceeds a certain height.” The
location of the cutoff depends on the payoff of the four outcomes and on the prior
probability of the two distributions. Experimental studies of this task reveal higher
sensitivity to the prior probabilities than to the payoff matrix (see Healy & Kubovy,
1981). Barkan et al., (1998) show that this pattern implies deviation from maximization
in the direction of underweighting rare events.
An ecological justification: Sampling and weighting. The tendency to
underweight rare events can be explained with the assertion, presented above, that people
relay on small samples of past experiences. For example, a subject that relies on a
sample of four past experiences will prefer the negative EV gamble "-10 with probability
0.1, +1 otherwise" over "0 with certainty" in 56% of the trials (because 65% of the
samples of size 4 do not include the 10% event). The observed sensitivity to the expected
value (Problem 13) can be captured with the assertion that the small sample is only one of

21
the factors that determine the attractiveness of the different alternatives. A second factor
is the grand mean: The average payoff from selecting this option over all previous trials.
1.1.4 The very recent effect
Analysis of the effect of recent outcomes on choice behavior in probability
learning tasks led Estes (1964, and see review in Lee, 1971) to conclude that the most
common pattern is positive recency: Decision makers are more likely to select the
alternative that led to the best outcome in recent trials.
A clear example of positive recency in the clicking paradigm is provided in the
analysis of the contingent choice rate in Problems 2 and 3 in the top panel of Table 1. The
probability of risky (R) choices is larger, in these problems, after high payoff from R than
after low payoff from R. The overall R-rates are 64% after high payoff, and 40% after
low payoff. Aggregation over the two payoffs (high and low) suggests that that the
proportion of choices that are best reply to the most recent payoff, referred to as “Best-
Reply-1” is 62%.
<Insert Table 1>
An extension of this analysis to other recent outcomes reveals an interesting
pattern. To describe this pattern let Best-Reply-L be the choice rate of the alternative that
led to the best outcomes exactly L trials before the current trial. Figure 4 presents the
values of Best-Reply-1 to Best-Reply-20 (based on the data of trial 21 until 200 in
Problems 2 and 3). The results reveal a large qualitative difference between Best-Reply-
1 and the other values. The decrease in the effect of recent outcomes appears to be sharp.
Best-Reply-1 reflects a strong recency effect, but Best Reply 2 and 3 are not larger than
the mean value. Indeed, Best Reply 3 is the lowest point in Figure 4 curve. Nevo and
Erev (2012) refer to this pattern as the “very recent effect.”
An ecological justification: State inertia. The unique effect of the most recent
outcome can be captured with the assertion that in some trials the decision makers behave
as if they assume that the payoff rule is deterministically determined by the state of
nature, and the current state is not likely to change (the state in the next trial is likely to
be identical to the state in the last trial).
<Insert Figure 4>

22
1.1.5 Inertia and surprise-triggers-change
Analysis of the relationship between recent and current choice reveals strong
positive correlation that implies inertia (see, Nevin, 1988; Cooper & Kagel, 2008; Suppes
& Atkinson, 1960, Erev & Haruvy, 2005). Decision makers tend to repeat their last
choice. For example, over Problems 2 and 3, the participants repeated their last choice in
68% of the trials. Moreover, inertia is a better predictor of behavior than positive recency.
When inertia and positive recency leads to contradicting predictions, the participant are
more likely to exhibit inertia (as noted above the proportion of a repeated R choice after
low obtained payoff is only 62%).
Over-alternation. Previous research highlights two boundaries conditions of
inertia. First, human decision maker exhibit over-alternation when they are ask to select
between alternatives that are known to be symmetric (see Rapoport and Budescu, 1997
and Section 2.2.2 below). Second, animal studies (see review in Dember & Fowler,
1958) highlight spontaneous alternation by certain species in certain settings that can be
described as response to environment in which inertia is counterproductive.
Negative recency. The first row in Table 1 presents the choice rates in Problems 7
and 8 by the last choice and the recent payoffs. The results reveal two deviations from
positive recency. The first deviation emerges in Problem 8 after R choice. The rate of
repeated R choice was 79% after a loss (the payoff -1), and only 61% after a gain (payoff
of +10). The second indication of negative recency is observed in Problem 7 after S
choice. The rate of a switch to R was 31% after a forgone loss (the payoff -10), and only
21% after a forgone gain (payoff of +1).
The lower rows in Table 1 demonstrate that this pattern is not unique to Problems
7 and 8. It presents the results obtained in the study of 12 additional problems by Nevo
and Erev (using the basic clicking paradigm). Most problems reveal higher change rate
after surprising outcomes even when the surprising outcomes reinforce the last choice.
The relative effect of obtained and foregone outcomes. Under an extreme
interpretation of Thorndike’s (1898) law of effect, behavior is driven by obtained
outcomes. Thus, information concerning foregone payoffs is not likely to have a
significant effect. However, experimental evaluations of this hypothesis show that it can
be rejected (e.g., Mookherjee & Sopher, 1994; Camerer & Ho, 1999; Nyarko & Schotter,

23
2002). In fact, in certain settings people are more sensitive to foregone than to obtained
outcomes (e.g., Grosskopf et al., 2006). The results, presented in Table 1, reveal a
similar pattern: The best reply rate to the forgone payoff is larger than the best reply rate
to the obtained payoff. One boundary condition to the current observation involves the
number of alternatives. When the number of alternatives is very large people are more
likely to pay attention to the payoff of the alternative they chose, than to the forgone
payoff from each of the other multiple alternatives (see Ert & Erev, 2007).
An ecological justification: Action inertia and surprise-trigger- change. The
observed inertia and the complex recency pattern documented in Table 1 can be captured
with the hypothesis that in certain trials people choose an inertia mode, and simply repeat
their last choice. This tendency is ecologically reasonable when the cost of deciding is
larger than the expected benefit. Specifically, if the agent carefully reached a decision
before trial t, making another costly decision at trial t likely to be cost effective only if the
recent feedback is surprising.
1.1.6 Individual differences and the Iowa gambling task
While studying patients with neuropsychological disorders Bechara, Damasio,
Damasio and Anderson (1994) have found that a specific neurological syndrome is
associated with poor performance in a simple decision from experience task. The
population they studied was patients with lesions in the orbitofrontal cortex. This
syndrome involves intact IQ and reasoning skills but poor decision-making capacities.
The task they proposed for assessing decision capacities is now known as the Iowa
gambling task. It is presented as a choice between four decks of cards. Each alternative
results in one or two outcomes: A sure gain and some probability of a loss. The implied
payoff distributions (the sum of the two outcomes) are described below:
The Iowa Gambling task: Dis R: Win $100 with probability 0.9; lose $1150 otherwise (EV = -25) Dis S: Win $100 with probability 0.5; lose $150 otherwise (EV = -25) Adv R: Win $50 with probability 0.9; lose $200 otherwise (EV= +25) Adv S: Win $50 with probability 0.5; 0 otherwise (EV = +25)

24
As in the clicking paradigm, the decision makers do not receive a description of the
different distributions. Their information is limited to the obtained payoff after each trial.
The experiment included 100 trials.
Notice that two of the alternatives are advantageous (Adv R and Adv S have
expected payoff of 25), and two are disadvantageous (Dis R and Dis S have expected
value of -25). Bechara et al. found that the patients with lesions in the orbitofrontal
cortex did not learn to avoid the disadvantageous alternatives, while the participants in
the control groups (patients with other neurological problems) did.
Following up on these findings, Busemeyer and Stout (2002) presented a simple
reinforcement learning model that implies that the failure to learn in the Iowa gambling
task can be a product of three different behavioral tendencies: Over-exploration, a
recency effect, and insufficient sensitivity to losses. Under Busemeyer and Stout’s model
these three tendencies are abstracted as parameters that can be estimated from the data.
Yechiam et al. (2005; 2008) showed the value of this approach. For example,
they showed that the estimation of the learning parameters can be used to distinguish
between criminals. In their study of first-time offenders at the reception and classification
facility for the State of Iowa Department of Corrections, diverse criminal subgroups all
performed poorly in the Iowa Gambling task. However, it was found that addiction
criminals, such as drug and sex criminals, showed insufficient sensitivity to losses. In
contrast, more violent criminals, including those convicted of assault and/or murder, and
to some extent those convicted of robbery as well, exhibited high recency.
Additional indication of the significance of individual difference is provided by
the analysis of the correlation between behavior in Problems 2 and 3 in the clicking
experiment described above. Recall that the experiment used the basic clicking
paradigm, and 20 participants faced both problems. Following Yechiam et al. (2005) we
focused on three variable: The proportion of risky choices (a measure of attitude toward
losses), the proportion of “Best reply-1 (a measure of a recency effect), and the distance
between the mean choice rate and 0.5 (a measure of decisiveness). The observed
correlations are 0.18, 0.75, and 0.69 for loss attitude, recency, and decisiveness (and the
last two values are highly significant).
25
An ecological justification: Variability facilitates evolution and learning. The
existence of variability is a necessary condition for evolution. Another attractive feature
of variability in learning is the fact that it can facilitate coordination. Specifically
variability enhances efficiency in coordination games in which the payoff decreases with
the number of people that make the same choice. One example is the market entry game
described below.
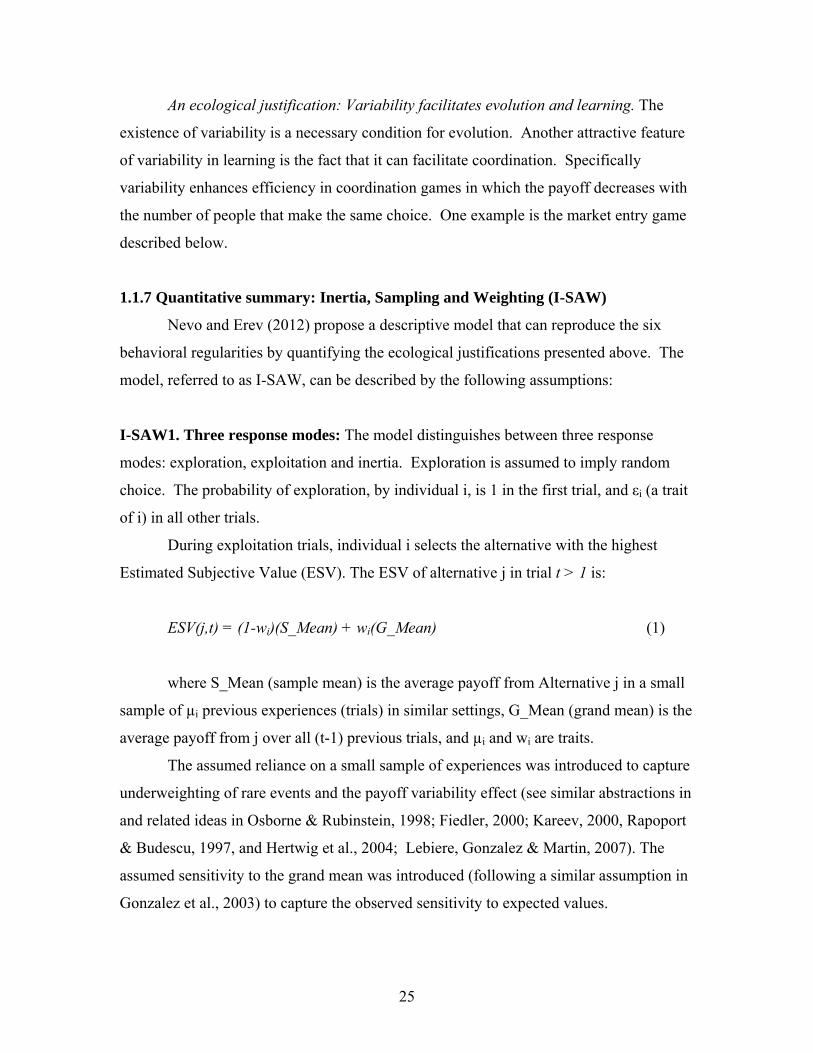
1.1.7 Quantitative summary: Inertia, Sampling and Weighting (I-SAW)
Nevo and Erev (2012) propose a descriptive model that can reproduce the six
behavioral regularities by quantifying the ecological justifications presented above. The
model, referred to as I-SAW, can be described by the following assumptions:
I-SAW1. Three response modes: The model distinguishes between three response
modes: exploration, exploitation and inertia. Exploration is assumed to imply random
choice. The probability of exploration, by individual i, is 1 in the first trial, and εi (a trait
of i) in all other trials.
During exploitation trials, individual i selects the alternative with the highest
Estimated Subjective Value (ESV). The ESV of alternative j in trial t > 1 is:
ESV(j,t) = (1-wi)(S_Mean) + wi(G_Mean) (1)
where S_Mean (sample mean) is the average payoff from Alternative j in a small
sample of µi previous experiences (trials) in similar settings, G_Mean (grand mean) is the
average payoff from j over all (t-1) previous trials, and µi and wi are traits.
The assumed reliance on a small sample of experiences was introduced to capture
underweighting of rare events and the payoff variability effect (see similar abstractions in
and related ideas in Osborne & Rubinstein, 1998; Fiedler, 2000; Kareev, 2000, Rapoport
& Budescu, 1997, and Hertwig et al., 2004; Lebiere, Gonzalez & Martin, 2007). The
assumed sensitivity to the grand mean was introduced (following a similar assumption in
Gonzalez et al., 2003) to capture the observed sensitivity to expected values.

26
I-SAW2. Similarity and recency: The µi draws are assumed to be independent
(sampling with replacement) and biased toward the most recent experience (Trial t-1). A
bias occurs with probability ρi (a trait) and implies draw of Trial t-1. When a bias does
not occur (probability 1-ρi), the agent draw experienced the occurred in trials that appear
to be similar to the current trial. When all the previous trials are objectively equally
similar (the current case), the “apparent similarity” criterion implies random choice. The
motivation behind the recency bias is the "very recent effect."
I-SAW3. Surprise-triggers-change: Inertia is added with the assumption that the
individuals tend to repeat their last choice. The exact probability of inertia at trial t+1 is
assumed to decrease when the recent outcomes are surprising. Specifically, if the
exploration mode was not selected, the probability of inertia is:
P(Inertia at t+1) = πiSurprise(t) (2)
where 0 < πi < 1 is a trait that captures the tendency for inertia. The value of the surprise
term is assumed to equal the average of four gaps between certain expectations and the
obtained payoffs. In the first two (one per alternatives) the assumed expectation is that
the last payoffs will be obtained again; thus the gap is between the payoff at t-1 and the
payoff at t. In the last two the assumed expectation is the mean payoff; thus, the gap is
between the grand mean and the payoff at t. Specifically,
2
1
2
1
)()(_)()1(4
1)(
jjj
jjj tObtainedtmeanGtObtainedtobtainedtGap (3)
where Obtainedj(t) is the payoff obtained from j at trial t, and G_meanj(t) is the average
payoff obtained from j in the first t-1 trials (the grand mean). The surprise at t is
normalized by the mean gap (in the first t-1 trials):
Surprise(t) = Gap(t)/[Mean_Gap(t) +Gap(t)] (4)
The mean gap at t is a running average of the gap in the previous trials (with
Mean_Gap(1) = .00001). Specifically,

27
Mean_Gap(t+1) = Mean_Gap(t)(1-1/r) +Gap(t)(1/r) (5)
where r is the expected number of trials in the experiment (100 in the current study).
Notice that the normalization (Equation 4) implies that the value of Surprise(t) is
between 0 and 1, and the probability if inertia is between πi (when Surprise(t) =1) and 1
(when Surprise(t) = 0). An interesting justification for this gap-based abstraction comes
from the observation that the activity of certain dopamine related neurons is correlated
with the difference between expected and obtained outcomes (see Schultz, 1998; and
related analysis in Caplin & Dean, 2007).
I-SAW4. Individual differences, traits, and parameters: The traits are assumed to be
independently drawn from a uniform distribution between the minimal possible value
(allowed by the model) and a higher point. Thus, the model has five free parameters: the
highest point of the five distributions.
Estimation and results. We used a grid search procedure to estimate the
parameters of the model. The criterion was the Mean Squared Deviation (MSD) between
the model’s predictions and the experimental results (including the results summarized in
Table 1). That is, we ran computer simulations to derive the prediction of the models
under different parameters, and selected the parameters that minimize the MSD score.
The estimated parameters imply the following trait distribution: εi~U[0,.24], wi~U[0,1],
ρi~U[0,.12], πi~U[0,.6], and µi = 1, 2, 3 or 4 .
The right-hand columns in Table 1 present the predictions of I-SAW with these
parameters. The results reveal that I-SAW reproduces all the behavioral tendencies
documented in Table 1. In addition, the model provides good quantitative fit. For
example, the correlation between the predicted and the observed aggregated choice rates
is 0.9, and the MSD score is 0.007. Additional evaluations of this model are discussed in
Sections 1.3 and 2.2 below.

28
1.1.8 Implications to traditional reinforcement learning and fictitious play models.
I-SAW can be described as an example of a reinforcement learning model (see
Satton & Barto, 1998; Erev & Roth, 1995), and as a generalization of the Fictitious Play
rule (Brown, 1951; Robinson; 1951 and see Fudenberg & Levine, 1998). The following
section clarifies these related connections.
Fictitious play (FP). The FP rule assumes that the decision maker tries to
maximize expected return under the assumption that the payoff distributions are static.
This assumption is fictitious in many settings, but it is correct in the basic clicking
paradigm. At trial t >1 this rule implies a selection of the alternative that led to the
highest average payoff in the first t-1 trials (and random choice is assumed at t=1). I-
SAW implies FP with the traits: εi=0, wi=1, ρi= 0, and πi=0. That is, under the FP rule,
the estimated subjective value is the grand mean (G_Mean), and the alternative with the
highest G_Mean is selected. The correlation between the aggregated choice rate and the
model with these parameters is 0.76 and the MSD score is 0.039. These results suggest
that the FP rule (and the implied maximization assumption) provides useful
approximation of the results, but the I-SAW generalization of this rule provides a much
better approximation. Additional analysis reveals that the advantage of the generalized
model over the FP rule decreases when the difference between the average payoffs from
the different alternative is large (relatively to the payoff variability); when this relative
difference is large enough the predictions of I-SAW are identical to the predictions of the
FP rule.
Stochastic Fictitious play (SFP). The SFP model (Cheung & Friedman, 1997,
1998) is a generalization of the FP rule that allows for the possibility that the estimated
subjective value of option j at trial t includes error. That is:
ESV(j,t) = G_Mean(j,t) + εjt (6)
The traditional implementation adds the assumption that the error terms are randomly,
identically and independently distributed. It is convenient to assume that this distribution
follows Type I Extreme Value Distribution, which approximates the normal distribution.

29
As demonstrated by McFadden (1974) this assumption implies that the probability of
preferring j over k at trial t is
P(j,t) = 1/(1+eσ[G_Mean(k,t)-G_Mean(j,t)]) (7)
SFP can be described as a variant of I-SAW with the parameters εi=0, wi=.5, ρi=
0, πi=0, and with a modified error term. The error term under I-SAW is determined by a
draw of µi past experiences. The I-SAW error term is less convenient to modelists (as it
does not allow the derivation of the elegant choice probability term implied under normal
error), but it appears to fit the data better. The advantage of the I-SAW error term is
clarified by a comparison of Problem 1 and 2. I-SAW implies no error in Problem 1 (the
trivial no variability problem), and high error rate in Problem 2. The SFP allows for the
possibility of different error term by assuming situation specific σ values, but cannot
predict a long-term difference between the two problems without problem specific
parameters.
Reinforcement learning. Simple reinforcement learning models were found to
provide good ex-ante predictions of behavior in certain games (Erev & Roth, 1998), to
imply maximization in certain settings (Sutton & Barto, 1998), and to be consistent with
known activities of the brain (Schultz, 1998). In order to clarify the relationship of these
models to the current results it is important to recall that the term "reinforcement
learning" is used to describe a very large set of models (Dayan & Niv, 2008). I-SAW is a
member of this class of model. We believe that the most important difference between I-
SAW and the popular reinforcement learning model involves the "error term" discussed
above. Like the SFP model, the popular reinforcement learning models assume a normal
error term. Other differences between I-SAW and the popular reinforcement learning
models involve the surprise trigger change assumption, and the abstraction of the recency
effect. The new assumptions were introduced to capture the six phenomena summarized
in Section 1.1, and are evaluated in the two choice prediction competitions described in
Section 1.3.

30
Probability Matching. The probability matching rule implies that the decision
makers will match their choice rate to the proportion of time that the prospect is the best
choice (see Estes, 1950). Under a natural cognitive implementation of this idea it implies
the following choice rule: On each trial the decision maker samples one outcome from
the payoff distributions of each alternative, and selects the alternative with the highest
drawn outcome (random choice is assumed in the first trial and in the case of a tie).
Blavatskyy (2006) demonstrates that this simple idea captures the typical behavior in
Barron and Erev’s demonstration of the payoff variability effect and underweighting of
rare events. However, as noted by Erev and Barron (2005) the probability matching rule
over predicts underweighting of rare events, and the payoff variability. I-SAW implies
probability matching with the traits εi=0, wi=0, ρi= 0, and πi=0, and µi = 1. The
correlation between the aggregated choice rate and the model with these parameters is
0.56 and the MSD score is 0.130.
1.1.9 Alternative explanations of the experience-description gap.
Prospect theory (Kahneman & Tversky, 1979; Wakker, 2010), the leading model
of decisions from description, captures three main behavioral regularities: Overweighting
of rare events, loss aversion, and the reflection effect (risk aversion in the gain domain,
and risk seeking in the loss domain). The results reviewed above show that different
regularities emerge in the study of decisions from experience. The results reflect
underweighting of rare events (Section 1.1.3), and no indication for loss aversion
(Section 1.1.2). In addition, under certain settings decisions from experience reveal a
reversed reflection effect (Ludvig & Spetch, 2011).
Recent research suggests several contributors and explanations to these
differences. Our favorite explanation involves the assertion that decisions from
description are a subclass of the larger class of decisions from experience. As in other
subclasses, the decision makers tend to select strategies that have led to good outcomes in
similar situations in the past. The experience-description gap emerges, under this
explanation, as a result of two main effects of the available description. First, in certain
cases, the description affects the set of strategies that can be used (see related ideas in
Busemeyer & Myung, 1992; Erev, 1998; Rieskamp & Otto, 2006; Erev & Roth, 2001;

31
Stahl, 2000; Erev & Barron, 2005). Second, the description affects the set of past
experiences perceived to be similar.
In order to clarify the assertion that the description can affect the set of strategies,
consider the following hypothetical choice problem:
Thought Experiment 1. Choose between:
H 0 with certainty
L $1 with probability .99, -$1,000,000 otherwise
It is easy to see that the availability of a description of the incentive structure will
have a large effect here. Without a description (if this problem would be studied using
the basic clicking paradigm) people are likely to select L at least until the first loss. With
a description, reasonable individuals are expected to prefer H. We believe that this
pattern can be captured with the assertion that the current description leads people to
follow "compute the expected values implied by the description, and select the best
alternative based on this dimension." The apparent inconsistency between this assertion
and the weak effect of description discussed in Sections 1.1.2 and 1.1.3 can be explained
with the assertion that the tendency to use the EV rule decreases when the difference
between the expected values, implied by the description, appear to be small and/or when
the computation is too difficult (see Payne Battman and Johnson, 1993) . That is, the EV
strategy is less likely to be used when the problem is similar to problems in which the EV
rule was not found to be effective.
Marchiori et al. (2012) show that the current assertion can be used to explain
"overweighting of rare events" in "one-shot decisions from description." Their
explanation adds the assumption of overgeneralization from situations in which people
decide based on subjective probability estimates. Subjective probability estimates tend to
reflect overconfidence; for example, studies of probability estimates reveal that event
estimated by "5%" occur in about 20% of the times (Erev, Wallsten & Budescu, 1994).
Thus, overweighting the 5% outcome tends to be reinforcing. Experience eliminates this
bias, and can lead to the opposite bias.

32
Other likely contributors to the differences between the basic properties of
decisions from experience and the predictions of prospect theory are presented below.
The White Bear effect and the weighting of rare events. Wegner et al., (1987)
note that when we "try not to think about a white bear," a white bear comes to our mind.
This "white bear effect" can be one of the contributors to the tendency to overweight rare
events in decisions from description. For example, it is possible that the gamble "5000
with probability 1/1000, and 0 otherwise" seems attractive because we cannot avoid
paying too much of their attention to the outcome 5000 (see Birnbaum & Martin, 2003).
Underweighting of rare events in decisions from experience emerges, under this logic,
because the availability of feedback reduces the attention given to the description and
leads the subjects to focus on the experienced outcome (Erev, Glozman & Hertwig,
2008).
Contingent loss aversion. The loss aversion assertion, one of the cornerstones of
prospect theory (Kahneman & Tversky, 1979), states that losses loom larger then gains.
Thus, it predicts that when selecting among mixed prospects (prospects that can yield
both gains and losses) people often prefer the safer asserts over riskier assets with higher
expected value. The simplified investment problem, examined in Section 1.1.2 reveals
the opposite bias: A tendency to prefer the risky prospects even though the safe option
has provides higher expected return.
Under one explanation of this deviation from loss aversion, it reflects an
"experience-description gap in the reaction to losses." This explanation is plausible, but
it has two shortcomings. First, there many situations in which people do not exhibit loss
aversion in decisions from description (see Ert & Erev, 2008, 2012, and the first trial in
the simplified investment problem). Most importantly, people appear to exhibit equal
sensitivity to gains and loss in decisions from description when the payoff magnitude is
low. Thus, it is possible that small losses have similar effect on decisions from
experience and from description. And the typical behavior, in both classes of decisions,
reflects less loss aversion than implied by prospect theory (the prediction of prospect
theory do not depend on the payoff magnitude).

33
A second shortcoming of the assumed experience-description gap in the reaction
to losses is the observation that certain presentations of the outcomes can lead to behavior
that appears to reflect loss aversion in decisions from experience (See Thaler et al., 1997;
and a clarification in Erev et al., 2008). For example, when people are asked to select
between a "sure gain with certainty" or "risky prospect that provides higher expected
return but often leads to a loss" they exhibit loss aversion when the payoffs are presented
graphically, but not when they are presented with clear numbers.
1.2 The effect of limited feedback
Many natural decisions from experience problems involve situations in which the
feedback is limited to the obtained payoffs. For example, when we choose to order a
certain dish in a restaurant we are not likely to know the outcome of ordering a different
dish. The current section explores these decision problems with a focus on experiments
that use the clicking paradigm (Figure 1) with limited feedback. That is, the feedback
provided after each trial is limited to the outcome of the selected key.
Experimental studies that examine this set of "limited feedback" situations
highlight the generality of the six phenomena listed above. Yet, the results also
demonstrate the nature of the feedback can change the magnitude of the basic
phenomena. The main changes can be described as reflections of the hot stove effect
described below.
1.2.1 The hot stove effect
Mark Twain (1897) asserts that after sitting on a hot stove lid, a cat is likely to
avoid sitting on stove lids even when they are cold. Denrell and March (2001; also see
Denrell, 2005; Denrell, 2007, and a related observation in Einhorn & Hogarth, 1978)
show that Twain's assertion is a likely consequence of learning when the feedback is
limited to the obtained payoff. Learning in this setting increases risk aversion. This
observation, referred to as the hot stove effect, is a logical consequence of the inherent
asymmetry between the effect of good and bad experiences. Good outcomes increase the
probability that a choice will be repeated and for that reason facilitate the collection of
additional information concerning the value of the alternative that has yielded the good

34
outcome. Bad outcomes reduce the probability that the choice will be repeated, and for
that reason impair the collection of additional information concerning the value of the
alternative that has yielded the bad outcome. As a result, the effect of bad outcomes is
stronger (lasts longer) than the effect of good outcomes. Since options with a high
variability are more likely to produce bad outcomes, the hot stove hypothesis predicts a
decreasing tendency to choose such options.
One indication of the descriptive value of hot stove effect is provided by a
comparison of choice behavior with and without foregone payoffs in the four-alternative
Iowa Gambling task discussed above. The availability of foregone payoffs tends to
increase risk taking (see Yechiam & Busemeyer, 2006). A similar pattern was
documented by Fujikawa (2010) in an analysis of Problem 9. His analysis suggests that
the hot stove effect can reduce underweighting of negative rare events.
Additional experimental studies demonstrate that the magnitude of the hot stove
effect is maximal when the risky alternative is a long shot gamble. Table 2 illustrates this
pattern. It presents the proportion of R choice in 12 problems that were run for 100 trials
using the basic clicking paradigm (with complete feedback), and a variant of the clicking
with and without forgone payoffs (the limited feedback condition were run by Erev et al.
2010, and the complete feedback conditions were run by Nevo & Erev, 2012). The
results (presented in two blocks of 50 trials) reveal a large hot stove effect in "rare
treasure" problems when the probability of a high payoff from risky choice is 0.1 or
lower: In all seven problems of this type, the R-rate in the last block is higher in the
complete feedback condition. The pattern in the five problems with higher probability of
high payoff from risky choice is less clear.
<Insert Table 2>
Diminishing exploration. As noted above, the existence hot stove effect is implied
by all models that assume positive recency. Explaining the interaction of the observed
effect with time, and with the magnitude of high payoff from the risky option is more
challenging. The most natural explanation of the observation that the effect increases
with time (from the first to the second block) can be captured with the assertion of

35
diminishing exploration: High exploration rate in the beginning of the experimental
session, and lower rate of exploration toward the end.
The observation that the hot stove effect was not observed in the problems in
which the risky prospect leads to good outcome most of the time can be the product of
the fact that even limited exploration is enough, in these cases, to demonstrate the value
of the risky option. If some exploration continues even after an extreme low payoff, the
hot stove effect is not likely to emerge. This explanation is captured in I-SAW and
similar models with the assumption that the probability of exploration is independent of
the obtained payoffs.
Two-armed bandit problems. The task faced by the subjects in the limited
feedback condition of summarized in Table 2 is similar to 2-armed bandit problem (see
Degroot, 1970; Gittins, 1989). Yet, the common analyses of 2-armed bandit problem
focus on situations in which the decisions makers have more information, and the optimal
strategy can be computed. Specifically, they know the expected payoff from the safe
option, and know that the risky option provides one of two outcomes with fixed
probability. Theoretical analysis of these 2-armed bandit problems reveal that the
optimal strategy is to start with exploration of the risky option, and switch to the safe
option if the outcomes fall below a certain cutoff. Thus, the diminishing exploration
pattern suggested here is similar to the optimal strategy in these simpler problems.
Direct experimental studies of 2-armed bandit problems show the robustness of
the pattern discussed above. Meyer and Shi (1995) results reveal an increase in
counterproductive exploration with payoff variability, and a slow reduction in exploration
(not enough exploration in the beginning, and to much exploration in the end). Gans,
Knox and Croson (2006) results suggest large individual differences, and a very recent
effect.
1.2.2 I-SAW with diminishing exploration.
Erev, Ert and Yechiam (2008) show that the main properties of binary decisions
from experience with limited feedback can be captured with an "exploration sampler"
model that assumes reliance on small samples, and diminishing exploration. The main
assumptions of this model can be captured in an extension of I-SAW (Section 1.1.7) that
36
adds the assumption that the probability of exploration depends on the available
feedback. I-SAW assumes that when the feedback is complete (include information
concerning obtained and forgone payoff), the probability of exploration is fixed during
the experiment and reflect an individual trait (εi). The extended version adds the
assumption that when the feedback is limited to the obtained payoff, the probability of
exploration starts at 1, and diminishes with time. The speed of the decline in exploration
is assumed to depend in the expected length of the experiment. Specifically, we assume
that when the probability of exploration at trial t equal T
t
i
1
where T is the length of the
experiment (in the experiments reviewed in Table 2, T= 100). In addition, the extension
of I-SAW to situations with limited feedback implies that less information is used during
sampling and during the computation of surprised: only the observed obtained payoffs are
used.
1.3 Two choice prediction competitions
We believe that the basic learning phenomena, considered above, are an important
part of the phenomena that determine the shaping of human behavior by the incentive
structure. This optimistic assumption implies that good models of the joint effect of these
phenomena can provide useful ex-ante predictions of the effect of economic incentives in
a wide set of situations (Erev & Roth, 1998). Two choice prediction competitions that
evaluate this optimistic assertion, and facilitate the comparison of alternative learning
models are described below.
1.3.1 The Technion prediction tournament: Individual decisions with limited feedback
Erev et al. (2010a) present a choice prediction competition designed to facilitate
the development and comparison of models of decisions from experience under limited
feedback.9 The organizers of the competition (the first three co-authors of that paper) run
two large experimental studies using the clicking paradigm without information
concerning forgone payoffs. Each study focused on 60 randomly selected problems. All
9 In addition to this competition, Erev et al. organized a competition that focuses on decision from
description, and a competition that focuses on decisions based on free sampling. The comparison of the three competitions clarifies the robustness of the experience-description gap.

37
the problems involved a choice between a safe prospect that provides a medium payoff
(referred to as M) with certainty, and a risky prospect that yields a high payoff (H) with
probability Ph, and a low payoff (L) otherwise. Thus, the basic choice problem is:
S: M with certainty
R: H with probability Ph; L otherwise (with probability 1-Ph)
The four parameters (M, H, Ph and L) were randomly selected with a well defined
algorithm that implies: (1) The possible payoffs were between -30 and +30 Shekels (1
Shekel equaled about $0.3); (2) L < H; (3) M was between L and H in 95% of the
problems; and (4) the difference between the expected values of the two prospects was
relatively small. Twelve of the 120 problems that were examined are presented in Table
2.
The first study, referred to as the estimation experiment, was run in March 2008.
Each of the 60 problems was faced by 20 subjects for 100 trials. Each subject played 12
games, and the payoffs (in Shekels) were determined by a randomly selected trial. In
April 2008 the organizers posted the result and the best baseline models that they could
find on the web (see http://tx.technion.ac.il/~erev/Comp/Comp.html) and challenged
other researchers to predict the results of the second study. The second study, referred to
as the competition experiment, was run in May 2008 using the same experimental method
as the estimation experiment but different randomly selected problems and different
subjects. The results of the competition study were not revealed until Septemeber 2nd
2008.
Researchers participating in the competitions were allowed to study the results of
the estimation study. Their goal was to develop a model that would predict the results
(the mean choice proportion over all choices in each problem) of the competition study.
The model had to be implemented in a computer program that reads the payoff
distributions of the relevant gambles as an input and predicts the proportion of risky
choices as an output. The submission deadline was Septenber 1st 2008. The submitted
models were ranked based on the Mean Squared Deviation (MSD) between the predicted
and the observed choice proportions.
38
ENO (Equivalent Number of Observations). One advantage of the MSD criteria
used here is its relationship to traditional statistics (like regression, t-test and the d-
statistic) and its intuitive interpretation. These attractive features are clarified with the
computation of the ENO (Equivalent Number of Observations) order-maintaining
transformation of the MSD scores (see Erev et al., 2007). The ENO of a model is an
estimation of the size of the experiment that has to be run to obtain predictions that are
more accurate than the model’s prediction. For example, if a model's prediction of the
probability of risky choices in a particular problem has an ENO of 10, this prediction is
expected to be as accurate as the prediction based on the observed proportion of risky
choices in an experimental study of that problem with 10 participants.
Results. The models evaluated in the competition can be classified in two main
classes: The first includes instance-based models like I-SAW that assume reliance on
small samples of experiences. The second include models like reinforcement learning
with a normal error terms that do not assume memory of and/or reliance on specific
experiences. About half of the baseline models and half of the submissions belong to
each class. The results reveal a large advantage of the instance-based models. The best
baseline model was a predecessor of I-SAW. The ENO of this best baseline was 47.2.
In the current context the predictions of this model are almost identical to the predictions
of the refined model, I-SAW, with the parameters : εi~U[0,.20], wi~U[0,1], ρi~U[0,.6],
πi~U[0,.6], and µi drawn from integers 1 to 14.
The winner of the competition was an instance-based model that assumes an
ACT-R10 cognitive architecture (submitted by Stewart, West and Lebiere). Like the best
baseline and I-SAW, the winning model builds on the instance based learning model
proposed by Gonzalez et al. (2003) and implies reliance on small samples of experiences.
The winner had slightly lower ENO (32.5) than the best baseline (the baseline models did
not participate in the competition), but it has two attractive features. First, the ACT-R
cognitive architecture involves a psychologically more realistic abstraction of the relevant
memory processes. For example, the instance based model assumes a continuous
10
ACT-R (Adaptive Control of Thought—Rational) is general theory of cognition (see Anderson & Lebiere, 1998).

39
weighting of all past experiences. Second, the instance based model was designed to
capture decisions in dynamic environments. We return to this point below.
Analysis of the predictions of reinforcement learning models assuming "normal
error term" that participated in the competition suggests that their most important failure
involves the effect of Ph (the probability of high payoff from risky choice). With the
parameters that best fit the data, these models under-predict the R-rate (over-predict the
hot stove effect) with high Ph values, and over-predict the R-rate with low Ph. This
pattern appears to be a result of the fact that these models imply that an extreme low
payoff from the risky prospect decreases the probability of future exploration of this
prospect.
Another outcome that emerges from the evaluation of the submission to the
competitions involves the estimation technique: all the leading submissions were used a
"computer simulation based estimation method," and did not use more sophisticated, one-
period-ahead, econometrics technics. This observation appears to be surprising as
previous research shows that when the model is "well-specified," the correct one-period
estimation provides best estimate of the parameter. One explanation of this observation
suggests that the current models are miss-specified, and the one-period-ahead techniques
are more sensitive to this miss-specification (see Erev & Haruvy, 2005).
1.3.2 The Market Entry game competition: Social interaction with complete feedback.
Erev et al. (2010b) organized a choice prediction competition that focuses on 4-
person market entry games under limited prior information. The experimental subjects
were informed that they play a market entry game, and have to select between a risky
entry to the market and a safer decision to stay outside the market.
The payoffs depended on a realization of a binary gamble (the realization at trial t is
denoted Gt, and yields “H with probability Ph; and L otherwise”), the number of entrants
(E), and two additional parameters (k and S). The exact payoff for player i at trial t was:
enternot does i ifotherwise /S)round(G- .5; =p with /S)round(G
enters i ifG k(E)-10)(
tt
ttVi

40
The parameters H, Ph, L, k and S where randomly drawn under certain constraints
(e.g., the expected value of the gamble was zero, the mean entry rate at equilibrium
was 0.5).
The participants did not receive a description of the payoff rule, and had to rely on
a complete feedback (obtained and forgone payoffs) after each trial. The organizers run
an estimation study with 40 games, and a competition study with 40 additional games.
The results of the estimation study were published in May 2010, and the
submission deadline was September 2010. The analysis of the estimation study suggests
that results exhibit the basic learning phenomena documented in individual choice task
and summarized in section 1.1. In addition, the result show high initial entry rate: 66% in
the first trial. Comparison of several baseline models highlights the advantage of I-SAW
over other models. Best fit was provided with a slight modification of the “strategy set
simplification assumption”: The best baseline model is I-SAW with the assumption of an
initial tendency to entry the marker in 66% of the trials.
Twenty-five teams participated in the competition. The submitted models
included reinforcement learning, neural networks, ACT-R, and I-SAW like sampling
models. The results reveal a large advantage of sampling models that assume reliance on
small samples and surprise-triggers-change. Indeed, all the ten leading submissions
belong to this class of models. The winner of the competition (Chen et al., 2011) is a
variant of I-SAW that adds the assumption of bounded memory. The runner up
(Gonzalez et al., 2011) quantifies the similar assumptions in a refinement of the instance
based learning model (Gonzalez et al., 2003).
The ENO of I-SAW (in predicting the average payoff, a statistic that captures the
entry rate and implied coordination level) in the last block of 25 trials was 42.2. As in the
first competition, traditional "normal error term" reinforcement learning models did not
do well. It seems that the main reason for their failure here involves the co-existence of
"underweighting of rare events" and relatively weak recency effect. The traditional
reinforcement learning models (and the similar fictitious play and experience weighted
attraction, Camerer & Ho, 1999) that were evaluated have to assume a strong recency
effect in order to capture the observed underweighting of rare events.

41
Another similarity to the first competition involves the estimation techniques used
by the best models. All the top submissions used simulation-based methods and avoid
more sophisticated one-period-econometrics.
2. Dynamic environments
Many of the early experimental studies of learning focused on the effect of training
in one environment (the training phase) on performance in another environment (test
phase). Thus, they examined decisions in dynamic environments. Some of the classical
results documented in these settings are reviewed below.
2.1 The Partial Reinforcement Extinction Effect (PREE) and reinforcement schedules
The Partial Reinforcement Extinction Effect (PREE) is one of the best-known
phenomena documented in classical behavioral research. As most introductory
psychology textbooks explain, the effect implies that under partial reinforcement
schedules (where some responses are not reinforced), learned behavior is more robust to
extinction, in comparison to continuous reinforcement (where all responses are
reinforced, e.g., Atkinson et al., 1995; Baron & Kalsher, 2000; Robbins, 2001). This
effect was first demonstrated in Humphreys’ (1939a) examination of eye blinks in
rabbits.
Humphreys (1939b) and Grant et al. (1951) show PREE in human behavior.
These studies focused on promoting the behavior “predicting whether a light bulb will
flash or not.” Participants were presented with two light bulbs. On each trial, the right-
hand bulb was blinking, and the participants had to predict whether the left bulb would
blink as well.
The typical experiment included training and extinction phases and compared two
conditions: Continuous reinforcement and Partial reinforcement. For example, in Grant
et al.'s (1951) replication and extension of Humphreys’ seminal work (1939b), the
response 'Yes' (i.e., the prediction that the left light bulb would flash) was reinforced on
100% of the trials in the training phase with full reinforcement (condition full). In
contrast, the response 'Yes' was only reinforced probabilistically in the partial
reinforcement conditions. In the extinction phase, 'Yes' was never reinforced. Similar to

42
Humphreys, the results demonstrated that in the extinction phase, 'Yes' responses
decreased faster for the full reinforcement schedule group than for the partial
reinforcement schedule groups. However, during acquisition, learning was faster as the
reinforcement rate increased.
Hochman and Erev (2013) replicated the PREE using the clicking paradigm. One
of their studies focused on the following problems:
Problem 26-- continuous (r=100, n=11, FB=complete, 1 point=¢0.25)
S 8 with certainty
R 9 with certainty
Problem 27 – partial (same procedure as in Problem 34)
S 8 with certainty
R 17 with probability 0.5
1 otherwise
Problem 28 – extinction (same procedure as in Problem 34)
S 8 with certainty
R 1 with certainty
The study included two phases, acquisition (the first 100 trials) and extinction (the
last 100 trials). During the acquisition phase one group of participants (the continuous
group) played Problem 26, and the second group (the partial group) played Problem 27.
During the extinction stage, Option R was no longer attractive: Both groups were faced
with Problem 28 at this phase. The participants were not informed that the experiment
included two phases.
The results (c.f. Figure 5) reveal more R choices in the continuous group during
the acquisition phase and the opposite pattern during the extinction phase. Thus, payoff

43
variability slows the initial learning to prefer R during acquisition, but it also slows the
extinction of this behavior.
<Insert Figure 5>
Hochman and Erev (2013) show that the PREE pattern, they observed, can be
captured with a variant of I-SAW that adds the assumption that perceived similarity is
determined by the sequence of the last 4 outcomes from R. In order to clarify the
intuition behind this observation consider the decision at trial 106 after the payoff
sequence “1,1,1,1” from R. The participants in the continuous group saw this pattern
only once is the past (at trial 105), and the outcome from R in that case was disappointing
(R gave 1, and S paid 8). Thus, they are predicted to select S. In contrast, the
participants in the partial group have seen this sequence several times during the first 100
trials, and in some of these cases it was follow by high payoff from R (17); thus,
depending on their exact sample they may choose R.
2.2 Spontaneous alternation, the gambler fallacy and response to patterns
Tolman (1925) observed an interesting violation of the law of effect in a study of
rats’ behavior in a T-maze. Upon receiving a reinforcement in a particular arm, rats tend
to switch to the other arm of the maze. According to the common explanation to this
spontaneous alternation pattern (see review in Dember & Fowler, 1958), it reflects a
tendency to respond to the likely sequential dependencies in natural settings. That is, in
most environments where rats eat (e.g., storehouses and garbage dumps) food is
replenished independently of feeding. Thus, after eating the food in one location, it is
typically optimal to move to a different location.
More recent studies use a similar argument to explain probability matching (see
Estes, 1976; Sonsino, 1997; Gaissmaier & Schooler, 2008) and underweighting of rare
events (Plonsky & Erev, 2013). These phenomena can be a result of an effort to respond
to patterns and sequential dependencies in the environment that implies reliance on small
samples. When the environment is static and noisy, this effect impairs maximization.
When the environment changes in a consistent fashion, however, sensitivity to sequential
dependencies can be very useful if the (see e.g., Gonzalez et al., 2003; Sterman, 1989).
One example of effective adaptation to consistent change is provided by the the
44
continuous condition in the PREE studies (e.g., the change from Problem 26 to Problem
28). Gaissmaier and Schooler (2008) show that people can response to consistent pattern
even when the detection of the pattern requires sensitivity to the last 12 outcomes.
2.3 Negative and positive transfer
The effect of learning in one task on the performance of a different task is referred
to as transfer. Transfer is highly sensitive to the characteristics of the two tasks (see
Osgood, 1949; and analysis of economic implications in Cooper & Kagel, 2003).
Whereas many studies document positive transfer (improved performance on the second
task), other studies document no transfer and even negative transfer. Moreover, many
studies report both negative and positive transfer in the same setting. One example is
provided by the transfer from Problem 26 to 28 discussed above: The initial transfer in
this case is negative (less than 50% maximization rate in the first few transfer trials), but
the long term effect is positive (higher maximization rate in Problem 28 when it is played
after problem 26).
One explanation for the existence of positive and negative transfer involves the
assertion that people learn cognitive strategies (rather than situation specific actions). For
example, in Problem 26 they might learn to prefer "Best reply to recent experiences" over
"Alternation". This learning leads to negative transfer in the first trials of Problem 28 (S-
rate below 50%), but to positive transfer after sufficient experience with Problem 28
when the recent experience implies that S leads to better outcomes.
2.4 The effect of delay and melioration
Thorndike (1911) demonstrates that behavior is highly sensitive to the timing of
the reinforcement. Delay of the reinforcement slows learning. This tendency implies
(see Kagel, Battalio & Green, 1995) that animals behave as if they prefer a smaller
immediate reward to a larger delayed reward and that this preference is not consistent
with a simple discounting explanation. A clear demonstration of this pattern is provided
by Green et al. (1981) in a study that used a variant of the clicking paradigm.
Each trial consisted of a 30 second choice period during which a pigeon was
presented with a choice between two keys, followed by an outcome. One key led to a
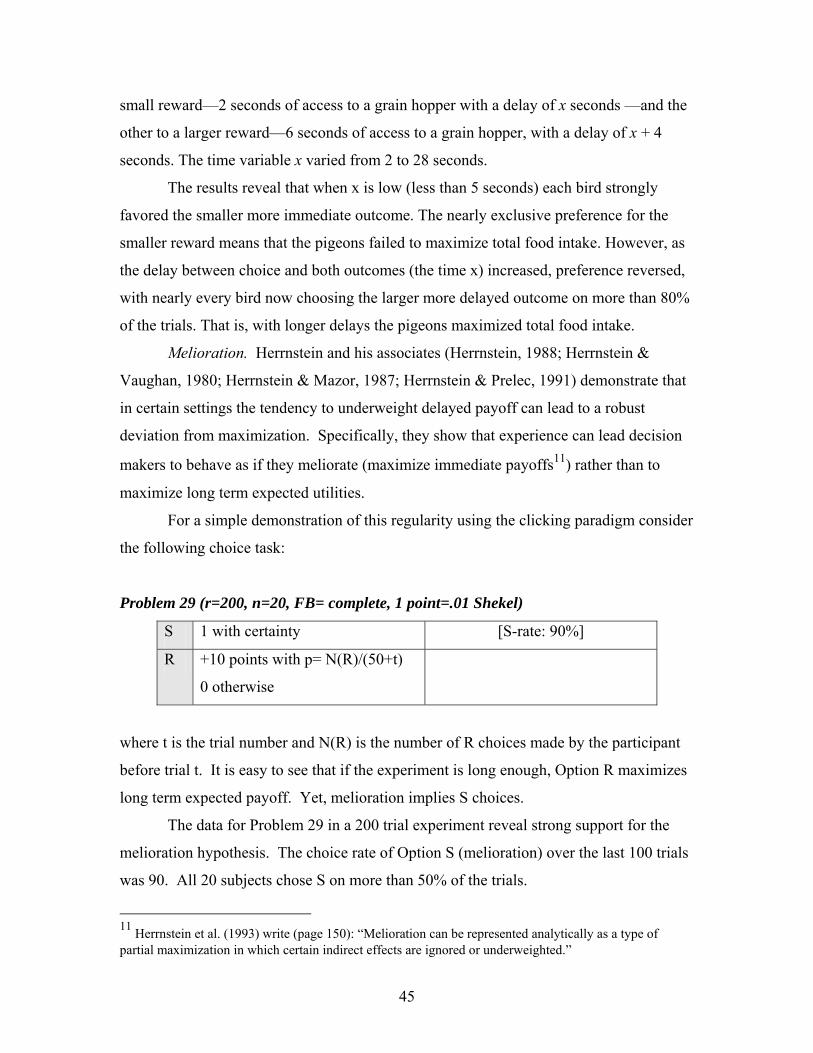
45
small reward—2 seconds of access to a grain hopper with a delay of x seconds —and the
other to a larger reward—6 seconds of access to a grain hopper, with a delay of x + 4
seconds. The time variable x varied from 2 to 28 seconds.
The results reveal that when x is low (less than 5 seconds) each bird strongly
favored the smaller more immediate outcome. The nearly exclusive preference for the
smaller reward means that the pigeons failed to maximize total food intake. However, as
the delay between choice and both outcomes (the time x) increased, preference reversed,
with nearly every bird now choosing the larger more delayed outcome on more than 80%
of the trials. That is, with longer delays the pigeons maximized total food intake.
Melioration. Herrnstein and his associates (Herrnstein, 1988; Herrnstein &
Vaughan, 1980; Herrnstein & Mazor, 1987; Herrnstein & Prelec, 1991) demonstrate that
in certain settings the tendency to underweight delayed payoff can lead to a robust
deviation from maximization. Specifically, they show that experience can lead decision
makers to behave as if they meliorate (maximize immediate payoffs11) rather than to
maximize long term expected utilities.
For a simple demonstration of this regularity using the clicking paradigm consider
the following choice task:
Problem 29 (r=200, n=20, FB= complete, 1 point=.01 Shekel)
S 1 with certainty [S-rate: 90%]
R +10 points with p= N(R)/(50+t)
0 otherwise
where t is the trial number and N(R) is the number of R choices made by the participant
before trial t. It is easy to see that if the experiment is long enough, Option R maximizes
long term expected payoff. Yet, melioration implies S choices.
The data for Problem 29 in a 200 trial experiment reveal strong support for the
melioration hypothesis. The choice rate of Option S (melioration) over the last 100 trials
was 90. All 20 subjects chose S on more than 50% of the trials.
11
Herrnstein et al. (1993) write (page 150): “Melioration can be represented analytically as a type of partial maximization in which certain indirect effects are ignored or underweighted.”

46
Herrnstein, Lowenstein, Prelec and Vaughan (1993) show that melioration
decreases with clear information concerning the long-term effect of available choices.
Thus, the evidence for melioration is best described as indication of cognitive limitations
and/or insufficient exploration.
2.5 Models of learning in dynamic settings.
Gonzalez et al. (2003) show that the main properties of decisions from experience
in dynamic settings can be captured with a variant of the ACT-R model (see Anderson &
Lebiere, 1998) that assumes similarity-based weighting of all the relevant experiences.
Under this model, decision makers are assumed to overweight a small set of experiences
that occurred in situations that seem most similar to the current setting, and give lower
weight to other experiences. As noted above, this idea was also found to capture
behavior in static settings: It is the basis of the instance based model that won the choice
prediction competition described in section 1.3.1.
A shortcoming of the similarity-based approach is the determination of a
similarity function. Different studies appear to support different similarity functions. For
example, Gonzalez et al. show the value that assume an important role for temporal
similarity, and Hochman and Erev's (2013 and Section 2.1) results are best fitted with
assertion that similarity is determined by the sequence of the last four outcomes. Plonsky
and Erev (2013) suggest that these apparent inconsistencies can be a reflection of the fact
that people consider a wide set of similarity functions, and try to select the best function.
When the environment is highly dynamic and predictable, the probability of success is
high. However, when the environment is noisy, the probability of success is low, and the
observed behavior can be approximated by the simplification assumption, used in Section
1.1.7, that states reliance on small samples of randomly selected past experiences.
Recent research shows that the current and similar results can also be captured
with reinforcement learning models that include a recognition process that categorize
cues into situations (see Redish et al., 2007). Gershman, Blei and Niv (2009) refine this
observation and show the value of Bayesian inference within a reinforcement learning
mode that assumes an unbounded number of latent causes.

47
3. Multiple alternatives and additional stimuli
Unlike the simple binary-choice clicking experiments, reviewed above, most
natural activities involve learning among multiple alternatives based on multiple sources
of information. Even in the road crossing example, the decision maker can choose
between many actions (different ways to cross the road and different alternatives to this
behavior), and can use many signals. Experimental studies that explore learning among
multiple alternatives, and the effect of different signals, are reviewed below.
3.1 Successive approximations, hill climbing and the neighborhood effect
Skinner (1938) highlights the value of the “method of successive approximations”
(also known as “shaping”) for teaching complex behavior. Shaping is used when the
desired behavior is not observed initially. The procedure involves first reinforcing some
observed behavior only vaguely similar to the one desired. Once that behavior is
established, the trainer looks for (reinforces) variations that come a little closer to the
desired behavior, and so on. Skinner and his students have been quite successful in
teaching simple animals to do some quite extraordinary things. For example, they taught
a pigeon to control a missile (Glines, 2005).
The basic idea behind the method of successive approximations is the assumption
that there are many strategies that can be used in an attempt to perform a complex task.
That is, the set of feasible strategies is very large. The agent tends to consider strategies
similar to the reinforced strategies. As a result, learning does not insure convergence to
the globally optimal strategy. It can lead to a local optimum. The method of successive
approximations is effective because it reduces this risk (at least when the trainer has a
good understanding of the location of the optimal strategy).
A clear demonstration of the tendency to converge to a local optimum is provided
by Busemeyer and Myung’s (1988) examination of choice behavior in a multiple
alternative resource allocation task. In each trial the participants were asked to divide
limited resources among three issues. Each allocation can be abstracted as a selection of
one of many possible allocations (strategies) that can be placed in a triangle (called the
simplex). The results reveal that performance is highly sensitive to the location of the
different strategies in the simplex. Higher maximization rate was observed when the best
48
strategies were in the same “neighborhood.” Busemeyer and Myung (1988) note that this
regularity can be captured by a hill climbing search process.
Erev and Barron (2002) replicated this observation in a study that focused on
Problems 30 and 31 using the clicking paradigm with limited feedback. Both problems
involve a choice among the same 400 alternatives. Each alternative is associated with
only one outcome. The two problems differ with respect to the location of the 400
alternatives in the 20X20 matrix presentation. The top panel in Figure 5 shows a three-
dimensional summary of the two matrices. It shows that both matrices have two
maximum points (a local maximum of 32 and a global maximum of 52). The conversion
rate was ¢0.25 per point. In Problem 30 the local maximum (32) had a wide basin of
attraction. Problem 31 was created by swapping the location of the two maxima; thus,
the global maximum (52) had the wide basin of attraction.
<Insert Figure 6>
The lower panel in Figure 6 presents the proportion of maximization under the
two conditions. In line with Busemeyer and Myung’s findings, the decision makers were
closer to maximization in Problem 31 (global maximum with wide basin of attraction)
than in Problem 30. Since maximization rate seems to depend on the relative location of
the global maximum we refer to this result as the “neighborhood effect.” Yechiam et al.
(2001) clarify the relationship between convergence to local optimum and shaping. They
show that a minimalistic shaping procedure, the prevention of repeated choice, reduces
the tendency to converge to a local maximum in a variant of Problem 30.
Implications to descriptive models. The attempt to model learning among multiple
alternatives given incomplete feedback highlights the importance of the details of the
assumed exploration process. Busemeyer and Myung (1988) show that the main features
of the exploration process can be captured with a hill climbing rule. Erev and Barron
(2002, and Yechiam et al., 2001) show the value of modeling hill climbing as one of
several cognitive strategies. The model assumes reinforcement learning among these
strategies. Rieskamp et al. (2003) highlight the value of a model that assumes a focus on
the difference between the current results and the best past experience.

49
Analyses of exploration by firms (Levinthal & March, 1993; Gavetti & Levinthal,
2000) highlight the value of a distinction between two types of exploration: forward
looking, and backward looking. Teodorscu and Erev (2013) demonstrate the value of this
distinction in capturing the results of experimental studies of choice behavior among
multiple alternatives using the clicking paradigm. Their results reflect insufficient
exploration in "rare treasure problems" (when the common outcome of exploration is
disappointing), and over-exploration in rare mines problem (when the common outcome
of exploration is attractive). These results can be captured with an extension of I-SAW
that assumes a choice between cognitive strategies (exploration or exploration) before the
choice between the actions.
3.2 Learned helplessness
Overmier and Seligman (1967) found that dogs exposed to inescapable shocks in
one situation later failed to learn to escape shock in a different situation where escape
was possible. Follow up research (see review in Maier & Seligman, 1976) shows that
this “learned helplessness” phenomenon is robust across species and experimental
paradigms, and provides an insightful account of human depression.
The simplest explanation of learned helplessness involves the assertion that dogs
can react to a shock (or to a light that signals that a shock is coming) in two ways: “Try to
escape” or “Find a position that minimizes pain”. Thus, experience with inescapable
shocks reduces the tendency to select the try-to-escape option. Under this explanation
learned helplessness is an example of melioration. The subjects fail to escape because
they do not explore enough. Early experiences with unsuccessful escape attempts drive
behavior even though the attempt to escape is the strategy that maximizes long-term
outcome. In other words, the behavior demonstrated in the basic 2-button study of
Problem 29 is an example of melioration and of learned helplessness.
3.3. Multiple alternatives with complete feedback
An increase in the number of possible alternatives increases the importance of the
availability of information concerning the forgone payoffs. When the payoff variability
is low, the availability of complete feedback facilitates maximization and leads to very

50
quick learning to prefer to best option (Grosskopf et al., 2006). However, when the
payoff variability is large, the availability of complete feedback can lead to the big eyes
affect (see Section 1.1.2) that can impair maximization.
Ert and Erev (2007) examined a 50 alternative problem (using the clicking
paradigm with forgone payoff) in which the predictions of the big eyes effect contradicts
the predictions of underweighting of rare events. Half of the 50 alternatives provided 3
with certainty, and the other half provided 32 in 10% of the trials, and 0 otherwise. Thus,
the risky option maximized expected value, and the big eye effect implies risky choice
(because the best outcome over the 50 alternatives tends to be 32 from one of the risky
alternatives). The choice rate of the risky option (after 50 trials) was only 40%. It seems
that in the current setting underweighting of rare event is stronger than the big eyes
effect. This pattern can be captured with the assertion that regret reduces payoff
sensitivity. Another explanation assumes limited attention. Specifically, it is reasonable
to assume that when the number of alternative is very large people cannot attend to all the
forgone payoffs (see related idea in Camerer & Ho, 1999).
3.4 The effect of additional stimuli (beyond clicking)
The current review focuses on the direct effects of obtained and forgone payoffs
on choice behavior. We believe that these effects are the most important drivers of
human adjustment to economic incentives. Yet, in certain settings other factors can
affect this adjustment process. Two important examples are discussed below.
3.4.1 Pavlovian (classical) conditioning
The early psychological study of learning distinguishes between two classes of
basic processes: instrumental and Pavlovian conditioning. Instrumental conditioning
(also known as operant conditioning) describes behavior in situations in which the agent
learns to prefer specific voluntary actions that affect the environment. Thus, all the
studies summarized above are examples of instrumental conditioning.
The early definition of Pavlovian conditioning focuses on the association between
two stimuli. For example, in each trial of Pavlov’s (1927) classical study, dogs were
presented with a bell few seconds before receiving food. At the beginning of the study,

51
the bell elicited no response, and the food elicited salivation (unconditioned response,
UR). Thus, the bell is called a conditioned stimulus (CS), and the food an unconditioned
stimulus (US). After several trials the dogs started salivating immediately after hearing
the bell.
At first glance Pavlovian conditioning does not appear to be very important in the
analysis of economic behavior. However, Rescorla and Solomon (1967) show that more
careful analysis can lead to different conclusions: Since Pavlovian conditioning
determines emotion and related innate states, it is natural to assume that it affects the
subjective interpretation of the choice environment. Rescorla and Solomon (1967, and
see related ideas in Mowrer, 1947) propose a two-process model that captures this idea.
Under this model, instrumental conditioning drives learning in each subjective state, but
Pavlovian conditioning determines the subjective state. Since agents are likely to learn
different behavior in different subjective states, Pavlovian conditioning can be highly
important.
One example of the importance of the subjective states is provided by the
dynamic task considered in Section 2. In this setting, distinction between the different
objective states of the world enhances performance. Thus, if Pavlovian conditioning
determines the agent’s responsiveness to these and similar states, it determines, in part,
the learning process.
It is interesting to note that Rescorla and Solomon’s theory implies a very
different effect of emotions than the common abstraction in economic models of emotion.
Under the common abstraction (e.g., Fehr & Schmidt, 1999; Bolton & Ockenfels, 2000),
emotions like inequality aversion affect subjective utility. For example, people reject
unfair offers in the Ultimatum Game because the rejection reduces disutility (negative
emotion) from inequality (Fehr & Schmidt, 1999; Bolton & Ockenfels, 2000). Rascorla
and Solomon’s analysis can be used to support the assumption that the main effect of
emotion involves the generalization from specific past experiences. In other words,
rejection of unfair offers may be a product of an emotion that directs the agent to select a
behavior learned in an environment in which rejection of unfair offers is adaptive.
Another example of the economic implications of Pavlovian condition involves
addiction. Smith and Tasnádi (2007) show that “harmful” addiction can be result of a

52
mismatch between behavioral (learning) algorithms encoded in the human genome and
the expanded menu of choices faced by consumers in the modern world.
3.4.2 Observational Learning
Observational learning refers to learning by observing others’ decisions and
payoffs. A number of animal studies support observational learning. Terkel (1996)
shows that young rats learn to skin pine cones by observing their mothers. John et al.
(1969) show that cats can learn tasks by observing the performance of an animal already
trained in that particular task.
Miller and Dollard (1941) argued that observational learning is no different than
simple reinforcement learning in that observational learning involves situations where the
stimulus is the behavior of another person and the payoff maximizing behavior happens
to be a similar behavior. In one of their experiments, first grade children were paired,
with one in the role of “leader” and the other in the role of “follower.” In each trial, the
children sequentially entered a room with two boxes. In one of the boxes, there was
candy. The leader first chose a box and obtained any candy that was in there. The
follower observed which box the leader chose but not the outcome of that choice. Next,
the contents of the boxes were emptied and candy was again placed in one box. The
placement of the candy was manipulated in two treatments. In one treatment, the candy
was placed in the box previously selected by the leader. In the other treatment, candy was
placed in the box not chosen by the leader. The follower then entered the room and chose
a box. After a few trials, children in the first group always copied the response of the
leader and children in the second group made the opposite response.
Bandura (1965) argued that the payoff received by the observed person should
matter in the decision of whether to imitate that person. In Bandura (1965), a group of
four-year-old children watched a short film on a TV screen in which an adult exhibited
aggressive behavior towards an inflated ‘bobo doll’. The children then saw the aggressor
being reinforced by another adult. In one treatment, the aggressor was praised and given
soda and snacks. In a different treatment, the adult was scolded, spanked and warned not
to do it again. The children were then left in a room with the doll along with other toys.

53
The imitation and aggression were more pronounced when the adult was observed by the
children receiving a reward for his actions and less pronounced when the adult was
punished.
Merlo and Schotter (2003) raise the prospect that in some settings observational
learners may learn better than subjects engaged in the task. In their experiments, subjects
chose a number between 0 and 100. The higher the number chosen, the higher the cost
incurred by the subject and the higher the probability of winning the high prize, resulting
in an interior optimal choice of 37. Subjects in the baseline experiment repeated the
decision task 75 times and were paid a small amount after each trial. As each subject
performed the experiment another subject watched over his or her shoulder. In the end of
the 75 trials, the observers as well as the active subjects were both given one round of the
task with high stakes. The median choice in the high stakes decisions by the observers
was 37 (the optimal choice), whereas the median choice by the subjects who engaged in
the small stakes task 75 times was 50. Merlo and Schotter (2003) offered this as evidence
that the observers learned more effectively than the subjects engaged in the task.
Anderson and Holt (1997) studied an interesting situation in which equal
weighting of personal information and observation learning (the implied information
obtained by other) leads to information cascade (that is, it stops the accumulation of
knowledge). Their results show a lower rate of information cascade than predicted under
the rationality assumption. This pattern can be explained by the assumption that people
overweight their personal information. Clear support for this assumption is provided by
Simonsohn et al. (2008). The participants in their studies received feedback concerning
their payoffs (personal experience) and the payoffs of other agents. The results show that
the effect of the personal experience was much larger than the effect of the experiences of
others. Alos-Ferrer and Schlag (2009) review theoretical research that focuses on the
value of imitation as a learning strategy. Their analysis demonstrates that payoff
sensitivity of the imitation rule facilitates the social value of imitation. Efficiency can
increase by a tendency to rely on personal information if the advantage of imitation is
small.
4. Social interactions and learning in games

54
It is constructive to distinguish between two main effects of the social
environment on choice behavior. First, the social environment can affect the strategies
considered by the decision makers, and/or the utility from the obtained payoffs. For
example, it can lead the decision makers to consider strategies that facilitate
reciprocation, increase fairness, and/or build trust. The second effect is indirect: the
social interaction affects the obtained payoffs, and these payoffs shape behavior.
Most previous experimental studies of social interactions (games) focus on the
direct "reciprocation-related" effects of the social environment (see Cooper & Kagel,
2012). The current review tries to complement this research by focusing on the indirect
effect of the social environment. It builds on the observation (Roth & Erev, 1995, Erev
& Roth, 1998) that there is wide set of situations in which the understanding of the
obtained payoffs is sufficient to predict the outcome of social interactions. The effect of
experience in this space of social situations is similar to the effect of experience in
individual choice tasks, and it can be approximated with simple reinforcement learning
models like I-SAW. One class of social interactions that belongs to this "basic shaping"
space is the class of market entry games examined in the choice prediction competition
described in Section 1.3.2. The best prediction of the outcome of this class of social
interactions was provided by models that were developed to capture the basic properties
of learning described in Section 1.1.
The main goal of the current section is to clarify the boundaries of the basic
shaping space. Specifically, it examines the conditions under which the outcome of
complex social interactions can be reliably predicted based on simple models that assume
learning among the possible alternatives. In addition, it tries to shed light on the
assumptions that has to be added to the basic models in order to capture behavior beyond
this basic space.
Section 4.1 considers studies of learning in games under limited prior
information. The results reveal examples of "emerged sophistication" that can be
predicted with I-SAW and similar models.
Section 4.2 reviews studies of learning in 2-person constant sum games with
unique mixed strategy equilibrium. The results reveal that prior information can affect

55
the sequential dependencies in the data, but has little effect on the aggregated choice
rates.
Section 4.3 summarizes studies of cooperation and coordination. The results
reveal that under certain conditions players can learn to maximize efficiency by
reciprocating and coordinating. In addition, the results suggest that this "learning to
reciprocate" phenomenon is rather delicate. It is likely to emergence only when all the
following six conditions are met: (1) the agents receive reliable and complete description
of the incentive structure, (2) the benefit from reciprocation is large, (3) the number of
interacting agents is small (four can be is too large), (4) the noise level is low, (5) the
interaction is expected to continue with high probability, and (6) the framing of the task
clarifies the value of reciprocation. These results can be captured with the assertion that
players consider "try to reciprocate" cognitive strategies. Yet, the set of situations under
which these strategies are learnt is not large.
Section 4.4 discusses studies that explore the role of fairness. The results show
that in certain settings people behave as if they try to maximize fairness. However, in
other settings they choose actions that reduce equality even when this action impairs
expected return. This pattern can be captured as another indication of considering, but
not always using "try to reciprocate" cognitive strategies.
Section 4.5 summarizes the main results and discusses alternative explanations
and several open questions.
4.1 Social interactions given limited prior information
4.1.1 The group size effect in mutual fate control games.
Sidowski et al. (1956; and see Colman, 2005; Colman et al., 2010; Delepoulle,
Preux, & Darcheville, 2000, 2001; Mitropoulos, 2001, 2003) studied a minimalistic 2-
person social situation in which the players can help each other, but cannot affect their
own payoff directly. The left-hand side of Figure 7 presents a member of this class of
“mutual fate” games that was studied in a 200-trial experiment by Colman et al. (2010).
<Insert Figure 7>

56
Notice that traditional game theoretic analysis does not have clear predictions for the
current game. Specifically, all four cells are “weak Nash equilibrium” points in a one-
shot play of the game.12 The participants in the typical experimental study of this class of
games do not receive any information concerning the payoff rule, and interact repeatedly
in fixed pairs. The results show that most pairs slowly learn to coordinate on the efficient
outcome (the “1,1” cell). The proportion of efficient coordination after 100 trials is close
to 70%.
Thibaut and Kelley (1959) show that this learning process can be a product of a win–
stay- lose–shift (WSLS) decision rule. This rule implies a repetition of the last choice
after high payoff, and a change after a low payoff.
Colman et al. (2010) examine the effect of the number of interacting players in a
multiplayer generalization of the mutual fate game. In the generalized game the players
are placed in a ring, and each player has a predecessor on her left and a successor on her
right. The payoff of each player is determined by her predecessor (the player receives 1
only if her predecessor chose C), and the action of each player determines the payoff of
her successor.
The WSLC rule implies efficient coordination in multiplayer mutual fate games
when the number of interacting agents is even (see Colman et al., 1990). Colman et al.’s
(2010) experimental results, presented in Figure 7, do not support this prediction. Rather,
they reflect a large qualitative difference between the basic N=2 condition, and the N > 2
conditions. The players learned to coordinate when N=2, but not when N>2. A similar
group size effect was documented by Feltovich, Iwasaki and Oda (2007) in a study of a
Stag Hunt coordination game.
Colman et al. (2010) show that this group size effect can be captured with models
that imply a stochastic WSLC decision rule, and note that this class of models includes
the leading models of decisions from experience in individual choice tasks (like I-SAW)
presented in Section 1.
12 Nash equilibrium is defined as a prediction of the strategies of the different players from which no player has an incentive to deviate. That is, if a player believes that her opponent will follow a particular Nash prediction, she cannot benefit by deviating from this prediction. An equilibrium is “weak” if a deviation does not change the deviator’s payoff.

57
4.1.2 Quick and slow learning in market entry games.
Erev and Rapoport (1998) document surprisingly fast convergence to Nash
equilibrium in 12-person market entry games that were played without prior information
of the payoff rules. In each trial of one of these games, participants chose between
“entering” and “staying out” of the market. Staying out paid a sure payoff of 1. The
payoff for entering was 1 + 2(4 – E), were E is the total number of entrants.
This game has multiple pure strategy equilibria, and one symmetric mixed-
strategy equilibrium. The average number of entrants, at these equilibria, is between 3
and 4. The observed number of entrants in trials 15 to 20 (the last block) was 4.1, and the
mean obtained payoff was between the expected payoff under the mixed and the pure
equilibrium points.
At first glance, this emerged coordination appears to contradict the low predictive
value of the equilibrium predictions in market entry game competition described in
Section 1.3 (the ENO of the equilibrium prediction in this study was below 1). However,
there is a simple explanation to the difference between the two studies. Erev and
Rapoport show that their results can be predicted by reinforcement learning models (I-
SAW is one of the models that can capture these results). These models predicts quick
convergence to equilibrium when the payoff variability is low (as in Erev & Rapoport,
1998), and robust deviations from equilibrium when the payoff variability is high (as in
some of the games in the market entry game competition).
4.2. Learning in constant-sum games with unique mixed strategy equilibrium
A two-person constant-sum game is a simplified social interaction that captures
pure conflict: The sum of the payoffs of the two players is fixed, and the players cannot
reciprocate. The game presented in Figure 8 is an example of a constant sum game with
unique mixed strategy equilibrium. In this equilibrium Player 1 selects A1 with
probability p = 3/8 and Player 2 selects A2 with probability 7/8. Under this mixed
strategy, Player 2 is expected to receive the same payoff from A2 (EV = 0.7(3/8) +
0.6(5/8)) and from B2 (EV= 0.2(3/8) + 0.9(5/8)). Thus, Player 2 is not motivated to
deviate from his predicted behavior. Similar logic holds for Player 1.

58
<Insert Figure 8 Here>
4.2.1. Learning away and limited effect of prior information.
Suppes and Atkinson (1960) examined Figure 8’s game in a 210-trial experiment.
The participants were run in fixed pairs: One participant was assigned to be Player 1, and
the second participant was assigned to be Player 2. The payoffs are the winning
probabilities. For example, if Player 1 selects A1 and Player 2 selects A2, then Player 1
wins with probability 0.7 and Player 2 wins with probability 0.3.
Two information conditions were compared. The payoff matrix was known to the
participants in Condition Known, and unknown in Condition Unknown. The feedback
after each trial was limited, in both conditions, to the realized outcome (Win or Loss).
The results, presented in the left-hand columns of Figure 8, reveal a very small
difference between the two conditions. The following observations summarize the results
under both conditions: (1) The initial choice rates are close to 50%. (2) With experience
Player 2 increases the tendency to Select A2. That is, Player 2 moves toward the
equilibrium prediction. However, this movement is very slow. Even after 200 trials the
proportion of A2 choices is closer to 50% than to the equilibrium prediction (7/8 =
87.5%). (3) Player 1 moves away from the equilibrium prediction: The observed
proportion of A1 choices was above 60% (in equilibrium Player 1 is expected to select
A1 in only 37.5% of the trials).
Follow-up research shows the robustness of the pattern documented by Suppes
and Atkinson (1960). Slow learning, and learning away by one of the players are quite
common in constant sum games with unique mixed strategy equilibria. Ochs (1995)
shows that a similar pattern can be observed in non-constant sum games that are played
“against a population.” (The experiment was run in cohorts of 8 or more subjects in each
role. In each trial all the participants in the role of Player 1 played against all the
participants in the role of Player 2).
Erev and Roth (1998, and see a clarification in Sarin & Vahid, 1999) demonstrate
that learning away by one player is predicted by simple models that assume exploitation
(selection of the alternative that led to the best outcome in the past), and exploration/error

59
(random choice). I-SAW is an example of this class of models. The right-hand column
in Figure 8 shows the predictions of I-SAW (with the parameters estimated above) for the
current game.
Additional indications of the robustness of the current results are presented in
Table 4. This table summarizes the results of experimental studies of three randomly
selected constant sum games. The games were run under two conditions. In Condition
Minimal (see Erev et al., 2002), the participants did not receive a description of the
payoff matrix, and the feedback was limited to the obtained payoff. In Condition
Complete (see Erev et al., 2007) the participants received a complete description of the
payoff matrix and complete feedback. Each game was run for 500 trials under fixed
matching. The results show relatively small difference between the two information
conditions (the correlation is 0.9), and learning away by one of the player in about half of
the games. In addition, the results replicate previous studies (e.g., O’Neill, 1987) that
demonstrate relatively good match between the equilibrium predictions and the observed
choice rate when the equilibrium predictions are between .4 and .6.
<Insert Table 4>
The right-hand column in Table 4 presents the predictions of I-SAW (with the
simplification assumptions and parameters used in Section1) for the complete feedback
condition. The MSD score is 0.0047 and the correlation is 0.93. This fit is better than the
fit of the best model proposed in the original papers.
4.2.2 Sequential dependencies.
Under one interpretation of the results presented above, they imply convergence
to equilibrium when these predictions are close to uniform choice proportions. Several
studies have test and reject this interpretation. Brown and Rosenthal (1990) reanalyzed
O’Neill’s (1987) results and found strong evidence of serial correlation in players'
choices that contradict the equilibrium prediction (that imply no sequential correlations).
The typical subjects exhibit over-alternation. A similar over-alternation bias was also
documented by Rapoport and Budescu (1997) in a symmetric 2x2 game. Shachat (2002)
60
shows that this deviation from the equilibrium emerges even when the players are
allowed to use a randomization device.
Additional research suggests that the exact nature of the sequential dependencies
in constant sum games is situation specific. For example, evaluation of the sequential
dependencies in the constant sum games presented in Table 4 reveals that most subjects
exhibit the opposite bias: Strong inertia (see Slonim, Erev & Roth, 2007). Under one
explanation of this pattern, over-alternation emerges when the players are informed that
they select between objectively identical alternatives.
4.2.3 Modeling robust choice rates and slippery sequential dependencies.
The constant-sum results presented above appear to reflect an interesting
inconsistency: Section 3.2.1 suggests that the aggregated choice rates can be predicted
with the assumption that behavior in different constant sum games is driven by a general
learning model like I-SAW, and Section 3.2.2 suggests situation specific sequential
dependencies. One resolution of this apparent inconsistency is based on the assumption
that the different sequential dependency patterns are reflections of different situation- and
person-specific exploration patterns that have limited effect on the aggregate choice rate
(see a similar idea in Rapoport et al., 1997). This resolution can be naturally abstracted
in a variant of I-SAW that allows for the possibility that during exploration the agents
tend to alternate between alternatives that are known to be similar.
4.3 Cooperation, coordination, and reciprocation.
Rapoport, Guyer and Gordon (1976) show that under certain conditions people
can learn to cooperate in public good games, and can learn to achieve efficient
coordination. A clear demonstration of the emergence of cooperation is provided by the
study of the Prisoner’s dilemma game presented in Figure 9 (Game PD1).
Each player in this 2-person normal-form game has to select between Cooperation
(C) and Defection (D). When the game is played once, D is a dominant strategy (and the
unique Nash equilibrium of the game). That is, each player earns more from selecting D
than from C, independently of the choice of the other player. Yet, both players earn less
when both select D (payoff of -1) than when they select C (payoff of 1).

61
In one of the experimental conditions, the participants played Game PD1 for 300
trials against the same opponent (fixed matching) with immediate feedback after each
trial (and without knowing how many trials would be played). The results (c.f. upper
panel in Figure 9) show an increase in cooperation with experience. The cooperation rate
in the last block was higher than 60%.
<Insert Figure 9 Here>
A clear indication of the emergence of coordination is provided by Rapoport,
Guyer and Gordon's (1976) study of following chicken game:
Game: Chicken 1 Swerve Drive
Swerve 1,1 -1,10
Drive 10,-1 -10,-10
Notice that the game has two pure strategy equilibria, and one mixed strategy
equilibrium. The pure strategy equilibria (Swerve, Drive and Drive, Swerve) are efficient
(joint payoffs of 9) but unfair (one player wins 10 and the other loses 1). At the
symmetric mixed strategy equilibrium, both players Drive with probability 1/2 and the
expected payoff is 0. The results reveal that the participants were able to achieve a high
level of cooperation. The efficient outcome (joint payoff of 9) was obtained in 84% of
the trials. In addition, the results reveal a high level of fairness. The difference between
the proportions of driving choices was lower than 7% for all 10 pairs.
Alternation behavior (that facilitates efficiency and fairness) was also shown by
Arifovic et al. (2006). They show that subjects playing repeated Battle of the Sexes,
where there are two pure strategy Nash equilibrium outcomes each favoring one player,
often fall into a stable pattern of alternation between the two pure-strategy Nash
equilibria. The data provided on the website accompanying the article shows that, out of
16 subjects matched in 8 fixed pairs, 56% individually alternated beginning in period 2.
This is the proportion of subjects who chose a different action in period 2 than they chose

62
in period 1. By period 3, this proportion rose to 88% and by period 6, it reached 94%,
which is all but one of the 16 subjects.
The emergence of cooperation and alternation-based-coordination described
above cannot be captured with basic reinforcement learning models like I-SAW. In the
current context, human agents exhibit higher "social intelligence and/or sensitivity" than
assumed by the basic learning models. In order to clarify the implications of this
observation, the following sections review studies that highlight its boundaries.
The effect of the relative benefit from reciprocation. Rapoport and Chammah
(1965) compare Game PD1 with other six prisoner dilemma games (same qualitative
relationship between the different payoffs). Their results reveal high sensitivity to the
relative benefit from cooperation. For example, when the benefit from unilateral
defection was increased from 10 to 50, the cooperation rate decreased to 27%.
Size matters. The increase in cooperation with experience, discussed above, tends
to weaken and even disappear as the number of interacting subjects gets large (e.g., Isaac
and Walker 1988, Andreoni & Miller, 1993; Daniely, 2000, Huck, Normann &
Oechssler, 2003; Bereby-Meyer & Roth, 2006, Apesteguia, 2006). That is, the likelihood
of “learning to cooperate” is highly sensitive to the number of interacting agents. An
increase in the number of interacting agents tends to increase the tendency to select the
dominant strategy. A similar pattern was documented in the study of coordination games
(Van Huyck et al., 1990; Bornstein, Budescu and Zamir, 1997).
For example, Daniely (2000) compared two versions of Rapoport and Chammah's
prisoner dilemma experiment (using Game PD1). The first was a computerized
replication of the original study. The participants were run in cohorts of four that were
divided into two pairs. Each pair interacted 300 times. The results of this condition were
very similar to the original results. The proportion of cooperation in the last block of 50
trials was 80%. The second condition (c.f. Figure 9) was identical to the first with the
exception that the four participants in each cohort were randomly re-matched after each
trial. This change had a dramatic effect on the results. The proportion of cooperation in
the last block of 50 trials dropped to 10%.

63
Apesteguia (2006) examined a 6-person public good game with and without
description of the payoff rule. The results reveal very similar pattern in the two
conditions. Another source of support to the suggestion that reciprocation is highly
sensitive to the increase from 2 to 4 players is provided by Isaac and Walker (1988).
They examined public good games (that can be described as generalized multi-player
prisoner’s dilemma games). Their results showed a low cooperation rate in 4 player
groups, and similar rates with 7 agents (when the cost of cooperation is fixed).
The role of framing. In addition to the two conditions described above, Daniely
(2000) studied the effect of framing. She tried to replicate the fixed matching study of
Game PD1 with the framing of the task as a transportation problem. Each player
controlled a simulated car that approached a traffic light, and had to decide between
“staying in his lane” and “changing lane.” The decision to change lane increased the
player’s payoff, and decreased the payoff of the other player. The exact payoff rule was
determined by Game PD1 with changing imply D, and staying implies C. As in the
original study, the participant received a complete description of the payoff rule, the
feedback after each trial was complete. The only change between the studies was the
addition the transportation cover story. The results reveal that this addition eliminated
the increase in cooperation. The observed cooperation rate in the last block of 50 trials
was only 18%. Additional indications for the robustness of framing effect in the context
of social interactions are presented by Rottenstreich (1995).
The shadow of the future. Selten and Stoecker (1986) studied behavior in a
sequence of prisoner’s dilemma games. Each player played 25 supergames, where each
supergame consisted of 10 periods play of Game PD2 (first panel in Table 5). Following
each supergame, each player was re-matched to a new opponent. The typical outcome
was initial periods of mutual cooperation, followed by an initial defection, followed by
non-cooperation in the remaining periods. That is, the shadow of the future, the
understanding that the game is about to end, decrease cooperation. The first period of
defection occurs earlier and earlier in subsequent supergames. Selten and Stoecker note
that this learning pattern can be captured with a simple direction learning model.

64
<Insert Table 5>
Andreoni and Miller (1993) studied Game PD3 (second panel in Table 5) using
the Selten and Stoeker sequence of prisoner’s dilemma design. Their results replicated
the decrease in cooperation within supergames documented by Selten and Stoeker, but
observed an increase in cooperation with experience over supergames. The difference
between the two studies can be attributed to the weaker temptation to defect in Andreoni
and Miller’s matrix. This interpretation of the results is supported by Dal Bó and
Fréchette (2007).
Noise matters. Bereby-Meyer and Roth (2006) examined the effect of payoff
variability on choice behavior in a prisoner’s dilemma game under Selten and Stoeker’s
supergame paradigm and under random matching. They focused on Game PD4 (lower
panel in Table 5). In the stochastic condition, the matrix entries represented probability
of winning $1. In the deterministic condition, the entries represented payoffs in cents.
The results reveal an interesting interaction. Payoff variability increased cooperation
given random matching, but impaired cooperation under repeated play.
The effect of prior information. Coordination and reciprocation becomes very
difficult when the agents do not know the incentive structure. As noted in Section 3.1
when the information is limited, coordination is difficult even in a common interest
game.
4.3.1 Alternative abstractions: Social utilities and cognitive strategies
Previous reserach highlights the value of two main approaches to capture the
effect of experience on cooperation and coordination. One approach is based on the
importance of social utilities. For example, an increase with reciprocation can be
captured with the assumption that successul reciprocation is reinforcing (see Macy &
Flache, 2002; Vega-Redondo, 1997; Juvina, Lebiere, Martin & Gonzalez, 2012). One
recent demonstration of the potential value of generality of this approach is the

65
observation that people behave as if they find the act of following advices reinforcing
(see Biele et al., 2009).
A second approach involves the assertion, discussed above, that people learn
among a subset of repeated game strategies. For example, Erev and Roth (2002) assume
that the player considers a “reciprocation” strategy that implies an effort to reach the most
efficient outcome (and punishing opponents that deviate from this play). When this
strategy leads to good outcomes, players learn to select it. In another model (Hanaki et
al., 2005), the players are assumed to consider strategies that can be represented by
automata having no more than two states. Analysis of this model shows that it can
capture the emergence of reciprocation considered above. Alternative abstraction of the
cognitive strategies idea involves a distinction between learning and teaching (see
Camerer, Ho & Chong, 2002; Ehrblatt, Hyndman, Ozbay & Schotter, 2006).
Cooperation emerges under these models when sophisticated players (agents that use
sophisticated strategies) are able to teach their opponents that cooperation in beneficial.
4.4. Fairness and inequity aversion.
Studies of decisions from description demonstrate that in certain cases people try
to avoid inequity (increase fairness) even when this effort decreases their payoff (see
(review in Cooper & Kagel, 2012). Evaluation of the effect of the effect of inequity on
learning reveals mixed results: Some studies show strong evidence for inequity aversion,
but some studies suggest inequity seeking.
One demonstration of the effect of equity on learning is provided by Rapoport et
al. study of the prisoner dilemma game described in Figure 9. Their results show almost
perfect correlation between the payoffs of the two agents in each pair.
Another indication for inequity aversion is provided by studies of repeated
ultimatum games (Guth et al., 1982). In the basic version of this game one player-- the
proposer-- proposes a division of a pie (e.g., $10 in the experiment considered below)
between herself and a second player. In the second stage the second player-- the
responder-- can accept or reject the proposal. If she accepts each player gets the
proposed share. If she rejects, both get nothing. The game-theoretic solution (subgame
perfect equilibrium) states that the proposer should offer the smallest possible amount to

66
the receiver, and the receiver should accept it. Abbink, Bolton, Sadrieh and Tang (2001)
examined a variant of this game in which the proposer's payoff, in the case of a rejection,
are either 0 (as in the original game) or 10. Only the responders were informed of the
proposer rejection payoff. The results reveal that the responders were three times more
likely to reject the unequal split when doing so enhanced equity (both players got 0) than
when it reduced equity (when the rejection payoff to the proposer was of 10).
Indication for inequity seeking is provided by study of betting games (Sonsino et
al., 2002). The results reveal that participants tend to bet even after 250 trials in which
betting decreases equity, and impairs expected return.
4.5. Subjective summary and alternative approaches
The current review of the study of learning in social interactions supports three
suggestions. First, the main difference between learning in games and learning in
individual choice tasks involves the emergence reciprocation: In certain situations agents
learn to increase their payoff by cooperating and coordinating. Second, the emergence of
reciprocation can be captured with the assertion that the agents consider "try to
reciprocate" cognitive strategies. Strategies of this type drive choice behavior when they
are reinforced. Finally, the results suggests that there are many situations in which the
effort to reciprocate has little effect on choice behavior. In these cases the effect of the
incentive structure can be predicted with the basic learning models presented in Section
1.
It is important to recall that the current summary of the results is based on one
research method. Our analysis starts with I-SAW as a benchmark, and used assumptions
concerning cognitive strategies to explain the observed deviations from the predictions of
this benchmark. It is possible that different research methods will lead to different and
more insightful conclusions. We chose to conclude the current section with a discussion
of the potential of three of the methods that were not used here.
4.5.1 More realistic psychological assumptions
Marchiori and Warglien (2008) highlight and explore the value of simple artificial
neural networks as models of learning in games with unique mixed strategy equilibria.
67
The basic model they considered assumes the most elementary learning neural network
architectures: the one-layered analog perceptron (Hopfield, 1987). This model learns by
adapting the connection between the possible payoff and the action in the ex post best
reply direction. The second model was a variant of the basic model that adds the
assumption that the magnitude of the adaptation increases with regret.
The predictions of this model for the 2x2 constant sum game presented in Table 4
are similar to the predictions of I-SAW. Thus, it is possible that Marchiori and Warglien
approach can be used to improve our understanding the brain computations that give rise
to the basic properties of learning processes.
4.5.2 More sophisticated econometrics
The discussion of learning models presented above uses simple computer
simulations in order to derive predictions and evaluate different models. This analysis
has two important shortcomings. First, it is inefficient: It uses only small part of the data
in order to estimate the model. For examples, most analyses focus on the aggregate
choice rates, and ignore the effect of many details of the observed experiences. Second,
it is subjective: We did not use an objective parameter search algorithm. Rather, the
parameters were estimated with a manual greed search procedure.
It is natural to assume that this analysis can be improved with the usage of more
efficient and objective econometric analyses. One demonstration of the potential of
sophisticated econometric analysis in the current setting is presented by Camerer and Ho
(1998). Their analysis focuses on the relative importance of reinforcement and belief
learning. To evaluate this issue they developed a model, referred to as Experience
Weighted Attraction (EWA), which parametrically nests variants of reinforcement
learning and belief learning and allows for estimation of the weight given to the different
processes. Then they used efficient and objective econometric methods to estimate the
parameters of this model. Their analysis suggests that the weight tend to be between 0
and 1, and that the EWA significantly outperforms the two basic models. In addition,
their analysis suggests that allowing game-specific parameters significantly improves the
fit. Thus, it is possible, using EWA, to estimate the factors that drive learning in a
particular game. This observation has been effectively used by many researchers to shed

68
light on learning processes (e.g., Anderson & Camerer, 2000; Arifovic & Ledyard, 2004;
Amaldoss & Jain, 2005; Rapoport & Amaldoss, 2004).
Recent research shows, however, that econometric analysis of learning models
should be viewed with some caution. Feltovich (2000) show the ranking of different
models can be highly sensitive to the selected statistic. He generated predictions from
two models (under several parameterizations) using two different approach. Under one
approach, the predictions were made in each period based on the entire history of play of
the individual up to that period (as in Camerer and Ho, 1999). In another, the predictions
were made for the entire path of the game based only on game payoffs and initial
conditions (as in Roth and Erev, 1995). The results reveal serious inconsistencies in the
comparative rankings of the models between the results of the two approaches.
Salmon (2001) argued that human decision makers are not likely to use the
precise specification as the econometric model being estimated. Therefore, he argued, a
desirable characteristic of a model is that it be able to identify characteristics of the
underlying decision making process, even if that process does not exactly correspond to
the econometric model being estimated. As in Feltovich, Salmon takes the view that the
definition of a model includes the parameter values affixed to it. Salmon simulated data
for constant sum normal form games, from EWA, with different sets of parameters
values, representing Cournot best response as represented under EWA, fictitious play as
represented under EWA, and reinforcement learning as represented under EWA, as well
as from a straight fictitious play and from a population mix of two pure subpopulations.
He then estimated the models of Mookherjee and Sopher (1994, 1997), which have both
reinforcement learning and belief learning variants, and Cheung and Friedman, which is
only specified for belief learning. He finds that the models have mixed success in
separating out belief learning populations from reinforcement learning populations, with
special difficulty in the latter. Most surprising is the finding that EWA only had correct
identification of populations (that were originally generated by EWA) in only 50% of the
cases. Salmon notes that this is because the reinforcement learning and belief learning
populations generate very similar patterns of behavior, a finding echoed by Feltovich
(2000). These similar patterns impair accurate estimation of the data-generating process.

69
As in Salmon (2001), Wilcox (2006) uses simulations to see if models (EWA in
particular) could capture properties of behavior under model misspecification. Wilcox
(2006) shows that the estimate of the “attention to foregone” parameter of EWA is highly
sensitive to heterogeneity. In a careful study, Wilcox (2006) generated simulated data for
a matching pennies game and stag hunt games coming from an EWA population with
zero, low or high heterogeneity on all parameters except the “attention to foregone”
parameter. He then estimated the EWA on the data using pooled estimates (assuming no
heterogeneity). He found that even with low heterogeneity, the estimate of the “attention
to foregone” parameter is dramatically downward-biased. With high heterogeneity, the
bias is so large that the estimated value of “attention to foregone” is alarmingly close to
zero, even when the true value is 1. Therefore, without accounting for heterogeneity, one
might erroneously conclude that subjects do not pay attention to foregone payoffs to the
extent they actually do. Likewise, the estimated values of other important parameters may
be biased and misinterpreted.
4.5.3 The long term and intermediate term
The most elegant analysis of the effect of learning on economic behavior involves
the analytical derivation of the long-term properties of simple adaptive models (see e.g.,
Milgrom and Roberts, 1990; Kalai & Lehrer, 1993; Kandori, Mailath & Rob, 1993;
Fudenberg & Levine, 1998 Hart & Mas Collel, 2001).
This line of research results in two main insights. The first insight is that under
standard assumptions adaptive models converge to some Nash equilibrium (Kalai and
Lehrer, 1993). This link between adaptive convergence and equilibrium has been carried
father to where adaptive models have become an integral tool of game theoretical
predictions. For example, in games with multiple equilbria, evolutionary adaptive
dynamics can serve as both an equilibrium selection and an equilibrium refinement tool
(Kandori, Mailath and Rob, 1993). As another example, in finite strategy supermodular
games with multiple equilibria, the convergence of any adaptive process has been shown
to be bounded by and linked to the set of Nash equilibria (Milgrom and Roberts, 1990).
A second and equally important insight is that under simple assumptions (e.g.,
infrequent switching), adaptive models are in the long run approximately optimal from

70
the decision maker’s point of view in that they ensure that the decision maker’s payoff is
nearly the best possible payoff against the historical frequency of play by his opponents.
Fudebnberg and Levine (1998) show this property for smooth fictitious play, where the
probability of each action is an exponential function of that action’s utility against the
historical frequency of the opponents’ play. They also discuss other models that have this
property. Hart and Mas Collel (2001) generalize this to broad class of adaptive models of
which fictitious play is one case.
Roth and Erev (1995) clarify one limitation of the focus on “data free” long term
predictions. They show that small details of learning models that have limited effect on
the intermediate term predictions (the predictions that can be validated in experiments
lasting from two trials to thousands of trials) can drive the long term predictions
(behavior following many millions of trials). For example, the assumed discounting rate
in the model reinforcement learning model considered by Roth and Erev has no effect on
the predicted behavior in the ultimatum game after 10,000 trials, but it determines if
behavior will converge to the subgame equilibrium after millions of trials.
Recent research on the convergence properties of learning models addresses this
critique with a focus on models that converge to the observed experimental results. One
elegant example is provided by Quantal Response Equilibrium (McKelvey & Palfrey,
1995). This model that assumes consistent exploration (or a noisy response rule) and
sensitivity to exploration by others at equilibrium, provides an insightful summary of
behavior for a wide set of situations (see e.g., Anderson, Goeree & Holt, 2001; Goeree,
Holt & Palfrey, 2002).
Other elegant examples of the value of descriptively motivated equilibrium
models are offered by Impulse Balance Equilibrium (see Ockenfels & Selten, 2005;
Selten & Chmura, 2005), and by Sampling Equilibrium (Osborne & Rubinstein, 1998)
that approximates the intermediate term predictions of I-SAW.
5. Applications and the Economics of Small Decisions
The experimental studies reviewed above focus on small decisions: The stakes in
the typical experimental task were small, and the participants did not invest very much
time and/or effort in each choice. Nevertheless, we believe that the behavioral

71
regularities documented in this research can be of high practical value. Our belief is
based on three sets of observations. First, many important economic phenomena are the
direct product of small decisions. For example, small decisions by drivers (e.g., the
decisions between the gas and the break pedal) affect traffic accidents, traffic jams, and
pollution. Similarly, small clicking decisions by internet users determine the future of
newspapers, and of the music industry.
Second, in many settings high stakes decision problems are shaped by small
decisions. For example, consider the high stake decision among different job offers. In
many cases this big decision problem is affected by earlier small decisions. The job
offers available to a specific college graduate are likely to depend on small decisions that
she has made as a child and as a student. Small decisions that lead to high grades, and
good connections tend to improve the job offers.
A third set of observations come from studies that directly examine and
demonstrate the practical implications of the learning phenomena presented above. Some
of these studies are reviewed below.
5.1 The negative effect of punishments
The most influential contribution of the experimental analysis of learning is
probably Skinner’s (1953) clarification of the negative effects of punishment. Skinner
focused on an environment in which (benevolent) “teachers” can use both reinforcements
and punishments to shape the behavior of “students.” His analysis shows that the overall
effect of punishments can be negative even when they appear to be effective in reducing
the frequency of the punished behavior. Specifically, the overall effect of punishments
depends on the existence of “avoidance options”: behaviors that differ from the shaping
goals, but can protect the students from punishments. An extreme example is the effect
of punishments to facilitate effective reading and writing. When the teacher punishes
errors, the student can learn to avoid these punishments by not coming to school.
Skinner’s simple observation was among the most important triggers for policies
that banned the use of corporal punishments in school. Analysis of the effect of these
“less punishment” policies suggests that they are associated with a decrease in the school
dropout and crime (Straus, 1991).

72
Notice that Skinner’s insight builds on three of the phenomena described above.
First is melioration by the students. The tendency to avoid punishment by dropping out
from school can be a reflection of insufficient sensitivity to delayed outcomes. A second
phenomenon is convergence to local maximum: Most students’ who had failed to master
reading and writing could master these skills if they would have continued to explore
different studying and remembering methods, but they gave up too early. Finally, the
teachers’ tendency to punish bad performance can be a reflection of underweighting of
rare events (that can be the product of reliance on small samples). From the teacher’s
point of view, the common outcome of punishment tends to be positive (the students try
harder), and the problematic avoidance reaction is rare.
5.2 The enforcement of safety rules.
The research reviewed above has six implications for the design of safe working
environments (see Erev & Rodensky, 2004; Schurr, Erev & Rodensky, 2012; and related
ideas in Zohar, 1980). First, the results suggest that rule enforcement is necessary even
when safe behavior (e.g., the use of safety equipment) is the rational course of action.
The explanation of the relevant risks might not be enough. When workers make
decisions from experience they are likely to underweight the low-probability-high-hazard
event and behave as if they believe “it won’t happen to me.”
A second implication involves the negative effect of punishment, described above.
Punishment can be effective enforcement method only when the risk of problematic
avoidance behavior is sufficiently low.
Two additional implications concern the effectiveness of rule enforcement systems
in which a small proportion of the violations are severely punished (see Becker, 1968).
The current review implies that systems of this type are likely to be effective in the
context of decisions from description, but less effective or ineffective in the context of
decisions from experience. When decisions are made from experience, low probability
punishments are likely to be underweighted. A related implication comes from studies of
the importance of fairness considerations in social interaction, as in the studies of the
ultimatum game discussed earlier. This research suggests that the implementation of
“low probability heavy punishments” may be very difficult if subjects of the recipient

73
role can affect the enforcers (proposer role). Under the assumption that punishment may
seem unfair (because only some violators are punished), some recipients are likely to
retaliate even if retaliation is costly to them. Thus, enforcers (proposers) might learn to
avoid using these punishments.
A fifth implication is optimistic. It implies that the fact that workers take
unnecessary risks and behave as if they ignore safety rules does not imply that they will
object to attempts to enforce these rules. Indeed, the observation that low probability
events are over-weighted in decisions from description implies that when workers are
explicitly asked to consider the safety issue they will agree that they want to behave
safely, and will be happy to see that the management designs a rule enforcement system
to help them achieve this goal.
Finally, the arguments presented above suggest that behavior is much more
sensitive to the probability than to the magnitude of the punishment. Thus, a gentle
Continuous Punishment ("gentle COP") policy that implies low punishments with high
probability can be very effective (as long the fine is larger than the benefit from
violations of the rule and the risk of avoidance behavior is low).
Erev and Rodensky (2004, and see Erev, 2007) applied this “gentle COP” method
in twelve Israeli factories. The basic idea was the design of a mechanism by which
supervisors will be encouraged to approach each worker who violates the safety rule and
remind him that this behavior might result in injury, and will be recorded (if repeated).
The official role of these “violations records” was to allow the management to positively
reinforce workers who observe the safety rule by giving these workers a higher
probability of winning a lottery. Baseline data were collected about two months prior to
intervention. The data included objective measures of the workers’ safety behaviors (c.f.
Figure 10). The intervention started with a formal presentation of the new policy to all the
workers. Figure 10 presents measures of safety related behavior before and after the
presentation in one of the departments in one of the twelve factories. The data were
collected by the research team, and were independent of the supervisors’ comments and
records.
<Insert Figure 10>

74
As demonstrated in Figure 10, the intervention had a large and immediate effect.
A similar pattern was observed in all twelve factories. The rate of safe behavior increased
to 90% immediately after the beginning of the intervention. More interesting is the
observation that the effect of the intervention did not diminish with time. The rate of safe
behavior increased or stayed high during the two years since the beginning of the
intervention. Given the success of the intervention, and its relatively low cost, the
factories have decided to maintain the experimental policy after the experiment.
5.3 Cheating in exams
One of the likely contributors to the long term success of the gentle COP
procedure, described above, is the observation that multiple equilibria are common in rule
enforcement problems, including tax compliance (Alm & McKee, 2004) and corruption
(Tirole, 1996; Waller, Verdier & Gardner, 2002). In one equilibrium, obeying the rules is
the norm, and the enforcers can easily detect and punish deviations if they occur. Thus,
no one is motivated to start violating the rule. In a second equilibrium, violation is the
norm, and the enforcers are unable to cope with the frequent violations. The possibility
of two extreme equilibria and the hypothesis that small decisions are made based on
experience in similar situations implies that the effectiveness of different rule
enforcement policies is likely to be particularly sensitive to the initial actions. Wise
allocation of initial resources can lead to a convergence to the “good” equilibrium in
which observing the rule is the norm.
Erev, Ingram, Raz and Shany (2010) applied this reasoning to cheating on college
exams. Their analysis suggests that gentle COP policies can be used to move behavior to
the "good" equilibrium. To evaluate this hypothesis they run an experiment during final
semester exams of undergraduate courses at the Technion. Traditionally, instructions for
exam proctors at the Technion included the following points:
(1) The student’s ID should be collected at the beginning of the exam,
(2) A map of students’ seating should be prepared.

75
Since the collection of the ID is the first step in the construction of the map, the
common interpretation of these instructions was that the map should be prepared at the
beginning of the exam. Early preparation of the map reflects an attempt to follow
Becker’s idea (preparing evidence to facilitate large punishments), but distracts the
proctors, and reduces the probability of punishments (e.g., warning and/or writing the
name of students who appear to cheat) at the beginning of the exam.
The experiment compared two conditions. The experimental condition featured a
minimal modification of the instructions to proctors that increases the proctor ability to
follow a gentle COP policy (i.e., promptly warn students whose gaze was wandering).
The manipulation was a change of the second instruction to the proctors to:
(2e) “A map of the students seating should be prepared 50 minutes after the beginning of
the exam.”
Seven undergraduate courses were selected to participate in the study. In all
courses the final exam was conducted in two rooms. One room was randomly assigned
to the experimental condition, and the second was assigned to the control condition. The
only difference between the two conditions involved the timing of the preparation of the
map in the instructions to the proctors. In the control group the instructions stated:
(2c) “A map of the students’ seating should be prepared immediately after the beginning
of the exam.”
After finishing the exam, students were asked to complete a brief questionnaire in
which they are asked to “rate the extent to which students cheated in this exam relative to
other exams.” The results reveal large and consistent difference between the two
conditions. The perceived cheating level was lower in the experimental condition in all
seven comparisons.
5.4 Broken windows theory, quality of life, and safety climate

76
In an influential paper, Kelling and Wilson (1982) suggest that physical decay and
disorder in a neighborhood can increase crime rate. This suggestion, known as Broken
Windows theory, was motivated by a field experiment conducted by Zimbardo (1969).
The experiment focused on two cars that were abandoned in the Bronx, NY and in Palo
Alto, CA. The results showed that vandalism of the cars started only after the
experimenter created disorder (by removal of the license plate or breaking a window).
Broken windows theory was a motivation for the “quality of life” policing
strategy implemented in New York City in the mid 1990’s (Kelling & Sousa, 2001). This
policing strategy advocated increased number of police on the streets and arresting
persons for less serious but visible offenses. Some credit this strategy for the decline in
crime and disorder (Golub et al., 2002; Kelling & Sousa, 2001; Silverman, 1999).
However, there are other explanations for the decline (see Eck & Maguire, 2000). Field
studies that test the broken windows hypothesis provide mixed results. Skogan (1990)
found that robbery victimization was higher in neighborhoods characterized by disorder,
but Harcourt (2001) found that the crime-disorder relationship did not hold for other
crime types including burglary, assault, rape and pick-pocketing.
We believe that the studies reviewed above can help clarify this mixed pattern.
Under the current analysis, quality-of-life policing can be effective for the same reason
that gentle COP policies are effective. When the probability of detection is very high,
and the risk of problematic avoidance behaviors is low, people learn to obey the rule.
Thus, quality-of-life policing is effective in reducing robberies because these violations
are more likely to be detected by the additional neighborhood police.
Luria, Zohar and Erev (2008) examined this “probability of detection”
explanation in the context of safety-climate intervention (Zohar, 1980). Safety-climate
interventions are very similar to quality-of-life policing. These interventions are
designed to create a safer work climate. This goal is achieved by encouraging
supervisors to exhibit commitment to safety (e.g., by measuring the number of times they
discuss safety issues with their subordinates). Zohar (1980) and Zohar and Luria (2005)
show that this manipulation increases safety. To test the probability of the detection
hypothesis, Luria et al. reanalyzed the data reported in Zohar and Luria (2005). Their
results show that the safety climate decreases unsafe behavior in environments with high
77
visibility (the supervisor can detect rule violation with high probability), but not when
visibility is low.
Notice that this explanation for the effect of quality-of-life has nontrivial positive
and negative implications. On the positive side, this explanation implies that it may not
be necessary to arrest all violators of minor crimes. If the probability of detection is high
enough, more gentle punishment may be enough. For example, if the probability of
detecting an attempt to use public transportation without paying is close to 1, then a fine
that is only slightly larger than the regular cost should be sufficient. On the negative side,
the current analysis suggests that quality-of-life policing is not likely to succeed when the
probability of detection is low.
5.5. Hand Washing
Hand washing is a nice example of the difference between decisions from
experience and decisions from description. The consequence to failure to wash one’s
hands is potentially devastating—including serious illness or even death. The cost to
washing one’s hands is a few seconds of inconvenience. Everything we know about
decisions from description—including risk aversion, loss aversion and overweighting of
small probabilities—suggests that people would be eager to wash their hands. Yet,
repeated experience following not washing one’s hands is likely to result in no noticeable
negative outcome and therefore in extinction of this desirable behavior.
In 1847, Dr. Ignaz Semmelweis first demonstrated that routine hand-washing
could prevent the spread of disease. In an experiment, Dr. Semmelweis insisted that his
students staffing a Vienna hospital’s maternity ward wash their hands before treating the
maternity patients--and deaths on the maternity ward fell dramatically. In one case, it fell
from 15% to near 0%!!. Though his findings were published, there was no apparent
increase in hand washing by doctors until the discoveries of Louis Pasteur years after Dr.
Semmelweis died in a mental asylum13 (Nuland, 2003).
Moreover, many believe that even today medical professionals do not do enough
on this front. In a recent study, Erev et al. (2010) used a variant of the gentle COP 13
According to some accounts, the fate of Dr. Semmelweis was a function of bid decisions. It seems that the influential heads of the departments who were responsible for the high and avoidable death rates were unhappy with his results.

78
policy, described above, to increase the use of gloves by doctors and nurses. They
focused on the use of gloves while taking blood and giving infusions in 12 distinct
departments. The gentle intervention consistent of a single meeting with the department
stuff. During this meeting the researchers suggested that the participants help each other
remember to use gloves. That is, when they see a friend approach a patient without new
gloves, they should ask him to fix the problem. The results show that this minimal
manipulation increased glove use from 50% to 95%.
5.6 The effect of the timing of warning signals
Evaluation of the impact of warnings reveals a large effect of prior experience
(see Barron, Leider & Stack, 2008). Individuals who have had good experiences in the
past are less affected by the warning. For example, when the FDA added a black-box
warning to the drug Cisapride, the data show an increase in usage of 2% among repeat
users, but a decrease of 17% amongst first-time users (Smalley, et. al., 2000). Another
example is provided by a study of parent-adolescent sexual communication. Regular
condom use was found to be lower when parent-adolescent sexual communication
occurred at a later age (Hutchinson, 2002). Barron, Leider and Stack (2008) show that
part of the effect of experience remains even after controlling for the available
information. Indeed, experience reduces the tendency to respond to informative warnings
even if the experience does not provide additional information. It seems that part of the
effect of experience on the tendency to underweight warnings is a result of inertia.
5.7 Safety devices and the buying-using gap
The difference between decisions from experience and decisions from description
suggests that in certain cases people may buy safety devices, but “learn” not to take the
necessary measures to benefit from them. One example of this buying-using gap is a
study by Yechiam et al. (2006) that focuses on car radios with a detachable panel. The
detachable radio panel is an example of a safety device (against theft) that can be
effective only when it is used (detached).
Notice that the main role of a detachable panel to a car radio is its value as a
safety device. The decision not to detach the panel is made without explicit presentation

79
and is likely to be shaped by repeated experience. Thus, the properties of decisions from
experience imply decrease in the tendency to use the panel with experience, since the
small probability of theft is underweighted. Yechiam et al. found (using a short survey)
that the large majority (96%) of Israelis who bought car radios between 1995 and 2003
preferred the type with a removable panel even though it was remembered as being more
expensive. Most participants detached the panel in the first two weeks, and were much
less likely to detach it after a year. That is, responders behaved as if they gave more
weight to the probability of theft in their initial use-decisions than in their use-decisions
after a year of experience.
5.8 The effect of rare terrorist attacks
Previous studies reveal that even rare terrorist attacks can have large negative
effects on international tourism. For example, following terrorist activity in Northern
Ireland in the early 1970's, visitor arrivals fell from close to a million in 1967 to about
300,000 in 1976.
Yechiam, Barron & Erev (2005) note that the research reviewed above implies
that other effects of terrorism may not be as large. Specifically, it implies a large
difference between international and local tourism. Traveling to a different country
requires a big decision from description. Local tourism, on the other hand, can be a
product of small decisions from experience (e.g., whether to take a sandwich to work or
dine in a restaurant) and can be affected by experience. Thus, with experience, the effect
of rare terrorist attacks on local residents is likely to decrease.
Figure 11 presents the number of nights slept in Israeli hotels by local and
international tourists before and after the beginning of the last wave of terrorist attacks in
Israel (from September 2000). The results show a drop for both populations with the
beginning of the recent attacks, but a quick recovery by local tourists. This trend is
consistent with the suggestion that experience reduces the impact of rare attacks.
<Insert Figure 11>

80
Yechiam et al. note that their analysis suggests that the negative effects of rare
terrorist attacks can be reduced by ensuring that citizens continue to partake in relatively
safe leisure activities. Interestingly this suggestion summarizes one component of Mayor
Rudolph Giuliani's response to the September 11 attack in New York City. Giuliani
suggested that citizens should invest less in direct contributions (like helping digging and
collecting blankets), and spend more time shopping and dining in New York. While this
suggestion seemed counter-intuitive at the time, the current analysis suggests that it was
effective in reducing the negative long-term economic effect of the attack.
5.9 Emphasis change training, flight school and basketball
Mane and Donchin (1989) have organized an interesting competition between
leading researchers of motor skills learning. The participants in the competition were
asked to develop a training method to improve performance in a complex “Space
Fortress” video game. The human players in this game control a space ship and try to
destroy a space fortress that tries to destroy their ship (using missiles and mines). High
performance in this game requires sensitivity to several sources of information (e.g., the
location of mines, the movement of missiles, the location of the ship, the angle of the
ship’s gun).
One of the most successful submissions to this competition, proposed by Gopher,
Weil, & Siegel (1989), was based on the idea of “emphasis change training.” During
training, under this method, the trainees are continuously asked to change their focus.
For example, they start by trying to maximize their scores on hitting the fortress, and then
they are asked to focus on avoiding mines. The basic idea behind this method is simple:
Under the assumption that people choose among multiple attention control strategies they
are likely to converge to a local maximum (see Section 1.3.2). Emphasis change reduces
the risk of this problem (see Erev & Gopher, 1998) by giving the trainee experience with
attention control strategies she might not otherwise sample.
The emphasis change method was a clear winner in transfer tests (see Fabiani et al.,
1989). One demonstration of the value of this method is provided by Gopher, Weil and
Bareket (1994). In the experimental group of their study, cadets in flight school were
asked to play the space fortress game and practiced using the emphasis change training

81
method. The results reveal that this experience had large positive effect on their
subsequent performance in flight school. The probability of successful completion of the
course increased by 33%.
Another demonstration of the value of emphasis change training is provided by the
success of a commercial variant of the space fortress game (see www.intelligym.com),
designed to facilitate attention control by basketball players. The commercial product
was used by only two NCAA men’s basketball teams in 2005: the University of Memphis
and the University of Florida. Florida won the NCAA title in both the 2005/06 and
2006/07 seasons. Twelve NCAA teams used the emphasis change trainer in the 2007/08
season: one of them (University of Kansas) won the title and another user (University of
Memphis) was the runner-up.
5.10 The pat-on-the-back paradox
Informal rewards, often referred to collectively as “pats-on-the-back,” are low cost
or no cost, often verbal, rewards that have virtually no monetary market value.
Psychological research has shown that “pats on the back,” can be as motivating as
monetary awards. For example, Stajkovic and Luthans (1997) present a meta-analysis of
19 studies showing that feedback and social reinforcers may have as strong an impact on
performance as pay. Survey-based data suggest similar conclusions. In a survey of
American workers, 63% indicated a pat-on-the-back to be an effective incentive (Lovio-
George, 1992). In other survey-based studies (Graham & Unruh, 1990), pat-on-the-back
incentives are shown to be more effective than monetary rewards. Such findings are
often attributed to the recognition bestowed by the pat on the back and have prompted
statements such as: "There are two things people want more than sex and money ...
recognition and praise" (Nelson, 1994, quoting Mary Kay Ash, founder of Mary Kay
Cosmetics).
These results appear to be inconsistent with the observation that most job postings
focus on the salary, opportunities, and the possibility of promotion and professional
development, and not on the likelihood of pats on the back. We believe that this “pat-on-
the-back paradox” can be resolved as a reflection of the differential weighting on rare
events in decisions from experience and from description. This explanation is based on

82
the assumption that the probability of attractive events (like promotions and bonuses) in
the typical workplace is low. Thus, these events are overweighted when considering a
description of the job, but are underweighted in decisions from experience.
Underweighting of these rewards is expected to reduce effort in the workplace. To
address this problem, wise managers use pats-on-the-back as “lottery tickets” that signal
a probabilistic future value (like a possible promotion), which makes the reinforced
behavior attractive.
5.11 Gambling and the medium prize paradox
According to the leading explanations of gambling, people gamble because they
overweight rare events (Kahneman & Tversky, 1979) or because they are risk seekers
around the status quo (Savage & Friedman, 1948). These explanations can explain the
popularity of gambling games that promise positively skewed payoff distributions that
provide very high payoffs with very low probability. However, they appear to be
inconsistent with the observation that a large proportion of the payoffs in many gambling
games involve medium prizes. Medium prizes are particularly common in casino
settings.
Haruvy Erev and Sonsino (2001, following Skinner, 1953) suggest that the co-
existence of high and medium prizes can be a response to two behavioral biases:
Overweighting of rare events in decisions from description, and the payoff variability
effect in decisions from experience. High prizes are necessary to attract new gamblers
(who respond to a description of the game), and medium prizes are necessary to increase
the payoff variability that slows learning (that this sort of gamble is costly).
5.12 The evolution of social groups
Recent research demonstrates that two of the most basic observations from studies
of the development of social groups can be a product of the hot stove effect. Denrell
(2005) focuses on the observation that proximity is an important determinant of liking
(Brewer & Campbell, 1976; Festinger, Schachter, & Back, 1950; Segal, 1974). Even if
students are randomly assigned to rooms, individuals are more likely to become friends
with and have a favorable impression of individuals who are nearby (Segal, 1974).

83
Denrell’s explanation is simple and elegant: our opinions about our friends are likely to
change after each meeting. When these opinions determine the probability of future
meeting, we will stop meeting a friend when we no longer like him (and keep our low
opinion). This problem is less severe when the proximity is high. For example,
roommates meet independently of changes in their contemporary opinions. Thus,
proximity eliminates the problematic hot stove effect in this setting.
Denrell and Le Mens (2007) extend this analysis and show that the hot stove
effect can explain the observation that friends holds similar beliefs. This observation is
based on the assumption that low evaluation of an activity (like eating at a particular
restaurant, or attending service at a particular church) decreases the probability of a
repetition of this activity. Friendship slows this process because high evaluation by a
friend can lead us to repeat activities even when our personal evaluation is low.
Another example of a possible effect of decisions from experience to the
development of social groups involves the survival of sects and religious groups that
demand significant sacrifice. As noted by Berman (2001) successful groups appear to
create an incentive structure in which the cost of exiting the group increases over time.
Thus, melioration and related properties of decisions from experience can be among the
contributors to the success of these groups.
5.13 Product updating
Consumers have long been known to exhibit inertia in moving from one technology
standard to another, even when the newer standard is demonstrably superior (Clements,
2005; Gourville, 2003). Microsoft, for example, the largest and most successful computer
software company, is often criticized on the grounds that its products are inferior to
competitors’ products. Nevertheless, Microsoft products are often dominant in the
market. While the reasons behind Microsoft’s dominance are complicated and numerous
(including the importance of establishing a network of users, complementarities, and
unfair anti-competitive practices by Microsoft), research on consumption of other
experience goods (products that require consumption before knowing their quality) has
shown that consumers who behave as hill climbers will be unable to move easily from the
old to the new product and will often converge to a local maximum.

84
Consumer learning in experience goods markets has been an important subject of
theoretical research in industrial organization and marketing since the 1970’s. Learning
can be an especially important factor in the demand for new products, and there is an
empirical literature that quantifies learning in household panel data for grocery purchases
(for example, Erdem & Keane, 1996), choice between personal computers (Erdem,
Keane & Oncu, 2005), and choice between drugs (Crawford & Shum, 2005). In these
papers, it is assumed that the only type of dynamics in demand comes from learning, and
the learning explanation is shown to explain the inertia that might explain the reluctance
of Microsoft consumers to switch to superior products. Gourville (2003) likewise
attempts to understand why many consumers do not immediately switch from a product
they currently use to the latest innovative improved product, even if the cost difference is
minimal. He finds support for the basic learning assumptions we described in this work:
Consumers are sensitive to relative payoffs of the two products and their reference points
about each product’s quality critically depend on past experience. Local hill-climbing can
therefore take consumers to a suboptimal product choice.
5.14 Unemployment
The decision to accept a particular job offer is often not a small decision. The
stakes are usually high, and the decision maker is likely to invest time and effort in this
choice. Nevertheless, many small decisions are likely to affect the employment status of
the decision maker. Examples include the decisions to invest effort in particular tasks in
school, at work, and while looking for a job. These small decisions are likely to affect
the likelihood of receiving attractive job opportunities.
Lemieux and MacLeod (2000) present an elegant analysis that demonstrates how
the basic properties of learning, reviewed above, can shed light on an apparently weak
relationship between unemployment rates and public policies. They focus on the
unemployment rate in Canada in the period of 1972-1992. The Canadian unemployment
insurance system greatly increased benefits to the unemployed in 1971. The generosity of
the unemployment insurance did not increase again, but unemployment steadily increased
from 1972 to 1992. Lemieux and MacLeod note that this pattern can be captured with

85
the assertion that the description of the incentive system has limited effect. The main
effect is a result of personal experience with the new incentives.
5.15 The second-order Braess paradox
The Braess paradox (Braess, 1968) is a simple illustration of how it is possible to
add capacity to a traffic network and make everyone's journey time (at equilibrium)
worse than it was previously. That is, by adding a road to an existing traffic system of
roads, all drivers’ travel time increases.
The example below comes from Rapoport, Kugler, Dugar and Gisches (2008).
The numbers next to each line denote the driving time it takes to travel the line. X
denotes the number of drivers. Thus, the driving time increase with the number of users
in two of the roads (A-C and B-D), but not in the other two. The addition of a road C-D
that connects point C with point D increases the driving time from A to B in equilibrium.
Suppose there are two players. It is easy to verify that there are two pure-strategy
equilibria in the network without road C-D, has one player choosing the route A-C-B and
the other choosing A-D-B. The cost of travel in this case is 10+25=35. No player benefits
from unilateral deviation.
Consider next the augmented network with the additional road CD. It is again
easy to verify that the augmented network has unique pure-strategy equilibrium where the
two players choose the route (A-C-D-B) for total travel cost of 20+0+20=40. The
counterintuitive feature of this example is that the improvement of the network in the
basic network by adding a cost-free link C-D causes every network user to be worse off
by 14.3 percent (5/35) of the original travel cost.

Gisch
curre
playe
differ
short
betwe
that p
or wi
accom
5.16 I
incon
main
regar
& Ra
peopl
assum
(see B
incen
produ
exper
the ou
An experi
hes, 2008) sh
nt analysis s
ers (drivers)
rent commut
-term positiv
een the short
policy maker
ill not be mo
mplishments
Interperson
Review o
nsistency bet
stream resea
rding prefere
abin, 2002, a
le pay more
mption. On t
Bazerman &
ntives of othe
Erev and
uct of the dif
rience discus
utcomes of o
imental stud
hows slow c
suggests an e
have more o
ting times).
ve effect eve
t and the lon
rs will not re
otivated to no
s), that the ad
nal conflicts
f previous re
tween the ma
arch in behav
ences (see Fe
and see revie
attention to
the other han
& Neal, 1992
ers and assum
Greiner (in p
fference betw
ssed above.
others when
dy of the Bra
onvergence
even slower
options (e.g.,
This pattern
en when thei
ng term impl
espond to the
otice (becaus
ddition of ce
s and the de
esearch of in
ain conclusi
vioral game
ehr & Schmi
ew in Cooper
the incentiv
nd, negotiati
) that imply
me that effic
press) sugge
ween decisio
It is possibl
these outcom
86
aess paradox
to this probl
adaptation p
, more roads
n implies tha
ir overall eff
lies a second
e original pa
se they are e
ertain roads i
scription-ex
nterpersonal
ons of two l
theory highl
idt, 1999; Bo
r & Kagel, 2
ves of others
ion research
the opposite
cient coopera
est that this a
ons from des
le that social
mes are desc
(see Rapopo
lematic equi
process in na
s, other mean
at, in many c
fect is negati
d-order Brae
aradox. That
evaluated on
is counter-pr
xperience ga
conflicts rev
ines of resea
lights the im
olton & A O
2008). This
than predict
reflects "my
e bias: A ten
ation or coor
apparent inco
scription and
l behavior re
cribed (the c
ort, Kugler,
ilibrium pred
atural setting
ns of transpo
cases, new ro
ive. The dis
ss paradox:
t is, they wil
n short term
roductive.
ap
veals an app
arch. On on
mportance of
Ockenfels, 20
research sug
ted under the
ythical fixed
ndency to ign
rdination is
onsistency c
d decisions f
eflects overse
convention in
Dugar &
diction. The
gs when the
ortation, and
oads have a
crepancy
It is possible
ll not notice,
parent
e hand,
f other
000; Charnes
ggests that
e rationality
d pie beliefs"
nore the
impossible.
can be a
from
ensitivity to
n mainstream
e
d
e
,
ss
"
m

87
behavioral economic research), but reflects the basic properties of decisions from
experience when the outcomes are not clearly described (the state in most negotiation
settings). The basic properties of decisions from experience, in turns, imply a tendency
to exhibit insufficient sensitivity the payoff of other agents.
Erev and Greiner clarify this assertion with the study of the 5x5 a-symmetric Stag
Hunt game presented in Table 9. Notice the game has two equilibrium points: The “E, E”
equilibrium is efficient (payoff dominant) and fair: Both players win 12 (joint payoff of
24) under this equilibrium. The “A, A” equilibrium is inefficient (joint payoff of 15), and
unfair (one player wins 10, and the other wins 5), but it is the risk-dominant equilibrium.
The game was played repeatedly (for 50 trials), with fixed matching, under two
information conditions. The participants receive complete description of the matrix in
Condition Description, but not in condition Experience. The results reveal large
difference between the two conditions. The modal outcome was efficient and fair (E,E --
as predicted by other regarding preferences) in Condition Description, and inefficient and
unfair (A,A -- as predicted by the basic properties of decisions from experience) in
Condition Experience.
The current analysis leads to optimistic predictions: It implies that manipulations
that increase exploration (like the emphasis change procedure) can increase social
efficiency. This prediction is consistent with the main idea of popular negotiation books.
5.17 Implications for financial decisions.
Typical financial decisions often involve high stakes. Nevertheless, several lines
of recent research demonstrate interesting similarity between financial decisions and the
experimental literature reviewed here.
The best known example is provided by Taleb’s (2007) prediction of the 2008
financial crisis. Taleb used the tendency to underweight rare events in decisions from
experience, reviewed above, to justify his "black swan" assertion, according to which
investors tend to dismiss low probability events. For that reason, low probability events,
when they occur, can lead to financial crises.
Another example involves the assertion that many investors have under-
diversified investment portfolios (e.g., Blume and Friend, 1975; Kelly, 1995). Ben Zion

88
et al. (2010) show that this tendency can be observed in the clicking paradigm, and can be
a product of the tendency to rely on past experiences.
A third example concerns with the observed sequential dependencies in stock
markets. Empirical analyses reveal high correlation between absolute price change in a
particular trading day and volume of trade in the following day (see Karpoff, 1988).
Nevo and Erev (2012) show that this pattern can be a product of the surprise-trigger-
change of decisions from experience.
5.18. Summary and the innovations--discoveries gap.
The first author of the current chapter was recently invited to give a talk in a
lecture series with the title "Inventions and discoveries that have shaped the human
civilization." While preparing the talk he noticed of a surprising large gap between his
favorite examples of inventions and of discoveries in economics. Whereas the most
influential inventions (e.g., markets, money, banks, rules, credit cards, auctions, e-
trading) are based on the assumptions that people try to maximize expected return, the
best-known discoveries focus on deviations from rational behaviors.
We believe that the results reviewed above highlight one contributor to this gap.
The basic properties of decision from experience imply interesting deviations from
maximization, but also imply a wide set of situations in which people behave as if they
are trying to maximize expected return: When the strategy that maximizes expected
return also lead to the best outcome most of the time, people exhibit high sensitivity to
the incentive structure. (This prediction is clarified by I-SAW: When the best alternative
is also best most of the time, the "grand mean" and the "sample mean" tend to point in the
same direction). It seems that many of the successful economics innovations are
mechanisms that increase the probability that the socially desired behavior will be
reinforced on average, and most of the time.
Most of the applications considered above follow a similar logic. They start with
the discovery of a problematic deviation from maximization that can be the product of the
tendency to rely on small samples, and then show that the problem can be addressed by a
change of the incentive structure that increase the probability that the desired behavior
will be reinforced on average, and most of the time.

89
6. Conclusion
The research reviewed here can be summarized by six main sets of observations.
The first set includes demonstrations the generality of basic properties of decisions from
experience. The behavioral regularities have been observed in animals studies,
laboratory studies that focus on the behavior of student subjects engaging in simple tasks,
and in the analysis of relatively complex social interactions. An additional indication of
the robustness of the main results is provided by the observation that they can be
summarized with a simple model (best reply to a small sample of experiences in similar
situations) that allows for useful (high ENO) ex ante quantitative prediction of behavior
in new situations.
A second set of observations involves two shortcomings of an approach based on
the strictest interpretation of rationality—including equilibrium analysis. First, there are
many situations in which this approach is “not even wrong.” For example, this approach
does not provide a clear prediction of behavior in the clicking paradigm. Almost any
behavior can be justified as “rational” given certain prior beliefs. Second, when the
rationality assumption can be wrong, it is often wrong at the intermediate term. For
example, learning away for a mixed strategy mixed-strategy equilibria persists for at least
500 trials (see Section 4.2), and learning away from a simulated index fund that is known
to maximize expected payoff and minimize variance experience persists for at least 100
trials (see Section 1.3.1). It is important to recall, however, that the current results do not
reject epsilon equilibrium models (e.g., Radner, 1980; McKelvey and Palfrey, 1995).
Indeed, the descriptive models presented above are members of the class of epsilon
equilibrium models: When the incentive structure is strong enough (in the way implied
by these models), they imply an approximation of the optimal behavior.
A third set involves the conditions under which experience leads decision makers
toward maximization of expected return (and risk neutral equilibrium). High
maximization rate was documented when the strategy that maximizes expected return
also lead to the best outcome most of the time. Similarly, convergence to mixed strategy
equilibrium was observed when the choice proportions at equilibrium are consistent with
the proportions of times in which each alternative leads to the best outcomes.

90
A fourth set of observations concern the difference between decisions from
experience and decisions from description. The results described here suggest that
decision makers underweight rare events in decisions from experience, but overweight
rare events in decisions from description (see Section 1.1.3). Another example of this
difference is the apparent inconsistency between research documenting other regarding
behavior, and the finding that some social conflicts reveal the opposite bias (See Section
5.16).
The fifth set pertains to the distinction between basic learning properties and other
cognitive factors that affect the impact of experience. The current review suggests that
the effects of other cognitive factors are important, but are less general than the basic
properties of learning. For example, the indications for learning to follow a reciprocation
strategy in a repeated prisoner dilemma game are highly sensitive to the framing of the
task.
Finally, the current review suggests that the study of decisions from experience
may shed light on many interesting economic phenomena. Highly consequential
economic phenomena may be the result of small and relatively inconsequential decisions
by many individuals. The applications presented in Section 5 suggest that experimental
research on small decisions can be used to understand larger phenomena and facilitate
efficient design of relevant incentive structures.

91
References Abbink, K., G E Bolton, A. Sadrieh, and F.F. Tang (2001), Adaptive Learning versus
Punishment in Ultimatum Bargaining, Games and Economic Behavior, 37, 1-25. Allais, M., (1953), Le comportement de l’homme rationnel devant le risque: critique des
postulats et axiomes de l’école Américaine, Econometrica, 21, 503-546. Alm, James and Michael McKee (2004), Tax compliance as a coordination game, Journal
of Economic Behavior & Organization, 54 (3), 297-312. Alos-Ferrer, Carlos and Karl Schlag (2009). Imitation and Learning. In The Handbook of
Rational and Social Choice, ed. by P. Anand, P. Pattanaik and C. Puppe, Oxford University Press.
Amaldoss, Wilfred and Sanjay Jain (2005). Conspicuous Consumption and Sophisticated Thinking. Management Science, 51 (10), 1449-1466.
Anderson, Christopher M. and Colin F. Camerer, 2000. Experience-weighted attraction learning in sender-receiver signaling games. Economic Theory, 16(3), 689-718.
Anderson, C. M. (2001). Behavioral Models of Strategies in Multi-Armed Bandit Problems, Ph.D. Dissertation, California Institute of Technology.
Anderson, Lisa R. and Charles A. Holt (1997). Information Cascades in the Laboratory. American Economic Review, 87(5), 847-862.
Anderson, J. R. and Lebiere, C. (1998). The atomic components of thought. Mahwah, NJ: Erlbaum.
Anderson, Simon P., Jacob K. Goeree, and Charles A. Holt (2001). Minimum-Effort Coordination Games: Stochastic Potential and the Logit Equilibrium. Games and Economic Behavior, 34(2), 177-199.
Andreoni, James, and J. H. Miller (1993). Rational cooperation in the finitely repeated prisoner's dilemma: Experimental evidence. Economic Journal, 103570-85.
Apesteguia, Jose (2006). Does Information Matter in the Commons? Experimental Evidence. Journal of Economic Behavior and Organization, 60:55-69.
Arifovic, Jasmina and John Ledyard (2004). Scaling Up Learning Models in Public Good Games. Journal of Public Economic Theory, 6 (2), 203–238.
Arifovic, J., McKelvey, R.D., Pevnitskaya, S., 2006. An initial implementation of the turing tournament to learning in two person games. Games and Economic Behavior, 57 (2006) 93–122.
Armantier, Olivier (2004). Does Observation Influence Learning. Games and Economic Behavior, 46, 221-239.
Ball, S., Bazerman, M. and Carroll, J. (1991). An evaluation of learning in the bilateral winner's curse. Organizational Behavior and Human Decision Processes, 48(1), 1-22.
Bandura, A. (1965). Influence of models’ reinforcement contingencies on the acquisition of imitative response, Journal of Personality and Social Psychology, 1, 589-595.
Barkan, R., Zohar, D. & Erev, I. (1998). Accidents and decision making under uncertainty: A comparison of four models. Organizational Behavior and Human Decision Processes, 74, 118-144.
Baron, R. and Kalsher, M. (2006). Psychology. Boston, MA:Allyn and Bacon. Barron, G., and I. Erev (2003), Small Feedback-Based Decisions and Their Limited
Correspondence to Description-Based Decisions. Journal of Behavioral Decision Making, 16(3), 215-233.

92
Barron, G. and E. Yechiam (2009) The coexistence of overestimation and underweighting of rare events and the contingent recency effect, Judgment and Decision Making, 4, 447–460.
Barron, G., Leider, S & Stack, J. (2008). The effect of experience on a warnings' impact: Sex, Drugs and Rock-n-Roll. Organizational Behavior and Human Decision Processes 106, 125-142.
Battalio, R., Samuelson, L., and Van Huyck, J. (2001). "Optimization Incentives and Coordination Failure in Laboratory Stag Hunt Games." Econometrica, 69, 749-764.
Bazerman, M.H., & Neale, M.A. The Mythical Fixed-Pie. Executive Excellence, 1992, 9, 14-15.
Blume, M. E., I. Friend. 1975. The asset structure of individual portfolios and some implications for utility functions. Journal of Finance 30 585-603.
Bechara, A., Damasio, A.R., Damasio, H. and Anderson, S.W. (1994). Insensitivity to future consequences following damage to human prefrontal cortex. Cognition, 50(1-3):7-15.
Becker, G. (1968). Crime and Punishment: An Economic Approach. The Journal of Political Economy, 76: 169-217.
Benartzi, S., and Thaler, R. (1995). Myopic Loss-Aversion and the Equity Premium Puzzle. Quarterly Journal of Economics, 110.1, 73-92.
Ben Zion, U., I. Erev, E. Haruvy and T. Shavit (2010), Adaptive Behavior Leads to Under-diversification, Journal of Economic Psychology 31, 985-995.
Bereby-Meyer, Y. and Grosskopf, B. (2008). Overcoming the Winner's Curse: An Adaptive Learning Perspective. Journal of Behavioral Decision Making, 21(1), 15-27.
Bereby-Meyer, Y., and Roth, A. (2006). The Speed of Learning in Noisy Games: Partial Reinforcement and the Sustainability of Cooperation. American Economic Review, 96(4): 1029–1042.
Berman, E. (2001). Sect, Subsidy and Sacrifice: An Economist’s View of Ultra-Orthodox Jews. (In Hebrew). The Economic Quarterly.
Biele, G., Erev, I., & Ert, E. (2009). Learning, risk attitude and hot stoves in restless bandit problems. Journal of Mathematical Psychology. Journal of Mathematical Psychology. 53, 3,155-167.
Blavatskyy, P. (2006). Axiomatization of a preference for most probable winner. Theory and Design, 60, 17-33.
Bolton, G. and Ockenfels, A. (2000). ERC: A theory of equity, reciprocity and competition. American Economic Review, 90, 166-193.
Bornstein, G., Budescu, D.V., & Zamir, S. (1997). Cooperation in Intergroup, N-Person, and Two-Person, Games of Chicken." Journal of Conflict Resolutions. 41:384-406.
Braess, D. (1968). Über ein Paradoxon aus der Verkehrsplanung Unternehmensforschung 12 258–268.
Brenner, T. and Vriend, N. (2006). On the behavior of proposers in the ultimatum game, Journal of Economic Behavior and Organization, 61, 617-631.
Brewer, M.B., Campbell, D.T. (1976). Ethnocentrism and Intergroup Attitudes: East African Evidence. New York, NY: Sage.

93
Brown, G.W. (1951). Iterative Solution of Games by Fictitious Play. In Activity Analysis of Production and Allocation. Jallings, T. and Koopmans, C. (eds). New York: Wiley.
Brown, J. N. and Rosenthal, R. (1990). Testing the Minimax Hypothesis: A Re-Examination of O'Neill's Game Experiment, Econometrica, 58(5), 1065-1081.
Busemeyer, J. R., & Myung, I. J. (1988). A new method for investigating prototype learning. Journal of Experimental Psychology: Learning, Memory, Cognition, 14, 3-11.
Busemeyer, J. R., & Myung, I. J. (1992). An adaptive approach to human decision making: Learning theory, decision theory, and human performance. Journal of Experimental Psychology: General, 121, 177-194.
Busemeyer, J. R. & Stout, J. C. (2002). A Contribution of Cognitive Decision Models to Clinical Assessment: Decomposing Performance on the Bechara Gambling Task. Psychological Assessment, 14, 253-262.
Busemeyer, J. R. and Townsend, J. T (1993). Decision Field Theory: A Dynamic-Cognitive Approach to Decision Making in an Uncertain Environment. Psychological Review, 100, 432-459.
Bush, R. R. and Mosteller, F. (1955). Stochastic Models for Learning. New York: Wiley. Caplin, A., & Dean, M. (2007). The neuroeconomic theory of learning. American
Economic Review Papers and Proceedings, 97(2), 148−152. Camerer, C. (2003). Behavioral Game Theory: Experiments in Strategic Interaction.
Princeton University Press, Princeton, New Jersey. Camerer, C. and Ho, T-H. (1998) "EWA Learning in Coordination Games: Probability
Rules, Heterogeneity, and Time Variation," Journal of Mathematical Psychology, 42, 305-326.
Camerer, C. & Ho, T.-H. (1999). Experience-Weighted Attraction Learning in Normal Form Games. Econometrica, 67(4), 827-874.
Camerer, C. T-H. Ho, and J-K Chong (2002). Sophisticated Learning and Strategic Teaching. Journal of Economic Theory, 104 (2002), 137-188.
Charness, G., Grosskopf, B., (2002). Cheap Talk, Information and Coordination-Experimental Evidence. Mimeo.
Charness, G. and Rabin, M. (2002). Understanding Social Preferences with Simple Tests. Quarterly Journal of Economics, 117, 817-869.
Chen, Y. & Tang, F.-F. (1998). Learning and Incentive Compatible Mechanisms for Public Goods Provision: An Experimental Study. Journal of Political Economy, 106, 633-662.
Cheung, Y.-W. and Friedman, D. (1997). Individual Learning in Normal Form Games: Some Laboratory Results. Games and Economic Behavior, 19, 46-76.
Cheung, Y-W, and Friedman, D. (1998). Comparison of Learning and Replicator Dynamics Using Experimental Data. Journal of Economic Behavior and Organization, 35, 263-280.
Clements, M.T. (2005). Inefficient Standard Adoption: Inertia and Momentum Revisited. Economic Inquiry, 43(3), 507-518.
Cooper, D. and Kagel, J. (2003). Lessons Learned: Generalizing Across Games. American Economic Review, 93(2), 202-207.

94
Cooper, D. and Kagel, J. (2008). Learning and Transfer in Signaling Games. Economic Theory, 34, 3, 415-440.
Crawford, G. and Shum, M. (2005). Uncertainty and learning in pharmaceutical demand. Econometrica, 37, 1137–1174.
Cuchon, G. and Camerer, C. (1996). Loss avoidance and forward induction in coordination games. Quarterly Journal of Economics, 112, 165-194.
Dal Bó, P. and Fréchette, G. (2007). The Evolution of Cooperation in Infinitely Repeated Games: Experimental Evidence. Working paper.
Daniely, H. (2000). Social dilemmas and the design of simulators, MSc Thesis, Technion, (in Hebrew).
Dember, W. N and Fowler, H. (1958). Spontaneous alternation behavior. Psychological Bulletin, 55, 412-428.
Denrell, J. (2005). Why Most People Disapprove of Me: Experience Sampling in Impression Formation. Psychological Review, 112 (4), 951-978.
Denrell, J. (2007). Adaptive Learning and Risk Taking. Psychological Review, 114 (1), 177-187.
Denrell, J. and Le Mens, G. (2007). Interdependent Sampling and Social Influence. Psychological Review, 114 (2): 398-422.
Denrell, J. and March, J.G. (2001). Adaptation as Information Restriction: The Hot Stove Effect. Organization Science, 12(5), 523-538.
Diederich, A. & Busemeyer, J. R. (1999). Conflict and the stochastic dominance principle of decision making. Psychological Science, 10, 353-359.
Dufwenberg, M., Lindqvist, T. and Moore, E. (2005). Bubbles & Experience: An Experiment. American Economic Review, 95, 1731-37.
Edwards, W. (1961). Probability learning in 1000 trials. Journal of Experimental Psychology, 62, 385–394.
Estes, W. K. (1950). Toward a statistical theory of learning. Psychological Review, 57, 94–107.
Estes, W. K. (1964). Probability learning. In A. W. Melton (Ed.), Categories of human learning (pp. 89-128). New York: Academic Press.
Ehrblatt, W., Hyndman, K., Ozbay, E. and Schotter, A. (2006) Convergence: An Experimental Study of Teaching and Learning in Repeated Games. New York University. Working paper, 2006-11-25.
Einhorn, H. J., Hogarth, R. M., (1978). Confidence in judgment: Persistence of the illusion of validity. Psychological Review, 85: 395-416.
Engelbrecht-Wiggans, R. and Katok, E. (2008). Regret and Feedback Information in First-Price Sealed-Bid Auctions. Management Science, 54(4), 808-819.
Engelbrecht-Wiggans, R. and Katok, E. (2007). Regret in Auctions: Theory and Evidence. Economic Theory, 33, 81-101.
Erdem, T. and Keane, M. (1996). Decision-making under uncertainty: Capturing dynamic brand choice processes in turbulent consumer goods markets. Marketing Science, 15(1), 1–20.
Erdem, T., Keane, M., Oncu, T. and Strebel, J. (2005). Learning about computers: An analysis of information search and technology. Quantitative Marketing and Economics, 3, 207–247.

95
Erev, I. (1998). Signal detection by human observers: A cutoff reinforcement learning model of categorization decisions under uncertainty. Psychological Review, 105, 280-298.
Erev, I. (2007). On the weighting of rare events and the economics of small decisions. In: S. H. Oda (Ed.), Advances in Experimental Economics, Lecture Notes in Economics and Mathematical Systems, Vol. 590. Dordrecht, The Netherlands: Springer.
Erev, I., and Barron, G. (2002). On Adaptation, Maximization, and Reinforcement Learning Among Cognitive Strategies. Working paper version.
Erev, I., and Barron, G. (2005). On Adaptation, Maximization, and Reinforcement Learning Among Cognitive Strategies. Psychological Review, 112 (2005): 912-931.
Erev, I., Bereby-Meyer, Y. and Roth, A. E. (1999). The effect of adding a constant to all payoffs: experimental investigation, and implications for reinforcement learning models. Journal of Economic Behavior and Organization, 39(1), 111-128.
Erev, I., Ert, E., and Yechiam, E. (2008). Loss aversion, diminishing sensitivity, and the effect of experience on repeated decisions. Journal of Behavioral Decision Making, 21 (5), 575-597.
Erev, I. Ert, E. Roth, A. E., Haruvy, E., Herzog, S., Hau, R. Hertwig, R. Stewart, T., West, R. and Lebiere, C. (2010a) "A choice prediction competition, for choices from experience and from description." Journal of Behavioral Decision Making, 23, 15-47.
Erev, I. Ert, E. Roth, A. E., (2010b) " A Choice Prediction Competition for Market Entry Games: An Introduction,” Games, 1(2), 117-136.
Erev, I., Gilat-Yihyie, S., Marchiori, D., & Sonsino, D. (2012). On Loss Aversion, Level-1 Reasoning, and Betting. Technion working paper.
Erev, I. and Greiner, B. (in press). On Psychology, Economics, and the Prediction of Human Behavior. Invited chapter submitted to Guillaume F. and Schotter A. (Eds.) The handbook on Methods of Modern Experimental Economics. Oxford University Press.
Erev, I. and Haruvy, E. (2005). Generality and the Role of Descriptive Learning Models. Journal of Mathematical Psychology, 49(5), 357-371.
Erev, I., Ingram P., Raz, O. and Shany, D. (2010), “Continuous punishment and the potential of gentle rule enforcement”. Behavioural Processes, 84, 366-371.
Erev, I. and Livne-Tarandach, R. (2005). Experiment-based exams and the difference between the behavioral and the natural sciences. In Zwick, R. and Rapoport, A. (Eds.), Experimental Business Research, Vol 3. Dordrecht, The Netherlands: Springer.
Erev, I. and Rapoport, A. (1998). Coordination, ‘‘Magic,’’ and Reinforcement Learning in a Market Entry Game. Games and Economic Behavior, 23, 146-175.
Erev, I. and Rodansky, D. (2004). Gentle Enforcement of Safety Rules. A Final Report of a research supported by the Committee for Accident Prevention in the Israeli Ministry of Industry and Commerce. (In Hebrew).
Erev, I., Rodensky, D., Levi, M., Hershler, M., Adami, H., Donchin, Y. (2010). The value of gentle enforcement on safe medical procedures. Quality and Safety in Health Care 19(5), 1-3.

96
Erev, I. and Roth, A. (1998). Predicting How People Play Games: Reinforcement Learning in Experimental Games with Unique Mixed Strategy Equilibria. American Economic Review, 88, 848-881.
Erev, I. and Roth, A. (2001). Simple Reinforcement Learning Models and Reciprocation in the Prisoner’s Dilemma Game. In: Gigerenzer, G., Selten, R. (Eds.), Bounded Rationality: The Adaptive Toolbox. Cambridge, MA: MIT Press,215-231.
Erev, I. and Roth, A. (2007). Multi-agent learning and the descriptive value of simple models. Artificial Intelligence, 171(7), 423-428.
Erev, I., Roth, A., Slonim, R. and Barron, G. (2002). Predictive Value and the Usefulness of Game Theoretic Models. International Journal of Forecasting, 18(3), 359-368.
Erev, I., Roth, I., Slonim, R. and Barron, G. (2007). Learning and equilibrium as useful approximations: Accuracy of prediction on randomly selected constant sum games. Economic Theory, 33, 29-51.
Ert E., and Erev, I. (2007). Replicated alternatives and the role of confusion, chasing, and regret in decisions from experience. Journal of Behavioral Decision Making, 20 (3), 305-322.
Ert E., and Erev, I. (2010). On the descriptive value of loss aversion in decisions under risk. Available at SSRN: http://ssrn.com/abstract=1012022
Ert, E., and Erev, I. (2012). Contrast and assimilation effects in decisions from description and from experience. Working paper
Estes, W. K. (1950). Toward a statistical theory of learning. Psychological Review, 57, 94-107.
Estes, W. K. (1976). The Cognitive Side of Probability Learning. Psychological Review, 83, 37-64.
Fabiani, M., Buckley, J., Gratton, B., Coles, M.G.H., Donchin, E., and Logie, R. (1989). The training of complex task performance. Acta Psychologia, 71, 259-299.
Fehr, E. and Schmidt, K.M. (1999). A theory of fairness, competition and cooperation. Quarterly Journal of Economics, 114( 3), 817-868.
Feltovich, N. (2000). Reinforcement-Based vs. Beliefs-Based Learning in Experimental Asymmetric-Information Games. Econometrica , 68(3), 605-641.
Feltovich, N., Iwasaki, A., Oda, S. (2007). Payoff levels, loss avoidance, and equilibrium selection in the Stag Hunt: an experimental study. Working paper.
Festinger, L., Schachter, S., and Back, K. W. (1950). Social pressures in informal groups: A study of human factors in housing. Stanford, CA: Stanford University Press.
Fiedler K. (2000). Beware of samples! A cognitive-ecological sampling approach to judgment biases. Psychological Review, 107, 659-676.
Filiz-Ozbay, E. and Ozbay, E. (2007). Auctions with Anticipated Regret: Theory and Experiment. American Economic Review, 97(4), 1407-1418.
Friedman, D. (1989). The S-Shaped Value Function as a Constrained Optimum. The American Economic Review, 79(5), 1243-1248.
Friedman, D., Massaro, D.W. (1998). Understanding variability in binary and continuous choice. Psychonomic Bulletin and Review, 5, 370–389.
Fudenberg, D. and Levine, D.K. (1998). The Theory of Learning in Games. Cambridge, MA: MIT Press.
Fujikawa, T. (2009). On the relative importance of the hot stove effect and the tendency to rely on small samples. Judgment and Decision Making.

97
Fujikawa, T. and Oda, S. H. (2007). Judgment in Small Decision-Making Problems. In: Developments on Experimental Economics, Oda, S. H. (Ed.), Germany: Springer Verlag.
Gaissmaier, W., & Schooler, L. J. (2008). The smart potential behind probability matching. Cognition, 109, 416–422. doi:10.1016/j.cognition.2008.09.007
Gans, N., Knox, G., & Croson, R. (2007). Simple models of discrete choice and their performance in bandit experiments. Manufacturing and Service Operations Management, 9, 383–408.
Garcia, J. and Koelling, T.A. (1966). A relation of cue to consequence in avoidance learning. Psychonomic Science, 4, 123-124.
Garcia, J., Kimeldorf, D.J., and Koelling, R.A. (1955) Conditioned Aversion to Saccharin Resulting from Exposure to Gamma Radiation. Science, New Series, 122(3160), 157-158.
Gavetti, G., D. Levinthal. 2000. Looking forward and look backward: Cognitive and experiential search. Admin. Sci. Quart. 45 113-137.
Gershman, S. J., Blei, D. M. & Niv, Y. (in press) Context, Learning and Extinction, Psychological Review.
Chen, W., Liu, S., Chen, C-H., and Lee, Y-S. (2011). Bounded memory, inertia, sampling and weighting model for market entry games, Games, 2(1), 187-199.
Gittines, J.C. (1979). Bandit processes and dynamic allocation indices. Journal of the Royal Statistical Society, Series B, 41, 148-177.
Gittins, J. C. (1989). Multi-Armed Bandit Allocation Indices. New Jersey: John Wiley and Sons.
Glines, C. V. (2005). Top Secret WWII Bat and Bird Bomber Program. Aviation History, 15(5), 38-44.
Goeree, J.K., Holt,C.A. and Palfrey, T.R. (2002). Quantal Response Equilibrium and Overbidding in Private-Value Auctions. Journal of Economic Theory, 104(1), 247-272.
Gonzalez, C., Dutt, V., Lejarraga, T. (2011). A loser can be a winner: Comparison of two instance-based learning models in a market entry competition, Games , 2(1), 136-162.
Gonzalez, C., Lerch, J.F., and Lebiere, C. (2003). Instance-based learning in dynamic decision making. Cognitive Science, 27, 591-635.
Golub, A., Johnson, B., Taylor, A., and Liberty, H. (2002). The Validity of arrestee’s self reports. Justice Quarterly, 19(3), 477-502.
Gopher, D., Weil, M., and Siegal, D. (1989). Practice under changing priorities: an approach to the training of complex skills. Acta Psychologica, 71, 147-177.
Gopher, D., Weil, M., and Bereket, T. (1994). Transfer of Skill from a Computer Game Trainer to Flight. Human Factors, 33(3), 387-405.
Gourville, J.T. (2003). Why Consumers Don't Buy: The Psychology of New Product Adoption. Harvard Business School Case No. 504-056.
Graham, G. H. and Unruh, J. (1990). The Motivational Impact of Non-financial Employee Appreciation Practices on Medical Technologists. Health Care Supervisor, 8(3), 9-17.

98
Grant, D. A., Hake, H. W., and Hornseth, J. P. (1951). Acquisition and extinction of a verbal con-tioned response with differing percentages of reinforcement. Journal of Experimental Psychology, 42, 1-5.
Green, L., Fisher, Jr., E.B., Perlow, S. and Sherman, L. (1981). Preference Reversal and Self Control: Choice as a Function of Reward Amount and Delay. Behavior Analysis Letters, 2, 103-112.
Grinblatt, M., Titman,S., Wermers, R., (1995). Momentum investment strategies portfolio performance, and herding: a study of mutual fund behavior. American Economic Review, 85, 1088-1105.
Grosskopf, B. (2003). Reinforcement and Directional Learning in the Ultimatum Game with Responder Competition. Experimental Economics, 6(2), 2003, 141-158.
Grosskopf, B., Erev, I., and Yechiam, E. (2006). Foregone with the wind: Indirect payoff information and its implications for choice. International Journal of Game Theory, 34 (2), 285-302.
Guth,W., Marchand, N., and Rulliere, J.-L. (2007). On the Reliability of Reciprocal Fairness—An Experimental Study. Eastern Economic Review, forthcoming.
Guth, W., Schmittberger, K. and Schwarze, B. (1982). An experimental analysis of ultimatum bargaining. Journal of Economic Behavior and Organization, 3(4), 367-388.
Guth, W. and Van Damme, E. (1998). Information, strategic behavior and fairness in ultimatum bargaining—An experimental study. Journal of Mathematical Psychology, 42, 227-247.
Hanaki, N., Sethi, R., Erev, I. and Peterhansl, A. (2005). Learning Strategies. Journal of Economic Behavior and Organization, 56(4), 523-542.
Harcourt, B. G. (2001). Illusion of Order: The false premise of broken windows policing. Cambridge: Harvard University Press.
Harrison, Glenn W. (1989). Theory and Misbehavior of First-Price Auctions. American Economic Review, 79, 749-62.
Hart and Mas-Colell, (2001). A general class of adaptive strategies, J. Econ. Theory 98, 26–54.
Haruvy, E. and Erev, I. (2001). On the Application and Interpretation of Learning Models. Experimental Business Research, 285-300, Rami Zwick, R. and Rapoport, A. (Eds.). Boston: Kluwer Academic Publishers.
Haruvy E., Erev, I. and Sonsino, D. (2001). The Medium Prizes Paradox: Evidence from a Simulated Casino. Journal of Risk and Uncertainty, 22, 251-261.
Haruvy, E., Lahav, Y., and Noussair, C. (2007). Traders’ Expectations in Asset Markets: Experimental Evidence. American Economic Review, 97(5), 1901-1920.
Hau, R., Pleskac, T., and Hertwig, R. (2008). Decisions from Experience without Sampling Error. Journal of Behavioral Decision Making. 21, 493–518.
Healy, A. E, and Kubovy, M. (1981). Probability matching and the formation of conservative decision rules in a numerical analog of signal detection. Journal of Experimental Psychology: Human Learning and Memory, 7, 344-354.
Herrnstein, R. J. (1961). Relative and absolute strength of responses as a function of frequency of reinforcement. Journal of the Experimental Analysis of Behavior, 4, 267-272.

99
Herrnstein, R.J. (1988). A behavioral alternative to utility maximization. In: Maital, S. (Ed.). Applied Behavioral Economics. London: Wheatsheaf Books.
Herrnstein, R. J., Lowenstein, G.F., Prelec, D. and Vaughan, Jr., W. (1993). Utility Maximization and Melioration: Internalities in Individual Choice. Journal of Behavioral Decision Making, 6, 149-185.
Herrnstein, R.J., and Prelec, D. (1991). Melioration: A theory of distributed choice. The Journal of Economic Perspectives, 5(3), 137-156.
Herrnstein, R. J. and Vaughan, Jr., W. (1980). Melioration and behavioral allocation. In: Stadden, J.E. (Ed.), Limits to Action. New York: Academic Press.
Hertwig, R., and Ortmann, A. (2002). Economists’ and psychologists’ experimental practices: How they differ, why they differ and how they could converge. In Brocas, I. and Carillo, J.D. (Eds.). The psychology of economic decisions, 253–272. New York: Oxford UniversityPress.
Hertwig, R., Barron, G., Weber, E. U., and Erev, I. (2004). Decisions from experience and the effect of rare events in risky choice. Psychological Science, 15, 534-539.
Hertwig, R., & Erev, I. (2009), "The description–experience gap in risky choice." Trends in Cognitive Sciences, 13, 517-523.
Ho, T.-H., Camerer, C. and Chong, J.-K. (2007). Self-tuning experience weighted attraction learning in games. Journal of Economic Theory, 133(1), 177-198.
Ho, T-H. and Weigelt, K. (1996), "Task Complexity, Equilibrium Selection, and Learning: An Experimental Study," Management Science, 42 (1996), 659-679.
Ho, T-H., Camerer, C., and Weigelt, K. (1998) "Iterated Dominance and Iterated Best Response in Experimental P-Beauty Contests," The American Economic Review, 88 (1998), 947-969.
Ho, T-H, Wang, X., and Camerer, C. (2008) “Individual Differences in the EWA Learning with Partial Payoff Information,” The Economic Journal, 118:37-59.
Hochman, G. and Erev, I. (2013). The partial reinforcement extinction effect and the contingent sampling hypothesis. Psychonomics Bulletin and Review.
Hopfield, J. J., (1987). Proc. Natl. Acad. Sci. U.S.A. 84, 8429. Hopkins, E. (2002). Two Competing Models of How People Learn in Games.
Econometrica, 70(6), 2141-2166. Huck, S., Normann, H-T., & Oechssler, J. (1999). Learning in Cournot Oligopoly-An
Experiment. The Economic Journal, 109, 80-95. Huck, S., Oechssler, J. and Normann, H.-T. (2003). Zero knowledge cooperation in
dilemma games. Journal of Theoretical Biology, 220, 47-54. Humphreys, L. G. (1939a). The effect of random alternation of reinforcement on the
acquisition and extinction of conditioned eyelid reactions. Journal of Experimental Psychology, 25, 141-158.
Humphreys, L. G. (1939b) Acquisition and extinction of verbal expectations in a situation analogous to conditioning. Journal of Experimental Psychology, 25, 294-301.
Isaac, M. and Plott, C. (1981). Price Controls and the Behavior of Auction Markets: An Experimental Examination. American Economic Review, 71(3), 448-459.
Isaac, R. M. and Walker, J.M. (1988). Group Size Effects in Public Goods Provision: The Voluntary Contributions Mechanism. Quarterly Journal of Economics, 103, 179-199.

100
Ivanova-Stenzel. R. and Salmon, T. (2004). Bidder Preferences among Auction Institutions. Economic Inquiry, 42, 223-236.
John, E. R, Chesler, P., Bartlett, F. and Victor, I. (1969). Observational learning in cats. Science, 166, 901–903.
Kagel, J.H., Battalio, R. and Green, L. (1995). Economic Choice Theory: An Experimental Analysis of Animal Behavior. New York: Cambridge University Press.
Kagel, J. H., Harstad, R.M., and Levin, D. (1987) Information Impact and Allocation Rules in Auctions with Affiliated Private Values: A Laboratory Study. Econometrica, 55(6), 1275-1304.
Kagel, J.H. and Levin, D. (1986). The winner's curse and public information in common value auctions. American Economics Review, 76 (1986), pp. 894–920.
Kahneman, D. (1988). Experimental Economics: A Psychological Perspective. In: Tietz, R., Albers, W., and Selten, R. (Eds.). Bounded Rational Behavior in Experimental Games and Markets. Berlin: Springer-Verlag.
Kahneman, D., and Tversky, A. (1979). Prospect theory: An analysis of decisions under risk. Econometrica, 47, 313-327.
Kalai, E. and Lehrer, E. (1993). Rational Learning Leads to Nash Equilibrium. Econometrica, 61(5) 1019-1045.
Kandori, M., Mailath, G. and Rob, R. (1993). Learning, Mutation, and Long Run Equilibria in Games. Econometrica, 61(1) 29-56.
Kelling, G. and Sousa, Jr., W.H. (1982). Do Police Matter? An Analysis of the Impact of New York City’s Police Reforms. Manhattan Institute Center for Civic Innovation Civic Report No. 22 (2001).
Kelling G, and Wilson, J.Q. (1982). Broken windows: The police and neighborhood safety. Atlantic Monthly, 249, 29–38.
Kelly, M. 1995. All their eggs in one basket: Portfolio Diversification of U.S. Households. Journal of Economic Behavior and Organization 27 87-96.
Kliger, D., Levy, O. and Sonsino, D. (2003). On absolute and relative performance and the demand for mutual funds—experimental evidence. Journal of Economic Behavior and Organization, 52, 341-363.
Lebiere, C., Gonzalez, C., & Martin, M. (2007). Instance-based decision making model of repeated binary choice. In: Proceedings of the 8th International Conference on Cognitive Modeling. Ann Arbor, Michigan, USA.
Lebiere, C., Wallach, D., & West, R. L. (2000). A memory-based account of the prisoner's dilemma and other 2x2 games. In Proceedings of International Conference on Cognitive Modeling, 185-193. NL: Universal Press.
Ledyard, J. O. (1995). Public Goods: A Survey of Experimental Research. In: Kagel, J. and Roth, A. (Eds.). The Handbook of Experimental Economics. Princeton, NJ: Princeton University Press.
Lee, W. (1971). Decision theory and human behavior. New York: Wiley. Levinthal, D.A., & March, J.G. (1993). The myopia of learning. Strategic Management
Journal, Winter Special Issue, 14, 95-112. Lemieux, T., MacLeod, W.B. (2000). Supply side hysteresis: the case of the Canadian
unemployment insurance system. Journal of Public Economics, 78(1-2), 139-170.

101
List, J.A. and Cherry, T.L. (2003). Examining the Role of Fairness in High Stakes Allocation Decisions. Working paper.
Lovio-George, C. (1992). What Motivates Best? Sales & Marketing Management, April 1992.
Luria, G., Zohar, D. and Erev, I. (2008). The Effect of Visilibity on Effectiveness of Supervisory-based Interventions, Journal of Safety Research. 39, 273–280.
MacDonald, D., Kagel, J. and Battalio, R. (1991). Animals’ choices over uncertain outcomes: further experimental results. Economic Journal, 191, 1067-1084.
Macy, M.W., and Andreas, F. (2002). Learning Dynamics. In: Social Dilemmas, Proceedings of the National Academy of Sciences of the United States of America, 99(10) Supplement 3.
Maier, S.F., and Seligman, M.E.P. (1976). Learned helplessness: Theory and evidence. Journal of Experimental Psychology: General, 105, 3-46.
Malcom, D. and Liebermann, B. (1965). The Behavior of Responsive Individuals Playing a Two-Person, Zero-Sum Game Requiring the Use of Mixed Strategies. Psychonomic Science, 373-374.
Mane, A.M. and Donchin, E. (1989). The Space Fortress Game. Acta Psychologica, 71, 17-22.
Marchiori, D. and Warglien, M. (2008). Predicting Human Interactive Learning by Regret-Driven Neural Networks. Science, 319, 1111 – 1113.
McFadden, D. L. (1974), “Conditional Logit Analysis of Qualitative Choice Behavior,” in Zarembka, Paul (ed.), Frontiers in Econometrica (New York: Academic Press, 1974), 105-142.
McKelvey, R. D. and Palfrey, T. R. (1995). Quantal Response Equilibrium for Normal Form Games. Games and Economic Behavior, 10, 6-38.
McKelvey, R. and Palfrey, T.R. (2001). Playing in the dark: Information, learning and coordination in repeated games. Technical report, California Institute of Technology.
Merlo, A., and Schotter, A. (1992). Experimentation and Learning in Laboratory Experiments: Harrison’s Criticism Revisited. American Economic Review, 82(5), 1413-1425.
Merlo, A. and Schotter, A. (2003). Learning By Not Doing: An Experimental Study. Games and Economic Behavior , 42, 116-136.
Meyer, R. J. and Shi, Y. (1995). Sequential choice under ambiguity: Intuitive Solutions to the armed bandit problem. Management Science, 41, 817-834.
Milgrom, Paul (2004), Putting Auction Theory to Work. New York: Cambridge University Press.
Milgrom, P. and Roberts, J. (1990). Rationalizability, Learning, and Equilibrium in Games with Strategic Complementarities. Econometrica, 58(6), 1255-1277.
Miller, N. F., & Dollard, J. (1941). Social learning and imitation. New Haven: Yale University Press.
Mookherjee, D. and Sopher, B. (1994). Learning behavior in an experimental matching pennies game. Games and Economic Behavior, 7, 62–91.
Mookherjee, D. and Sopher, B. (1997). Learning and Decision Costs in Experimental Constant Sum Games. Games and Economic Behavior, 19(1), 97-132.
102
Mowrer, O. H. (1947). On the dual nature of learning—a reinterpretation of "conditioning" and "problem solving." Harvard Educational Review, 17, 102-148.
Myers, J. L. and Sadler, E. (1960). Effects of range of payoffs as a variable in risk taking. Journal of Experimental Psychology, 60, 306-309.
Myers, J. Suydam, M., and Gambino, B. (1965). Contingent Gains and Losses in Risk Taking Situations. Journal of Mathematical Psychology, 2, 363-370.
Nash, J. (1950). “Non-cooperative Games,” Ph.D. thesis, Princeton University. Nelson, B. (1994). 1001 Ways to Energize Employees. New York: Workman Publishing
Company. Nelson, B. (1999). The Use of Informal Rewards in Recognizing Performance. [Online].
Available: http://www.p-management .com/articles/9902.htm. Nevo, I., & Erev, I. (2012). On surprise, change, and the effect of recent outcomes.
Frontiers in Cognitive Science. Neugebauer, T. and Selton, R. (2006). Individual behavior of first-price auctions: The
importance of information feedback in computerized experimental markets. Games and Economic Behavior, 54(1), 183-204.
Nuland, S.B. (2003). The Doctors' Plague: Germs, Childbed Fever and the Strange Story of Ignac Semmelweis. New York: W W Norton & Co Ltd.
Nyarko, Y. & Schotter, A. (2002). An Experimental Study of Belief Learning Using Elicited Beliefs. Econometrica, 70, 971-1006
Ochs, Jack (1995). An Experimental Study of Games with Unique Mixed Strategy Equilibria. Games and Economic Behaviour, 202-217.
Ockenfels, A. and Selten, R. (2005). Impulse Balance Theory and Feedback in First Price Autions.” Games and Economic Behavior, 51, 155-170.
Offerman, T., Potters, J., and Sonnemans, J. (2002). Imitation and Belief Learning in an Oligopoly Experiment. Review of Economic Studies, 69(4), 973-997.
O’Neill, B. (1987). Nonparametric Test of the Minimax Theory of Two-Person Zero-Sum Games. Proceedings of the National Academy of Sciences, 84(7), pp. 2106-9.
Osborne, M. and Rubinstein, A. (1998). Games with Procedurally Rational Players. American Economic Review, 88 (1998), 834-847.
Osgood, C.E. (1949). The similarity paradox in human learning: a resolution. Psychological Review, 56, 132-143.
Overmier, J. B. and Seligman, M.E.P. (1967). Effects of inescapable shock upon subsequent escape and avoidance responding. Journal of Comparative and Physiological Psychology, 63, 28-33.
Pavlov, I. P. (1927). Conditioned reflexes. London: Oxford University Press. Petersen, C., Maier, S.F., Seligman, M.E.P. (1995). Learned Helplessness: A Theory for
the Age of Personal Control. New York: Oxford University Press. Plott, C.R. (1982). Industrial organization theory and experimental economics. Journal of
Economic Literature, 20, 1485–1527. Plott, C.R. and Smith, V.L. (1978). An experimental examination of two exchange
institutions. Review of Economic Studies, 45, 133–153. Plonsky O. and Erev, I. (2013). Agile environments and the tendency to rely on small
samples. Working paper. Radner, R. (1980) Collusive behavior in non-cooperative epsilon equilibria of oligopolies
with long but finite lives, Journal of Economic Theory, 22, 121-157.
103
Rapoport, A. (1995). Effects of information on assessment of probabilities. Theory and Decision, 41(21).
Rapoport, A., 1967. Exploiter, leader, hero, and martyr: the four archetypes of the 2x2 game. Behav. Sci. 12, 81–84.
Rapoport, A. (1988). Provision of step-level public goods: Effects of inequality in resources. Journal of Personality and Social Psychology, 54, 432-440.
Rapoport, A. and Amaldoss, W. (2004). Mixed-strategy play in single-stage first-price all-pay auctions with symmetric players. Journal of Economic Behavior and Organization, 54, 585–607.
Rapoport, A. and Boebel, R. (1992). Mixed strategies in strictly competitive games: A further test of the minimax hypothesis. Games and Economic Behavior, 4, 261–283.
Rapoport, A. and Budescu, D.V. (1997). Randomization in individual choice behavior. Psychological Review, 104, 603-617.
Rapoport, A., Daniel, T. E., and Seale, D. A. (1998). Reinforcement-based adaptive learning in asymmetric two-person bargaining with incomplete information. Journal of Experimental Economics, 1(3), 221-253.
Rapoport, A., Erev, I., Abraham, E.V. and Olson, D.E. (1997). Randomization and adaptive learning in a simplified poker game. Organizational Behavior and Human Decision Processes, 69, 31-49.
Rapoport, A., Kugler, T., Dugar, S. and Gisches, E. J. (2008). Choice of routes in traffic networks: Experimental tests of the Braess paradox. Forthcoming in Games and Economic Behavior.
Rapoport, A., and Mowshowitz, A. (1966). Experimental studies of stochastic models for the Prisoner's Dilemma. Behavioral Science, 11, 444-58.
Rapoport, A. Seale, D. A and Ordonez, L. (2002).Tacit Coordination in Choice Between Certain Outcomes in Endogenously Determined Lotteries. The Journal of Risk and Uncertainty, 25:1; 21–45.
Rapoport, A., Seale, D.A. and Winter, E. (2002). Coordination and Learning Behavior in Large Groups with Asymmetric Players. Games and Economic Behavior, 39, 11–136.
Rapoport, A., and Sundali, J. (1996). Ultimatums in two person bargaining with one sided uncertainty: Offer games. International Journal of Game Theory, 25: 475-494.
Rapoport, An., and Chammah, A. M. (1965). Prisoner's Dilemma. Ann Arbor: University of Michigan Press.
Rapoport, An., Guyer, M.J., and Gordon, D.G. (1976). The 2x2 Game. Ann Arbor: University of Michigan Press.
Redish, A., Jensen, S., Johnson, A., & Kurth-Nelson, A. (2007). Reconciling reinforcement learning models with behavioral extinction and renewal: Implications for addiction, relapse, and problem gambling. Psychological Review 114, 784-805.
Rescorla, R. A., and Solomon, R. L. (1967). Two-process learning theory: Relationships between Pavlovian conditioning and instrumental learning. Psychological Review, 74, 151-182.
Richman, C.L., Dember, W.N. and Kim, P. (1986). Spontaneous alternation behavior in animals: A review. Current Psychology, 5(4), 358-391.

104
Rieskamp, Jerome R. Busemeyer, and Tei Laine. How Do People Learn to Allocate Resources? Comparing Two Learning Theories. Journal of Experimental Psychology. Learning, Memory, and Cognition 2003, Vol. 29, No. 6, 1066–1081
Rieskamp, J and Otto, P.E. (2006). SSL: A Theory of How People Learn to Select Strategies. Journal of Experimental Psychology: General, 135(2) 207-236.
Robbins, S.P. (2001). Organizational Behavior. Upper Saddle River, NJ: Prentice-Hall. Roth, A.E. and Erev, I. (1995). Learning in Extensive-Form Games: Experimental Data
and Simple Dynamic Models in the Intermediate Term. Games and Economic Behavior , 8, 164-212.
Roth, A.E., Prasnikar, V., Okuwo-Fujiwara, M. and Zamir, S. (1991). Bargaining and market behavior in Jerusalem, Ljubiljana, Pittsburgh and Tokyo: An experimental study. American Economic Review 81: 1068–1095.
Rottenstreich, Y. (1995). Framing in games. Unpublished doctoral dissertation, Stanford University, Stanford, California.
Salmon, T. (2001). An Evaluation of Econometric Models of Adaptive Learning. Econometrica, 69(6), 1597-1628.
Samuelson, P. (1963). Risk and Uncertainty: A Fallacy of Large Numbers. Scientia, 9, 108-13.
Samuelson, W. and Bazerman, M. (1985). The Winner’s Curse in Bilateral Negotiations. In Smith, V.L. (Ed.). Research in Experimental Economics, Vol. 3. Greenwich, Conn.: JAI Press, 105-137.
Samuelson, W. & Zeckhauser, R. (1988). Status quo bias in decision making. Journal of Risk and Uncertainty, 1, 7-59.
Sarin, R. and Vahid, F., (1999). Payoff assessments without probabilities: a simple dynamic model of choice. Games and Economic Behavior. 28, pp. 294–309.
Sarin, R. & Vahid, F. (2001). Predicting How People Play Games: A Simple Dynamic Model of Choice. Games and Economic Behavior, 34(1), 104-122.
Savage, L.J. and Friedman, M. (1948). The Utility Analysis of Choices Involving Risk. Journal of Political Economy, 56(4), 279-304.
Schmalensee, R. (1975). Alternative Models of Bandit Selection. Journal of Economic Theory, 10, 333-342.
Segal, M.W. (1974). Alphabet and attraction: An unobstruvsive measure of the effect of propinquity in a field setting. Journal of Personality and Social Psychology, 30, 654-657.
Selten, R., Chmura, T. (2005). Stationary concepts for experimental 2x2 games. Bonn Economic Discussion Paper.
Selten, R., Abbink, Buchta, K.J. and Sadrieh, A. How to Play 3x3-Games - A Strategy Method Experiment. Games and Economic Behavior, 45(1), 2003, 19-37.
Selten, R. and Buchta, J. (1998). Experimental sealed bid first price auctions with directly observed bid functions. In Budescu, D., Erev, I. and Zwick, R. (Eds.). Games and Human Behaviour. Mahwah, N.J.: Lawrence Erlbaum Associates, 79–102.
Selten, R., Chmura, T., Pitz, T., Kule, S. and Schreckenberg, M. (2007). Commuters route choice behavior. Games and Economic Behavior, 58(2), 394-406.
Selten, R. and Stoecker, R. (1986). End Behaviour in Sequences of Finite Prisoner’s Dilemma Supergames: A Learning Theory Approach. Journal of Economic Behavior and Organization, 7, 47-70.

105
Shachat, J.M. (2002). Mixed Strategy Play and the Minimax Hypothesis. Journal of Economic Theory, 104(1), 189-226.
Shafir, S. (2000). Risk-sensitive foraging: The effect of relative variability. Oikos, 88, 663–669.
Shafir S., Reich, T., Tsur, E., Erev, I. and Lotem, A. (2008). Perceptual accuracy and conflicting effects of certainty on risk-taking behaviour. Nature, 453, 917-920.
Shanks, D.R., Tunney, R.J., and McCarthy, J.D. (2002). A Re-examination of Probability Matching and Rational Choice. A Journal of Behavioral Decision Making, 15(3), 232-250.
Sherman, R. (1971). Empirical oligopoly. Kyklos, 24 (1):30–49. Siegel, S., & Goldstein, D. A. (1959). Decision-making behavior in a two-choice
uncertain outcome situation. Journal of Experimental Psychology, 57, 37–42. Simon, H. (1957). Models of Man: Social and Rational. New York: John Wiley and
Sons. Simonsohn, U., Karlsson, N., Loewenstein, G. and Ariely, D. (2008). The Tree of
Experience in the Forest of Information: Overweighing Experienced Relative to Observed Information. Games and Economic Behavior, forthcoming.
Skinner, B. F. (1938) The behavior of organisms. New York: Appleton-Century-Crofts. Skinner, B.F. (1953). Science and Human Behavior. New York: Free Press. Silverman, E.B. (1999). New York Police Department Battles Crime. Boston:
Northeastern University Press. Slonim, R. and Roth, A.E. (1998). Learning in High Stakes Ultimatum Games: An
Experiment in the Slovak Republic. Econometrica, 66(3), 569-596. Slonim R. (2007). Smalley, W., Shatin, D., Wysowski, D.K., Gurwitz, J., Andrade, S.E., Goodman, M.,
Chen, K.A., Platt, R., Schech, S.D., Ray, W.A. (2000). Contraindicated use of cisapride: impact of food and drug administration regulatory action. Journal of the American Medical Association, 284(23), 3036-3039.
Smith, T.G. and Tasnádi, A. (2007). A theory of natural addiction. Games and Economic Behavior, 59 316–344.
Smith, V.L. (1962). An Experimental Study of Competitive Market Behavior. Journal of Political Economics, 70, 111–137.
Smith, V.L., Suchanek, G.L. and Williams, A.W. (1988). Bubbles, Crashes, and Endogenous Expectations in Experimental Spot Asset Markets. Econmetrica, 56(5), 1119-1151.
Sonsino, D. (1997). Learning to learn, pattern recognition and Nash equilibrium. Games and Economic Behavior, 18: 286-331.
Sonsino, D., Erev, I., and Gilat, S. (2002). On the likelihood of repeated zero-sum betting by adaptive (human) agents. Mimeo.
Stahl, D. (2000). Rule Learning in Symmetric Normal-Form Games: Theory and Evidence. Games and Economic Behavior, 32, 105-138.
Stajkovic, A. and Luthans, F. (1997). A meta-analysis of the effects of organizational behavior modification on task performance, 1975-95. Academy of Management Journal, 40, 1122-1149.
Sterman, J. (1989a). Misperceptions of Feedback in Dynamic Decision Making. Organizational Behavior and Human Decision Processes, 43, 301-35.

106
Sterman, J. (1989b). Modeling Managerial Behavior: Misperceptions of Feedback in a Dynamic Decision Making Experiment. Management Science, 35, 3.
Straus M. A. (1991). Discipline and deviance: physical punishment of children and
violence and other crime in adulthood. Social Problems, 38(2): 133-154. Sundali, J.A., Rapoport, A. and Seale. D.A. (1995). Coordination in Market Entry Games
with Symmetric Players. Organizational Behavior and Human Decision Processes, 64, 203–218.
Suppes, P. and Atkinson, Richard C. (1960). Markov learning models for multiperson interactions. Stanford, CA: Stanford University Press.
Sutherland, N. S. and Mackintosh, N.J. (1971). Mechanisms of Animal Discrimination Learning. New York: Academic Press.
Taleb, N.N. (2007) The Black Swan: The Impact of the HighlyImprobable, Random House
Terkel, J., (1996). Cultural transmission of feeding behavior in black rats (rattus rattus). In: Heynes, C., Galef Jr., B. (Eds.), Social Learning in Animals and the Roots of Culture. New York: Academic Press, 17–47.
Teoderescu, K. & Erev, I. (2012). On the Decision to Explore New Alternatives: The Coexistence of Under- and Over- Exploration.
Thaler, R. H., Tversky, A., Kahneman, D. and Schwartz, A. (1997). The effect of myopia and loss aversion on risk taking: An experimental test. Quarterly Journal of Economics, 112 (2): 647-661.
Thorndike, E. L. (1898). Animal intelligence: An experimental study of the associative processes in animals. Psychological Review Monograph Supplement 2.
Thorndike, E.L. (1911). Animal Intelligence. New York: Thoemmes Press Classics in Psychology (1998).
Tirole, J. (1996). A Theory of Collective Reputations (with applications to the persistence of corruption and to firm quality). Review of Economic Studies, 63, 1-22.
Tolman, E. C. (1925). Purpose and cognition: the determinants of animal learning. Psychological Review, 32, 285–297.
Ungemach, C., Chater, N., & Stewart, N. (2008). Decisions from Experience without Sampling Error. Manuscript submitted for publication.
Van Boening, M., Williams, A.W. and LaMaster, S. (1993). Price Bubbles and Crashes in Experimental Call Markers. Economic Letters, 41, 179-185.
Van Huyck, J. B., Battalio, R.C., and Beil, R.O. (1990). Tacit Coordination Games, Strategic Uncertainty, and Coordination Failure. The American Economic Review, 80, 234-248.
Van Huyck, J. B., Battalio, R.C., and Beil, R.O. (1991). Strategic Uncertainty, Equilibrium Selection, and Coordination Failure in Average Opinion Games. The Quarterly Journal of Economics, 106, 885-911.
Van Huyck, J. B., Battalio, R.C., and F. Rankin (2007). Selection Dynamics and Adaptive Behavior Without Much Information . Economic Theory, 33(1), 53-65.
Van Huyck, J.; Cook, J., & Battalio, R. (1997). Adaptive behavior and coordination failure. Journal of Economic Behavior and Organization, 32 (4). 483-503.
Vega-Redond, F. (1997). The Evolution of Walrasian Behavior. Econometrica, 65(2), 375-384.
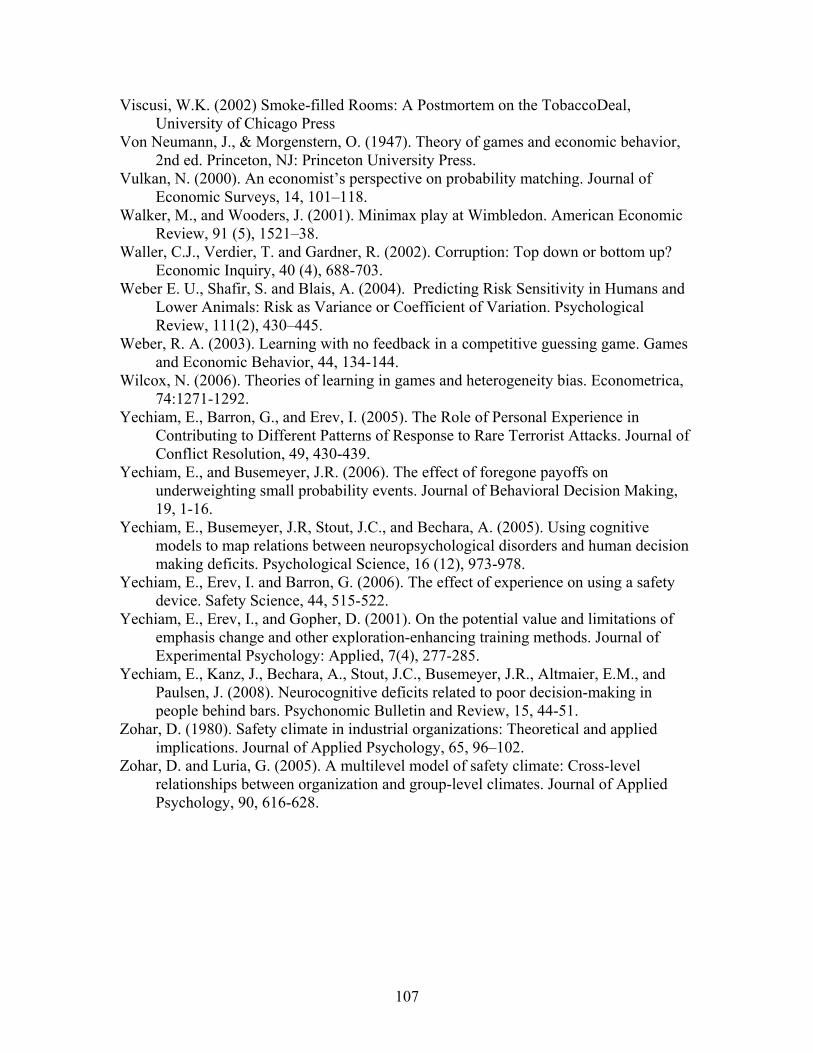
107
Viscusi, W.K. (2002) Smoke-filled Rooms: A Postmortem on the TobaccoDeal, University of Chicago Press
Von Neumann, J., & Morgenstern, O. (1947). Theory of games and economic behavior, 2nd ed. Princeton, NJ: Princeton University Press.
Vulkan, N. (2000). An economist’s perspective on probability matching. Journal of Economic Surveys, 14, 101–118.
Walker, M., and Wooders, J. (2001). Minimax play at Wimbledon. American Economic Review, 91 (5), 1521–38.
Waller, C.J., Verdier, T. and Gardner, R. (2002). Corruption: Top down or bottom up? Economic Inquiry, 40 (4), 688-703.
Weber E. U., Shafir, S. and Blais, A. (2004). Predicting Risk Sensitivity in Humans and Lower Animals: Risk as Variance or Coefficient of Variation. Psychological Review, 111(2), 430–445.
Weber, R. A. (2003). Learning with no feedback in a competitive guessing game. Games and Economic Behavior, 44, 134-144.
Wilcox, N. (2006). Theories of learning in games and heterogeneity bias. Econometrica, 74:1271-1292.
Yechiam, E., Barron, G., and Erev, I. (2005). The Role of Personal Experience in Contributing to Different Patterns of Response to Rare Terrorist Attacks. Journal of Conflict Resolution, 49, 430-439.
Yechiam, E., and Busemeyer, J.R. (2006). The effect of foregone payoffs on underweighting small probability events. Journal of Behavioral Decision Making, 19, 1-16.
Yechiam, E., Busemeyer, J.R, Stout, J.C., and Bechara, A. (2005). Using cognitive models to map relations between neuropsychological disorders and human decision making deficits. Psychological Science, 16 (12), 973-978.
Yechiam, E., Erev, I. and Barron, G. (2006). The effect of experience on using a safety device. Safety Science, 44, 515-522.
Yechiam, E., Erev, I., and Gopher, D. (2001). On the potential value and limitations of emphasis change and other exploration-enhancing training methods. Journal of Experimental Psychology: Applied, 7(4), 277-285.
Yechiam, E., Kanz, J., Bechara, A., Stout, J.C., Busemeyer, J.R., Altmaier, E.M., and Paulsen, J. (2008). Neurocognitive deficits related to poor decision-making in people behind bars. Psychonomic Bulletin and Review, 15, 44-51.
Zohar, D. (1980). Safety climate in industrial organizations: Theoretical and applied implications. Journal of Applied Psychology, 65, 96–102.
Zohar, D. and Luria, G. (2005). A multilevel model of safety climate: Cross-level relationships between organization and group-level climates. Journal of Applied Psychology, 90, 616-628.

108
Table 1: Summary of experiments that examine a choice between a safe prospect and a prospect with no more than 2 outcomes using the basic clicking paradigm. The recency effects (in bold) are estimated as the difference between the R-rates after high and low payoffs from R given the same recent choice.
Experimental results The predictions of I-saw R-rates and implied recency effect as
a function of last choice and recent payoff from R
R-rate over all
trials
R-rates and implied recency effect as a function of last choice and recent
payoff from R
R-rate over all
trials Last choice Last
choice S
(R-rate is switch rate, recent
payoff from R is forgone)
R (R-rate is
repetition rate, recent payoff from
R is obtained)
S (R-rate is switch
rate, recent payoff from R is
forgone)
R (R-rate is
repetition rate, recent payoff from
R is obtained) Problem [# of trials]
Most recent payoff
from R
High Low High Low High Low High Low
1 [200]
S 0 with certainty R 1 with certainty
R-rate .43 - .99 - .96 0.48 - 0.94 - 0.89 - - - -
2 [200]
S 0 with certainty R (11, .5; -9)
R-rate .56 .21 .81 .59 .58 0.37 0.30 0.81 0.76 0.61 Recency +.35 +.22 +.07 +.05
3 [200]
S 0 with certainty R (9, .5; -11)
R-rate .40 .16 .77 .60 .47 0.24 0.18 0.72 0.64 0.40 Recency +.24 +.17 +.06 +.08
4 [100]
S 0 with certainty R (10, .1; -1)
R-rate .23 .06 .60 .79 .29 0.32 0.13 0.74 0.76 0.38 Recency +.17 -.19 +.19 -.02
8 [100]
S 0 with certainty R (1, .9; -10)
R-rate .21 .31 .84 .69 .56 0.24 0.26 0.87 0.68 0.62 Recency -.10 +.15 -.02 +.19
9 [400]
S 3 with certainty R (4,0.8; 0)
R-rate .2 .20 .91 .67 .64 0.36 0.38 0.85 0.76 0.68 Recency +.06 +.24 -.02 +.09
12 [400]
S 2.52 with certainty R (2.53,0.89; 2.43)
R-rate .15 .09 .94 .78 .60 0.28 0.30 0.85 0.72 0.63 Recency +.06 +.16 -.02 +.13
13 [400]
S 2.52 with certainty R (2.53,0.89; 2.03)
R-rate .06 .08 .92 .63 .28 0.08 0.08 0.76 0.57 0.24 Recency -.02 +.29 0 +.19
14 [100]
S 7 with certainty R (16.5,0.01;6.9)
R-rate 0.40 0.04 0.94 0.95 0.45 0.46 0.07 0.77 0.91 0.46 Recency +.36 -.01 +.39 -.14
15 [100]
S -9.4 with certainty R (-2,0.05;-10.4)
R-rate 0.15 0.06 0.70 0.80 0.26 0.23 0.09 0.56 0.71 0.26 Recency +.09 -.10 +.14 -.15
16 [100]
S -4.1 with certainty R (1.3,0.05;-4.3)
R-rate 0.27 0.06 0.86 0.94 0.54 0.36 0.11 0.81 0.84 0.42 Recency +.21 -.08 +.25 -.03
17 [100]
S -18.7 with certainty R (-7.1,0.07;-19.6)
R-rate 0.29 0.06 0.85 0.87 0.38 0.31 0.11 0.72 0.76 0.35 Recency +.23 -.02 +.20 -.04
18 [100]
S -7.9 with certainty R (5,0.08;-9.1)
R-rate 0.20 0.06 0.86 0.84 0.31 0.30 0.12 0.71 0.75 0.34 Recency +.14 +.02 +.18 -.04
19 [100]
S -25.4 with certainty R (-8.9,0.08;-26.3)
R-rate 0.22 0.07 0.89 0.90 0.45 0.35 0.13 0.82 0.83 0.46 Recency +.15 -.01 +.22 -.01
20 [100]
S 11.5 with certainty R (25.7,0.1;8.1)
R-rate 0.29 0.07 0.81 0.78 0.30 0.23 0.11 0.60 0.67 0.26 Recency +.22 +.03 +.12 -.07
21 [100]
S -15.5 with certainty R (-8.8,0.6;-19.5)
R-rate 0.42 0.19 0.91 0.75 0.68 0.44 0.39 0.90 0.86 0.77 Recency +.23 +.16 +.05 +.04
22 [100]
S 2.2 with certainty R (3,0.93;-7.2)
R-rate 0.13 0.15 0.85 0.68 0.47 0.25 0.30 0.89 0.71 0.67 Recency -.02 +.17 -.05 +.18
23 [100]
S 25.2 with certainty R (26.5,0.94;8.3)
R-rate 0.14 0.32 0.86 0.82 0.52 0.25 0.31 0.90 0.71 0.68 Recency -.18 +.04 -.06 +.19
24 [100]
S 6.8 with certainty R (7.3,0.96;-8.5)
R-rate 0.08 0.23 0.92 0.77 0.50 0.16 0.21 0.90 0.65 0.60 Recency -.15 +.15 -.05 +.25
25 [100]
S 11 with certainty R (11.4,0.97;1.9)
R-rate 0.09 0.19 0.94 0.71 0.57 0.19 0.33 0.92 0.70 0.68 Recency -.10 +.23 -.14 +.22

109
Table 2: The proportion of risky choices as a function of feedback and time (in two blocks of 50 trials) in 12 randomly selected problems that were studied using the clicking paradigm. The complete feedback condition was run by Nevo and Erev (2012), and the partial feedback condition was run by Erev et al. (2010). The difference column is an estimate of the hot stove effect.
Problem Block Complete Partial Difference 14
S 7 with certainty R (16.5,0.01;6.9)
1 0.45 0.21 0.24 2 0.46 0.15 0.31
15
S -9.4 with certainty R (-2,0.05;-10.4)
1 0.27 0.16 0.11 2 0.25 0.07 0.18
16
S -4.1 with certainty R (1.3,0.05;-4.3)
1 0.51 0.31 0.20 2 0.58 0.29 0.29
17
S -18.7 with certainty R (-7.1,0.07;-19.6)
1 0.37 0.35 0.02 2 0.39 0.33 0.06
18
S -7.9 with certainty R (5,0.08;-9.1)
1 0.41 0.24 0.17 2 0.49 0.14 0.35
19
S -25.4 with certainty R (-8.9,0.08;-26.3)
1 0.29 0.11 0.18 2 0.32 0.07 0.25
20
S 11.5 with certainty R (25.7,0.1;8.1)
1 0.31 0.12 0.19 2 0.28 0.11 0.17
21
S -15.5 with certainty R (-8.8,0.6;-19.5)
1 0.65 0.62 0.03 2 0.71 0.69 0.02
22
S 2.2 with certainty R (3,0.93;-7.2)
1 0.48 0.52 -0.04 2 0.46 0.35 0.11
23
S 25.2 with certainty R (26.5,0.94;8.3)
1 0.54 0.65 -0.11 2 0.49 0.42 0.07
24
S 6.8 with certainty R (7.3,0.96;-8.5)
1 0.54 0.70 -0.16 2 0.47 0.60 -0.13
25
S 11 with certainty R (11.4,0.97;1.9)
1 0.61 0.69 -0.08 2 0.53 0.63 -0.10

110
Table 3: Three of the randomly selected games studied by Erev et al (2002, 2007) under
minimal information (unknown matrix, feedback limited to obtained payoffs) and under
full information (known matrix, complete feedback). The games are presented on the left
(the entries in each cell are the probability that Player 1 wins, the probability that Player 2
wins is 1 minus this value). The right hand columns present the equilibrium prediction,
the observed results (over the 500 trials, by condition), and the predictions of I-SAW.
The correlation between the two conditions is 0.9, the correlation between I-SAW and the
full information condition is 0.93 and the MSD score is 0.0047.
Game Information condition I-SAW
A2 B2 Statistic Eq. Minimal Full I-SAW 1 A1 .77 .35 P(A1) .49 0.68 0.59 0.64 B1 .08 .48 P(A2) .16 0.42 0.32 0.28 2 A1 .73 .74 P(A1) .99 0.76 0.84 0.84 B1 .87 .20 P(A2) .79 0.40 0.36 0.21 9 A1 .40 .76 P(A1) .65 0.58 0.56 0.61 B1 .91 .23 P(A2) .51 0.45 0.45 0.46

111
Table 4: Prisoner dilemma games that were studied using variants of Selten and Stoker’s
supergame procedure
PD2: Selten &
Stoker
C D
C 60, 60 -50, 145
D 145, -50 10, 10
PD3: Andereoni &
Miller
C D
C 7, 7 0, 12
D 12, 0 4, 4
PD4: Bereby-Meyer
& Roth
C D
C .105, .105 .005, .175
D .175, .005 .075, .075
PD5: Dal Bó and
Fréchette
C D
C R, R 12, 50
D 50, 12 25,25

112
Table 5: The asymmetric Stag Hunt game considered by Erev and Greiner (in press)
A B C D E A 10, 5 9, 0 9, 0 9, 0 9, 0 B 0, 4 0, 0 0, 0 0, 0 0, 0 C 0, 4 0, 0 0, 0 0, 0 0, 0 D 0, 4 0, 0 0, 0 0, 0 0, 0 E 0, 4 0, 0 0, 0 0, 0 12, 12

113
Figures Figure 1. The typical instructions screen in studies of decisions from description (using the "decisions under risk paradigm"), and studies of decisions from experience (using the "clicking paradigm"). In the decisions under risk paradigm the subjects receive a complete description of the payoff distributions, and no feedback. Each selection moves the subject to the next task.
In the clicking paradigm, the subjects do not receive a description of the payoff distribution, and have to rely on the available feedback. In the experiments described in Section 1.1, the feedback was complete: It included information concerning the payoffs from both keys. In the experiments described in Section 1.2 the feedback was partial: only the payoff from the selected option was revealed. a. Decision from description -- the decisions under risk paradigm: Please select one of the following prospects:
Win 4000 with probability 0.80 0 otherwise (probability 0.20)
Win 3000 with certainty
b. Decisions from experience -- the clicking paradigm: The current experiment includes many trials. Your task, in each trial, is to click on one of the two keys presented on the screen. Each click will be followed by the presentation of the keys’ payoffs. Your payoff for the trial is the payoff of the selected key.

114
Figure 2: The H-rate (proportion of H choices) of three participants in the first 25 trial of
an experiment that involves a choice between a key that provides 1 with certainty (Option
H), and a key that provides 0 with certainty. Each curve presents the H-rate of one
participant in 5 blocks of 5 trials each. All subjects learn to maximize, but the process is
stochastic.
Proportion of H
0.00
0.25
0.50
0.75
1.00
Block
1 2 3 4 5

115
Figure 3. Proportion of H choice in Problems 1,2, and 3 in 10 blocks of 20 trials. The
results demonstrate the payoff variability effect.
Problem H
(high EV)
L
1 1 with certainty 0 with certainty
2 (11, .5; -9) 0 with certainty
3 0 with certainty (9, .5; -11)
0
0.2
0.4
0.6
0.8
1
1.2
1 2 3 4 5 6 7 8 9 10
Pro
po
rtio
n o
f H
Ch
oic
es
Blocks of 20 trials
Problem 1
Problem 2
Problem 3

116
Figure 4: The very recent effect: The proportion of choices (at trial t) of the alternative
that led to the best outcome in trial t-Lag. Thus, Lag=1 (on the right) present the best
reply rate to the most recent trial, and Lag=2 present the best reply rate to the outcome
occur in the trial before the most recent. The analysis is based on trial 21 to 200 in
Problems 2 and 3.
0
0.1
0.2
0.3
0.4
0.5
0.6
0.7
01234567891011121314151617181920
BR
Rat
e
Lag
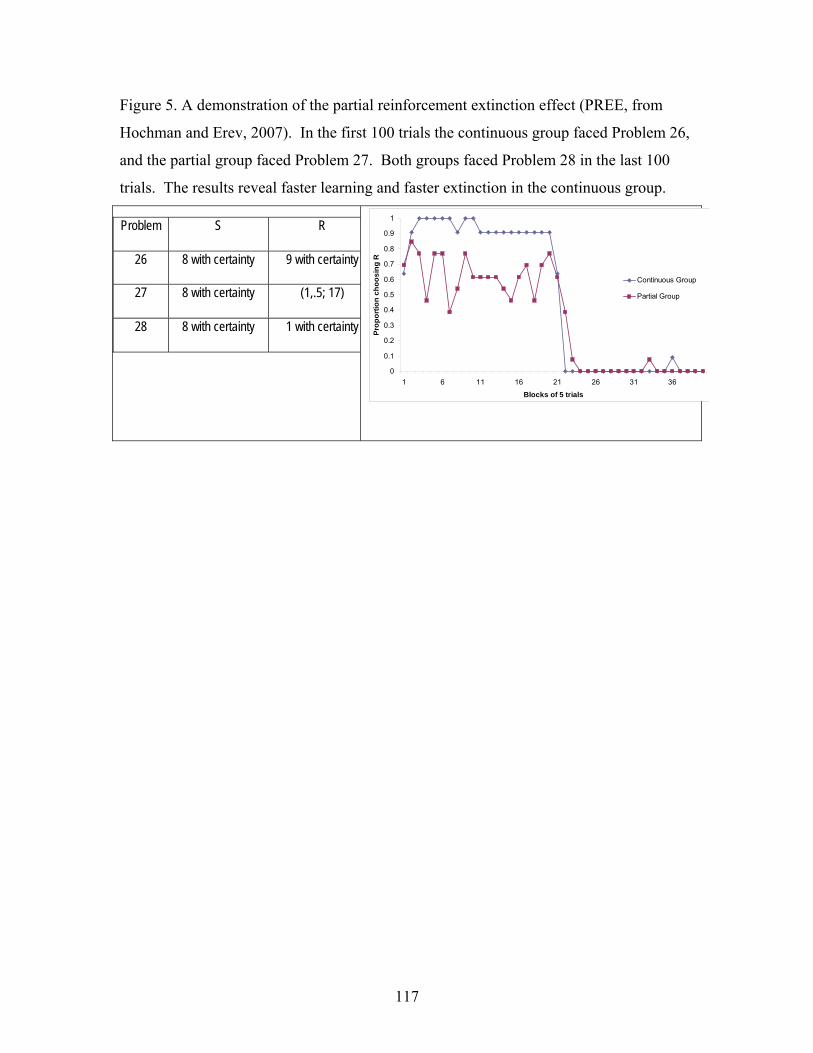
117
Figure 5. A demonstration of the partial reinforcement extinction effect (PREE, from
Hochman and Erev, 2007). In the first 100 trials the continuous group faced Problem 26,
and the partial group faced Problem 27. Both groups faced Problem 28 in the last 100
trials. The results reveal faster learning and faster extinction in the continuous group.
Problem S R
26 8 with certainty 9 with certainty
27 8 with certainty (1,.5; 17)
28 8 with certainty 1 with certainty
0
0.1
0.2
0.3
0.4
0.5
0.6
0.7
0.8
0.9
1
1 6 11 16 21 26 31 36
Blocks of 5 trials
Pro
po
rtio
n c
ho
os
ing
R
Continuous Group
Partial Group

118
Figure 6: A demonstration of the neighborhood effect. In each trial the participants were
asked to select one of 400 keys that were presented in a 20X20 matrix. The upper panel
presents the payoff matrix. The lower payoff presents the proportion of the maximal
payoff (Pmax) obtained by the subject in 4 blocks of 50 trials.
Three dimensional summary
of the payoff matrices
Isolated global maximum Global maximum with wide basin
Pmax in blocks of 100 trials
(minimal information, 400 trials, n=10, .25¢):
Problem 30: Isolated G. max
Problem 31: G. max. with wide basin
1 3 5 7 9
11
13
15
17
19
S1
S9
S17
0
10
20
30
40
50
60
1 4 7
10 13 16 19
S1
S10
S19
0
10
20
30
40
50
60
G. max. with wide basin Isolated G. max
0
0.25
0.5
0.75
1
1 2 3 4 1 2 3 4Block
PMax
Payoff Payoff
Strategy space Strategy space
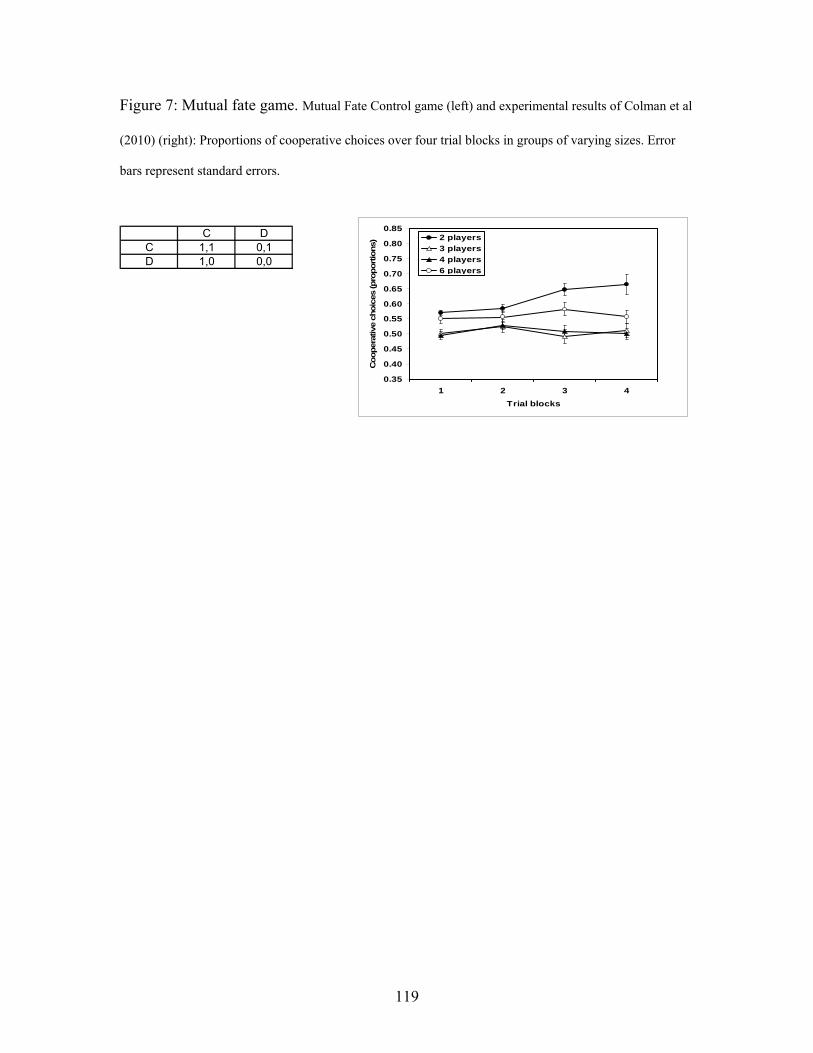
119
Figure 7: Mutual fate game. Mutual Fate Control game (left) and experimental results of Colman et al
(2010) (right): Proportions of cooperative choices over four trial blocks in groups of varying sizes. Error
bars represent standard errors.
C DC 1,1 0,1D 1,0 0,0
0.35
0.40
0.45
0.50
0.55
0.60
0.65
0.70
0.75
0.80
0.85
1 2 3 4
Trial blocks
Coopera
tive c
hoic
es (pro
port
ions) 2 players
3 players
4 players
6 players

120
Figure 8: A constant sum game study (Suppes and Atkinson, 1960). In each trial Player 1 selects a row and Player 2 selects a column. The selected cell determines the players’ payoff: Player 1’s payoff is the entry on the left, and Player 2’s payoff is the entry on the right. The left-hand graphs present the observed proportion of A1 and A2 choices, and the equilibrium predictions (as a separate point in the last block). The results reveal that player 1 deviates from the equilibrium prediction.
Condition Unknown Condition Known I-SAW
0
0.2
0.4
0.6
0.8
1
1 2 3 4 5 6 7
Pro
port
ion
A
Blocks of 30 trials
0
0.2
0.4
0.6
0.8
1
1 2 3 4 5 6 7 EqmBlocks of 30 trials
Pro
po
rtio
n A
0
0.2
0.4
0.6
0.8
1
1 2 3 4 5 6 7
Pro
port
ion
A
Blocks of 30 trials
Row Player Column Player
A2 B2
A1 0.3,0.7 0.8,0.2
B1 0.4,0.6 0.1,0.9
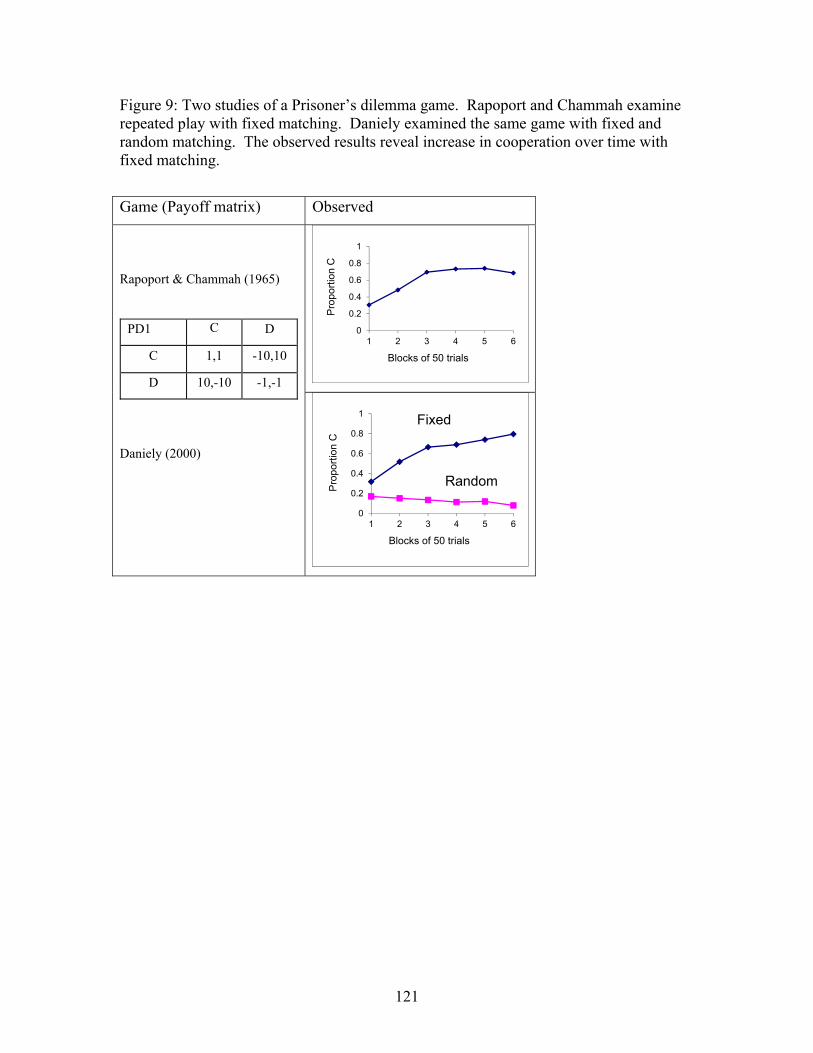
121
Figure 9: Two studies of a Prisoner’s dilemma game. Rapoport and Chammah examine repeated play with fixed matching. Daniely examined the same game with fixed and random matching. The observed results reveal increase in cooperation over time with fixed matching.
Game (Payoff matrix) Observed
Rapoport & Chammah (1965)
Daniely (2000)
PD1 C D
C 1,1 -10,10
D 10,-10 -1,-1
0
0.2
0.4
0.6
0.8
1
1 2 3 4 5 6P
ropo
rtio
n C
Blocks of 50 trials
0
0.2
0.4
0.6
0.8
1
1 2 3 4 5 6
Pro
port
ion
C
Blocks of 50 trials
Fixed
Random
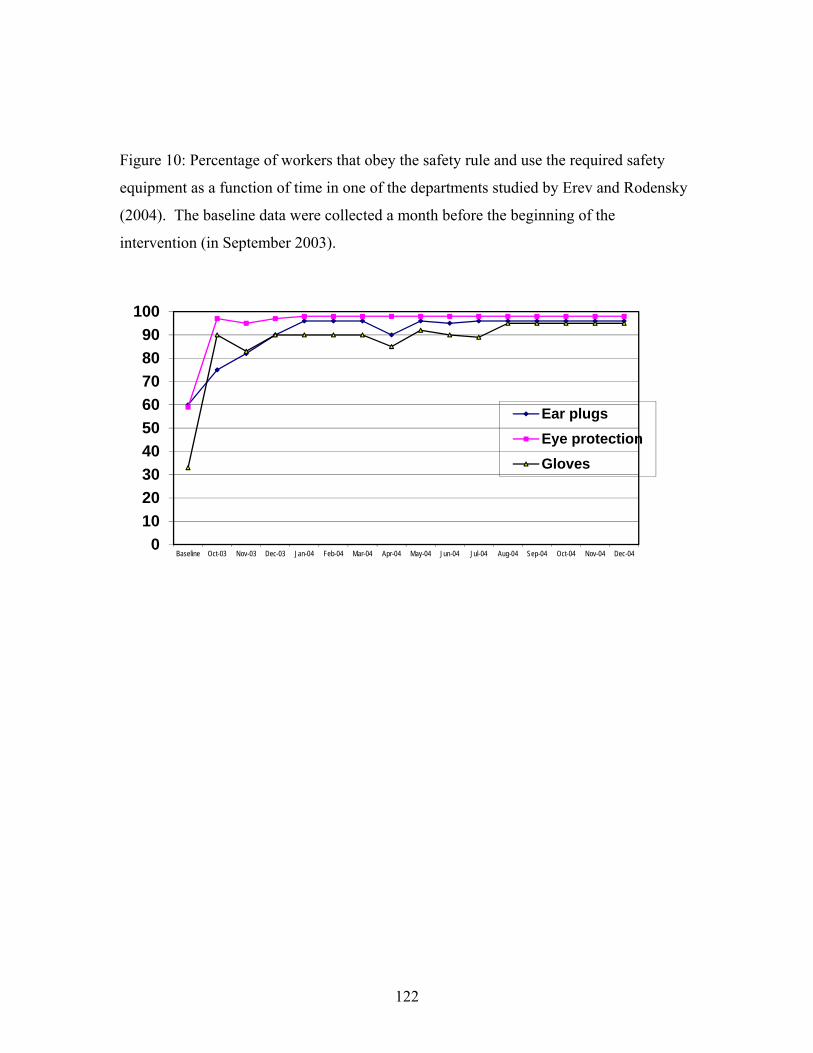
122
Figure 10: Percentage of workers that obey the safety rule and use the required safety
equipment as a function of time in one of the departments studied by Erev and Rodensky
(2004). The baseline data were collected a month before the beginning of the
intervention (in September 2003).
0
10
20
30
40
50
60
70
80
90
100
Baseline Oct-03 Nov-03 Dec-03 Jan-04 Feb-04 Mar-04 Apr-04 May-04 Jun-04 Jul-04 Aug-04 Sep-04 Oct-04 Nov-04 Dec-04
Ear plugs
Eye protection
Gloves

Figur
seaso
used
re 11: Bed n
onally adjust
with permis
nights in tour
ted average (
sion).
rist hotels in
(dashed line)
123
n Israel from
) and trend b
m January 199
by 1,000 bed
97 to Augus
d nights (ICB
t 2002:
BS, 2002b.