learning analytics & ai go to school - simon buckingham...
TRANSCRIPT

Simon Buckingham ShumProfessor of Learning InformaticsDirector, Connected Intelligence CentreUniversity of Technology Sydney@sbuckshum • http://utscic.edu.auhttp://Simon.BuckinghamShum.net
Learning Analytics & AI go to School
Data in Schools Symposium, University of Technology Sydney • 9th Nov 2018#UTSDatainSchools

https:/
/twitter.com
/Wisw
ijzer2/status/414
0554
7245
1575
808
2
“Note: check the huge difference between
knowing and measuring…”

Microstudent activity traces during learning
Analytics from ed-tech used by students
Mesoinstitution-wide demographics and formal outcomes
NAPLANHSCStudent DB
Analytics in education
Macrostate/national/international comparisons/league tables
e.g.PISACESE
Buckingham Shum, S. (2012). Learning Analytics. UNESCO IITE Policy Brief. http://bit.ly/LearningAnalytics

Microstudent activity traces during learning
Analytics in education
Mesoinstitution-wide demographics and formal outcomes
Macrostate/national/international comparisons/league tables
e.g.PISACESE
NAPLANHSCStudent DB
Analytics from ed-tech used by students

5
A local example: Does NAPLAN predict HSC?
Yr 7: NAPLAN Numeracy
Yr 12: HSC Maths
Mount St. Benedict school & UTS (Dorotea Baljevic, Master of Data Science & Innovation)Rank of student path from Year 7 to Year 12

6
A local example: Does NAPLAN predict HSC?Mount St. Benedict school & UTS (Dorotea Baljevic, Master of Data Science & Innovation)Rank of student path from Year 7 to Year 12
Yr 7: NAPLAN Numeracy
Yr 12: HSC Maths

7
NAPLAN Numeracy did predict HSC MathematicsMount St. Benedict school & UTS (Dorotea Baljevic, Master of Data Science & Innovation)Rank of student path from Year 7 to Year 12
Key Finding
Overall rankings do not seem to cross over and students who are high performers continue to rank highly, and vice versa, for Maths
N.B. it seems that students move to other schools post Year 9
Yr 7: NAPLAN Numeracy
Yr 12: HSC Maths

NAPLAN Literature did NOT predict HSC EnglishMount St. Benedict school & UTS (Dorotea Baljevic, Master of Data Science & Innovation)Rank of student path from Year 7 to Year 12
Yr 7: NAPLAN Literacy
Yr 12: HSC English

Would it help you to know that (statistically) a student is predicted to do poorly (or well) in HSC Maths? What would you do differently?
Is this intelligence actionable?
Student 1 Example
Year 7: 7th percentile Year 12: 4th percentile
Student 2 Example
Year 7: Top (1st) percentile Year 12: Last (10th) percentile
What if they’re ‘atypical’?
e.g.
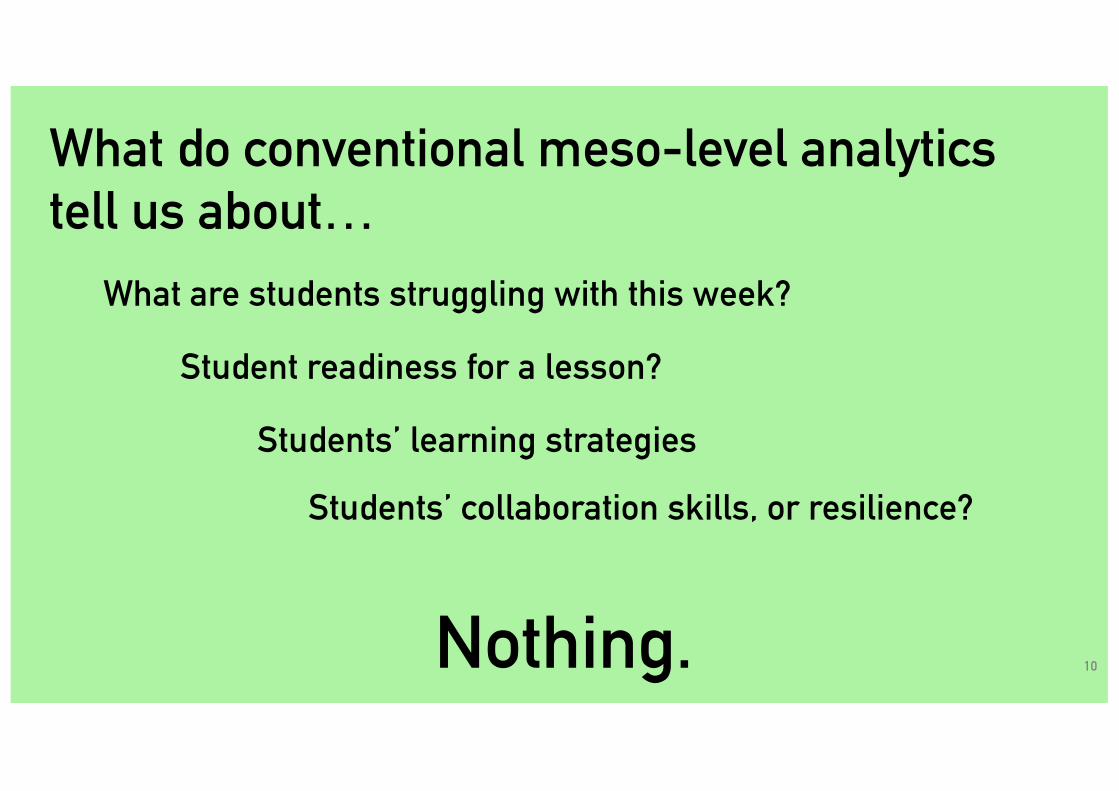
What do conventional meso-level analytics tell us about…
10
What are students struggling with this week?
Student readiness for a lesson?
Students’ learning strategies
Nothing.
Students’ collaboration skills, or resilience?

Microstudent activity traces during learning
Analytics in education
Mesoinstitution-wide demographics and formal outcomes
Macrostate/national/international comparisons/league tables
e.g.PISACESE
NAPLANHSCStudent DB
Analytics from ed-tech used by students

Analytics in education

13
Every educational product now comes with a “dashboard”…= “we can count stuff”. Does this tell us much about learning?

14
What is Learning Analytics?
Learningstudent engagement
teaching practicecurriculum design
instructional designpedagogy
assessmentepistemology
…
Analyticsdata
statisticsclassification
machine learningtext processing
visualisationpredictive models
…this is not a straightforward dialogue!
15
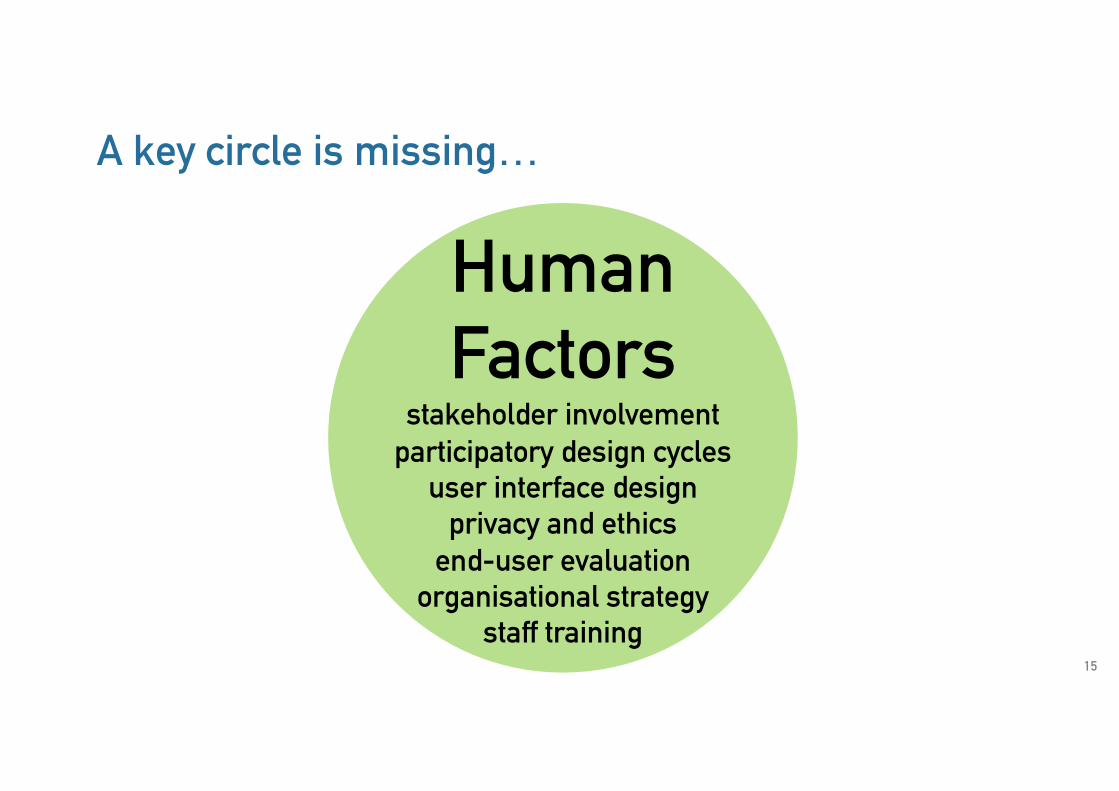
A key circle is missing…
HumanFactors
stakeholder involvementparticipatory design cycles
user interface designprivacy and ethics
end-user evaluationorganisational strategy
staff training

16
Learning Analytics: A Human-Centred Design Discipline
Learning Analytics
Human Factors

What’s really new about Learning Analytics?
17https://www.aisnsw.edu.au/EducationalResearch/Documents/Infographics/What%20Is%20Educational%20Data%20-%20Infographic%202017.pdf
learners?

What’s really new about Learning Analytics?
“The potential of learning analytics is arguably far moresignificant than as an enabler of data-intensive educationalresearch, exciting as this is.The new possibility is that educators and learners — thestakeholders who constitute the learning system studied for solong by researchers — are for the first time able to see theirown processes and progress rendered in ways that until nowwere the preserve of researchers outside the system.” (p.17)
18Knight S. & Buckingham Shum, S. (2017). Theory and Learning Analytics. Handbook of Learning Analytics (Chapter 1). Society for Learning Analytics Research. https://solaresearch.org/hla-17

19
Learning Analytics
Human Factors
So where does Artificial Intelligence fit in?
AutomatedFeedback& Tasks
Sensing beyond the keyboard

20
So where does Artificial Intelligence fit in?
AInow the computer has greater agency
e.g.“adaptive learning”: tune the taskto each learner’s current ability
give personalised feedback based on the learner’s progress
chatbots/avatars
AInow the computer can
sense more of the human worlde.g.
speech, gestures, posture, physiology, facial expression…
+ mobile and sensor data:use of physical tools,
location, other apps…

mastering core mathematicsthrough practice on increasingly
challenging exampleswith automated feedback
and human coaching
good evidence: human + AI tutorsperform better than human alone
21
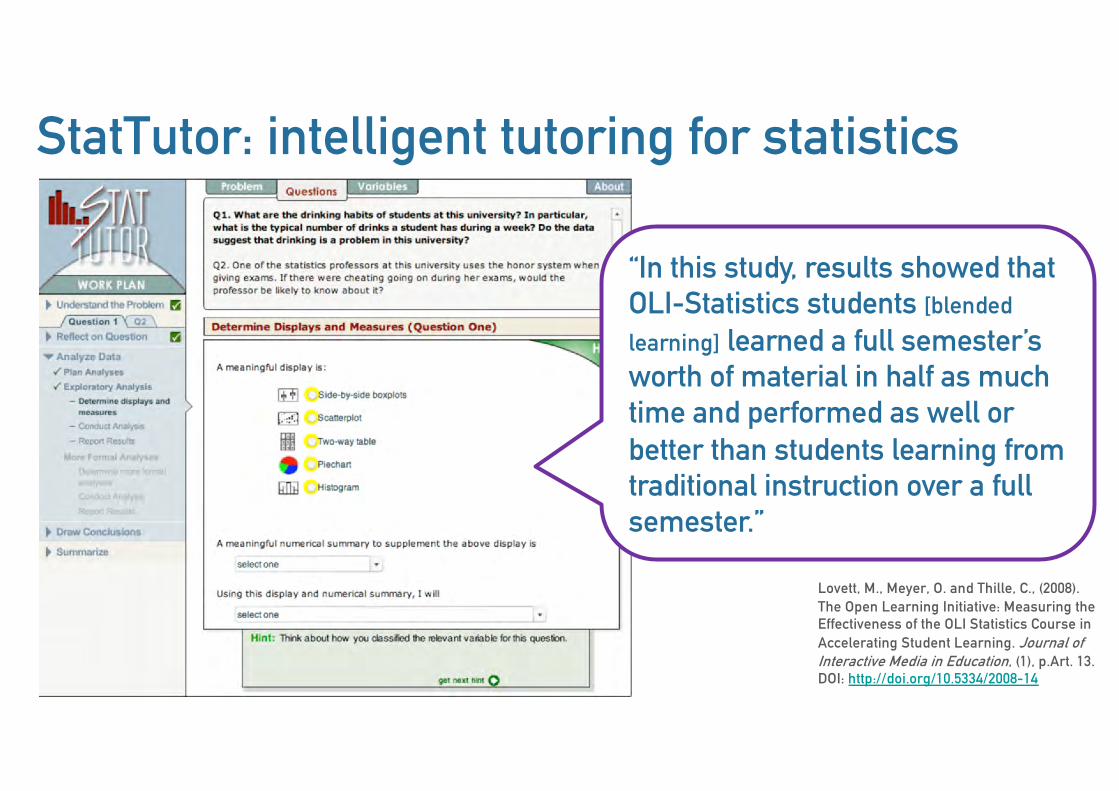
StatTutor: intelligent tutoring for statistics
Lovett, M., Meyer, O. and Thille, C., (2008). The Open Learning Initiative: Measuring the Effectiveness of the OLI Statistics Course in Accelerating Student Learning. Journal of Interactive Media in Education, (1), p.Art. 13. DOI: http://doi.org/10.5334/2008-14
“In this study, results showed that OLI-Statistics students [blended learning] learned a full semester’s worth of material in half as much time and performed as well or better than students learning from traditional instruction over a full semester.”

ASSISTments for Homework Support Projecthttps://www.assistments.org
Roschelle, J., Feng, M., Murphy, R. F., & Mason, C. A. (2016). Online Mathematics Homework Increases Student Achievement. AERA Open, 2, (4), 1-12. http://doi.org/10.1177/2332858416673968
Neil Heffernan’s R&D program:http://www.neilheffernan.net
“I am proud to share the reporting on an efficacy trial conducted by SRI of ASSISTments. These results …showed ASSISTments caused 75% more learning than is typical in a year.”
http://www.aboutus.assistments.org/homework-immediate-feedback---1-year-study.php

Percent correct per problem. This data identifies class weakness
helping you drive your instruction.
76% of the incorrect answers were B. The percent will be in
red if it is over 50%.
Common Wrong Answers present clues
as to why students answer incorrectly.
ASSISTments for Homework Support Project

ASSISTments for Homework Support Project
http://www.aboutus.assistments.org/getting-started-textbook.php
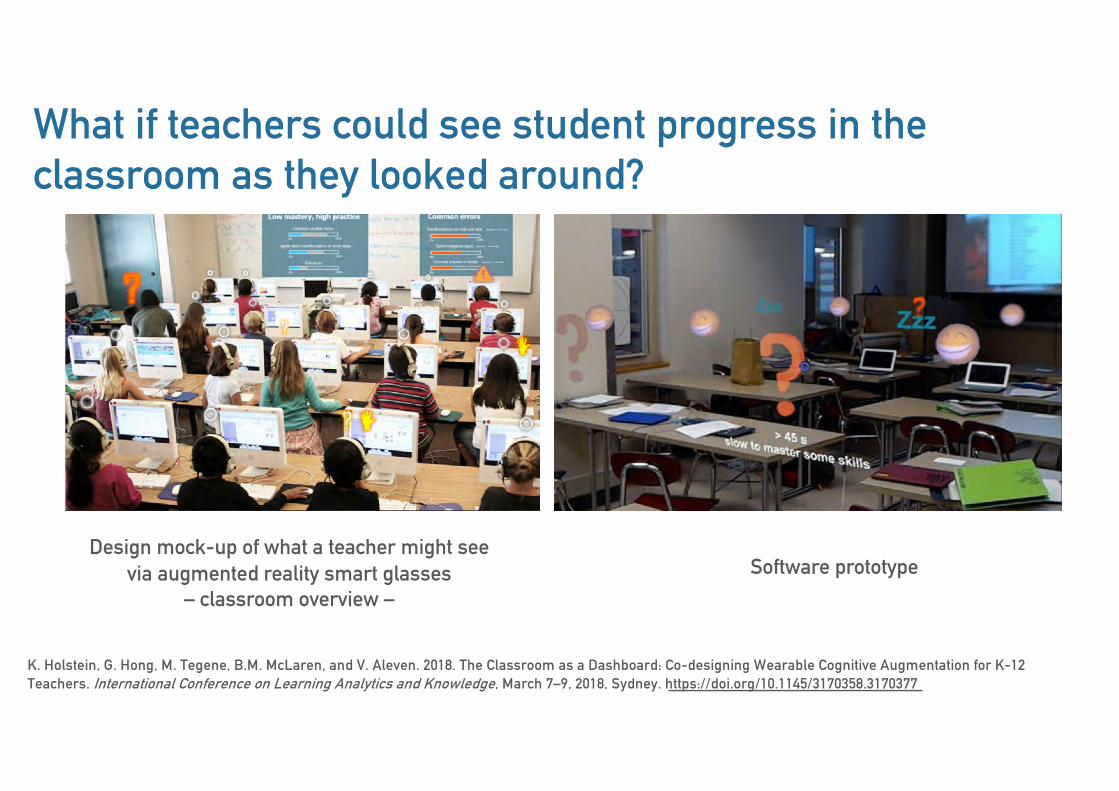
What if teachers could see student progress in the classroom as they looked around?
K. Holstein, G. Hong, M. Tegene, B.M. McLaren, and V. Aleven. 2018. The Classroom as a Dashboard: Co-designing Wearable Cognitive Augmentation for K-12 Teachers. International Conference on Learning Analytics and Knowledge, March 7–9, 2018, Sydney. https://doi.org/10.1145/3170358.3170377
Design mock-up of what a teacher might seevia augmented reality smart glasses
– classroom overview –Software prototype

What if teachers could see student progress in the classroom as they looked around?
K. Holstein, G. Hong, M. Tegene, B.M. McLaren, and V. Aleven. 2018. The Classroom as a Dashboard: Co-designing Wearable Cognitive Augmentation for K-12 Teachers. International Conference on Learning Analytics and Knowledge, March 7–9, 2018, Sydney. https://doi.org/10.1145/3170358.3170377
Design mock-up of what a teacher might seevia augmented reality smart glasses
– focus on a student –Software prototype

but adaptive tutors are expensiveto develop, and restricted to subjects in which the level of
mastery can be modelledhence the STEM domination in this field
– there are unambiguously correct answers, and huge demand28

can analytics help to track student qualities like communication skills, practical skills,
values, critical thinking, creativity?
29

How can we shift assessment from Grade Focus to understanding what it means?
68%Credit
Categorise assessment criteria to link to a range of attributes / capabilities to spread the single mark
Thompson, D.G. (2016). Marks should not be the focus of assessment— but how can change be achieved? Journal of Learning Analytics, vol. 3, no. 2, pp. 193-212. https://doi.org/10.18608/jla.2016.32.9

Darrall Thompson (UTS) and the REVIEW team at Liverpool Boys High School
http://academ.com.au/review

http://academ.com.au/review
Students self-assess, and then get to see how well their evaluative judgement is developing –against their actual grade
student’s self-assessment
teacher’sassessment
class averageoptional student task comment
optional student overall comment
final grade calculated from the above grades

can analytics help to cultivate student qualities like self-regulation, agency, curiosity,
resilience…?
33

34
Assessing learning dispositions: Crick Learning for Resilient Agency survey (CLARA)
Deakin Crick, R., Huang, S., Ahmed Shafi, A. and Goldspink, C. (2015). Developing Resilient Agency in Learning: The Internal Structure of Learning Power. British Journal of Educational Studies: 62, (2), 121-160. http://dx.doi.org/10.1080/00071005.2015.1006574
https://utscic.edu.au/tools/clara • http://clara.learningemergence.com

Immediate visual analytic generated by CLARAFeedback to Stimulate Self-Directed Change
A framework for reflection and coaching
Survey
Deakin Crick, R., Huang, S., Ahmed Shafi, A. and Goldspink, C. (2015). Developing Resilient Agency in Learning: The Internal Structure of Learning Power. British Journal of Educational Studies: 62, (2), 121-160. http://dx.doi.org/10.1080/00071005.2015.1006574

Scaling CLARA in UTS
n=876 n=957
n=548 n=602
§ Approx. 3000 student profiles
§ For the 921 students with both pre-and post-subject profiles, there were significant positive changes on all 8 dimensions.
§ We can also derive through cluster analysis significantly different cohort profiles: 4 examples
§ Next step: explore the relationships of these self-reported profiles to student outcomes
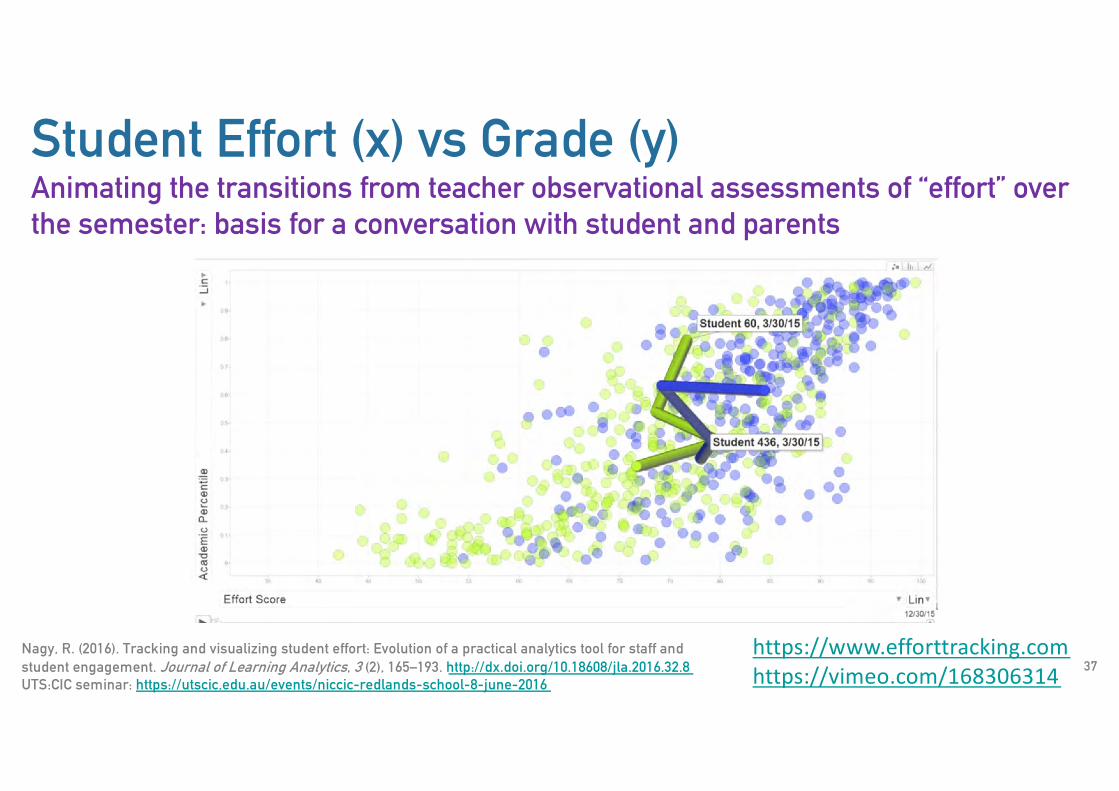
Student Effort (x) vs Grade (y) Animating the transitions from teacher observational assessments of “effort” over the semester: basis for a conversation with student and parents
37Nagy, R. (2016). Tracking and visualizing student effort: Evolution of a practical analytics tool for staff and student engagement. Journal of Learning Analytics, 3 (2), 165–193. http://dx.doi.org/10.18608/jla.2016.32.8UTS:CIC seminar: https://utscic.edu.au/events/niccic-redlands-school-8-june-2016
https://www.efforttracking.comhttps://vimeo.com/168306314
Learning Analytics for 21st Century Competencies. (Eds.) Buckingham Shum S. & Deakin Crick, R. (2016). Journal of Learning Analytics (Special Section), 3(2), pp. 6-212.http://dx.doi.org/10.18608/jla.2016.32.2
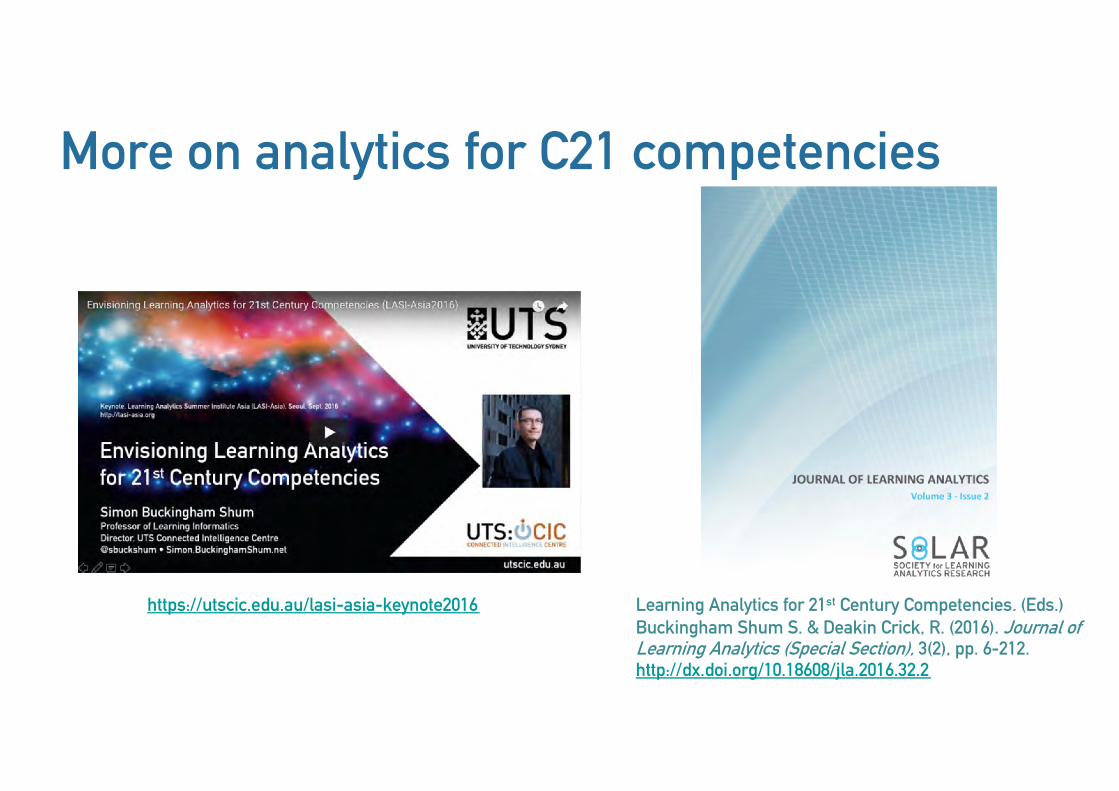
More on analytics for C21 competencies
https://utscic.edu.au/lasi-asia-keynote2016

“from clicks to constructs”
how exactly do we bridge from system logs
to educational qualities?
39

40
From clicks to constructs in MOOCs
Defining a C21 capability of
Crowd-Sourced Learning(Part of a larger map)
Milligan, S. and Griffin, P. (2016). Understanding learning and learning design in MOOCs: A measurement-based interpretation. Journal of Learning Analytics, 3(2), 88– 115. http://dx.doi.org/10.18608/jla.2016.32.5

41
From clicks to constructs in MOOCs
Defining a C21 capability of
Crowd-Sourced Learning(Part of a larger map)
Milligan, S. and Griffin, P. (2016). Understanding learning and learning design in MOOCs: A measurement-based interpretation. Journal of Learning Analytics, 3(2), 88– 115. http://dx.doi.org/10.18608/jla.2016.32.5

42
From clicks to constructs in MOOCs
Defining a C21 capability of
Crowd-Sourced Learning(Part of a larger map)
Milligan, S. and Griffin, P. (2016). Understanding learning and learning design in MOOCs: A measurement-based interpretation. Journal of Learning Analytics, 3(2), 88– 115. http://dx.doi.org/10.18608/jla.2016.32.5

43
From clicks to constructs in MOOCs
Defining a C21 capability of
Crowd-Sourced Learning(Part of a larger map)
Milligan, S. and Griffin, P. (2016). Understanding learning and learning design in MOOCs: A measurement-based interpretation. Journal of Learning Analytics, 3(2), 88– 115. http://dx.doi.org/10.18608/jla.2016.32.5

There’s far more to learning than having students tethered to screens
44

A field exercise…
45

Posture analysis of fieldwork students
46Masaya Okada and Masahiro Tada. 2014. Formative assessment method of real-world learning by integrating heterogeneous elements of behavior, knowledge, and the environment. Proc. 4th Int. Conf. on Learning Analytics and Knowledge. ACM, New York, NY, USA, 1-10. DOI= http://dx.doi.org/10.1145/2567574.2567579

Multimodal student data from simulations

Automated visualisation of nursing team activityPatient’s state changes
3 nursing roles
Use of a device
Administer medication

writing as a window into the student’s mind
crafting arguments…reflecting deeply on experiences…
49

Improving research writing
1. Establish a research territory2. Establish a niche3. Occupy the niche

Improving research writing
1. Establish a research territory2. Establish a niche3. Occupy the niche

Improving research writing
1. Establish a research territory2. Establish a niche3. Occupy the niche

AcaWriter feedback – an abstract with several moves

Automated formative feedback on persuasive, evidence-based writing (Law students)
Knight, S., Buckingham Shum, S., Ryan, P., Sándor, Á. and Wang, X. (2018). Designing Academic Writing Analytics for Civil Law Student Self-Assessment. International Journal of Artificial Intelligence in Education, 28, (1), 1-28. DOI: https://doi.org/10.1007/s40593-016-0121-0
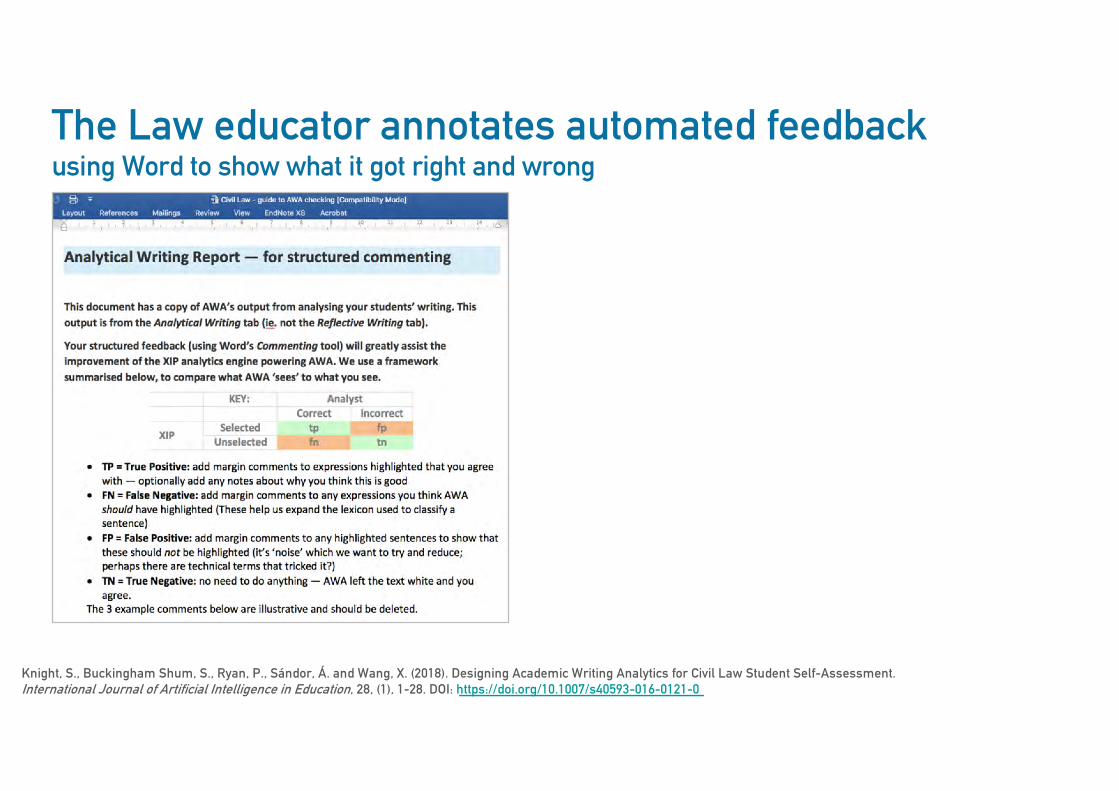
The Law educator annotates automated feedback using Word to show what it got right and wrong
Knight, S., Buckingham Shum, S., Ryan, P., Sándor, Á. and Wang, X. (2018). Designing Academic Writing Analytics for Civil Law Student Self-Assessment. International Journal of Artificial Intelligence in Education, 28, (1), 1-28. DOI: https://doi.org/10.1007/s40593-016-0121-0

Knight, S., Buckingham Shum, S., Ryan, P., Sándor, Á. and Wang, X. (2018). Designing Academic Writing Analytics for Civil Law Student Self-Assessment. International Journal of Artificial Intelligence in Education, 28, (1), 1-28. DOI: https://doi.org/10.1007/s40593-016-0121-0
The Law educator annotates automated feedback using Word to show what it got right and wrong

Align the assessment rubric with the textual features (i.e. rhetorical moves) that the tool can identify
Knight, S., Buckingham Shum, S., Ryan, P., Sándor, Á. and Wang, X. (2018). Designing Academic Writing Analytics for Civil Law Student Self-Assessment. International Journal of Artificial Intelligence in Education, 28, (1), 1-28. DOI: https://doi.org/10.1007/s40593-016-0121-0

Evaluate with students: what worked well?
Knight, S., Buckingham Shum, S., Ryan, P., Sándor, Á. and Wang, X. (2018). Designing Academic Writing Analytics for Civil Law Student Self-Assessment. International Journal of Artificial Intelligence in Education, 28, (1), 1-28. DOI: https://doi.org/10.1007/s40593-016-0121-0
…but it was far from perfect: see the paper for detailed evaluation results

59
http://heta.io/resources/wawa-improve-sample-text-plus-peer-discussion-civil-law
Exemplar lesson plan using AcaWriter

AcaWriter formative feedback on reflective writing

Participatory prototyping builds trust in the NLP
http://heta.io/how-can-writing-analytics-researchers-rapidly-codesign-feedback-with-educators
Learning Analytics researchers work with academics (3 hour workshop)
Goal: calibrate the parser detecting affect in reflective writing, working through sample texts
Rapid prototyping with a Python notebook, then integrated into end-user tool for further testing

personalised feedbackto 800+ students/week
(without needing an expensive intelligent tutoring system)
62

An academic’s feedback email to a student
Dear yyy,
I had another look at your homework assignments to see how you are going after the StuVac week.
It is quite worrying to see that you still don’t seem to be fully engaged in this subject (2.25/48) and follow the material that we have been covered so far. You are also very much behind our problem solving exercises and homework assignments.
It will be very difficult for you to catch with all the material if you don’t put in more work right now. If you don’t attend UPASS session already, please do so asap.
Kind regards,
xxxSubject Coordinator
One of >800 unique emails, sent each week(Acknowledgement: Jurgen Schulte, Science)
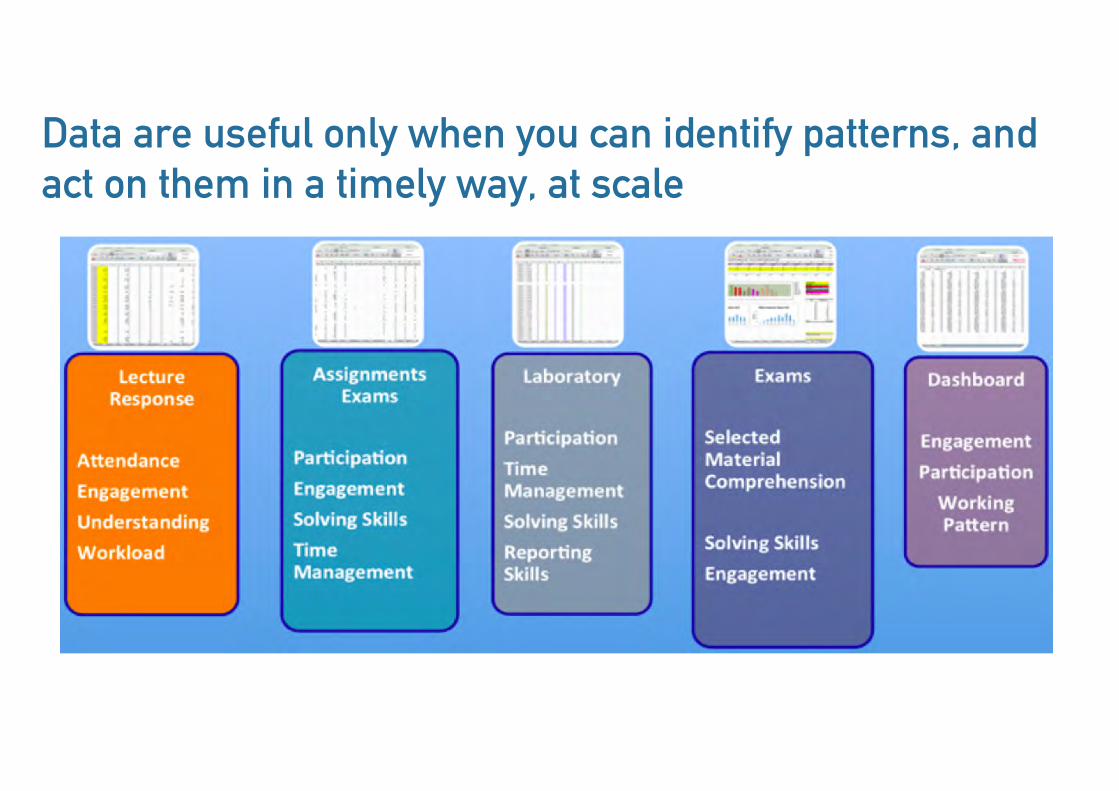
Data are useful only when you can identify patterns, and act on them in a timely way, at scale
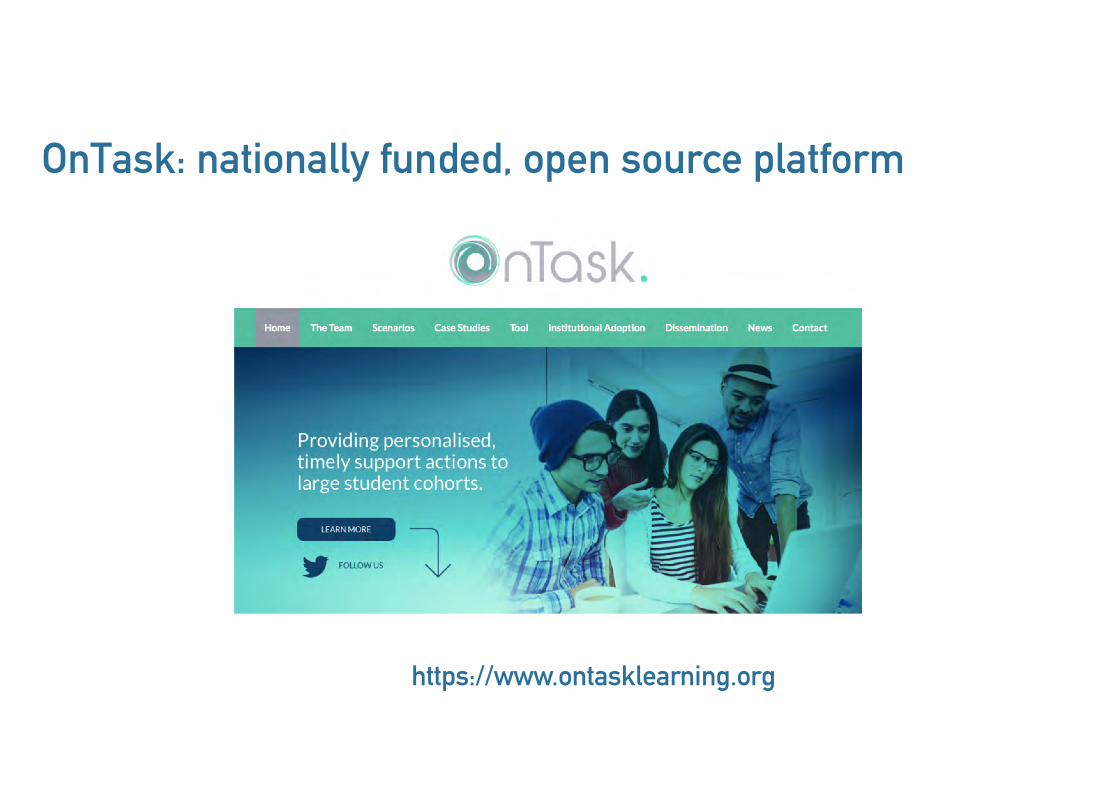
OnTask: nationally funded, open source platform
https://www.ontasklearning.org

Compose your email, with different paragraphs tuned to the needs of different student groups
A visual editor helps you define which students will receive which kinds of encouraging/challenging feedback, e.g.
Students who passed all the questions first time vs. those who struggled
Students who log in very late to cram the resources prior to a practical, vs. those who plan well
Example impact of personalised messaging such as this: Madeline Huberth, Patricia Chen, Jared Tritz, and Timothy A. McKay (2015). Computer-Tailored Student Support in Introductory Physics. PloS ONE 10, no. 9 (Sep 9, 2015). https://doi.org/10.1371/journal.pone.0137001

trustSchools and universities are outsourcing their ‘core business’ — e.g. resource selection, feedback and
grading — to algorithms
68

Growing public literacy around the business and politics of data / algorithms / AI is to be welcomed
69
70
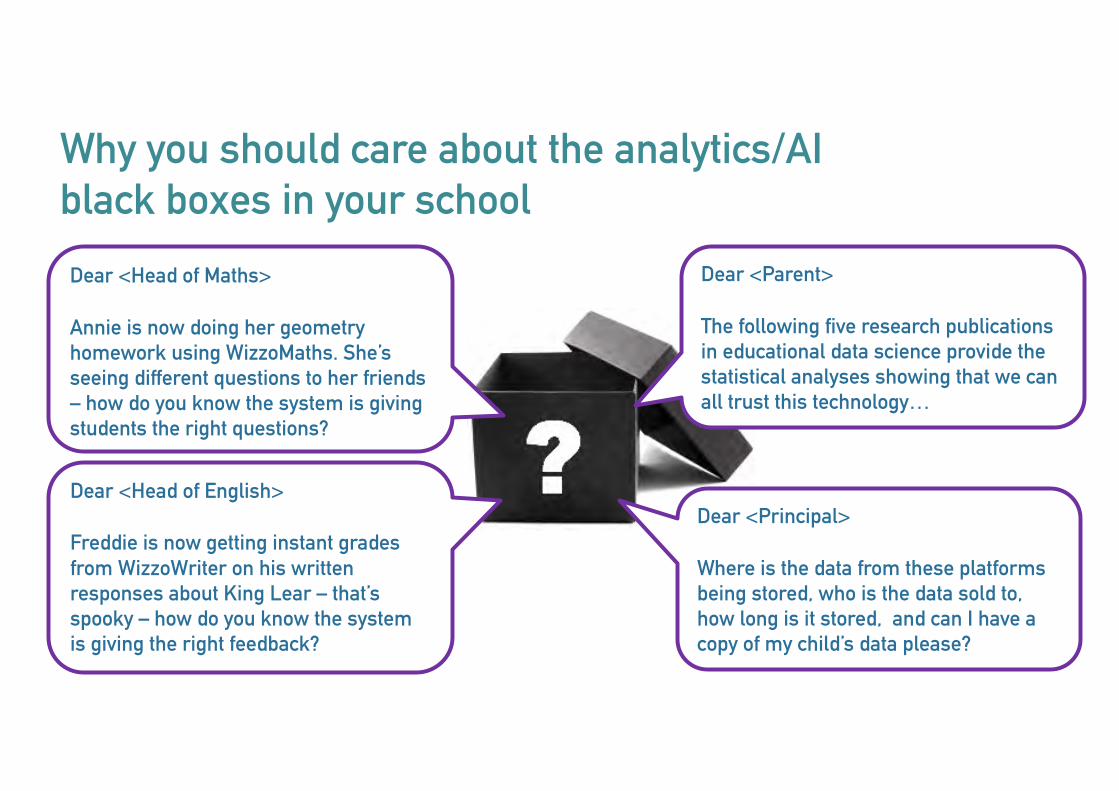
Why you should care about the analytics/AI black boxes in your schoolDear <Head of Maths>
Annie is now doing her geometry homework using WizzoMaths. She’s seeing different questions to her friends – how do you know the system is giving students the right questions?
Dear <Parent>
The following five research publications in educational data science provide the statistical analyses showing that we can all trust this technology…
Dear <Head of English>
Freddie is now getting instant grades from WizzoWriter on his written responses about King Lear – that’s spooky – how do you know the system is giving the right feedback?
Dear <Principal>
Where is the data from these platforms being stored, who is the data sold to, how long is it stored, and can I have a copy of my child’s data please?

Algorithmic accountability in learning?
71http://simon.buckinghamshum.net/2016/03/algorithmic-accountability-for-learning-analytics

to go deeper…
72

60+ school leaders + ed-tech startups in Sydney this March at LAK18http://lak18.solaresearch.org
73Video, slides, briefings: https://latte-analytics.sydney.edu.au/school

74
AI in Education (esp. Schools)
https://www.ucl-ioe-press.com/books/education-and-technology/machine-learning-and-human-intelligence
Great introduction for educators to what AI is (and is not)
Clarity on what makes human intelligence distinctive (for now…)
Examples of how AI can be used to augment teaching practice, not automate it

https://www.routledge.com/Learning-Analytics-Goes-to-School-A-Collaborative-Approach-to-Improving/Krumm-Means-Bienkowski/p/book/9781138121836 https://www.routledge.com/Learning-Analytics-in-the-Classroom-Translating-Learning-Analytics-Research/Lodge-Horvath-Corrin/p/book/9780815362128
Analytics experts and educators
co-designing school improvements
and the data to serve as evidence
Translating the implications of
learning analytics advances for
teachers
Learning Analytics in Schools

76
Design analytics that close the feedback loopthis is the revolutionary shift • learner and teacher agency + agility
Tech alone will fail embed new tools in meaningful learning activities, aligned with assessment
Build your capacity to design analytics shape data to meet your needs • learn how to critique analytics
Understand what Data, Analytics and AI can + can’t do what used to be ‘distinctively human’ is changing
but human intelligence remains vital – for both staff and students