learner outcome measures for further education and adult
TRANSCRIPT
Statistician: Rachel Lloyd 029 2082 5067 [email protected]
Enquiries from the press: 029 2089 8099 Public enquiries : 029 2082 5050 Twitter: @statisticswales
Learner Outcome Measures for Further Education and Adult Community Learning:
2015/16
2 February 2017
SFR 9/2017
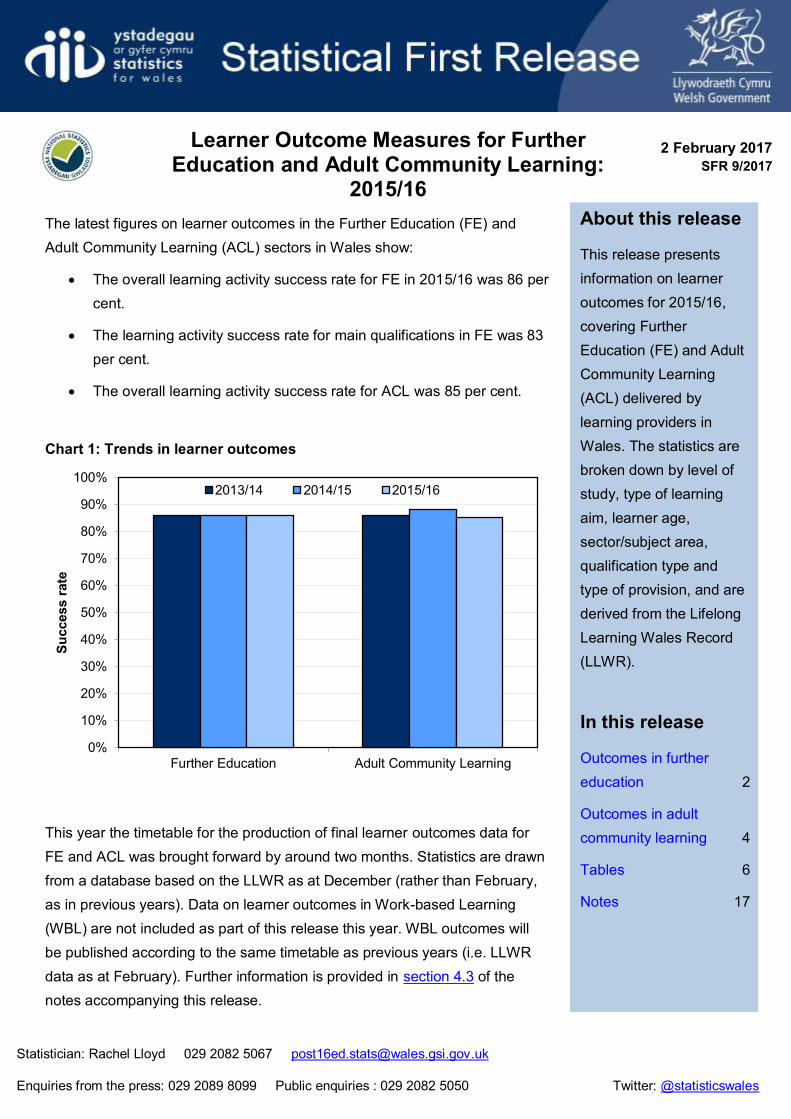
The latest figures on learner outcomes in the Further Education (FE) and
Adult Community Learning (ACL) sectors in Wales show:
The overall learning activity success rate for FE in 2015/16 was 86 per
cent.
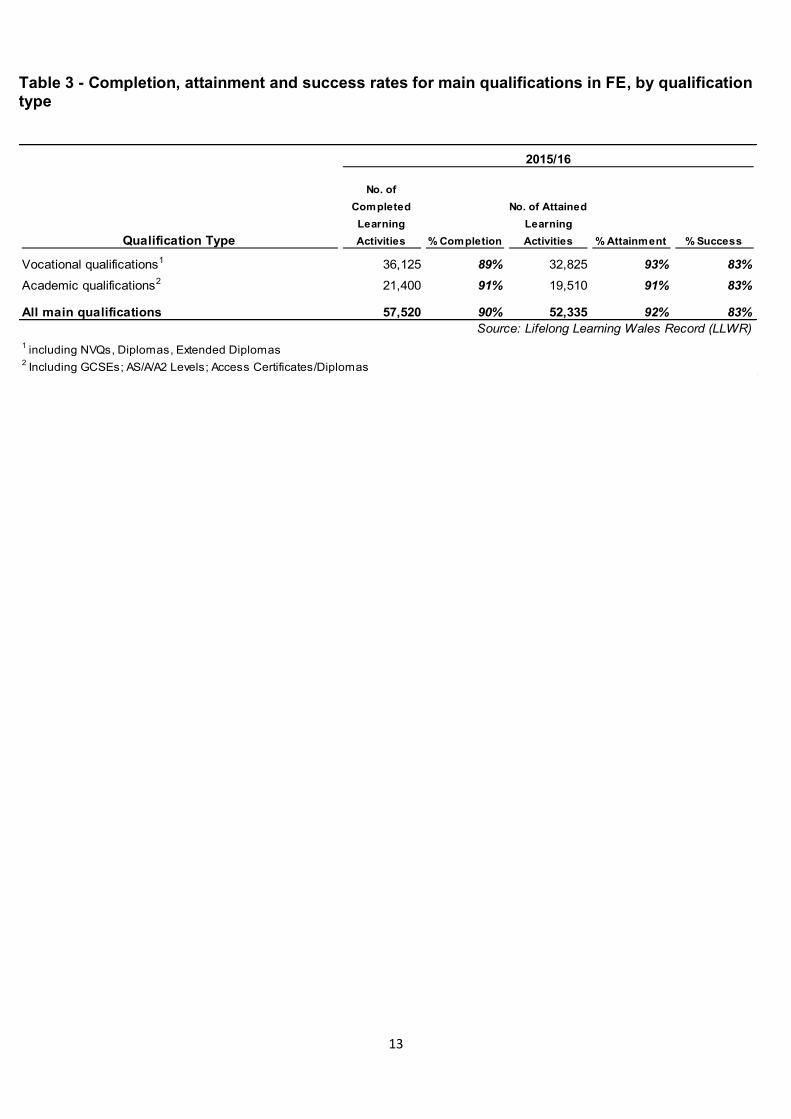
The learning activity success rate for main qualifications in FE was 83
per cent.
The overall learning activity success rate for ACL was 85 per cent.
Chart 1: Trends in learner outcomes
This year the timetable for the production of final learner outcomes data for
FE and ACL was brought forward by around two months. Statistics are drawn
from a database based on the LLWR as at December (rather than February,
as in previous years). Data on learner outcomes in Work-based Learning
(WBL) are not included as part of this release this year. WBL outcomes will
be published according to the same timetable as previous years (i.e. LLWR
data as at February). Further information is provided in section 4.3 of the
notes accompanying this release.
0%
10%
20%
30%
40%
50%
60%
70%
80%
90%
100%
Further Education Adult Community Learning
Su
ccess r
ate
2013/14 2014/15 2015/16
About this release
This release presents
information on learner
outcomes for 2015/16,
covering Further
Education (FE) and Adult
Community Learning
(ACL) delivered by
learning providers in
Wales. The statistics are
broken down by level of
study, type of learning
aim, learner age,
sector/subject area,
qualification type and
type of provision, and are
derived from the Lifelong
Learning Wales Record
(LLWR).
In this release
Outcomes in further
education 2
Outcomes in adult
community learning 4
Tables 6
Notes 17

2
Outcomes in further education
Across all FE programmes in 2015/16, 92 per cent of learning activities were completed and of those
activities with an assessable outcome, 94 per cent were attained. Overall, 86 per cent of learning
activities were successfully completed and attained, the same rate as in 2014/15.
In 2014/15 a new Post-16 Planning and Funding Framework was introduced, based on programmes of
learning designed to support progression to further learning or employment. Each programme
comprises one or more main qualifications (such as A Levels or a BTEC Diploma), together with
additional qualifications which support the development of essential skills and help ensure that the
individual learner’s needs are met. Last year, we published completion, attainment and success
measures for main qualifications for the first time. For learners on full-time programmes, 83 per cent of
main qualifications were successfully completed and attained in 2015/16, an increase of one percentage
point on 2014/15. The success rate for main qualifications is 3 percentage points lower than the success
rate for all qualifications. The new Welsh Baccalaureate and Skills Challenge Certificate qualifications
introduced in September 2015 have been excluded from the base cohort of learning activities in this
release. Furthermore, the Essential Skills Wales suite of qualifications introduced in September 2015
has also been excluded. Further information on both of these exclusions is provided in section 2.2 of the
notes accompanying this release.
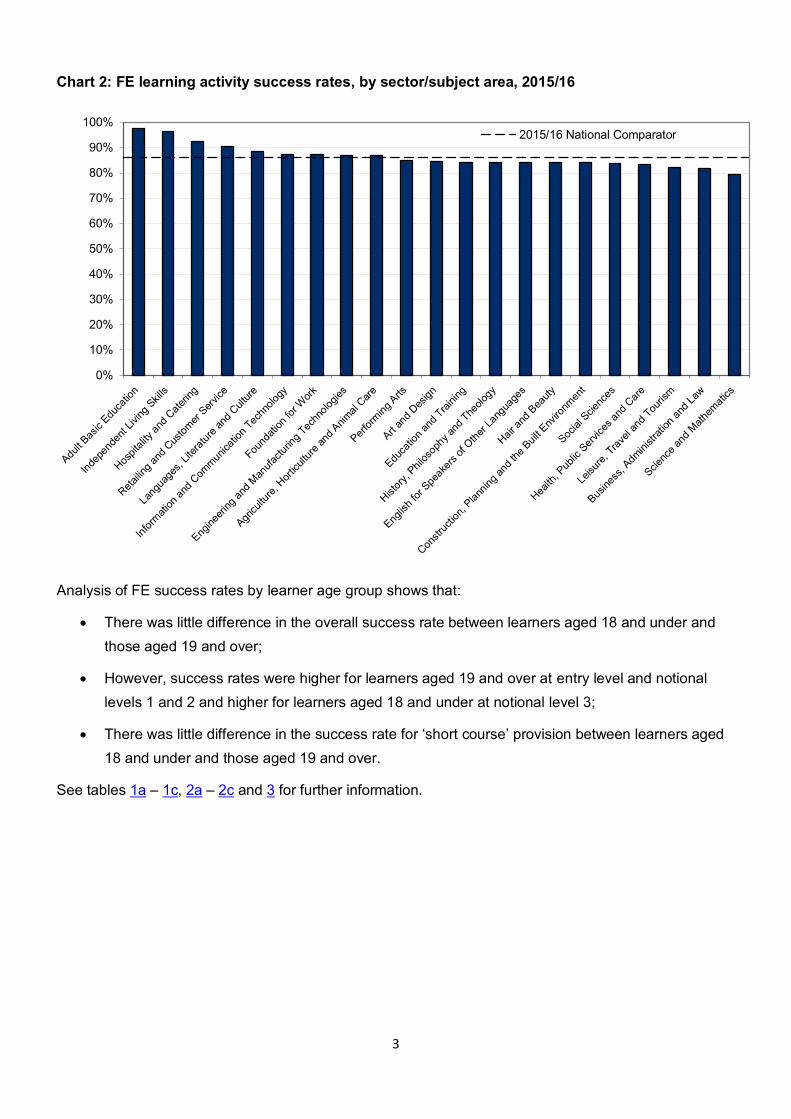
Analysis of FE success rates by sector/subject area (Chart 2) shows that:
Success rates were highest in the areas of Adult Basic Education; Independent Living Skills;
Hospitality and Catering; Retailing and Customer Service; and Languages, Literature and
Culture.
Success rates were lowest in the areas of Science and Mathematics; Business, Administration
and Law; Leisure, Travel and Tourism; Health, Public Services and Care; and Social Sciences.
3
Chart 2: FE learning activity success rates, by sector/subject area, 2015/16
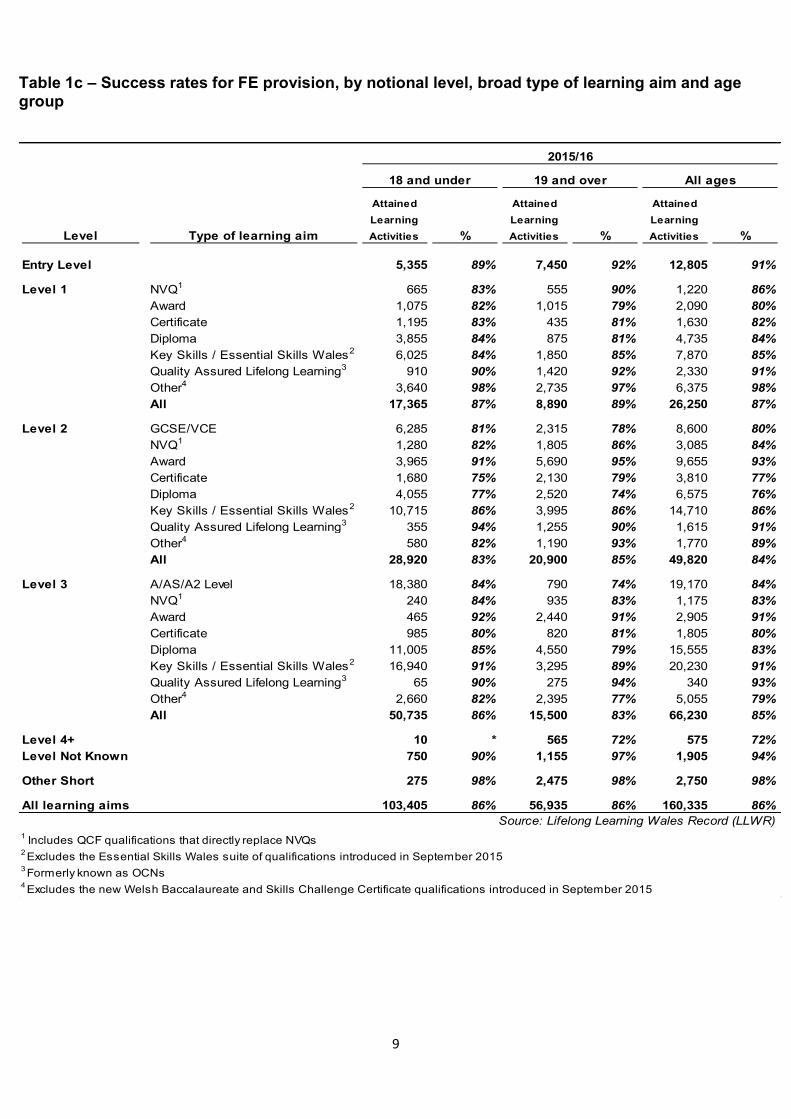
Analysis of FE success rates by learner age group shows that:
There was little difference in the overall success rate between learners aged 18 and under and
those aged 19 and over;
However, success rates were higher for learners aged 19 and over at entry level and notional
levels 1 and 2 and higher for learners aged 18 and under at notional level 3;
There was little difference in the success rate for ‘short course’ provision between learners aged
18 and under and those aged 19 and over.
See tables 1a – 1c, 2a – 2c and 3 for further information.
0%
10%
20%
30%
40%
50%
60%
70%
80%
90%
100%2015/16 National Comparator

4
Outcomes in adult community learning
For the purposes of this release, we have focussed on three distinct types of ACL provision:
ACL directly delivered by local authorities (LAs);
ACL delivered by LAs via a franchise arrangement with a further education (FE) institution; and
Other ACL delivered by FE institutions (this includes all provision delivered by Adult Learning
Wales).
Further information is provided in section 2.3.
The following chart shows that there was some variation across the different types of ACL provision for
all three learner outcome measures in 2015/16. Further analysis of the underlying data suggests that at
least some of this variation can be attributed to inconsistent approaches to the recording of LLWR data.
Furthermore, there are a number of known issues where certain ACL providers have failed to upload
either learning activity records or complete award records for existing learning activities to the LLWR in
time for the final statistical data freeze. This has impacted on the learner outcome measures presented
here. Further information is provided in section 4.2 of the notes accompanying this release. Given these
issues, caution should be exercised when making comparisons between the different types of ACL
provision and making year-on-year comparisons using the ACL learner outcome measures.
Whilst completion rates remained at a similar level to those seen in 2014/15 for both ACL directly
delivered by LAs and other ACL delivered by FEIs, both types of provision have seen a decrease in
attainment and success rates. For ACL directly delivered by LAs, attainment and success rates have
decreased by 7 and 5 percentage points, respectively. For other ACL delivered by FEIs, attainment and
success rates have both decreased by 4 percentage points. The completion rate for ACL delivered by
LAs via FEI franchise decreased by 3 percentage points since 2014/15 but attainment and success rates
increased by 7 and 4 percentage points, respectively.

5
Chart 3: ACL learner outcome measures, by type of provision, 2015/16
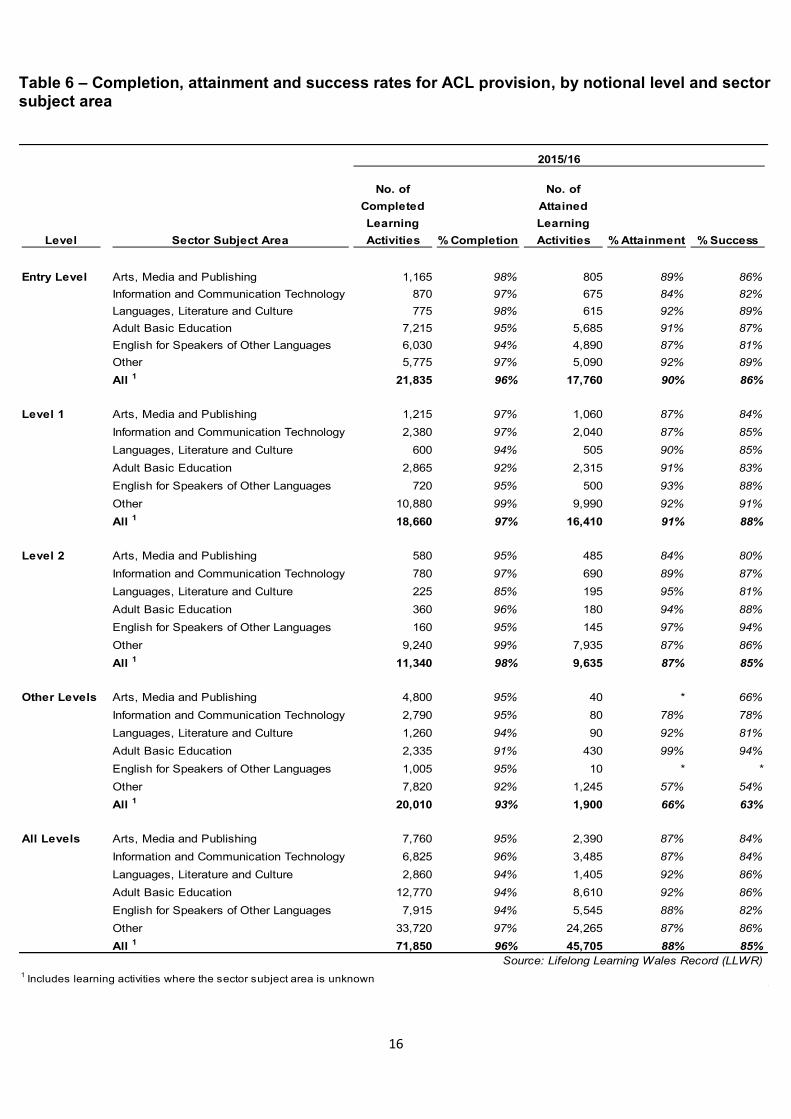
Analysis of learner outcome measures by level and subject (see tables) showed that:
Completion rates for provision directly delivered by local authorities were highest for entry level
learning aims. Completion rates for provision delivered via a FE institution franchise or other ACL
provision delivered by FE institutions were highest for level 2 learning aims;
Success rates for provision directly delivered by local authorities were highest for entry level
learning aims and lowest for learning aims at other levels (a large proportion of which includes
learning activities where the level is not known). Success rates for provision delivered via a FE
institution franchise were highest for learning aims at both entry level and level 1. Success rates
for other ACL provision delivered by FE institutions were highest for learning aims at level 1.
Success rates varied across subject areas. Aside from ‘Other’ subject area, the highest success
rates were in Adult Basic Education and Languages, Literature and Culture.
See tables 4, 5 and 6 for further information.
0%
10%
20%
30%
40%
50%
60%
70%
80%
90%
100%
Directly Delivered by LAs Delivered by LAs via FEIfranchise
Other ACL delivered by FEIs
% Completion % Attainment % Success
6
Tables
Tables 1a – 1c Completion, attainment and success rates for FE provision by notional level,
broad type of learning aim and age group
Tables 2a – 2c Completion, attainment and success rates for FE provision by sector/subject
area and age group
Table 3 Completion, attainment and success rates for main qualifications in FE by
qualification type
Table 4 Completion, attainment and success rates for ACL provision by type of provision
and notional level
Table 5 Completion, attainment and success rates for ACL provision by type of provision
and age group
Table 6 Completion, attainment and success rates for ACL provision by notional level
and sector/subject area
7
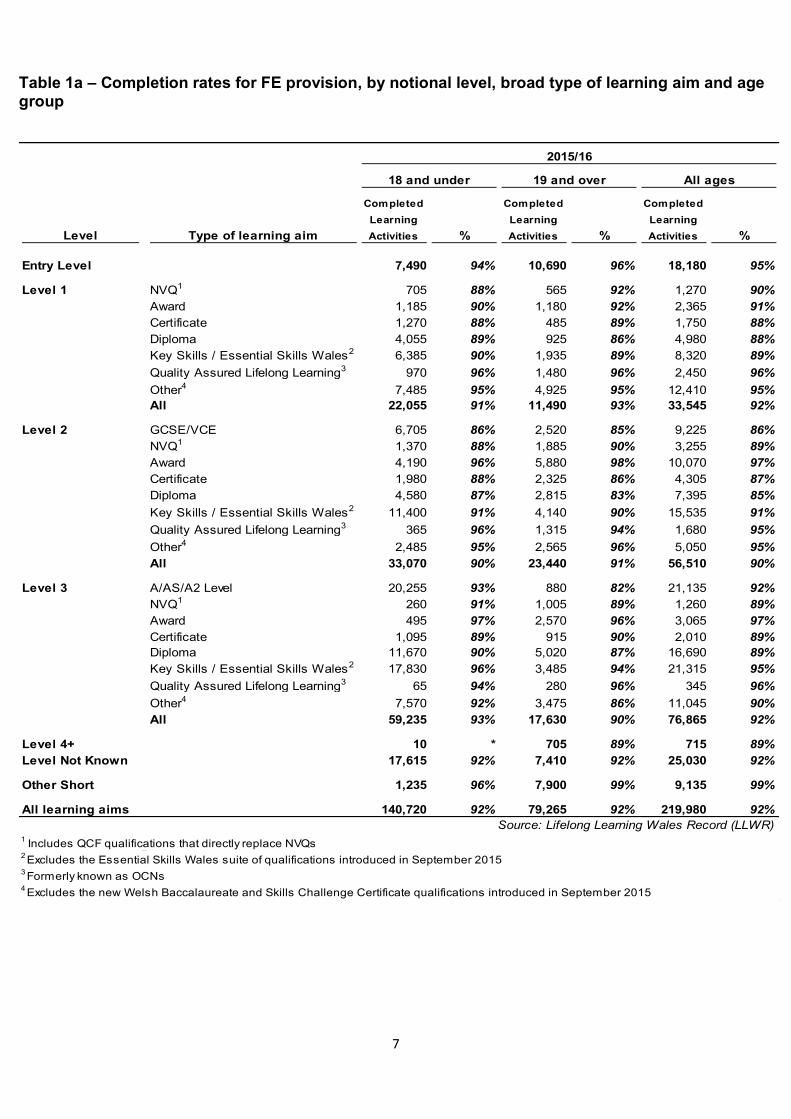
Table 1a – Completion rates for FE provision, by notional level, broad type of learning aim and age group
Completed
Learning
Activities %
Completed
Learning
Activities %
Completed
Learning
Activities %
Entry Level 7,490 94% 10,690 96% 18,180 95%
Level 1 NVQ1 705 88% 565 92% 1,270 90%
Award 1,185 90% 1,180 92% 2,365 91%
Certificate 1,270 88% 485 89% 1,750 88%
Diploma 4,055 89% 925 86% 4,980 88%
Key Skills / Essential Skills Wales2 6,385 90% 1,935 89% 8,320 89%
Quality Assured Lifelong Learning3 970 96% 1,480 96% 2,450 96%
Other4 7,485 95% 4,925 95% 12,410 95%
All 22,055 91% 11,490 93% 33,545 92%
Level 2 GCSE/VCE 6,705 86% 2,520 85% 9,225 86%
NVQ1 1,370 88% 1,885 90% 3,255 89%
Award 4,190 96% 5,880 98% 10,070 97%
Certificate 1,980 88% 2,325 86% 4,305 87%
Diploma 4,580 87% 2,815 83% 7,395 85%
Key Skills / Essential Skills Wales2 11,400 91% 4,140 90% 15,535 91%
Quality Assured Lifelong Learning3 365 96% 1,315 94% 1,680 95%
Other4 2,485 95% 2,565 96% 5,050 95%
All 33,070 90% 23,440 91% 56,510 90%
Level 3 A/AS/A2 Level 20,255 93% 880 82% 21,135 92%
NVQ1 260 91% 1,005 89% 1,260 89%
Award 495 97% 2,570 96% 3,065 97%
Certificate 1,095 89% 915 90% 2,010 89%
Diploma 11,670 90% 5,020 87% 16,690 89%
Key Skills / Essential Skills Wales2 17,830 96% 3,485 94% 21,315 95%
Quality Assured Lifelong Learning3 65 94% 280 96% 345 96%
Other4 7,570 92% 3,475 86% 11,045 90%
All 59,235 93% 17,630 90% 76,865 92%
Level 4+ 10 * 705 89% 715 89%
Level Not Known 17,615 92% 7,410 92% 25,030 92%
Other Short 1,235 96% 7,900 99% 9,135 99%
All learning aims 140,720 92% 79,265 92% 219,980 92%
Source: Lifelong Learning Wales Record (LLWR)1 Includes QCF qualifications that directly replace NVQs
2 Excludes the Essential Skills Wales suite of qualifications introduced in September 2015
3 Formerly known as OCNs
4 Excludes the new Welsh Baccalaureate and Skills Challenge Certificate qualifications introduced in September 2015
Type of learning aimLevel
2015/16
18 and under 19 and over All ages

8
Table 1b – Attainment rates for FE provision, by notional level, broad type of learning aim and age group
Attained
Learning
Activities %
Attained
Learning
Activities %
Attained
Learning
Activities %
Entry Level 5,355 96% 7,450 95% 12,805 95%
Level 1 NVQ1 665 94% 555 98% 1,220 96%
Award 1,075 91% 1,015 86% 2,090 88%
Certificate 1,195 94% 435 90% 1,630 93%
Diploma 3,855 95% 875 95% 4,735 95%
Key Skills / Essential Skills Wales2 6,025 94% 1,850 96% 7,870 95%
Quality Assured Lifelong Learning3 910 94% 1,420 96% 2,330 95%
Other4 3,640 99% 2,735 98% 6,375 99%
All 17,365 95% 8,890 95% 26,250 95%
Level 2 GCSE/VCE 6,285 94% 2,315 92% 8,600 93%
NVQ1 1,280 94% 1,805 96% 3,085 95%
Award 3,965 95% 5,690 97% 9,655 96%
Certificate 1,680 85% 2,130 92% 3,810 88%
Diploma 4,055 89% 2,520 90% 6,575 89%
Key Skills / Essential Skills Wales2 10,715 94% 3,995 97% 14,710 95%
Quality Assured Lifelong Learning3 355 98% 1,255 96% 1,615 96%
Other4 580 89% 1,190 95% 1,770 93%
All 28,920 93% 20,900 94% 49,820 93%
Level 3 A/AS/A2 Level 18,380 91% 790 90% 19,170 91%
NVQ1 240 92% 935 93% 1,175 93%
Award 465 94% 2,440 95% 2,905 95%
Certificate 985 90% 820 90% 1,805 90%
Diploma 11,005 94% 4,550 91% 15,555 93%
Key Skills / Essential Skills Wales2 16,940 95% 3,295 95% 20,230 95%
Quality Assured Lifelong Learning3 65 95% 275 98% 340 98%
Other4 2,660 88% 2,395 91% 5,055 89%
All 50,735 93% 15,500 92% 66,230 93%
Level 4+ 10 * 565 81% 575 81%
Level Not Known 750 97% 1,155 99% 1,905 98%
Other Short 275 99% 2,475 98% 2,750 98%
All learning aims 103,405 93% 56,935 94% 160,335 94%
Source: Lifelong Learning Wales Record (LLWR)1 Includes QCF qualifications that directly replace NVQs
2 Excludes the Essential Skills Wales suite of qualifications introduced in September 2015
3 Formerly known as OCNs
4 Excludes the new Welsh Baccalaureate and Skills Challenge Certificate qualifications introduced in September 2015
Type of learning aimLevel
2015/16
18 and under 19 and over All ages
9
Table 1c – Success rates for FE provision, by notional level, broad type of learning aim and age group
Attained
Learning
Activities %
Attained
Learning
Activities %
Attained
Learning
Activities %
Entry Level 5,355 89% 7,450 92% 12,805 91%
Level 1 NVQ1 665 83% 555 90% 1,220 86%
Award 1,075 82% 1,015 79% 2,090 80%
Certificate 1,195 83% 435 81% 1,630 82%
Diploma 3,855 84% 875 81% 4,735 84%
Key Skills / Essential Skills Wales2 6,025 84% 1,850 85% 7,870 85%
Quality Assured Lifelong Learning3 910 90% 1,420 92% 2,330 91%
Other4 3,640 98% 2,735 97% 6,375 98%
All 17,365 87% 8,890 89% 26,250 87%
Level 2 GCSE/VCE 6,285 81% 2,315 78% 8,600 80%
NVQ1 1,280 82% 1,805 86% 3,085 84%
Award 3,965 91% 5,690 95% 9,655 93%
Certificate 1,680 75% 2,130 79% 3,810 77%
Diploma 4,055 77% 2,520 74% 6,575 76%
Key Skills / Essential Skills Wales2 10,715 86% 3,995 86% 14,710 86%
Quality Assured Lifelong Learning3 355 94% 1,255 90% 1,615 91%
Other4 580 82% 1,190 93% 1,770 89%
All 28,920 83% 20,900 85% 49,820 84%
Level 3 A/AS/A2 Level 18,380 84% 790 74% 19,170 84%
NVQ1 240 84% 935 83% 1,175 83%
Award 465 92% 2,440 91% 2,905 91%
Certificate 985 80% 820 81% 1,805 80%
Diploma 11,005 85% 4,550 79% 15,555 83%
Key Skills / Essential Skills Wales2 16,940 91% 3,295 89% 20,230 91%
Quality Assured Lifelong Learning3 65 90% 275 94% 340 93%
Other4 2,660 82% 2,395 77% 5,055 79%
All 50,735 86% 15,500 83% 66,230 85%
Level 4+ 10 * 565 72% 575 72%
Level Not Known 750 90% 1,155 97% 1,905 94%
Other Short 275 98% 2,475 98% 2,750 98%
All learning aims 103,405 86% 56,935 86% 160,335 86%
Source: Lifelong Learning Wales Record (LLWR)1 Includes QCF qualifications that directly replace NVQs
2 Excludes the Essential Skills Wales suite of qualifications introduced in September 2015
3 Formerly known as OCNs
4 Excludes the new Welsh Baccalaureate and Skills Challenge Certificate qualifications introduced in September 2015
Type of learning aimLevel
2015/16
18 and under 19 and over All ages

10
Table 2a – Completion rates for FE provision, by sector subject area and age group
Completed
Learning
Activities %
Completed
Learning
Activities %
Completed
Learning
Activities %
1: Health, Public Services and Care 7,790 90% 9,930 91% 17,720 90%
2: Science and Mathematics 11,895 91% 2,920 87% 14,815 90%
3: Agriculture, Horticulture and Animal Care 1,660 91% 1,865 96% 3,525 94%
4: Engineering and Manufacturing Technologies 5,525 91% 4,470 95% 9,995 93%
5: Construction, Planning and the Built Environment 3,910 89% 4,565 94% 8,470 92%
6: Information and Communication Technology 3,495 92% 4,530 95% 8,025 93%
7: Retail and Commercial Enterprise 6,105 91% 6,290 93% 12,395 92%
7(a): Retailing and Customer Service 1,750 91% 1,505 92% 3,255 91%
7(b): Hair and Beauty 2,055 88% 1,935 89% 3,995 89%
7(c): Hospitality and Catering 2,305 94% 2,845 96% 5,150 95%
8: Leisure, Travel and Tourism 3,695 90% 730 94% 4,425 91%
9: Arts, Media and Publishing 7,830 91% 1,915 89% 9,745 90%
9(a): Performing Arts 1,820 91% 315 86% 2,135 90%
9(b): Art and Design 6,005 91% 1,605 89% 7,610 90%
10: History, Philosophy and Theology 4,015 93% 745 85% 4,760 92%
11: Social Sciences 2,695 92% 265 86% 2,965 91%
12: Languages, Literature and Culture 8,040 92% 4,315 93% 12,350 92%
13: Education and Training 115 97% 1,295 90% 1,405 90%
14: Preparation for Life and Work 69,015 93% 28,320 92% 97,340 93%
14(a): Independent Living Skills 445 95% 755 98% 1,200 97%
14(b): Adult Basic Education 5,970 94% 3,865 97% 9,835 95%
14(c): Foundation for Work 62,185 93% 19,475 91% 81,660 92%
14(d): English for Speakers of Other Languages 415 95% 4,225 95% 4,640 95%
15: Business, Administration and Law 4,795 91% 7,070 92% 11,865 92%
All sector subject areas1 140,720 92% 79,265 92% 219,980 92%
Source: Lifelong Learning Wales Record (LLWR)1 Includes learning activities where the sector subject area is unknown
Sector Subject Area
2015/16
18 and under 19 and over All ages
11
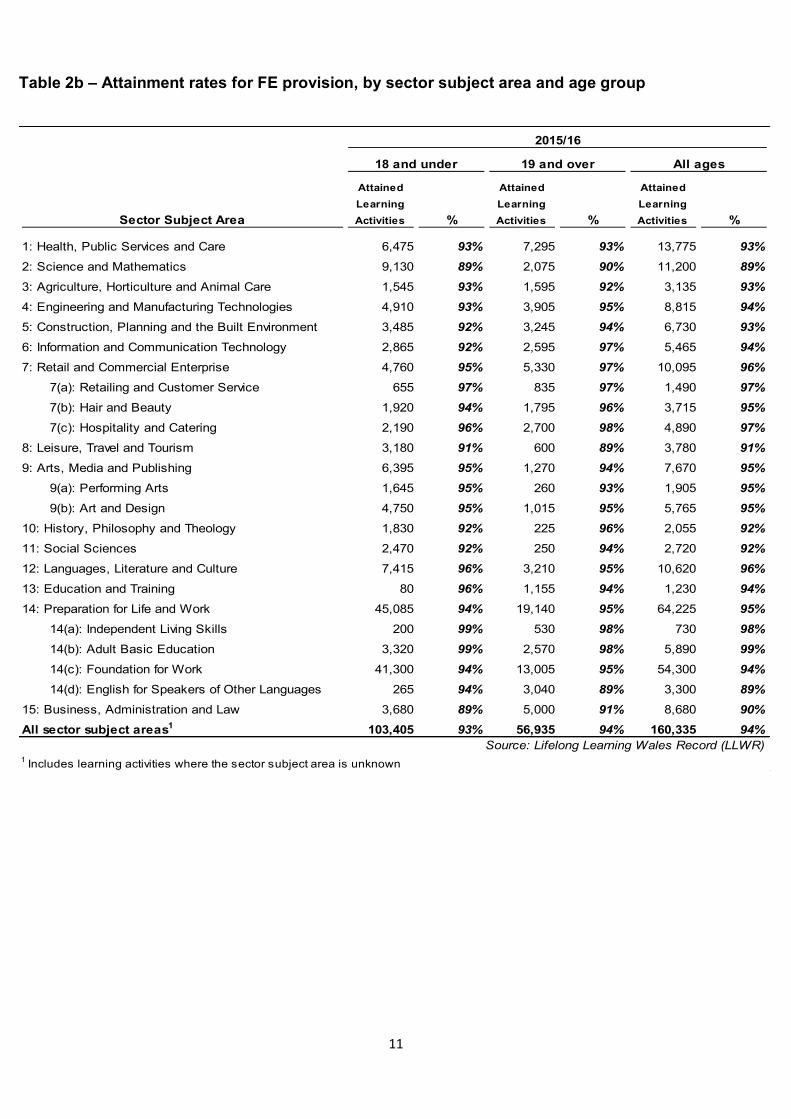
Table 2b – Attainment rates for FE provision, by sector subject area and age group
Attained
Learning
Activities %
Attained
Learning
Activities %
Attained
Learning
Activities %
1: Health, Public Services and Care 6,475 93% 7,295 93% 13,775 93%
2: Science and Mathematics 9,130 89% 2,075 90% 11,200 89%
3: Agriculture, Horticulture and Animal Care 1,545 93% 1,595 92% 3,135 93%
4: Engineering and Manufacturing Technologies 4,910 93% 3,905 95% 8,815 94%
5: Construction, Planning and the Built Environment 3,485 92% 3,245 94% 6,730 93%
6: Information and Communication Technology 2,865 92% 2,595 97% 5,465 94%
7: Retail and Commercial Enterprise 4,760 95% 5,330 97% 10,095 96%
7(a): Retailing and Customer Service 655 97% 835 97% 1,490 97%
7(b): Hair and Beauty 1,920 94% 1,795 96% 3,715 95%
7(c): Hospitality and Catering 2,190 96% 2,700 98% 4,890 97%
8: Leisure, Travel and Tourism 3,180 91% 600 89% 3,780 91%
9: Arts, Media and Publishing 6,395 95% 1,270 94% 7,670 95%
9(a): Performing Arts 1,645 95% 260 93% 1,905 95%
9(b): Art and Design 4,750 95% 1,015 95% 5,765 95%
10: History, Philosophy and Theology 1,830 92% 225 96% 2,055 92%
11: Social Sciences 2,470 92% 250 94% 2,720 92%
12: Languages, Literature and Culture 7,415 96% 3,210 95% 10,620 96%
13: Education and Training 80 96% 1,155 94% 1,230 94%
14: Preparation for Life and Work 45,085 94% 19,140 95% 64,225 95%
14(a): Independent Living Skills 200 99% 530 98% 730 98%
14(b): Adult Basic Education 3,320 99% 2,570 98% 5,890 99%
14(c): Foundation for Work 41,300 94% 13,005 95% 54,300 94%
14(d): English for Speakers of Other Languages 265 94% 3,040 89% 3,300 89%
15: Business, Administration and Law 3,680 89% 5,000 91% 8,680 90%
All sector subject areas1 103,405 93% 56,935 94% 160,335 94%
Source: Lifelong Learning Wales Record (LLWR)1 Includes learning activities where the sector subject area is unknown
Sector Subject Area
2015/16
18 and under 19 and over All ages

12
Table 2c – Success rates for FE provision, by sector subject area and age group
Attained
Learning
Activities %
Attained
Learning
Activities %
Attained
Learning
Activities %
1: Health, Public Services and Care 6,475 83% 7,295 84% 13,775 83%
2: Science and Mathematics 9,130 80% 2,075 76% 11,200 79%
3: Agriculture, Horticulture and Animal Care 1,545 85% 1,595 88% 3,135 87%
4: Engineering and Manufacturing Technologies 4,910 84% 3,905 90% 8,815 87%
5: Construction, Planning and the Built Environment 3,485 82% 3,245 87% 6,730 84%
6: Information and Communication Technology 2,865 84% 2,595 92% 5,465 87%
7: Retail and Commercial Enterprise 4,760 87% 5,330 90% 10,095 89%
7(a): Retailing and Customer Service 655 91% 835 90% 1,490 90%
7(b): Hair and Beauty 1,920 83% 1,795 85% 3,715 84%
7(c): Hospitality and Catering 2,190 90% 2,700 94% 4,890 92%
8: Leisure, Travel and Tourism 3,180 82% 600 83% 3,780 82%
9: Arts, Media and Publishing 6,395 85% 1,270 81% 7,670 85%
9(a): Performing Arts 1,645 86% 260 78% 1,905 85%
9(b): Art and Design 4,750 85% 1,015 82% 5,765 84%
10: History, Philosophy and Theology 1,830 85% 225 78% 2,055 84%
11: Social Sciences 2,470 84% 250 80% 2,720 84%
12: Languages, Literature and Culture 7,415 89% 3,210 88% 10,620 89%
13: Education and Training 80 94% 1,155 84% 1,230 84%
14: Preparation for Life and Work 45,085 88% 19,140 88% 64,225 88%
14(a): Independent Living Skills 200 97% 530 96% 730 96%
14(b): Adult Basic Education 3,320 98% 2,570 97% 5,890 98%
14(c): Foundation for Work 41,300 87% 13,005 87% 54,300 87%
14(d): English for Speakers of Other Languages 265 89% 3,040 84% 3,300 84%
15: Business, Administration and Law 3,680 80% 5,000 83% 8,680 82%
All sector subject areas1 103,405 86% 56,935 86% 160,335 86%
Source: Lifelong Learning Wales Record (LLWR)1 Includes learning activities where the sector subject area is unknown
Sector Subject Area
2015/16
18 and under 19 and over All ages
13
Table 3 - Completion, attainment and success rates for main qualifications in FE, by qualification type
No. of
Completed
Learning
Activities % Completion
No. of Attained
Learning
Activities % Attainment % Success
Vocational qualifications1 36,125 89% 32,825 93% 83%
Academic qualifications2 21,400 91% 19,510 91% 83%
All main qualifications 57,520 90% 52,335 92% 83%
Source: Lifelong Learning Wales Record (LLWR)
1 including NVQs, Diplomas, Extended Diplomas
2 Including GCSEs; AS/A/A2 Levels; Access Certificates/Diplomas
Qualification Type
2015/16

14
Table 4 – Completion, attainment and success rates for ACL provision, by type of provision and notional level
Directly delivered by Entry Level 2,950 99% 1,900 91% 90%
local authorities Level 1 1,875 98% 1,520 82% 81%
Level 2 2,870 97% 2,360 83% 81%
Other Levels 8,110 89% 220 22% 21%
All 15,810 93% 6,000 77% 76%
Delivered by local authorities Entry Level 3,290 92% 2,850 93% 85%
via a franchise arrangement Level 1 1,830 92% 1,625 93% 85%
with an FE institution Level 2 500 95% 365 81% 78%
Other Levels 245 93% 45 66% 65%
All 5,865 92% 4,885 92% 84%
Other ACL delivered Entry Level 15,595 96% 13,010 89% 85%
by FE institutions Level 1 14,955 97% 13,265 92% 89%
Level 2 7,970 98% 6,910 89% 87%
Other Levels 11,655 96% 1,635 89% 85%
All 50,175 97% 34,820 90% 87%
All provision types Entry Level 21,835 96% 17,760 90% 86%
Level 1 18,660 97% 16,410 91% 88%
Level 2 11,340 98% 9,635 87% 85%
Other Levels 20,010 93% 1,900 66% 63%
All 71,850 96% 45,705 88% 85%
Source: Lifelong Learning Wales Record (LLWR)
% Attainment % Success
2015/16
Type of ACL provision Level
No. of
Completed
Learning
Activities
%
Completion
No. of
Attained
Learning
Activities

15
Table 5 – Completion, attainment and success rates for ACL provision, by type of provision and age group
Directly delivered by 18 and under 560 93% 320 67% 64%
local authorities 19 - 24 1,170 93% 640 72% 70%
25 - 49 7,070 92% 3,455 84% 82%
50 - 74 6,220 94% 1,460 70% 69%
75 and over 770 96% 125 68% 66%
All 1 15,810 93% 6,000 77% 76%
Delivered by local authorities 18 and under 205 89% 180 90% 79%
via a franchise arrangement 19 - 24 665 92% 540 93% 85%
with an FE institution 25 - 49 3,335 92% 2,860 92% 85%
50 - 74 1,520 93% 1,205 90% 84%
75 and over 135 90% 100 92% 82%
All 1 5,865 92% 4,885 92% 84%
Other ACL delivered 18 and under 2,860 98% 2,215 91% 89%
by FE institutions 19 - 24 6,115 97% 4,645 91% 88%
25 - 49 25,620 97% 18,525 91% 88%
50 - 74 13,870 97% 8,645 88% 86%
75 and over 1,640 96% 785 85% 81%
All 1 50,175 97% 34,820 90% 87%
All provision types 18 and under 3,625 96% 2,710 87% 84%
19 - 24 7,945 96% 5,825 88% 86%
25 - 49 36,030 95% 24,840 90% 87%
50 - 74 21,610 96% 11,310 86% 83%
75 and over 2,545 96% 1,005 83% 79%
All 1 71,850 96% 45,705 88% 85%
Source: Lifelong Learning Wales Record (LLWR)1 Includes learning activities where the age group is unknown
Type of Provision Age Group
2015/16
No. of
Attained
Learning
Activities % Attainment % Success
No. of
Completed
Learning
Activities
%
Completion
16
Table 6 – Completion, attainment and success rates for ACL provision, by notional level and sector subject area
Entry Level Arts, Media and Publishing 1,165 98% 805 89% 86%
Information and Communication Technology 870 97% 675 84% 82%
Languages, Literature and Culture 775 98% 615 92% 89%
Adult Basic Education 7,215 95% 5,685 91% 87%
English for Speakers of Other Languages 6,030 94% 4,890 87% 81%
Other 5,775 97% 5,090 92% 89%
All 1 21,835 96% 17,760 90% 86%
Level 1 Arts, Media and Publishing 1,215 97% 1,060 87% 84%
Information and Communication Technology 2,380 97% 2,040 87% 85%
Languages, Literature and Culture 600 94% 505 90% 85%
Adult Basic Education 2,865 92% 2,315 91% 83%
English for Speakers of Other Languages 720 95% 500 93% 88%
Other 10,880 99% 9,990 92% 91%
All 1 18,660 97% 16,410 91% 88%
Level 2 Arts, Media and Publishing 580 95% 485 84% 80%
Information and Communication Technology 780 97% 690 89% 87%
Languages, Literature and Culture 225 85% 195 95% 81%
Adult Basic Education 360 96% 180 94% 88%
English for Speakers of Other Languages 160 95% 145 97% 94%
Other 9,240 99% 7,935 87% 86%
All 1 11,340 98% 9,635 87% 85%
Other Levels Arts, Media and Publishing 4,800 95% 40 * 66%
Information and Communication Technology 2,790 95% 80 78% 78%
Languages, Literature and Culture 1,260 94% 90 92% 81%
Adult Basic Education 2,335 91% 430 99% 94%
English for Speakers of Other Languages 1,005 95% 10 * *
Other 7,820 92% 1,245 57% 54%
All 1 20,010 93% 1,900 66% 63%
All Levels Arts, Media and Publishing 7,760 95% 2,390 87% 84%
Information and Communication Technology 6,825 96% 3,485 87% 84%
Languages, Literature and Culture 2,860 94% 1,405 92% 86%
Adult Basic Education 12,770 94% 8,610 92% 86%
English for Speakers of Other Languages 7,915 94% 5,545 88% 82%
Other 33,720 97% 24,265 87% 86%
All 1 71,850 96% 45,705 88% 85%
Source: Lifelong Learning Wales Record (LLWR)1 Includes learning activities where the sector subject area is unknown
No. of
Attained
Learning
Activities % Attainment % SuccessLevel Sector Subject Area
2015/16
No. of
Completed
Learning
Activities % Completion
17
Notes
1. Data sources
This Statistical First Release (SFR) summarises data on learner outcomes for 2015/16. It covers further
education (FE) and adult community learning (ACL) provision delivered by learning providers funded by
Welsh Government. However, the figures are not restricted to fundable provision at those providers.
Data on learners accessing FE and ACL provision across Wales is submitted electronically to Welsh
Government by learning providers via the Lifelong Learning Wales Record (LLWR). This data is used for
funding, monitoring performance and outcomes and to inform strategy development. Furthermore, the
data provides the official source of statistics on post-16 (non-higher education) learners in Wales.
Further information on LLWR including user support manuals can be found at:
Welsh Government - Lifelong Learning Wales Record
Our statement of administrative sources, which also refers to this data source, can be found at:
Statement of Administrative Sources
2. Definitions
2.1 Terminology
Data are presented on an ‘academic year’ basis referring to the period 1 August to 31 July.
The terms ‘learning activity’ or ‘learning aim’ refer to a specific qualification pursued by a learner,
for example, an A Level or Essential Skill. The term ‘learning programme’ refers to a group of
related learning activities or aims.
2.2 Cohorts
The Essential Skills Wales suite of qualifications introduced in September 2015 has been
excluded from the base cohort of learning activities, as a number of FE institutions are yet to
adopt the new qualifications and due to the potential impact they would have in skewing the
Wales-level learner outcome measures used as national comparators for benchmarking
purposes. The table below details the learner outcome measures for these qualifications.

18
Completion, attainment and success rates for new Essential Skills Wales qualifications, by provision and level, 2015/16
No. of
Completed
Learning
Activities % Completion
No. of Attained
Learning
Activities % Attainment % Success
L1 1,360 85% 700 51% 44%
L2 1,160 83% 465 40% 33%
L3 165 66% 100 62% 40%
All levels 2,685 83% 1,265 47% 39%
L1 * * * * *
L2 55 83% 35 67% 55%
L3 * * * * *
All levels 70 77% 45 68% 52%
All Provision All levels 2,750 83% 1,315 48% 39%
Source: Lifelong Learning Wales Record (LLWR)
Level
2015/16
Provision
Further Education
Adult Community Learning
Similarly, the new Welsh Baccalaureate and Skills Challenge Certificate qualifications introduced
in September 2015 have also been excluded from the base cohort of learning activities due to a
data quality issues and until outcomes for the Advanced Welsh Baccalaureate and Skills
Challenge Certificate (which are delivered over two years) are available for reporting from
2016/17. The table below highlights the data quality issues, in particular, where a high proportion
of learning activities are linked to an award record with an unknown result.
New Welsh Baccalaureate and Skills Challenge Certificate qualifications data quality, by level
Skill Challenge
Certificate
Welsh
Baccalaureate
Skill Challenge
Certificate
Welsh
Baccalaureate
% of completed, assessable learning
activities not linking to an award0 4 0 1
% of completed, assessable learning
activities linking to an award where the
result is unknown
48 45 49 43
Source: Lifelong Learning Wales Record (LLWR)
Level 1 Level 2
Aside from the exclusions noted above, the base cohorts underpinning tables 1a – 1c, 2a – 2c, 4,
5 and 6 comprise all learning activities that were either expected to complete during the
respective academic year or actually ended during the academic year but were expected to
complete prior to it.
19
The base cohort underpinning table 3 is derived as above but additionally contains only learning
activities that have been identified as main qualifications (by the institution submitting data) linked
to full-time learning programmes.
2.3 Provision type
This statistical release includes data on FE provision delivered by FE institutions and ACL provision
delivered by ACL partnerships.
ACL provision is defined in Delivering Community Learning for Wales as “Flexible learning opportunities
for adults, delivered in community venues to meet local needs”. For the purposes of this release, we
have focussed on three distinct types of provision:
ACL directly delivered by local authorities (LAs);
ACL delivered by LAs via a franchise arrangement with a further education (FE) institution; and
Other ACL delivered by FE institutions (this includes all provision delivered by Adult Learning
Wales).
Other ACL provision delivered by FE institutions is the largest provision type comprising 69 per cent of
all terminated learning activities included in this release. ACL provision delivered by local authorities via
a franchise arrangement with a FE institution and ACL provision directly delivered by local authorities
comprised 8 per cent and 23 per cent of all terminated learning activities respectively.
The following types of provision have been excluded from this release:
Higher Education (HE) provision delivered by FE institutions.
Welsh for Adults (WfA) provision submitted to the LLWR by Coleg Gwent.
Work-based Learning (WBL) provision delivered by contracted lead providers, their consortium
members and sub-contractors.
Note that the exclusion of WBL provision is a change introduced for the 2015/16 academic year.
Previously published statistics on learner outcomes for the FE and ACL sectors have included data for
the WBL sector. For 2015/16, WBL provision will be reported on in a separate Statistical First Release
due to changes in the reconciliation timetable. Further information is provided in section 4.3.
2.4 Completion, attainment and success
The completion rates shown in tables 1a, 2a, 3, 4, 5 and 6 are calculated as the number of
learning activities completed divided by the number of learning activities terminated (completed
or withdrawn).
The attainment rates shown in tables 1b, 2b, 3, 4, 5 and 6 are calculated as the number of
learning activities attained divided by the number of learning activities completed.
The success rates shown in tables 1c, 2c, 3, 4, 5 and 6 are calculated as the number of learning
activities attained divided by the number of learning activities terminated.

20
Learning activities that are deemed to be non-assessable (i.e. do not lead to an associated
award) are excluded from the denominators of the attainment and success rate calculations.
Learning activities recorded as either transferred or continuing are excluded from all calculations.
2.5 Other short learning activities
Tables 1a – 1c include a line for ‘Other Short’ learning activities. These are defined as learning
activities that don’t fall in to any of the other defined categories with an expected length of less
than 8 weeks. .
2.6 Learner age group
A learner’s age group is calculated from their age at 31 August in the academic year they started
learning.
In tables 1a – 1c and 2a – 2c learners of unknown age are included in the age group 19 and
over.
2.7 Sector/subject areas
The sector/subject areas detailed in Tables 2a – 2c and 6 are based on the 15 first-tier areas of
learning classified by the Office of Qualifications and Examination Regulation (OfQual) and reflect
the sub-areas used by Estyn for inspection purposes. The sector/subject areas in table 6 have
been grouped to reflect the most popular ACL subject areas.
The total lines include learning activities with unknown sector/subject areas.
2.8 Early drop-out
Learning activities with an expected length of 24 weeks or greater that ended within 8 weeks of
their start date without completing have been classified as early drop-outs, and have been
excluded from all learner outcome measures in all tables.
3. Rounding and suppression
All figures in this Statistical Release are rounded to the nearest 5 and therefore there may be
apparent slight differences between the sum of the constituent rows/columns and the totals. A ‘*’
represents numbers greater than 0 but less than 5.
In addition, percentage calculations where the denominator is less than 50 have been
suppressed and the percentage replaced with a ‘*‘.

21
4. Key quality information
This section provides a summary of information on this output against five dimensions of quality:
Relevance, Accuracy, Timeliness and Punctuality, Accessibility and Clarity, and Comparability.
4.1 Relevance
The measures set out in this publication are primarily used:
by the Welsh Government to monitor providers’ performance and as baseline information to set
targets for improvements as part of the Quality and Effectiveness Framework for post-16
learning;
by Estyn, to inform inspection judgements on Key Question 1 ‘How well do learners achieve?’;
and
by providers themselves, as a management tool to measure their own performance and
benchmark themselves against sector averages, as part of their annual self-assessment cycles.
The Welsh Government and Estyn have a commitment to share data in order to minimise bureaucracy
for providers and ensure consistent definitions of performance wherever possible and have worked
together closely to develop these measures and a standard format for presenting data.
The measures are also used both within and outside the Welsh Government to monitor educational
trends and as a baseline for further analysis of the underlying data. Some of the key users are:
Ministers and the Members Research Service in the National Assembly for Wales;
Officials in the Welsh Government;
Other government departments;
Students, researchers, and academics;
Individual citizens, private companies, and the media.
These statistics are used in a variety of ways. Some examples of these are:
general background and research;
inclusion in reports and briefings;
advice to Ministers;
to inform and evaluate the education policy-making process in Wales.
4.2 Accuracy
Statisticians within the Welsh Government undertake a process of data reconciliation ahead of
publishing this release. Monthly reconciliation reports detailing provisional learner outcomes figures are
issued to FE institutions and local authorities. Data quality issues are then followed up and resolved in
liaison with Welsh Government officials.
22
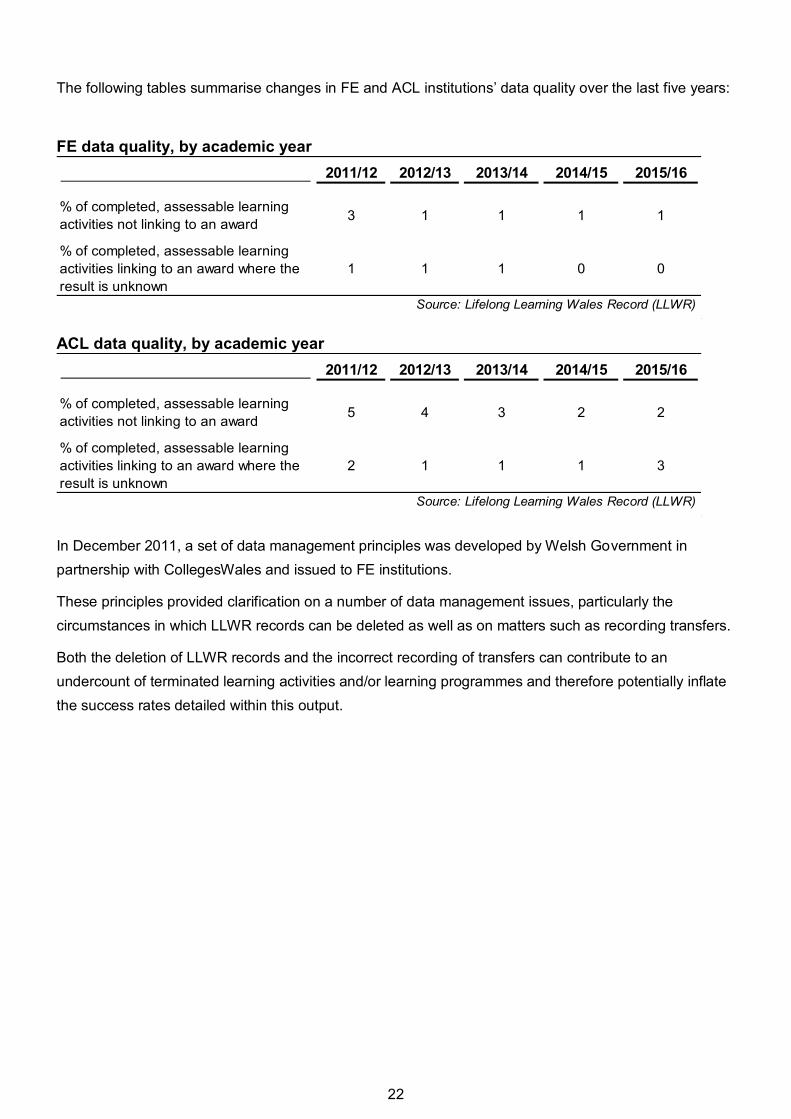
The following tables summarise changes in FE and ACL institutions’ data quality over the last five years:
FE data quality, by academic year
2011/12 2012/13 2013/14 2014/15 2015/16
% of completed, assessable learning
activities not linking to an award3 1 1 1 1
% of completed, assessable learning
activities linking to an award where the
result is unknown
1 1 1 0 0
Source: Lifelong Learning Wales Record (LLWR)
ACL data quality, by academic year
2011/12 2012/13 2013/14 2014/15 2015/16
% of completed, assessable learning
activities not linking to an award5 4 3 2 2
% of completed, assessable learning
activities linking to an award where the
result is unknown
2 1 1 1 3
Source: Lifelong Learning Wales Record (LLWR)
In December 2011, a set of data management principles was developed by Welsh Government in
partnership with CollegesWales and issued to FE institutions.
These principles provided clarification on a number of data management issues, particularly the
circumstances in which LLWR records can be deleted as well as on matters such as recording transfers.
Both the deletion of LLWR records and the incorrect recording of transfers can contribute to an
undercount of terminated learning activities and/or learning programmes and therefore potentially inflate
the success rates detailed within this output.

23
Analysis has been undertaken to continue to determine the impact of the guidelines on submitted data.
The following table compares the number of learning activities in the FE success rate denominator
against an earlier freeze of the LLWR data.
LLWR freeze taken
September 2016
Statistical Release
freeze (taken December
2016)
Entry Level 11,915 14,110 18.4
Level 1 30,045 30,045 0.0
Level 2 60,580 59,320 -2.1
Level 3 77,645 77,520 -0.2
Level 4 950 800 -16.2
Unknown Level 2,590 2,015 -22.2
Other Short 2,885 2,810 -2.6
All learning aims 186,615 186,615 0.0
Source: Lifelong Learning Wales Record (LLWR)
Level
No. of Assessable, Terminated Learning Activities
% Difference
This table, coincidentally this year, shows the same total number of learning activities comprising the FE
success rate denominator. However, analysis at each level and between institutions reveals substantial
variation. Around three fifths of all institutions have differences of less than ± 2 per cent. But over one
fifth of institutions have differences of more than ± 7 per cent. This variation indicates the correction of
underlying data-issues.
Additional analysis was undertaken to specifically investigate the recording of learning activities as
transferred or continuing. If a learning activity is recorded as continuing or transferred, it is excluded from
learning activity success rates.
The following tables show the proportion of FE learning activities that were recorded as continuing or
transferred between 2011/12 and 2015/16.

24
Proportion of FE learning activities recorded as continuing, by learning aim level and academic year
2011/12 2012/13 2013/14 2014/15 2015/16
Entry Level 0.5 0.4 0.9 0.1 0.0
Level 1 0.5 0.5 1.4 0.3 0.2
Level 2 0.8 0.7 1.5 0.7 0.5
Level 3 0.9 0.8 0.9 1.0 0.3
Level 4 4.5 2.3 8.2 9.8 4.5
Unknown Level 1.4 0.5 1.2 0.2 0.4
Other Short 0.3 0.2 0.3 0.6 0.1
All learning aims 0.7 0.6 1.2 0.7 0.4
Source: Lifelong Learning Wales Record (LLWR)
Level
% of Continuing Learning Activities
Proportion of FE learning activities recorded as transferred, by learning aim level and academic year
2011/12 2012/13 2013/14 2014/15 2015/16
Entry Level 4.3 3.0 3.5 6.0 6.7
Level 1 4.8 4.3 3.9 5.2 5.2
Level 2 5.9 4.5 4.1 4.2 4.2
Level 3 5.9 5.8 4.0 3.4 4.4
Level 4 8.0 15.5 10.2 5.7 5.1
Unknown Level 3.6 4.6 1.6 3.7 3.1
Other Short 0.3 0.3 0.3 0.2 1.0
All learning aims 5.0 4.4 3.7 4.0 4.4
Source: Lifelong Learning Wales Record (LLWR)
Level
% of Transferred Learning Activities
In general, the proportion of learning activities recorded as continuing or transferred in 2015/16 is
broadly in line with previous years.
In addition, the following data issues are of particular relevance to tables 4, 5 and 6 of this release:
Non assessable learning activities
Learning activities that are deemed to be non-assessable (i.e. do not lead to an associated award) are
excluded from the denominators of attainment and success rate calculations.
Directly delivered local authority provision has a notably high proportion of such activities (53 per cent of
terminated learning activities in 2015/16) compared with local authority provision delivered via a
25
franchise arrangement with an FE institution (9 per cent of terminated learning activities) and other ACL
provision delivered by FE institutions (23 per cent of terminated activities).
However, further analysis by local authority reveals that the proportion of non-assessable activities
varies considerably between providers. This suggests that non-assessable provision is being
inconsistently recorded and thereby potentially impacting on attainment and success rates. Learning
activities that have been identified as non-assessable on submission but are subsequently identified by
the Welsh Government to be linked to assessable learning aims are included in the calculation of
attainment and success rates.
Level of learning activities
A significant number of local authority learning activities were recorded with a level of ‘Not Known’ or
‘Not Applicable’ on LLWR. These learning activities have been categorised as ‘Other Levels’ in tables 4
and 6 of this release.
Other ACL delivered by FE institutions
For the purposes of this release, this provision has been identified using information recorded in the type
of learning programme field. Information on type of learning programme is based on FE institutions’ own
identification of ACL provision.
4.3 Timeliness and punctuality
The annual timescale for the production of final learner outcomes data balances timeliness against the
need for accurate data-quality in order to underpin robust sector benchmarks. This year, in consultation
with learning providers, we brought forward the timetable for data reconciliation and publication by
around two months. Statistics are drawn from a database based on the LLWR as at December (rather
than February, as in previous years) following the end of the academic year. This first release is then
produced and published as soon as possible.
Currently, the timescale for Work-based Learning (WBL) data reconciliation is unchanged from previous
years and therefore we will be reporting on these outcomes separately in late March.
4.4 Accessibility and clarity
This statistical release is pre-announced and then published on the Statistics and Research section of
the Welsh Government website.
4.5 Comparability and coherence
Figures in this statistical release are broadly comparable with previous years. Past releases can be
accessed via the following link:
Learner Outcome Measures for Further Education, Work Based Learning and Adult Community Learning
- past releases
Note that, for 2012/13 to 2014/15, data on FE, WBL and ACL provision were published together in one
release. Prior to 2012/13, data on FE and WBL provision were published separately to ACL provision.
26
Equivalent data on post-16 learner outcomes in England, Scotland and Northern Ireland can be found
via the following links:
Skills Funding Agency / Department for Education - Learner participation, outcomes and level of highest
qualification
Scottish Funding Council - Staff and Student Performance Indicators for FE Colleges
Department for the Economy Northern Ireland - Further Education Performance Statistics
However, due to differences in methodology and data collection, caution should be exercised in making
direct comparisons with the figures contained within this release.
5. Additional information
5.1 Further dissemination of performance measures
Learner Outcomes Reports (LORs) for FE institutions and ACL partnerships will be published by Welsh
Government in February 2017:
Learner Outcomes Reports for Further Education
Learner Outcomes Reports for Adult Community Learning Partnerships
5.2 Consistent post-16 performance measures
Arrangements for measuring performance in school sixth forms and in further education/work-based
learning are currently entirely separate. Performance measures are produced from different data-
collection systems using differing analysis methodologies. This means we are unable to compare
outcomes in a meaningful way across learner settings, and that learners and parents do not have access
to transparent information to inform their choices.
To address this disparity, the Welsh Government is currently working to develop a set of consistent
measures for further education institutions and sixth forms to enable the publication of headline and
provider level information on an annual basis. Further information about the development of consistent
measures for post-16 learning can be found on the Welsh Government website.
The Welsh Government will be consulting on a new set of consistent performance measures for further
education and school sixth forms from 30 January – 1 May 2017. We would welcome your views.
27
National Statistics status
The United Kingdom Statistics Authority has designated these statistics as National Statistics, in
accordance with the Statistics and Registration Service Act 2007 and signifying compliance with the
Code of Practice for Official Statistics.
National Statistics status means that official statistics meet the highest standards of trustworthiness,
quality and public value.
All official statistics should comply with all aspects of the Code of Practice for Official Statistics. They are
awarded National Statistics status following an assessment by the UK Statistics Authority’s regulatory
arm. The Authority considers whether the statistics meet the highest standards of Code compliance,
including the value they add to public decisions and debate.
It is Welsh Government’s responsibility to maintain compliance with the standards expected of National
Statistics. If we become concerned about whether these statistics are still meeting the appropriate
standards, we will discuss any concerns with the Authority promptly. National Statistics status can be
removed at any point when the highest standards are not maintained, and reinstated when standards are
restored.
Well-being of Future Generations Act (WFG)
The Well-being of Future Generations Act 2015 is about improving the social, economic, environmental
and cultural well-being of Wales. The Act puts in place seven well-being goals for Wales. These are for a
more equal, prosperous, resilient, healthier and globally responsible Wales, with cohesive communities
and a vibrant culture and thriving Welsh language. Under section (10)(1) of the Act, the Welsh Ministers
must (a) publish indicators (“national indicators”) that must be applied for the purpose of measuring
progress towards the achievement of the Well-being goals, and (b) lay a copy of the national indicators
before the National Assembly. The 46 national indicators were laid in March 2016.
Information on indicators and associated technical information - How do you measure a nation’s
progress? - National Indicators
Further information on the Well-being of Future Generations (Wales) Act 2015.
The statistics included in this release could also provide supporting narrative to the national indicators
and be used by public services boards in relation to their local well-being assessments and local well-
being plans.
28
Further details
This document is available at: http://gov.wales/statistics-and-research/learner-outcome-measures-
further-education-work-based-learning-community-learning/?lang=en
Next update
February 2018 (provisional) for the academic year 2016/17.
We want your feedback
We welcome any feedback on any aspect of these statistics which can be provided by email to
Open Government Licence
All content is available under the Open Government Licence v3.0, except where otherwise stated.