lean for dummies - advisor home - 2ndbn5thmar.com2ndbn5thmar.com/lean/notes on lean for...
TRANSCRIPT
Notes on Continuous Process Improvement 13 August 2007
An outline of:
Lean for Dummies
By Natalie J. Sayer and Bruce Williams Hoboken, NJ: Wiley Publishing, Inc., 2007
Introduction. Lean aligns the organization to deliver customer value and eliminate waste.
Part I: Lean Basics Chapter 1: Defining Lean. Lean is a philosophy of continuous, incremental improvement. What Is Lean? MIT 1988. Dr James Womack defined Toyota as a “lean” company.
• Waste not, want not. Use the least possible amount of material, time, space, facilities, capital, energy, and effort to deliver your product or service to your customer. Anything more is waste. Mistakes, overproducing inventory, excess employees doing incorrect work, more equipment, and incomplete information is waste. People working improperly is the most wasteful – because it damages morale.
• The logic of Lean. Everything begins and ends with what the customer requires. The customer is the
only arbiter of value. Value is created by a process. Waste diminishes value. A perfect process has no waste. Perfect processes maximize customer value.
• Where is Lean? Lean is a set of accepted practices. Lean is people, trained and empowered, who are
more important than facilities or capital. Lean culture has everyone continually improving processes.
• What it’s not. Lean is NOT a fad or a single event. Lean is NOT expensive. Lean is NOT statistical.
• What makes Lean special? Lean is proven. Lean is simple, accessible, inclusive, and makes sense. The Lean Pedigree
• Toyoda and Ohno at Toyota studied Ford in 1950. The Japanese workforce was not willing to work under the same substandard conditions as the immigrant workforce in the U.S. Capital was too high.
• The Toyota Production System (TPS) was created: best quality, lowest cost, shortest production. Lean and Its Continuous Process Improvement Cousins
• Total Quality Management (TQM), Six Sigma (not “Lean Six Sigma”), Theory of Constraints (TOC) (which is useful for Lean practitioners to examine bottlenecks), Total Productive Maintenance (TPM), ISO-9000, and Business Process Management (BPM) – are all compatible with Lean.
1

Notes on Continuous Process Improvement 13 August 2007
Chapter 2: The Foundation and Language of Lean Understanding Lean Basics
• Creating the foundation. Lean tenets: (1) Customer Value, (2) Value-Stream Analysis, (3) Improvement, Flow, Pull, and Perfection.
(1) The customer defines the value of a product. The customer defines what actions are value-added. (2) Analyze the current stream of steps that create customer value. Processes must be synchronized to
customer’s rate of consumption. (3) Flow is counterintuitive. One at a time is better that batch processing. Pull is “Take one, make one.”
Incremental improvement means you improve one thing every day.
• Learning from TPS. Motivated people improve their processes daily. People eliminate waste. Visual management means that information is easily viewed by all in order to respond to issues rapidly.
• Foundational wisdom. It’s all about the customer. Respect your people – reward improvements, let them learn and grow. Make it visual – transparency, “a picture is worth a thousand words,” eliminates waste. KISS – strive to find simple solutions. Keep it moving – batching inhibits flow. Quality at the source – the person who performed the step is responsible for quality. Inspection does not improve a product. Measurements reinforce behavior – people respond to how they are measured.
Getting into Shape
• Muda, muda, muda. (7) forms of waste. Mnemonic: TWO DIME. Transport: Movement of product between processes. Caused by poor layout of process. Waiting: Operator waiting. Overproduction: Producing more than needed. Overproduction causes other wastes, like inventory. Defects: Failure to meet specifications results in rework and scrap. Inventory: Inventory waiting anywhere in the value stream takes up space, costs money, gets damaged. Motion: Operator motion that does not add value. Excess processing: Any process that does not add value. Type 1 muda is non-value added, but necessary. Type 2 is non-value added AND unnecessary.
• All in the family. Use the word “effective,” not “efficient.” A company that enforces wasteful processes
is not respectful of its people’s skills and time.
2

Notes on Continuous Process Improvement 13 August 2007
Part II: Understanding Flow and the Value Stream Chapter 3: Seeing Value through the Eyes of the Customer What Is Value? Value is defined by the customer. To Add Value or Not to Add Value, That Is the Question. Every activity either adds value or it doesn’t. Everything should add value! Lean strives to eliminate all non-value added activities.
• Defining value-added. (VA) (1) The Customer must be willing to pay for it. (2) The activity must change the product. (3) The activity must be done correctly the first time.
• Defining non-value-added. (NVA)
(1) Not valued by the customer. (2) Not transforming. (3) Not correctly done.
• When non-value-added seems like value-added. Administration, accounting, legal, reports, approvals,
testing, inspections, transportation. Understanding How the Customer Defines Value. Your customer receives your product.
• Uncovering the elusive customer. Answer, “Who is the customer?” He is the only one who matters. Internal stakeholders can be distracters.
• Considering customer value. Customers have needs, wants, and delighters. Survey your customers extensively. Customer interests and expectations change over time.
Understanding How the Consumer Defines Value. Balance your middleman customer with the final consumer.
• Responding to the consumer.
• Understanding what consumers value. Introducing the Value Stream
• Visualizing the value stream. All the activities lined up to produce a product or service.
• Looking at the flow of information. Information – orders, schedules – flows along with the product being created. Waste abounds in information flow. Sometimes orders process is longer than production!
3

Notes on Continuous Process Improvement 13 August 2007
Chapter 4: A Resource Runs through It: Value Stream Mapping Value Stream: A product passes through a series of processes. Each process transforms it as it flows through. The Value Stream Map is the heart of Lean. It shows the process and it’s customer-centric. The Who, What, and Why of Value Stream Maps. A VSM plots the course of a product. The current-state is as-is. The ideal-state is the goal. A full VSM includes materials and information flows.
• The purpose of a Value Stream Map. Customer perspective of process. Fact-based, time-series representation of activities. Common language, common view of process. Shows information flow to trigger actions. Shows VA activities, and actions impeding your ability to delight the customer.
• The people who use a Value Stream Map. Process owners, designers, workers, managers, IT.
• The elements of a Value Stream Map. Process steps. Inventory. Information flow. Box score of VA /
NVA time. Lead time of complete process. Takt time is rate of customer demand. Row, Row, Row Your Boat: Getting Started
• Identifying the natural owner. Who owns the value stream?
• Gathering the crew. VSM identifies the “real process.” 5 to 7 key players make a good analysis team.
• Using mapping tools. Low-tech is paper. High-tech is software. See Table 4-1, p 78.
• Gathering supporting information. More is better. Videotape process for accuracy.
• A VSM example: Pre-made gourmet salads. See Table 4-3, p 84. Sorting Through the Tributaries: Creating the Current-State Value Stream Map
• Identifying the activities. First-pass VSM should include only the major activities.
• Qualifying and Quantifying. Record actual times. Waiting, processing, transport. VA / NVA.
• Determining the information flow. What info goes to whom for what reason? Summing Up the Process
• The box score. Critical statistics: VA / NVA. Lead time. Changeover time. Pieces per hour. Scrap rate.
• Takt time. In Lean, the pace of production is tied directly to customer consumption. Check the Chart: Validating the Value Stream Map. Go again and watch the process to validate the paper.
4

Notes on Continuous Process Improvement 13 August 2007
Chapter 5: Charting the Course: Using Value Stream Maps Get current state VSM correct before new changes. Ideal-state VSM will probably never be accomplished. Investigating the Value Stream for Clues
• Rounding up the usual suspects. Listen to the customer: find delays, find quality issues. A fishbone diagram can help you analyze customer issues. See Figure 5-1, p 96. Use the 5-Whys. Search for waste: anytime you use “re-” in front of a word, it’s a candidate for waste elimination. Diagram the shop floor.
• Analyzing from different perspectives. Use multiple points of view to analyze the process. Use multiple directions to analyze your process. See lists on pp 98-103. Experts – How can the process be more visual? Quality – How can customer issues be better heard? What is the most common form of scrap? Supply – Where is there excess inventory stored inside the process? Engineering – Can processes be combined? Information – VSM shows information flows. Does information flow from customer without delays?
• Evaluating the evidence: An analyzed example. See Table 5-1, p 104, for process analysis. Painting a Picture of the Future
• Creating the Ideal-State Value Stream Map: Where all is perfect in the world. The ideal VSM is “take-one, make-one.” The VSM exercise frequently results in dramatic gains.
• Stepping closer to perfection: The Future-State Value Stream Map. Ideal VSM is usually
unreachable, so diagram what can be accomplished. Use Lean principles from Chapter 2, Lean concepts (VA, NVA, flow, and waste) from Chapter 3, and the following new ideas: Pacemaker operations, Bottleneck process, Work modules, Supermarkets, Standardized work, Kanban, Workload leveling, Pitch. Mark-up the current-state VSM to create the future-state VSM.
Creating the Mosaic of Continuous Improvement: Setting the Stage for Kaizen
• Looking toward the annual horizon. Prioritize the changes most meaningful to the customer.
• Future-State implementations. As you make process changes, update the current-state VSM.
5

Notes on Continuous Process Improvement 13 August 2007
Chapter 6: Flowing in the Right Direction: Lean Projects and Kaizen Kaizen: A Way of Life. “Kaizen” means “continuous improvement.” Kaizen subordinates tools – equipment, facilities, processes, and technology – to people.
• Kaizen: The philosophy. “Do not let a day pass without improving.” The opposite is “If it ain’t broke, don’t fix it.” Kaizen says even if it isn’t broken, it should be improved.
• Kaizen in action. Kaizen requires involvement from everyone: top to bottom. The “eighth form of waste” is underutilization of people. Kaizen requires standards. Without standards, you cannot improve.
Improving the Value Stream with Kaizen
• Selecting projects. Focus on eliminating a single form of waste at a time. Pick a significant area to fix.
• Project Methodology. Go to “gemba” – where the activities are taking place. Use the Plan-Do-Check-Act cycle. Plan: select a process, ID the change, predict the result. Do: implement your plan on a small trial basic. Check: examine the results and compare to standards. Act: implement your plan full scale and report the results. This process is an incremental, low-investment model.
• Individual projects. Each employee can improve their own work area and process.
• Group projects. Weeks or months. Management projects. Work team projects. Kaizen: The Workshop. A single, small project accomplished in three to five days.
• Planning the Kaizen workshop. VSM is already done. Metrics are already collected. Project is well-defined. Day 1: Training. Day 2: Analyze current-state VSM. Day 3: Implement changes. Day 4: Observe and refine. Day 5: Update standards, update process, present results.
• Conducting the Kaizen workshop. Similar to a home-improvement-weekend TV show.
• Sustaining the Kaizen-workshop gains. Changing the standards is the most important final step.
6
Notes on Continuous Process Improvement 13 August 2007
Part III: The Lean Toolbox Chapter 7: Customer and Value-Stream Tools Communing with the Customer. Tools that capture the voice of the customer.
• Capturing the voice of the customer. Voice of the customer (VOC) is captured by surveys, interviews, clinics, and reports. Analysis: VOC → Requirements → Design → Development → Production.
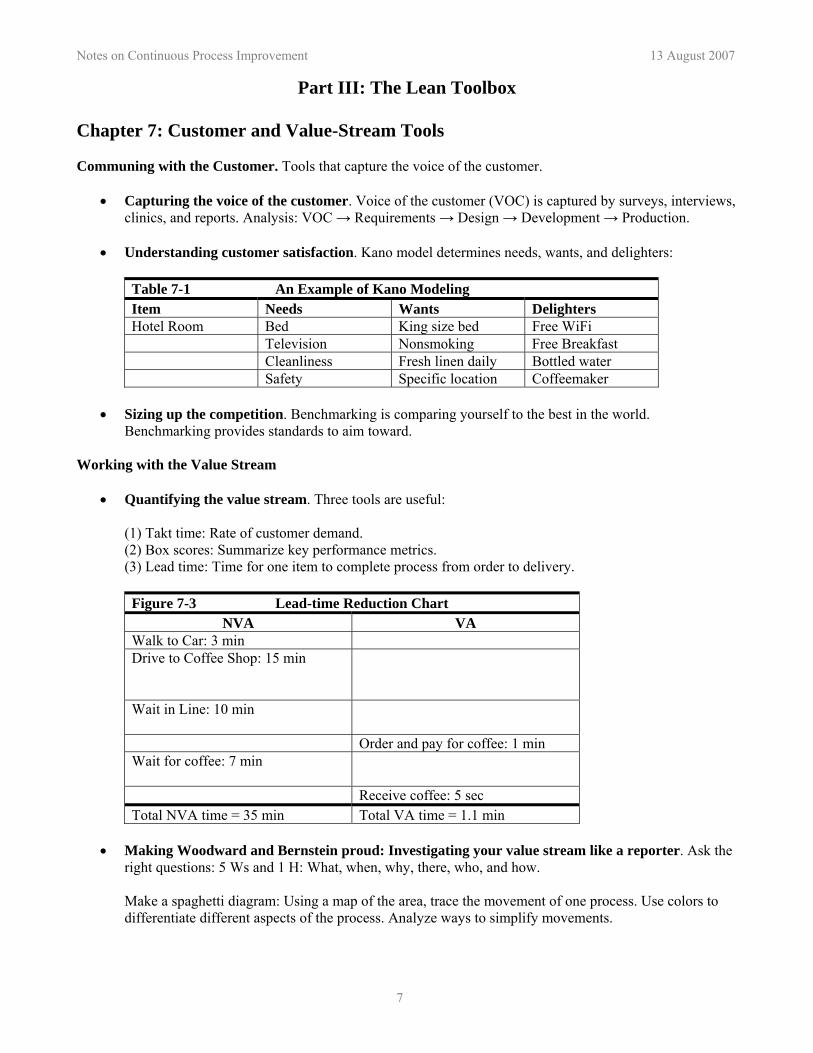
• Understanding customer satisfaction. Kano model determines needs, wants, and delighters:
Table 7-1 An Example of Kano Modeling Item Needs Wants Delighters Hotel Room Bed King size bed Free WiFi Television Nonsmoking Free Breakfast Cleanliness Fresh linen daily Bottled water Safety Specific location Coffeemaker
• Sizing up the competition. Benchmarking is comparing yourself to the best in the world. Benchmarking provides standards to aim toward.
Working with the Value Stream
• Quantifying the value stream. Three tools are useful: (1) Takt time: Rate of customer demand. (2) Box scores: Summarize key performance metrics. (3) Lead time: Time for one item to complete process from order to delivery.
Figure 7-3 Lead-time Reduction Chart
NVA VA Walk to Car: 3 min Drive to Coffee Shop: 15 min
Wait in Line: 10 min
Order and pay for coffee: 1 min Wait for coffee: 7 min
Receive coffee: 5 sec Total NVA time = 35 min Total VA time = 1.1 min
• Making Woodward and Bernstein proud: Investigating your value stream like a reporter. Ask the
right questions: 5 Ws and 1 H: What, when, why, there, who, and how. Make a spaghetti diagram: Using a map of the area, trace the movement of one process. Use colors to differentiate different aspects of the process. Analyze ways to simplify movements.
7

Notes on Continuous Process Improvement 13 August 2007
Using Qualitative Tools. There are (7) qualitative tools:
• Relations Diagrams: Relating to each other. Show complex relationships with a graphic. Use index cards. ID the central problem. Identify all the causes, one per card. Group similar causes together. Indicate cause-and-effect with arrows. Highlight principal causal relationships.
• Affinity Diagrams: Like meets like. Show families of information during brainstorming. Use index cards. ID ideas, one per card. Group cards, title groups. Arrange groups: taxonomy and subcategories.
• Tree Diagrams: From trunk to leaves. Work breakdown structure deconstructs complex work into bite-sized pieces. Figure 3-4 on p 68 is an example.
• Matrix Diagrams: Where information meets. Two lists of information form two sides of a matrix. Relationships are shown at intersections.
• Matrix Data Analysis Charts: Comparing multiple characteristics. Compares multiple items to multiple characteristics.
• Process Decision Program Charts: Understanding and mitigating risk. Identifies possible risks and countermeasures. Great for new products.
• Activity Networks or Arrow Diagrams: Networking activities. Map a series of activities, timing, critical path, and dependencies.
• Working with Software Tools. Programs exist to capture, analyze, and display data. Chapter 8: Flow and Pull Tools Flow. No stops for queues or inventory. No unnecessary movement or transport.
• Establishing order through 5S. Organized workplace: Sort, Straighten, Scrub, Systemize, Standardize.
• Take one, make one. The ideal state is production calibrated exactly to demand. Work modules contain all the functions that take a product from start to finish. Bottlenecks limit throughput, and thus need to be analyzed and optimized.
• Preventing blockages to flow. Ensure quality at the source – before passing it along. Use error-proofing techniques.
Pull
• Smoothing out the bumps. Do not make large batches, make a small amount every day.
• Signaling replenishment. Avoid forecasting, this is push. Capture a demand indicator daily. Any inventory at each step is known as a “supermarket.”
• Changing logistics.
8

Notes on Continuous Process Improvement 13 August 2007
Chapter 9: Perfection Tools Beginning with Standardized Work. Standardization is essential. Standardization is powerful. All performance must be compared to a standard. Standardized work is the foundation for all process improvements. Without standardized work, you have no basis to understand your challenges – no way to measure to improve.
• Guiding rules for Standardized Work. (5) rules govern standardized work: (1) Adjust to human effectiveness, not machine efficiency. Optimize people, not machines. (2) Standardize all repetitive work. (3) Keep the equipment in condition to support work requirements. (4) Make standardized worksheets visible and accessible. (5) Revise regularly. People will routinely find improvements.
• Implementing Standardized Work. Documented, measurable, and repeatable:
(1) Check equipment. (2) Check time. Check cycle time versus takt time. (3) Check work-in-progress (WIP). Minimize WIP. Define processes to minimize WIP. (4) Post it. Post standard instructions. Instruction sheets. Manuals. (5) Monitor, measure, and manage. Identify the causes of all variance to standardized work. (6) Adjust and update. When standards are out of date, people will learn to ignore standards. Standardized work is one of the most important tools of a Lean enterprise.
Improving with Kaizen. Kaizen is continuous incremental improvement. A Kaizen event is typically a five-day Plan-Do-Check-Act (PDCA) cycle focused on a specific challenge. Seeing is Knowing: Visual-Management Tools. A picture is worth a thousand words.
• Andon. Communicate important messages: queue times, inventory levels, failure rates.
• Display boards. Communications centers with standardized data charts.
• Cross-training charts. Track who is trained.
• Pictograms. Visually show where defects occur. Everyday Improvement Tools
• The 5 Whys. Keep asking “why” until you reach the true heart of the problem.
• The seven basic tools of quality: (1) Cause-and-Effect diagram. Fishbone diagram. Represents influences on an outcome. (2) Pareto Chart. 20% of the causes affect 80% of the outcome. (3) Check Sheets. Standard chart to capture data on a process. (4) Scatter plots. Show relationships at a glance. (5) Box charts. Compare differences in small sample of data. (6) Histogram. How frequently something occurs. (7) Control Chart. Most important tool in statistical control.
Computer Tools
9

Notes on Continuous Process Improvement 13 August 2007
Chapter 10: Management Tools Management Strategy. Lean is a big picture initiative. You need to measure the right things. Management tools are visual. Create a master plan. Simplify, eliminate, automate, then integrate. Eliminate waste everywhere.
• Hoshin: Balanced planning. Set direction, set objectives, set standards. Insure wide understanding. Lean recommends a seven-step planning process. Standardized table or reports are nested at each level to insure continuity of action throughout the organization: Header, situation, objective, milestones (when objective is achieved), strategies, measures (track strategies).
• The Balanced Scorecard. Evaluates along four lines: financial, customer, process, and learning.
• BAM! BAM! Management dashboards. Simple to read, key process metrics on the computer.
• Creepy, crawly spider charts. Show several business metrics on a single display.
Go and See. Communications centers display vital information kept current by the team.
• Genchi genbutsu. Go to the actual scene and confirm what is happening.
• Gemba walks. Observation tours. Focus on one thing. Ask questions to learn. Build relationships. Learn to observe with Lean eyes. Train others to observe. Review performance metrics. Review reports. Talk to people to understand what they do. Connect local issues with global strategy – help people make the connection. Stress the importance of orderly environment. Practice standardized work. Connect.
Software and Information Management
• Lean facilitation software.
• Statistics and graphical analysis. Excel is good. Minitab does high-powered statistics.
• Business Process Management. Software that lets you define key business metrics and then track them will enhance any Lean enterprise.
10
Notes on Continuous Process Improvement 13 August 2007
Part IV: The Lean Enterprise Chapter 11: Lean in the Organization: Principles, Behaviors, and Change Assessing Organizational Culture. People give an organization its culture. Culture is deeply ingrained. Culture drives success. How does your culture align with Lean?
• Will the real principles please stand up? Stated principles often differ from, or worse contradict, actual principles. Actual principals are defined by behaviors and attitudes of people.
• Getting the culture to the starting line. Identify the current principals. How is change accepted? Lean is continuous incremental change. Customer satisfaction and respect for people are key.
• Measuring the gap. Create a matrix to analyze the gaps between your principals and Lean principals. Changing the Organization
• Going through the five phases of change. Recognition (today’s conditions are not workable), Planning (paint a future vision), Charging forward (communicate and change behavior), Turmoil, Integration.
• Hurdling roadblocks to success (1) “Rules are made to be broke” versus “Standards are meant to be followed then improved.” (2) Cowboy individualism. There is no room for those who refuse to operate with standardized work. (3) Fear of the unknown and job loss. People fear the unknown. (4) Resistance to change – what’s in it for me? (5) Been there, done that.
Forecasting the Future. Turning an organization, like a supertanker, is nudge, nudge, nudge.
• The journey that never ends. The journey never ends. Lean’s continuous improvement is a journey.
• Propagating the principles. Communication is the most important lever to change. Everyone is responsible. Messages must be broadcast on all frequencies.
• Differentiating the parts from the whole. You must address the human element of change.
11

Notes on Continuous Process Improvement 13 August 2007
Chapter 12: Power to the People. “People are not the most important part of an organization, people are the organization.” Inquire, check with your people, and get ideas and reactions. The Human Side of Change. Motivation is the fire within. If someone else lights it, it will burn very briefly.
• Change and the individual. Perception is reality. Overcome individual resistance to change. Adjust the language to fit your own culture. Minimize stress. Take before and after pictures. Celebrate wins. Know your own principles. Compare yours to Lean. Make adjustments. In traditional organizations, people are taught to do one task, as fast as they can, with no external connections. Stockpiling, working in isolation, hiding mistakes, and only bearing good news have no place in Lean. People learn differently: Visual, Verbal, Logical, and Kinesthetic. Effective communication must approach each style differently.
• Change and the team. A winning team is willing to share, constantly engaged, capitalizes on individual strengths, is aligned to a common goal, and is able to learn together. Emphasize collaboration and multifunctional workers. Post cross-training charts.
• Change and the managers. Create a clear vision of the goal: performance expectations, timing, expected outcomes. Move people from compliance to commitment. Communicate: people need to hear you. People need to be heard by you. Create a communications team from various parts of the organization – to share the message and to listen to the feedback. Managers have to learn to be collaborative. Address your people’s needs. Lean executives demonstrate: (1) Unrelenting focus on the customer (2) Maximum value added (3) Visual management (4) Living 5S (5) Elimination of waste (6) Consistent leadership (7) Respect for people – don’t waste people’s potential.
The Master and the Students
• The Lean sensei. Hiring a master is recommended for their broad understanding and new perspective. • Lean students. Everyone is a student. Elementary concepts and tools are followed by implementation
lessons. Four skill areas apply: (1) Technical skills, (2) Interpersonal skills, (3) Strategy and planning skills, and (4) Real world experience.
12

Notes on Continuous Process Improvement 13 August 2007
Chapter 13: Go Lean: Implementation Strategy, Startup, and Evolution Lean is a journey. Assess your journey based on your specific needs. Preparing to Go Lean. Lean needs to be owned and encouraged from the top. Lean is action-oriented. Lean requires continuous learning.
• Starting from the top. Senior managers must endorse and participate. People respond to leadership cues, behaviors, recognitions, and performance standards and measures. Managers standardize their work – reports, meetings, inspections, time. Leaders set the vision. Leaders lead by example. Leaders develop visual controls. Leaders are accountable for performance. Leaders are continuously learning.
• Creating the Lean infrastructure. Support elements must exist before your begin to change. (1) Expertise. Hire an expert sensei to help you plan your journey and then lead initial teams.
(2) Policies. People policies must be adjusted to reward Lean behaviors. Money, assignments,
structures, recognition, promotion. (3) Training. Lean courseware. Train on the Lean toolkit: Chapters 7, 8, 9, and 10. (4) People. People at all levels need training. (5) Tools. Put support tools in place: statistical software, graphic software, video / still cameras.
Beginning the Journey: The Lean Rollout. Do not make the rollout event a big deal.
• Minding the big picture. Lean is small, incremental improvements done all over the organization. Keep things focused on the value stream. Avoid sub-optimizing – improving one process at the expense of the whole. Your organization must understand the tools: Chapters 7, 8, 9, and 10. Enlist volunteers to communicate direction, progress, and success.
• Picking the startup point. Find the greatest opportunity or challenge in the organization. Fixing this
will motivate the organization. What will have the greatest impact on the customer? What improvement will be visually most noticed? Removing inventory, reducing setup time, reducing repair times.
• Creating awareness. Create a buzz. Listen. Communicate progress. Reinforce the long-term view. • Avoiding program-of-the-month syndrome. Credibility. Differentiate your program from previous.
Put things in perspective. Do not over-promise. Set solid expectations for measurable results. • Measurements: The enterprise at a glance. Determine the relevant measurements for your
organization. Tie your Lean initiatives to these top-level metrics. Process metrics are sometimes needed – percent people trained – but production metrics are best.
Living Lean
• The Lean evolution. After training rollout, after some kaizen events and success, people start to believe that Lean is valid. Do not declare success! Complacency kills. Develop a project-oriented mindset to continue to press ahead. It takes years to adjust a culture that is inwardly and outwardly Lean.
13

Notes on Continuous Process Improvement 13 August 2007
When people start examining their outside world, examining cause-and-effect conditions, and explore the business relationships better, Lean is internalized. People develop a holistic view. This decreases functional sub-optimization where effort is spent fixing local problems that don’t matter to the big picture. Functional sub-optimization is a symptom of inward focus. Diverting resources to strengthening a strong link when weak links exist isn’t a smart move. Eliminating waste is not about moving waste to another location. Don’t move waste, eliminate it.
• Building the learning organization. Lean organizations have a zest for learning. It is contagiously
curious. A learning organization shares mutual trust and comfort to examine mistakes, not finger-point. The learning organization shares “tribal” knowledge. (1) Education priority (2) Cross-training (3) Contributions to increased knowledge are rewarded (4) Early morning education and lunch-and-learn sessions are held (5) People stop to train someone who needs it (6) Formal mentorship program (7) Libraries and on-line references are available (8) Book-review discussions and symposiums are held (9) People write papers (10) People participate in on-line blogs
• Creating the continuous-improvement mindset. Learning must be followed by application and
progress. Continuous improvement is an optimistic mindset, a marathon runner.
• Facilitating with finance. Financial benefits must be adjusted. This works best if demonstrated financial benefits can be shown. Standard accounting practices don’t often support or capture Lean improvements. Because Lean cuts across functional boundaries, traditional measures don’t support the Lean organization.
• Getting support from IT. Specific tools and specific reporting procedures need IT support. Business
activity monitoring (BAM) and business process management (BPM) are specialized applications that collect, analyze, and monitor data, and can support Lean initiatives, especially in respect to visual management. Enterprise resource planning (ERP) systems that lock-in assumptions and operational frameworks that are counter to Lean should not be used.
• Now I am the master. Experienced and educated workers become more valuable, initiate their own
projects, and identify their own issues to address.
14

Notes on Continuous Process Improvement 13 August 2007
Chapter 14: Lean within the Enterprise. Lean philosophy improves all processes. Lean Enterprise Management. Lean enterprise people consider the whole business system.
• It’s a Lean, Lean, Lean world. Transactions can be Lean, especially in saving time, facilities, energy, and, most importantly, people
• Leaning up the support functions Finance and Administration need Lean: Contracting, accounting, mail, copy, legal, and travel groups all suffer from waste. HR has performance measures: new-hire cycle time, recruiting, benefits, training and administration, employee satisfaction and retention. IT needs Lean: Customer focus, reduction of NVA, customer pull, the end of batching.
Lean Product Development
• Product development: The systems approach. People, processes, and technology are integrated. • Hearing the voice of the customer. Development process should be bonded to the customer. • Front-loading the engineering process.
• Concurrent engineering. Concurrent development eliminates problems before they arise.
• Genchi genbutsu: Go and see. An engineer should never be more than a stone’s throw away from the
actual product.
• Rigorous standardization – for maximum flexibility. Quirky, inventive culture needs Lean to enable creativity. Predictable, measurable Lean work standards eliminate noise and clutter allowing creativity.
• Designing for manufacture. Collaboration between design and manufacturing functions. • Built-in learning. Make new training part of every day, every process, and every review.
• A few words about software development.
Lean Supplier Management. Make your value stream map organization-independent. Seamless integration between organizations is tough. VA, information flow, effective admin, uninterrupted flow, and inventory management are the goals.
• Behaving like one entity: The architecture of supply. Supply chains tend to tier. Simplify toward the fewest number of suppliers, fewest number of parts.
• Binding the links. Establish stable long-term relationships in order to lower fixed costs and focus on
continuously lowering variable costs.
• Let it flow. Flow information freely with suppliers in order to build relationships. Development and demand information empower your suppliers.
15

Notes on Continuous Process Improvement 13 August 2007
• Logistics. Manage a continuous flow of supplies to reduce inventory, stocking, and cycle time.
• Positioning stock strategically in the chain. Hold stock near the end of the chain, ready for the customer.
Lean Production Processes. Produce more with less (energy, time, inventory, people, and capital), and improve quality. Lean techniques, Chapters 7 – 10, lower production costs, improve product quality, shorten time to delivery, and improve employee morale. All this while delighting the customer.
• The customer defines value. Processes focus on adding value. • Reduce and eliminate waste: time, energy, space, people, and capital. • Focus on processes that produce outcomes. • Practice continuous flow. March to a cadence. • Produce small lots, every day. Move to single-piece flow. • Eliminate inventory and storage. Move to demand pull. • Practice Kaizen – continuously improve processes.
Lean Customer Management. The customer drives demand, sets expectations, and evaluates the results. Analyze customer interactions, handoffs, errors, longevity. Woo your customers for life. Bring high levels of satisfaction to the customer.
• Selling the customer.
• Servicing the customer. The customer relationship is markedly different in business-to-business relationships.
Lean and the Quality Organization. Quality is not an afterthought. Quality is preventive, not reactive.
16

Notes on Continuous Process Improvement 13 August 2007
Chapter 15: Lean across Industry Starting with What’s Common. Lean manufacturing is the same for services and government. All ventures have customers. All have processes. All have employees. Look for commonalities when you translate Lean to your organization:
• Understand issues. What are your mistakes? • Understand your customers. • Map your value stream. • Calculate takt time. • Be clear about goals and objectives. • Identify waste. • Implement Kaizen. • 5S your work environment. • Evaluate your Lean toolbox.
Lean Manufacturing
• From batch to flow. Remove all obstacles to flow. Create work modules. Quality at the source. Work in teams, with less levels of management, and fewer support people.
• Safety: “The sixth S”
• Reducing inventory. Inventory is waste.
• Kanban, just-in-time, and the pull system. Push systems rely on forecasts. This creates large
inventories, and large inventory carrying costs. A kanban system reorders parts based on actual consumption.
• Volume and variety. Make everything the same way every day. Lean is for high-volume, standardized
environments. Lean Services. Service industries are pure process environments. Lean is directly applicable: Reduce transaction times, reduce cost of transaction, increase customer satisfaction, and improve employee morale. Attack speed and quality, simplify complexity, and empower employees.
• Commercial services versus internal services.
• A service is a product, too! Service rework is a significant problem. Services have specifications for quality, performance, timeliness, and price.
• The seven forms of service waste:
Transportation. NVA movement of people, goods, and information. Waiting. People, systems, materials, or information waiting is waste. Overproduction. Are your services producing sooner, faster, or in greater quantities than needed? Defects. Defective services do not deliver what the customer needs. Inventory. Are certain services half-finished? Movement. Are activities, paperwork, and other efforts unnecessarily juggled? Extra Processing. How much extra effort do people do in order to deliver the service?
17

Notes on Continuous Process Improvement 13 August 2007
• Improving services the Lean way. Services can really benefit from the pull concept: when customers request a service. A key to a Lean service is developing common services, the building blocks that permit flexible assembly of multiple options. 5S in services. Sort, Straighten, scrub, Systematize, Standardize. Speed and Quality. Deliver customer value faster. Fast services need less hands, less steps, less rework. Check variety. Decrease complexity in processes. Frontline power. Decision-making shifts closer to customer. Empower front-line staff.
Lean Transactions. Cubicles deny collaboration. Factories don’t have walls, why should offices? Lean Government. Government is in it for the long haul and can focus on continuous incremental change: shorten cycle times, improve service quality, increase productivity, increase customer satisfaction, and reduce waste. The largest barrier to implementation is providing appropriate skills. Lean in Healthcare
• Improving healthcare through Lean. Fewer mistakes, reduced wait times, reduced costs.
• Defining waste in healthcare. TWODIME. Lean Everywhere
• Nonprofit organizations
• Retail See Figure 15-2 for a visual aid to standardize work cleaning the restroom.
18
Notes on Continuous Process Improvement 13 August 2007
Part V: The Part of Tens Chapter 16: Ten Best Practices of Lean
• Satisfy the customer AND deliver value – this is the heart of Lean. • Lean is a journey. • Keep things simple, visual, and people-focused.
Feel the Force (of the Customer), Luke. Align EVERYTHING to the customer – like the force of gravity. Step by step, Inch by Inch. Lean is a journey, a tortoise seeking the relentless pursuit of excellence. Follow the Value Stream. Eddies are distractors. Help your people see and understand customer value. Eat Your Vegetables. Don’t pick and choose the tools you like, use a balanced Lean approach. Turn Over a Rock. Under every rock there is opportunity to find and eliminate waste. People First! People are motivated and rewarded by success, not procedures or tools. Focus on people. Genchi Gambutsu. Go and see. Get out of the office. The Art of Simplicity. KISS. When in doubt, simplify and eliminate. At a Glance. Display key information. Everyone should understand the state of affairs at-a-glance. Standardize Something – Standardize Everything! Measure effectiveness. Don’t reinvent every time. Chapter 17: Ten Pitfalls to Avoid Yawn. Fight complacency: communicate, update, track competitors, measure progress, punitive measures. Same-Old Same Old Senior Management. Without senior support, it simply won’t happen. Quick Fix! Lean is continuous. Cherry-Picking. Avoid piecemeal application of individual tools. Beans Are Beans. Change the definitions of cost and value. Change your accounting methods. Playing the Shell Game. Moving waste to another shell is NOT improving the entire system. The Grease Monkeys. Using a tool is NOT transforming a culture. Busy Bees. Activity is NOT progress. Insure your Lean activities add value. Stuck in the Middle Again. Middle managers are enablers who break down walls. Lean Six Sigma. Lean tools have been borrowed by Six Sigma consultants.
19

Notes on Continuous Process Improvement 13 August 2007
Chapter 18: Ten Places to Go for Help Books and Publications. www.productivitypress.comOnline Information:
• www.syque.com/quality_tools/index.htm • www.theleanlibrary.com • www.lean.org • www.gemba.com • www.leanqad.com
Blog Sites
• http://kanban.blogspot.com • http://kaikaku.typepad.com • http://leaninsider.productivitypress.com • http://superfactory.typepad.com/blog • http://leanreflect.blogspot.com • http://innovationtools.com • www.gembapantarei.com
Professional Societies and Associations
• The Society of Manufacturing Engineers (SME) www.sme.org • The Association of Manufacturing Excellence (AME) www.ame.org • Shingo Prize www.shingoprize.org • Manufacturing Extension Partnership (MEP) www.mep.nest.gov
Conferences and Symposia Consultants, Facilitators, and Trainers. Lean Education Academic Network (LEAN): www.teachinglean.org Lean Periodicals
• Lean Directions www.sme.org/leandirections • Target www.ame.org • Superfactory Online Newsletter www.superfactory.com
Software Providers Practitioners Related Genres
20

Notes on Continuous Process Improvement 13 August 2007
Glossary 5S Sort, Straighten, Scrub, Systemize, Standardize 5 Whys Ask “why?” until you arrive at the root of the problem. Batch and queue Production method of accumulating material in a batch in order to push the batch through
the process. Also called mass production or traditional manufacturing. Bottleneck A process that constricts or limits the flow of the overall process
Inventory Raw materials, work-in-progress, and finished goods not yet delivered Metric a measure considered as a key indicator of performance Monument A unit or piece of equipment that cannot be moved. NVA Non-value-added
Standardized work A process with a set work sequence and established in-process inventory Takt time A pull concept: Production rate is tied to the customer’s rate of need or consumption. TWODIME The seven forms of waste: Transportation, Waiting, Overproduction, Defects, Inventory,
Movement, Extra Processing
VA Value-added: The customer must be willing to pay for it. The product must be transformed. The process must be done correctly the first time.
Value stream The flow of materials and information through a process to deliver a product. VOC Voice of the customer
VSM Value Stream Map WIP Work-in-Progress. In-process inventory. Reviewer’s Comments Lean for Dummies is a great resource. The concepts of Lean are introduced in a simple manner. The language of the Lean discipline, particularly the imported Japanese words, is explained well. I would have liked to see more real-world examples of the Lean concepts in action. Some chapters repeat earlier ideas and the book would have benefited from more content editing. Overall, however, the text was simple to understand, generic enough for all readers, and the supporting arguments in favor of Lean were compelling. A good introductory work, but I feel additional texts will be required in order to apply Lean to a given environment. Prepared by: LtCol Brendan B. McBreen, 1st RTBn, RTR, MCRD PISC, 843-228-2467, [email protected]
21