leam: an interactive system for in-situ visual text analysis
TRANSCRIPT

Leam: An Interactive System for In-situ Visual Text AnalysisSajjadur Rahman
Megagon [email protected]
Peter GriggsMIT
Çağatay DemiralpSigma Computing
ABSTRACTWith the increase in scale and availability of digital text gen-erated on the web, enterprises such as online retailers andaggregators often use text analytics to mine and analyze thedata to improve their services and products alike. Text dataanalysis is an iterative, non-linear process with diverse work-flows spanning multiple stages, from data cleaning to visual-ization. Existing text analytics systems usually accommodatea subset of these stages and often fail to address challengesrelated to data heterogeneity, provenance, workflow reusabil-ity and reproducibility, and compatibility with establishedpractices. Based on a set of design considerations we derivefrom these challenges, we propose Leam, a system that treatsthe text analysis process as a single continuum by combiningadvantages of computational notebooks, spreadsheets, andvisualization tools. Leam features an interactive user interfacefor running text analysis workflows, a new data model formanaging multiple atomic and composite data types, and anexpressive algebra that captures diverse sets of operationsrepresenting various stages of text analysis and enables coor-dination among different components of the system, includingdata, code, and visualizations. We report our current progressin Leam development while demonstrating its usefulness withusage examples. Finally, we outline a number of enhancementsto Leam and identify several research directions for developingan interactive visual text analysis system.
1 INTRODUCTIONWith the rapid growth of the e-commerce economy, the in-ternet has become the platform for many of our everydayactivities, from shopping to dating, to job searching, to travelbooking. A recent study projects the worldwide e-commercesales to be around six trillion dollars by 2023 [28], nearly a 50%increase over the current market. This growth has contributedto the proliferation of digital text, particularly user-generatedtext (reviews, Q&As, discussions), which often contain usefulinformation for improving the services and products on theweb. Enterprises increasingly adopt text mining technologiesto extract, analyze, and summarize such information from theunstructured text data. Like data analysis at large, text dataanalysis also benefits from interactive workflows and visual-izations as they facilitate accessible, rapid iterative analysis.Therefore, we characterize the text data analysis process moreformally as visual interactive text analysis (VITA hereafter).A challenging aspect of VITA is its iterative and nonlinear
This article is published under a Creative Commons Attribution License(http://creativecommons.org/licenses/by/3.0/), which permits distribution andreproduction in any medium as well allowing derivative works, provided thatyou attribute the original work to the author(s) and CIDR 2021.CIDR’21, January 10-13, 2021, Chaminade, USA.,© 2020
nature—it is a multistage process that involves tasks like datapreprocessing and transformation, model building, hypothesistesting, and insight exploration, all of which require multipleiterations to obtain satisfactory outcomes.
While many commercial and open-source tools support var-ious stages of VITA [17, 26], none of these capture the end-to-end VITA pipeline. For example, spreadsheets support directlyprocessing and manipulating data, computational notebooksenable flexible exploratory analysis and modeling, and visu-alization systems, typically based on chart templates, facil-itate quick interactive visual analysis. There are also manycustomized text analytics tools [17], often in the form of re-search prototypes, that support specific use-cases like reviewexploration [34], sentiment analysis [14], and text summariza-tion [8]. Unfortunately, none of these solutions accommodatethe inherently cyclic, trial-and-error-based nature of VITApipelines in an integrated manner.
In[3]:
A
B
C
LEAM
{"data": {...}, "combine": [ {"class": “aggregate”, ...}, {"class": “visualize”, ...} ]}
E
vis1 = vis_view.get_vis(0)vis1.select("comfy")
In[1]: col = data.get(“reviews”)
In[4]: vis1.coordinate(table_view)vis1.select("comfy")
In[2]: col.visualize(“barchart”)
Enter command here...
vis1 = vis_view.get_vis(0)vis1.select("comfy")
In[3]:
D
F
Visualize Bar chart review
Figure 1: Leam user interface. (A) Operator View enables usersto perform visual text analytics (VITA) operations using drop-down menus, (B) Visualization View holds a carousel of inter-active visualizations created by users, (C) Table View displaysthe data and its subsequent transformations, and (D) NotebookView allows users to compose and run VITA operations usinga declarative language. Inset (E) shows the VTA json specifi-cation for the bar chart operator in Operator View. Inset (F)shows a declarative VTA command for interacting with the barchart from Notebook View.
While supporting the entire VITA life-cycle within a sin-gle system does seem natural, developing it leads to severalchallenges related to (a) extensibility and expressivity of VITAworkflows, (b) their continuity and reproducibility, (c) dataheterogeneity and provenance, and (d) synchronization of userinteractions.We document these challenges in Section 2. Thesechallenges are a culmination of (1) our conversations with prac-titioners while working in an industry research lab, part of alarger company with more than three hundred e-commercesubsidiaries, (2) prior research, particularly those reporting
1

CIDR’21, January 10-13, 2021, Chaminade, USA., S. Rahman et al.
from interview studies on data analysis workflows [16, 34],and (3) our experience in developing and evaluating interactivedata systems. As such, the list of challenges here is intendedto be a useful guide informing research and development ontext analytics systems, not a comprehensive enumeration, andinevitably reflects our personal taste. We propose a set of de-sign criteria (desiderata) to address the challenges of a VITAsystem (Section 2). One crucial theme underlying these criteriais the consideration of data analysis as a single continuum,not as discrete steps of tasks performed in isolation.
In this paper, we introduce Leam, a one-stop-shop for vi-sual interactive text analysis. Leam combines the advantagesof spreadsheets, computational notebooks, and visualizationtools by integrating a Notebook View with interactive viewsof raw and transformed data (Figure 1). A key component inthe design of Leam is a visual text algebra (VTA) that enablesusers to specify complex VITA operations over heterogeneousdata and their visual representations; either using a declar-ative language in the Notebook View (Figure 1F) or by cre-ating operators in the front-end that translates to json-styleVTA specifications (Figure 1E). Through usage examples, wedemonstrate the expressivity of VTA and how it enables Leamto support diverse tasks ranging from data cleaning to visual-ization. Moreover, to facilitate efficient execution of VTA onheterogeneous data, we introduce a new data model extendingdataframes called VITAframe. Based on our experience indeveloping Leam, we have identified several system designchallenges related to storage model efficiency, scalable com-putation of VITA workflows, data and workflow versioning,and workflow optimization. To address these challenges, weidentify several research directions that may enhance the ca-pabilities of Leam. We have made the current version of Leamopen-source at https://github.com/megagonlabs/leam.
The goal of this paper is to explore challenges in and designconsiderations for VITA systems development, present vitalcomponents of Leam that enable interactive text analysis (e.g.,VITAframe and VTA), and identify some concrete researchdirections based on our experience of developing Leam.
2 VITA: CHALLENGES AND DESIGN GOALMotivatingExample.Ada, a data scientist in the e-commercedepartment of a retail business, has been tasked to analyzecustomer reviews of products purchased from their website.Ada would like to capture the underlying topics by performingtopic modeling and clustering to characterize the review cor-pus better. Figure 2 captures the use-case which involves—(a)preprocessing the data (clean), creating feature vectors fromthe text reviews (featurize), creating topic vectors from thecorpus (topic modeling), clustering reviews into topics (clusterassignment), and finally, visualizing the clusters by projectingthe topics vectors to lower dimensions (2D) using feature trans-formation techniques such as PCA (visualize). In practice, theworkflow may be non-linear, and each step may require mul-tiple passes and different tools. In the process, visualizationsare useful not only for exploratory analysis or final presenta-tion but also for every other step—VITA workflows resemblethe read-eval-print loop (REPL) approach where users perform
Figure 2: An example VITA use-case: topic exploration.
incremental operations on data and examine intermediate re-sults. We now characterize the challenges of the existing VITAworkflows in the context of this use-case as follows:C1. Workflow discontinuity. As mentioned in Section 1, datascientists lack tools that support different VITA operationsand workflows within an integrated environment. For exam-ple, to define the data cleaning rules, Ada first visually inspectsthe data using tools like spreadsheets. Next, they execute thoserules in a computational notebook, e.g., Jupyter. Upon inspect-ing the data in the spreadsheet, Ada may revise the rules inthe notebook. To visualize top-ranked words after the featur-ization step (e.g., a bar chart of words ranked by their TF-IDFscores), they need to either use dedicated visualization toolsor write scripts in the notebook. Therefore, even completingsimple tasks may require accessing different tools, which canbe a cumbersome user experience due to, for example, thelogistical and cognitive overhead of context switching.C2. Limited coordination.VITA necessitates coordination amongdifferent views (e.g., between visualization and raw data). Thehigh dimensional text data can be difficult to interpret, andusers often map different facets of the data to visualizationsfor better interpretability. However, without coordination be-tween perceptual components and the data space, understand-ing the relations between the facets of the same entities ondemand can be challenging. For example, say Ada wants toinspect which reviews contain a top-word in the bar chart(generated after featurization). However, visualizations in note-books or visualization tools are decoupled from the data. Asa result, Ada has to either open and then filter the data in aspreadsheet or programmatically filter the data from the note-book to inspect the relevant reviews. Therefore, the lack ofcoordination impacts both workflow continuity and the user’sability to explore data effectively.C3. Data types and workflow diversity. VITA workflows dealwith heterogeneous data (e.g., text, visualizations) and work-flows (e.g., in use-cases like text summarization, sentimentanalysis). While there are a number of VITA tools for specificworkflows [17], more often than not, these tools use a stack ofindependent solutions for data storage and processing gluedtogether by scripting languages like Python and R. These be-spoke solutions may not capture all VITA requirements, likedirect data manipulation and interactive visual coordination.As a result, users are often forced to develop new and heavilycustomized systems on top of these solutions.C4. On-demand workflow authoring. VITA workflows containa variety of operations, e.g., cleaning, featurization, interac-tive visualization, classification. Similar to relational [10] ordata visualization algebra [25], VITA operations with similarobjectives can be grouped into high-level categories. More-over, operations in different categories can be combined tocompose new operation pipelines. For example, cleaning and
2
Leam: An Interactive System for In-situ Visual Text Analysis CIDR’21, January 10-13, 2021, Chaminade, USA.,
featurization can be combined into a preprocessing pipeline.As existing systems lack any formalization of the operationsand their application, the onus is on the user to design theoptimal analytics workflow for different use-cases.C5. VITA Session management. As demonstrated in the usageexample, VITA workflows inspire the trial-error-correct-styleiterative approach—users often need to reproduce previoussteps of the workflow, make updates, and rerun the subsequentsteps. Therefore, ensuring reproducibility of VITA sessionsrequire management of dataset versions produced by variousoperations, the operation logs, and different states of and in-teractions on the visual representations of the data. Prior workfrom the data management community focused on version-ing structured datasets [12], versioning code for debuggingworkflows [6, 19] and managing deep learning models [18].However, these systems lack support for versioning an end-to-end VITA workflow involving heterogeneous data types anduser interactions spanning multiple views.
3 DESIGN CRITERIAWe propose the following design principles to address thechallenges related to VITA:D1. In-situ analytics. VITA systems should provide a one-stop-shop (C1) where users can directly manipulate (spreadsheets)and visualize (visualization tools) data while writing scripts(notebooks) to immediately view the effects on data and visu-alizations without context switching between tools.D2. Multi-view coordination.Beyond integratingmultiple viewswithin a single interface, VITA systems should enable coordi-nation between these views (C2). Multiple coordinated viewscapture the context of the user’s exploration across differentviews [32] and help users understand the data better as theyview it through different connected representations.D3. Heterogeneous data management.VITA systems should sup-port heterogeneous data types (e.g., texts, visualization), treat-ing them as first-class citizens of the underlying data model(C3). Instead of developing bespoke data management solu-tions, VITA systems should adapt their underlying storagemodel to accommodate these data types and enable tight cou-pling between the data model and the analytical workflows toensure fast and efficient data access.D4. Expressivity and accessibility. VITA systems should pro-vide an expressive specification language to represent andcommunicate the entire breadth of workflows within the do-main (C4). Moreover, the specification language should beaccessible to existing tools to allow more expressive opera-tions. For example, the specification language can be packagedas a Python library with an interactive widget with supportfor a subset of VITA operations in a computational notebook.D5. Provenance.VITA systems should support advanced prove-nance tracking for heterogeneous data types and various work-flows to ensure reproducibility and encourage workflow anddata re-use. Moreover, these systems should track user interac-tions on visual components to enable the versioning of statesand dependencies of different views.
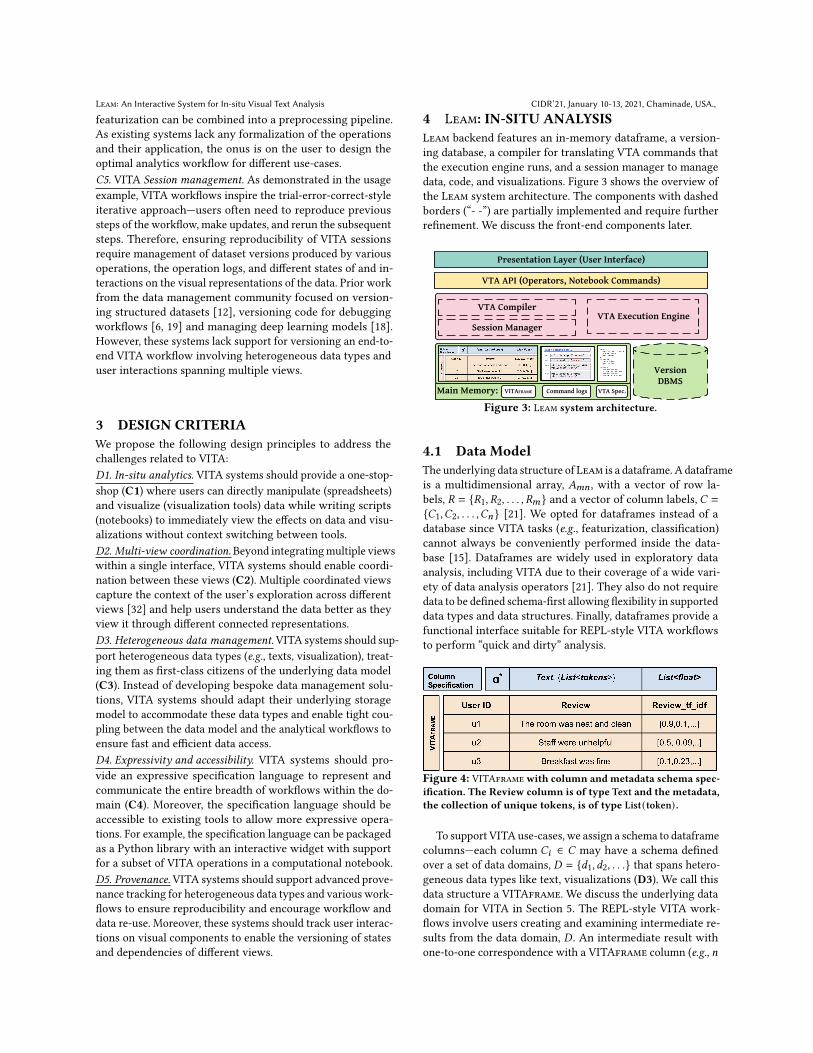
4 Leam: IN-SITU ANALYSISLeam backend features an in-memory dataframe, a version-ing database, a compiler for translating VTA commands thatthe execution engine runs, and a session manager to managedata, code, and visualizations. Figure 3 shows the overview ofthe Leam system architecture. The components with dashedborders (“- -”) are partially implemented and require furtherrefinement. We discuss the front-end components later.
Version DBMS
Main Memory:
VTA Execution EngineVTA Compiler
Session Manager
Presentat ion Layer (User Inter face)
VTA API (Operators, Notebook Commands)
VITAFRAME Command logs VTA Spec.
Figure 3: Leam system architecture.
4.1 Data ModelThe underlying data structure of Leam is a dataframe. A dataframeis a multidimensional array, 𝐴𝑚𝑛 , with a vector of row la-bels, 𝑅 = {𝑅1, 𝑅2, . . . , 𝑅𝑚} and a vector of column labels, 𝐶 =
{𝐶1,𝐶2, . . . ,𝐶𝑛} [21]. We opted for dataframes instead of adatabase since VITA tasks (e.g., featurization, classification)cannot always be conveniently performed inside the data-base [15]. Dataframes are widely used in exploratory dataanalysis, including VITA due to their coverage of a wide vari-ety of data analysis operators [21]. They also do not requiredata to be defined schema-first allowing flexibility in supporteddata types and data structures. Finally, dataframes provide afunctional interface suitable for REPL-style VITA workflowsto perform “quick and dirty” analysis.
Figure 4: VITAframewith column and metadata schema spec-ification. The Review column is of type Text and the metadata,the collection of unique tokens, is of type List(token) .
To supportVITA use-cases, we assign a schema to dataframecolumns—each column 𝐶𝑖 ∈ 𝐶 may have a schema definedover a set of data domains, 𝐷 = {𝑑1, 𝑑2, . . .} that spans hetero-geneous data types like text, visualizations (D3). We call thisdata structure a VITAframe. We discuss the underlying datadomain for VITA in Section 5. The REPL-style VITA work-flows involve users creating and examining intermediate re-sults from the data domain, 𝐷 . An intermediate result withone-to-one correspondence with a VITAframe column (e.g., 𝑛
3

CIDR’21, January 10-13, 2021, Chaminade, USA., S. Rahman et al.
reviews are featurized into 𝑛 feature vectors) is added as a newcolumn. However, these results may not have one-to-one cor-respondence (e.g., dictionary of words in the set of 𝑛 reviews)and are stored in a separate data structure as metadata of thecorresponding column. Therefore, for each column 𝐶𝑖 ∈ 𝐶 ina VITAframe, there is a schema specification function thatassigns a domain 𝑑 𝑗 ∈ 𝐷 to the column and a domain 𝑑𝑘 ∈ 𝐷
for each column metadata (see Figure 4). Metadata is oftenused for computing aggregate statistics and visualizations.
4.2 Computation ModelVTA Compiler. In Section 5, we present VTA, an algebra forspecifying VITA operations. Leam compiles the user interac-tions on Operator View (see in Figure 1a) or VTA commandsin Notebook View (see in Figure 1d) into VTA specifications.However, the VTA specifications are incomplete, in the sensethat they may omit details ranging from visual encoding suchas fonts, line widths to input data type. To resolve these ambi-guities Leam currently uses a rule-based compiler that trans-lates a VTA specification into lower-level operators for theexecution engine to run backend computation (see Section 5).Execution Engine. The VITA execution engine takes thefollowing input generated by the VTA compiler: (1) inputdata schema in 𝐷 and (2) translated VTA specifications. Thetext analysis operations—data preprocessing, featurization,feature transformation/selection), estimation), and more ad-vanced post-processing operations like anomaly detection—are mapped to existing ML and NLP libraries like Spacy, Scikit-learn. While other VTA operators related to visual coordina-tion are mapped to built-in implementations (see Section 5).VersionControl.After each operation, Leam checkpoints thecurrent state of the visualizations, VITAframe, and notebookcommands. The development of a fully functional system forfine-grained (i.e., at operation level) versioning is currently inprogress (D5). We discuss how to support fine-grained versionmanagement of a VITA session involving heterogeneous datatypes, notebook commands, and user interactions in Section 6.
4.3 Leam Front EndLeam user interface has four components—Operator View,Table View, Visualization View, and Notebook View (see Fig-ure 1)—which enables users to perform in-place text analytics(D1). Users can perform various VITA operations using the op-erators in Operator View (see Figure 1a). For example, cleaningthe data in Table View, adding visual summaries in Visualiza-tion View. Table View (see Figure 1c) design is inspired by tra-ditional spreadsheets and tabular data visualization tools [27]and enables users to directly operate on the data. Table Viewdata can be transformed into visual summaries like bar chartsand scatterplots using the visualization operators or VTA com-mands (see Figure 1). The visualizations in Visualization View(see Figure 1b) are displayed as a carousel of charts. Interactivevisualizations are generated by translating the visualizationoperators or commands to Vega-Lite specifications [25]. Note-book View design (see Figure 1d) is inspired by computationalnotebooks and enables users to author VITA workflows us-ing a Python-based VTA library. The different views in Leam
can be linked—interactions on one view are reflected in otherviews (D2). Through VTA, users can declaratively specify in-teractive coordination (e.g., brush-and-linking) between theseviews that are translated to Vega signals [24].
5 VTA: AN ALGEBRA OF VITAWe now discuss our visual text algebra, VTA, in detail. Wedemonstrate how VTA captures various tasks in the usageexample in Section 2 (see Figure 1, 5, and 6).
5.1 VTA SpecificationData domain. VITA involves many data types, including dif-ferent forms of text (e.g., words, tokens, sentences), complexdata types like lists, vectors, and even visualizations. We de-fine the data domain of VITA as 𝐷 = {𝑃, 𝑆}, where 𝑃 and𝑆 are sets of primitive and synthesized (i.e., composite) datatypes. The domains of primitive data types are taken from, 𝑃 =
{𝛼∗, int, float, bool, datetime, List,Vector,Dictionary}. The do-main 𝛼∗ is the set of finite strings over an alphabet 𝛼 . Thedomains of composite data types are taken from, 𝑆 = {Text,Visualizations}. If a schema of the data is not specified up-front, the data is initially assumed to be from the domain𝛼∗. Each domain 𝑑𝑖 ∈ 𝐷 includes a generator function 𝑔𝑖 :𝛼∗ → 𝑑𝑖 which defines the rule for inferring exact data typesof the respective domain. For example, the composite Textdata types (e.g., words, tokens, sentences) are generated us-ing a context free grammar [9]. The generator function ofvisualization data types is defined based on Vega-Lite [25]:Visualizations = (𝑑𝑎𝑡𝑎, 𝑡𝑟𝑎𝑛𝑠 𝑓 𝑜𝑟𝑚𝑠,𝑚𝑎𝑟𝑘_𝑡𝑦𝑝𝑒, 𝑒𝑛𝑐𝑜𝑑𝑖𝑛𝑔𝑠).VTA operators can be specified in a json or as declarative com-mands that are available through a VTA library in Python. Thecurrently implemented VTA operators are listed in Table 1.
Class Operator ExampleSelection selection select, filter
project lowercase, remove_punctuation,remove_stopwords, PCA,remove_emoji, strip_html,remove_url, correct_spellings
Transformation mutate tokenize, tf_idf, 𝑘-means,get_sentiment, predict
aggregate count_tokens, word_scoresset get_unique_values
visualize barchart (horizontal, vertical, stacked),scatterplot, heatmap, line chart
combine combineComposition synthesize synthseize
udf add, applyCoordination internal set_selection_type
external uni_link, bi_link
Table 1: List of VTA operators.
Selection operator. VTA enables the specification of interac-tion through selections. Selection operations select data pointsof interest on which subsequent operations in the workflowmay be performed (e.g., row(s) in Table View, visualizationmark(s) in Visualization View). Supported selection types in-clude a single point (e.g., a table row, marks like a bar or acircle in a chart), a list of points (e.g., rows, bars, or circles), oran interval of points (e.g., ten rows starting from row 𝑖 , circlesin scatterplot within 𝑥-axis range). The selection criteria arespecified by a predicate to determine the set of selected points.Filter is an example of list selection where the selection
4

Leam: An Interactive System for In-situ Visual Text Analysis CIDR’21, January 10-13, 2021, Chaminade, USA.,{ "data": { "view": "explorer.vitaframe", "source": "column”, "name": "review" }, "combine": [ {"class": "project", "type": "lowercase"}, {"class": "project", "type": "stopwords"}, {"class": "set", "type": "unique_tokens"} ], "actions": [ {"action": “update”, ...}, {"action": “update”, ...}, {"action": "add", ... } ]}
{ "data": { "view": "explorer.vitaframe", "source": "column", "name": "review" }, "operator": { "class": "mutate", "type": "tf_idf" }, "actions": [{ "action": "create", "view": "explorer.table”, "target": "column", "name": "review_tf_idf" }]}
{ "data": {...}, "combine": [ {"class": “aggregate”, "type": “AVG”}, {"class": “visualize”, "type": “bar”} ], "actions": [{ "action": “add”, “view”: “explorer.vitaframe”, ... }, { "action": “create”, “view”: “explorer.summary”, ... }]}
(a) Clean and generate metadata (b) Create TF-IDF feature vector (c) Visualize top-words by TF-IDF scoreFigure 5: VTA specification. (a) Create a composite cleaning operator ( lowercase and remove_stopwords) using combine andgenerate metadata (unique_tokens). (b) Create TF-IDF vectors from reviews using mutate operator (added as a new column inTable View). (c) Create a bar chart by combining aggregate (average TF-IDF score for each token) and visualize operator.
predicate is the filtering condition. VTA also supports simi-lar types of selections on visualizations (Figure 6a). Besidesjson specification, users can also perform such selections bywriting commands in Notebook View. For example, Figure 1Fshows how a user can select a bar (e.g., the word “comfy”) inthe bar chart using a VTA command:Transformation operators.While developing Leam, we iden-tified a set of core transformation operators that encompassesthe various VITA workflows. These transforms manipulatethe components of the selection they are applied to. Notethat the core operator set is minimal, and there is room foradding more operators to make VTA more expressive (D4).The transformation operation has five subclasses: project,mutate, aggregate, set, and visualize. The project op-erators change the dimensionality (e.g., LDA, PCA) or cardi-nality (e.g., stopword removal) of the input data or updatethe content (e.g., lowercase). The mutate operator generatesa new representation of the input data (e.g., creates a list oftokens or feature vectors from text). The aggregate operatorcomputes summary statistics of the input data (e.g., averagereview length in a corpus). The set operations enable set-likeoperators on the input data (e.g., get unique tokens in thecorpus). The visualize operator generates visualizations ofdata. Figure 5 captures the data preprocessing phase of theworkflow discussed in Section 2. Ada first cleans the reviewsusing project operators (Figure 5a),then applies a mutateoperator (e.g., TF-IDF feature vector creations) to featurizethe reviews (Figure 5b). Finally, Ada computes the averageTF-IDF score of each word (aggregate) and visualizes thetop ranking words (visualize) using a bar chart (Figure 5c).Composite Transforms. VTA currently supports two com-posite transforms that combine unit transformation operations:combine and synthesize. The combine operator enablesusers to specify an operation pipeline. In Figure 5a, a usercombines two project operations with a set operation intoa single operation. Similarly, in Figure 5c, a user combinesaggregate and visualize operators into a single opera-tion for bar chart creation. The synthesize operator enablesusers to create new operations from these combinations whichcan be reused later. For example, a user can synthesize theprevious cleaning pipeline to be a clean operator which thenbecomes an operation in the Operator View and is used later.
5.2 Multi-view CoordinationSo far, we have explained selections that are defined within asingle view. However, selections that involve multiple viewscannot be captured by a single-view-based specification. Wedefine a coordination operator called coordinate that cap-tures multi-view coordination. For example, in Figure 6a, se-lecting a top-word bar in the bar chart filters relevant reviewsin Table View (Visualization View→ Table View coordination).The coordinate operator needs to also resolve the mappingbetween views and composite selections across views.Mapping coordination. In Figure 6a, there is a one-to-manymapping from the bar chart to Table View—selecting a barfilters two that reviews contain the word in “comfy”. In Fig-ure 6b, there is a one-to-many mapping from the bar chart toscatterplot and a one-to-one mapping from the scatterplot toTable View. Therefore, the coordinate operator needs to re-solve the mapping among views, so that relevant visualizationmarks are selected/highlighted in respective views. Users canspecify the mapping using the type tag in respective selectoperators of the views. For example, in Figure 6a, the userselects type single for the bar chart and multi for Table View.Resolving composite selections. Users can add multiplesingle-view selections to a view. For example, in Figure 6b, theuser adds a link from the bar chart to the scatterplot, whichcreates a multi-view coordination among the bar chart, scatter-plot, and Table View. Selecting a bar in the bar chart highlightsmultiple circles (scatterplot) and reviews (Table View). How-ever, following the top-word selection, the user may select arectangular area in the scatterplot or select multiple reviewsin the table. Currently, Leam only supports independent se-lection. We outline advanced composite specifications such asunion and intersection as future work.
6 Leam ENHANCEMENTSWe now outline our vision for Leam development.Efficient storage model. While VITAframe currently sup-ports data that fits in memory, the datasets will be larger inpractice. So, the storage layer of Leam can enable operationson both in-memory and disk-resident data— an essential re-quirement for scalability. We can leverage scalable dataframessuch as Modin [21] that allows dataframes to exceed memorylimitations. The extension would require integrating the VTAlibrary in Modin and adapting its column definition to includemetadata schema. Another alternative is embedded analyticalsystems that tightly integrate RDBMS with analytical tools
5

CIDR’21, January 10-13, 2021, Chaminade, USA., S. Rahman et al.{ "data": { "view": "explorer.summary", ... }, "coordinate": [ {"class": "select", "type": "single"}, {"class": "select", "type": "multi”} ], "actions": [{ "action": "update", "view": "explorer.summary" },{ "action": "update", "view": "explorer.table” }]}
The beds were plush and comfy.
Review
Friendly stuff, cheap rooms, comfy beds. Free wifi.
"coordinate": [ {"class": "select", "type": "single"}, {"class": "select", "type": “multi”} ]
The beds were plush and comfy.
Review
Friendly stuff, cheap rooms, comfy beds. Free wifi.
(a) Coordination of two views (b) Coordination of three viewsFigure 6:Multi-view coordination. (a) Use the coordinate operator to link the bar chart and Table View. Selecting a bar (word) inthe bar chart triggers a filter by the selected word on Table View . (b) Coordinating the bar chart and scatterplot links the threeviews. Selecting a bar in the bar chart highlights relevant points in the scatterplot, and filters relevant rows in Table View.
and provide fast and efficient access to the data stored withinthem [22]. Leam employs PostgreSQL for session managementand version control. Designing a storage layer that enablesefficient data sharing between VITA sessions and the RDBMSis a possible research direction.Interaction at scale. Leam should provide interactive re-sponses even with larger datasets. One approach is to drawsamples of data progressively and then display approximateresults. Approximate query processing techniques can sup-port operations like aggregate [1–3] and visualize [11,23]. However, providing meaningful intermediate results pro-gressively for operations like classification or clustering ischallenging—how to determine model meta-parameters with-out scanning the complete data? Progressive computation canbe complemented by optimistic analytics [20], where precisecomputations run in the background as users explore approxi-mate results. When there is a significant difference betweenthe approximate and precise results (e.g., classification resultsvary from ground truth), the analyst can decide which partsof the exploration have to be redone. Larger datasets also im-pede direct data manipulation and necessitate the design ofinteractive and navigable representation of Table View [5].Versioning VITA sessions. The Leam versioning system canmaintain a version graph to keep track of fine-grained changesat the unit operation level. Leam needs to consider the storage-latency trade-off as a user adds new nodes to the graph: storingentire data ensures faster session reconstruction at the cost ofstorage while storing delta between subsequent sessions re-duces storage overhead at the cost of increased reconstructiontime. Designing a fine-grained version control system for Leamoffers unique research challenges—besides VITAframe, Leamalso needs to checkpoint: (a) the states of all the front-end com-ponents (e.g., formatting like font, color, the opacity of views),(b) the coordination mappings of views and composite selec-tions, (c) user-defined operator pipelines and custom models,and (d) VTA commands in Notebook View. Existing systemsaddress some of these challenges in isolation (e.g., data [12]and model [18] versioning, workflow debugging [6, 19]).VTA: coverage, accessibility, and automation. Our goal isto increase Leam’s coverage of VITA workflows [17] by in-troducing new VTA operators and adding popular ML andNLP libraries [26] as default operators in Operator View. Wecan further improve Leam’s extensibility by enabling users toadd their custom-built models as new operators in Operator
View and reuse them later. To make VTA more accessible to awider audience, we are working on integrating VTA with aninteractive widget that allows users to issue VTA operatorsfrom Jupyter notebooks. Other goals include automaticallygenerating VITA workflows given an analysis goal [4], recom-mending next operator based on users’ current workflow [33],and training an autoregressive language model like GPT-3 [7]on VTA to automatically compose coordinated views or Leam-style user interface based on user specifications in naturallanguage.VITAworkflow optimization. Operator pipelines in a VITAworkflowmay be executed in various orders. For example, textreviews can be tokenized first and then cleaned or the otherway around. However, tokenizing a cleaned text is less ex-pensive due to it’s smaller cardinality than the original text.We can leverage VTA to design a VITA workflow optimizer,similar to a query optimizer in databases. Other approachesfor workflow optimization can be to introduce parallel execu-tion similar to Modin [21], enabling distributed processing ofpartitions of a VITAframe to speed up computation.Evaluation of Leam. While we demonstrate the expressivityand on-demand workflow authoring capabilities of VTA withseveral usage examples, we did not report the performanceof other Leam components. Future iterations should includeexperiments that evaluate the storage model’s efficiency inmanaging large datasets, storage overhead and responsive-ness of the versioning system, performance of VTA queryoptimizer, and overall interactivity of Leam. Moreover, userstudies should be conducted to evaluate the usability of Leam.
7 RELATEDWORKWe now summarize existing work on VITA, data managementfor data science, and domain-specific algebra design.Visual interactive text analytics. VITA systems employ vi-sualization techniques—both basic (e.g., scatterplot, line chart,treemap) and complex (e.g., word cloud, steam graph, flowgraph) [17]—to numerous uses-cases like review exploration [34],sentiment analysis [14], text summarization [8]. While theseearlier works highlight the appeal of integrating interactivevisualization with text analysis, they lack the generalizabilityof Leam, where users can employ an expressive algebra toauthor different VITA use-cases within a single system.Data management for VITA. Prior work focuses on design-ing systems for scalable computation (e.g., scalable dataframe
6
Leam: An Interactive System for In-situ Visual Text Analysis CIDR’21, January 10-13, 2021, Chaminade, USA.,
and query/operator optimizers [21], caching and prefetchingfor visualization [30]), storage models for efficient data ac-cess [22, 31]. We discussed related work on versioning [6, 12,18, 19], approximate query processing [1–3, 11, 23] in earliersections. Leam builds on the earlier work with specific focuson developing an efficient storage model, enabling scalablecomputation, and performing fine-grained version control.Data model and algebra. Our work takes inspiration fromexisting algebras that provide well-founded semantics for re-lational databases [10], dataframes [13, 21], and interactivevisualizations [24, 25, 29]. Here we introduce a new grammarfor visual text data analytics and interactive view coordination,building on earlier work. To the best of our knowledge, VTAis the first algebra defined for VITA.
8 CONCLUSIONThis paper presents our vision for Leam, an integrated sys-tem that supports VITA workflows end to end. Leam is de-signed based on several design considerations that we derivedby identifying existing challenges in developing VITA sys-tems. Leam enables users to perform interactive text analysisin-situ—direct data manipulation (Table View), REPL-styleanalytics (Notebook View), and coordinated visual data explo-ration (Visualization View). We introduce a novel algebra forvisual text analysis, VTA, that provides a suite of operators toauthor any VITA workflow on-demand and enable differentmodes of coordination among views. We present our currentprogress in developing Leam’s underlying data managementsystem and outline several research directions related to ex-tensibility and coverage of VTA, and storage, computation,and versioning of data and VITA workflows. Addressing thesechallenges requires interdisciplinary research efforts from DB,NLP, HCI, and VIS communities.
REFERENCES[1] Acharya et al. The aqua approximate query answering system. In ACM
SIGMOD, pages 574–576, 1999.[2] Agarwal et al. Blinkdb: queries with bounded errors and bounded response
times on very large data. In ACM EUROSYS, pages 29–42, 2013.[3] Babcock et al. Dynamic sample selection for approximate query processing.
In ACM SIGMOD, pages 539–550, 2003.[4] Bar et al. Automatically generating data exploration sessions using deep
reinforcement learning. In ACM SIGMOD, pages 1527–1537, 2020.
[5] Bendre et al. Faster, higher, stronger: Redesigning spreadsheets for scale.In ICDE, pages 1972–1975. IEEE, 2019.
[6] Brachmann et al. Your notebook is not crumby enough, replace it.[7] Brown et al. Language models are few-shot learners. arXiv preprint
arXiv:2005.14165, 2020.[8] Carenini et al. Interactive multimedia summaries of evaluative text. In IUI,
pages 124–131, 2006.[9] E. Charniak. Statistical parsing with a context-free grammar and word
statistics. AAAI/IAAI, 2005(598-603):18, 1997.[10] E. F. Codd. A relational model of data for large shared data banks. Commun.
ACM, 13(6):377–387, June 1970.[11] Hellerstein et al. Online aggregation. In SIGMOD, pages 171–182, 1997.[12] Huang et al. Orpheusdb: Bolt-on versioning for relational databases.
PVLDB, 10(10), 2017.[13] Hutchison et al. Laradb: A minimalist kernel for linear and relational alge-
bra computation. In ACM SIGMOD Workshop on Algorithms and Systemsfor MapReduce and Beyond, pages 1–10, 2017.
[14] Kucher et al. The state of the art in sentiment visualization. In ComputerGraphics Forum, pages 71–96, 2018.
[15] Lajus et al. Efficient data management and statistics with zero-copy inte-gration. In SSDBM, pages 1–10, 2014.
[16] Lee et al. Demystifying a dark art: Understanding real-world machinelearning model development. arXiv preprint arXiv:2005.01520, 2020.
[17] Liu et al. Bridging text visualization and mining: A task-driven survey.IEEE TVCG, 25(7):2482–2504, 2018.
[18] Miao et al. Modelhub: Towards unified data and lifecycle management fordeep learning. arXiv preprint arXiv:1611.06224, 2016.
[19] Miao et al. Provdb: A system for lifecycle management of collaborativeanalysis workflows. arXiv preprint arXiv:1610.04963, 2016.
[20] Moritz et al. Trust, but verify: Optimistic visualizations of approximatequeries for exploring big data. In SIGCHI, pages 2904–2915, 2017.
[21] Petersohn et al. Towards scalable dataframe systems. PVLDB, 13(11):2033–2046, 2020.
[22] Raasveldt et al. Data mgmt for data science-towards embedded analytics.[23] Rahman et al. I’ve seen" enough" incrementally improving visualizations
to support rapid decision making. PVLDB, 10(11):1262–1273, 2017.[24] Satyanarayan et al. Reactive vega: A streaming dataflow architecture for
declarative interactive visualization. IEEE TVCG, 22(1):659–668, 2015.[25] Satyanarayan et al. Vega-lite: A grammar of interactive graphics. IEEE
TVCG, 23(1):341–350, 2016.[26] Smith et al. The machine learning bazaar: Harnessing the ml ecosystem
for effective system development. In ACM SIGMOD, pages 785–800, 2020.[27] Spenke et al. Focus: the interactive table for product comparison and
selection. In ACM UIST, pages 41–50, 1996.[28] Statista. Retail e-commerce sales worldwide from 2014 to 2023, Mar. 2020.[29] Stolte et al. Polaris: A system for query, analysis, and visualization of
multidimensional relational databases. IEEE TVCG, 8(1):52–65, 2002.[30] Tao et al. Kyrix: Interactive visual data exploration at scale.[31] TileDB Core Team. Tiledb: The universal storage engine, 2020.[32] Wang et al. Guidelines for using multiple views in information visualiza-
tion. In Proc. AVI, pages 110–119, 2000.[33] Yan et al. Auto-suggest: Learning-to-recommend data preparation steps
using data science notebooks. In ACM SIGMOD, pages 1539–1554, 2020.[34] Zhang et al. Teddy: A system for interactive review analysis. In SIGCHI,
pages 1–13, 2020.
7