leaf area index (lai) change detection analysis on loblolly - asprs
TRANSCRIPT

carbon, and energy exchange; net primary productivity (NPP);biomass; rainfall interception; and dry deposition (Gholz,1982; Pierce and Running, 1988; Chason et al., 1991; Gowerand Norman, 1991; Aber, 2001; Hall et al., 2003). Leafsurface area has been quantified in the ratio of leaf area toground surface area, a ratio termed the leaf area index (LAI).LAI has been defined here as one-half the total green leafarea per unit ground surface area (Chen and Black, 1992a).
LAI has been estimated from remote sensing satellitesusing empirical relationships between ground-estimated LAIand vegetation indices derived from primary spectral bands,especially the red and the near-infrared (NIR) wavelengths,taking advantage of the red-edge phenomenon existent withinphotosynthetically active vegetation (Chen et al., 2002; Lee et al., 2004; Schlerf et al., 2005). The contrast betweenthe visible and the NIR wavelengths forms a strong step in theelectromagnetic spectrum of green vegetation between 680and 750 nm that is often referred to as “the red edge.” Manyvegetation indices are predicated on this vegetative featuredetermined by leaf reflectance and transmittance properties,both which are affected by leaf pigments, internal scattering,and leaf water content (Gates et al., 1965; Gausmann et al.,1969; Myers, 1970; Peterson and Running, 1989; Jensen,2000). Healthy vegetation absorbs approximately 80 percentof incoming solar radiation in the red and blue portionsof the spectrum based on the presence of leaf pigmentsin the palisade mesophyll. However, scattering occurs inthe NIR portion of the spectrum due to the presence ofspongy mesophyll. The effect of this morphological charac-teristic may cause upwards of 76 percent scattering of theincoming solar radiation in the 700 to 1,200 nm region(Jensen, 2000).
The exploitation of this vegetative red-edge characteristicin remote sensing applications is tempered by the issue ofsaturation where an asymptotic increase in a vegetation index(VI) occurs with increasing LAI. The root of the LAI saturationproblem with respect to satellite vegetation indices hinges on(a) leaf level differences (e.g., pigments, internal leaf structure,leaf orientation) (Baret and Guyot, 1991; Williams, 1991;Bouman, 1992; Yoder and Waring, 1994), (b) within tree
PHOTOGRAMMETRIC ENGINEER ING & REMOTE SENS ING Novembe r 2008 1389
J.S. Iiames and A.N. Pilant are with the U.S. EnvironmentalProtection Agency, 109 T.W. Alexander Drive, MD E243-05,RTP, NC 27709 ([email protected]).
R.G. Congalton is with the University of New Hampshire,Durham, NH.
T.E. Lewis is with the U.S. Army corps of Engineers,Vicksburg, MS.
Photogrammetric Engineering & Remote Sensing Vol. 74, No. 11, November 2008, pp. 1389–1400.
0099-1112/08/7411–1389/$3.00/0© 2008 American Society for Photogrammetry
and Remote Sensing
Leaf Area Index (LAI) Change DetectionAnalysis on Loblolly Pine (Pinus taeda)
Following Complete Understory RemovalJ.S. Iiames, R.G. Congalton, A.N. Pilant, and T.E. Lewis
AbstractThe confounding effect of understory vegetation contribu-tions to satellite-derived estimates of leaf area index (LAI)was investigated on two loblolly pine (Pinus taeda) foreststands located in Virginia and North Carolina. In order toseparate NDVI contributions of the dominant-codominatecrown class from that of the understory, two P. taeda 1 haplots centered in planted stands of ages 19 and 23 yearswith similar crown closures (71 percent) were analyzed forin situ LAI and NDVI differences following a completeunderstory removal at the peak period of LAI. Understoryvegetation was removed from both stands using mechanicalharvest and herbicide application in late July and earlyAugust 2002. Ikonos data was acquired both prior andsubsequent to understory removal and were evaluated forNDVI response. Total vegetative biomass removed under thecanopies was estimated using the Tracing Radiation andArchitecture of Canopies (TRAC) instrument combined withdigital hemispherical photography (DHP). Within-image NDVIchange detection analysis (CDA) on the Virginia site showedthat the percentage of removed understory (LAI) detected bythe Ikonos sensor was 5.0 percent when compared to anactual in situ LAI reduction of 10.0 percent. The NorthCarolina site results showed a smaller percentage of reducedunderstory LAI detected by the Ikonos sensor (1.8 percent)when compared to the actual LAI reduction as measured insitu (17.4 percent). Image-to-image NDVI CDA proved prob-lematic due to the time period between the Ikonos imagecollections (2.5 to 3 months). Sensor and solar positiondifferences between the two collections, along with pine LAIincreases through multiple needle flush, exaggerated NDVIreductions when compared to in situ data.
IntroductionAssessment of forest stand-level attributes has been requiredfor the parameterization of many process-based ecologicalmodels. Specifically, the leaf surface area has been identi-fied as the main surface of exchange between the plantcanopy and the atmosphere and has been related to canopyinterception; transpiration; net photosynthesis; gas, water,
06-091.qxd 10/11/08 8:44 PM Page 1389
1390 Novembe r 2008 PHOTOGRAMMETRIC ENGINEER ING & REMOTE SENS ING
crown differences (e.g., clumping and woody materialcontribution to total reflectance) (Williams, 1991; Huemmrichand Goward, 1997), and (c) differences in canopy levelparameters (e.g., tree height heterogeneity and the size andnumber of tree gaps) (Cohen et al., 1990; Cohen and Spies,1992; Leblon et al., 1996). The effect of the LAI saturationissue is seen in the poor correlations (R2 � 0.30 to 0.52)reported between the normalized difference vegetation index(NDVI) and LAI (Spanner et al., 1990; Nemani et al., 1993; Chenand Cihlar, 1996). A variety of influences contribute to thepoor correlations observed in the LAI-NDVI relationship, namelycanopy closure, background materials (i.e., soil properties andsoil moisture content), and understory contributions. Of theabove mentioned three factors, canopy closure has beenidentified as the most important variable in determiningcanopy reflectance regardless of the understory component,due to the masking (i.e., occlusion of understory and groundcover) properties at varying canopy closure values (Spanneret al., 1990; Stenback and Congalton, 1990; Danson andCurran, 1993). However, in forests stands where direct solarradiation is relatively non-occluded (LAI �3), the contributionof understory vegetation has been shown to dramaticallyincrease the NIR reflectance from conifer stands (Nemani et al.,1993) thus affecting the overall response of NDVI.
Understory vegetation may contribute up to 60 percent oftotal stand LAI, yet detection of this component by variousremote sensing platforms/sensors has been difficult due to avariety of influences on overall spectral behavior (i.e., sea-sonality, canopy structure, image scene dependency, etc.).Chen (1996) reported that the effective LAI (Le), a canopyattribute influenced by the “effect” of nonrandom foliagespatial distribution on indirect measurements of LAI, varied byless than 5 percent in boreal conifer stands from spring tosummer, however the red/NIR Ratio, or Simple Ratio (SR),changed dramatically from spring to summer due to the growthof the understory. This response is a result of the dramaticinfluence of hardwood understory to the overall NIR reflectancefrom conifer forests. On average, understory accounted forapproximately 20 percent of the total LAI in both old growthponderosa pine and young ponderosa pine regeneration (Lawet al., 2001). Understory LAI accounted for 35 to 60 percent ofthe total LAI within plots of naturally regenerated young trees(Law et al., 2001). The broadleaved component in the under-story with a conifer overstory showed a large effect in the NIR,a moderate effect in the red, and, little to no effect in theshortwave IR regions (Peterson and Running, 1989). Badhwar etal., (1986) found that understory NIR reflectance dominatedoverall reflectance from open-canopied stands.
Separating the spectral signal from multi-layered forestcanopies, especially those with a significant presence ofunderstory, has proven difficult in the assessment of LAI inthose forest stands (Franklin et al., 1997; Carlson andRipley, 1997). We investigated the confounding effect ofunderstory contributions to satellite-derived estimates of LAIon two loblolly pine (Pinus taeda) plantations (ages 19 and23 years) located in Virginia and North Carolina, USA.Understory vegetation was removed from 1-hectare (ha) plots(100 m � 100 m) within both stands using mechanicalharvest and herbicide application in late July and earlyAugust 2002. Ikonos multispectral imagery was collectedboth prior and subsequent to understory removal and wasevaluated for change in VI response in the harvested andnon-harvested areas. LAI change, a result of the removalof understory vegetation beneath the dominant P. taedacanopy, was estimated using an integrated optical LAIestimation technique combining measurements from theTracing Radiation and Architecture of Canopies (TRAC; 3rdWave Engineering, Ontario, Canada) instrument with digitalhemispherical photography (DHP).
MethodsIn situ broadleaf forest understory contributions to overallstand LAI were analyzed on two P. taeda sites located inthe Albemarle-Pamlico Basin. On these same two sites, a VIchange detection analysis was completed using 4 m multi-resolution Ikonos imagery. On both sites, within a 1 haarea, broadleaf understory and ground vegetation wereremoved using mechanical harvest and herbicide applica-tion in late July and early August 2002. Ikonos imagerywas acquired pre-(IM-T1) and post-(IM-T2) harvest throughthe NASA Data Buy Program for analysis (Morisette et al.,2003). In situ LAI was measured prior to and following theunderstory removal implementing the indirect opticalestimation method integrating TRAC and DHP measurements(TRAC-DHP). IM-T1 and IM-T2 pair-wise Ikonos images foreach site were first georectified then normalized using thelocalized relative radiometric normalization technique inorder to assess change between the two dates (Elvidgeet al., 1995). Pair-wise images were then clipped to includethe 1 ha site (UR region, i.e., understory removal) plus theunaltered P. taeda stand immediately surrounding the site(UA region, i.e., unaltered). VIs using the red edge proper-ties characteristic within photosynthetically active vegeta-tion were utilized to assess LAI change. Comparisonsbetween dates (image-to-image) and within-date (within-image) were made employing low-pass spatial filters atvarying resolutions. An analysis of variance (ANOVA) wasimplemented to test for significant differences betweendates (i.e., image-to-image) IM-T1 and IM-T2. A within-date(i.e., within-image) ANOVA was applied to test for differ-ences in the IM-T2 image between the 1 ha UR and the UAregions.
Site DescriptionsTwo sites chosen for this research were located on commercialforestland managed for pulp and paper production in Virginiaand North Carolina. The Virginia (Appomattox) site is locatedin Campbell County, VA (37.219°N, �78.879 °W) approxi-mately 15.5 km SSW of Appomattox, VA (Figure1). Thisupper piedmont region ranges in elevation of 165 to 215 mabove mean sea level. The MeadWestvaco Corporation, asupporter of the Sustainable Forestry Initiative, permittedsampling access to the U.S. Environmental Protection Agency(EPA) for this P. taeda stand including a complete understoryremoval within the 1 ha UR region using mechanical harvestand herbicide application. P. taeda was planted in 1980.Predominant soil types within the county included both TypicHapludults and Kanhapludults: Cecil (16.3 percent), Cullen(12.0 percent), Tatum (8.3 percent), and Appling (7.7 percent).Measurements of forest structural attributes (height [m] anddiameter [cm]) were made at both sites within the 1 ha areasusing a point sampling method (nine plots/ha) with a basal-area-factor 10 for trees larger than 5 cm diameter at breastheight (DBH) (Avery and Burkhart, 1993). Three plots withinboth 1 ha UR regions were sampled for understory components(stems less than 5 cm DBH) using a 4.6 m radius fixed areasampling method. Canopy closure, defined as the percentobstruction of the sky by canopy elements, was estimatedusing a GRS Densitometer (Ben Meadows Co., Janesville, WI).Stocking values, expressed as trees per hectare (TPH), were1,250 TPH for the dominant-codominant crown class and3,790 TPH for all trees in the understory (suppressed).The Appomattox understory did not have one dominantspecies as found in the Hertford site understory, however alltree species were deciduous (Figure 2). The average diameter(DBH), measured 1.4 m above the base of the tree, was 21.6 cm.The average height of the dominant-codominant crown classwas 15.9 m. This P. taeda stand supported a basal area (BA)per hectare of 36.7 m2, with BA defined as the cross-sectional
06-091.qxd 10/11/08 8:44 PM Page 1390

PHOTOGRAMMETRIC ENGINEER ING & REMOTE SENS ING Novembe r 2008 1391
TABLE 1. FOREST STAND STRUCTURE ATTRIBUTES FOR APPOMATTOX (VA) AND
HERTFORD (NC)
Appomattox Hertford
TPH (overstory) 1250 1740TPH (understory) 3790 2830STAND AGE (years) 23 19DBH (cm) 21.6 18.5HEIGHT (m) 15.9 14.3BA/H (m3) 36.7 37.3CC (%) 71 71
2002 stocking values were 1,740 TPH for the dominant-codominant canopy class and 2,830 TPH for the suppressedcanopy crown class. Understory was dominated (60 percent)by the broadleaf evergreen tree species Ilex opaca (AmericanHolly) (Figure 3). The average diameter and height of thisstand was 18.5 cm and 14.3 m, respectively. Measured basalarea and crown closure was 37.3 m2/ha and 71 percent,respectively (Table 1).
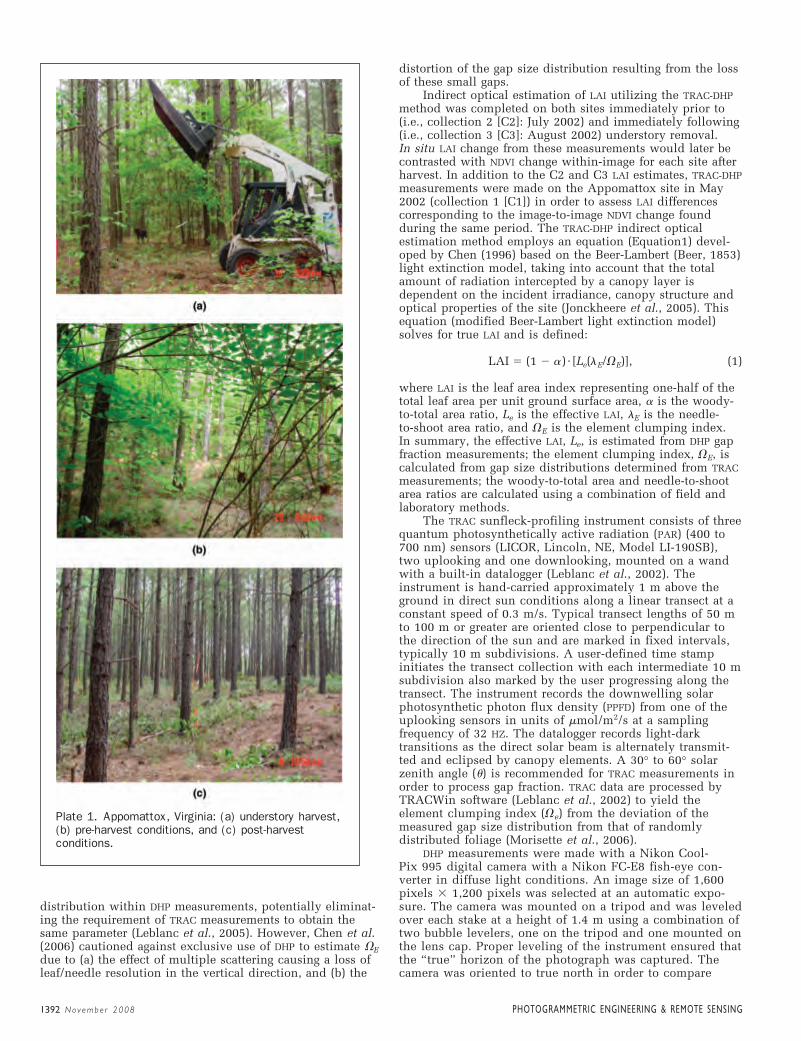
Understory Harvest and Herbicide ApplicationUnderstory removal completion dates were 30 July 2002(Hertford) and 02 August 2002 (Appomattox). The perime-ters of both 100 m � 100 m plots on both sites were flaggedand a mechanical harvest was applied, effectively shreddingall understory. To ensure elimination of all photosyntheti-cally active vegetation in the understory, including forbs,herbs, and grasses, an herbicide treatment of two quarts/acreof Accord Concentrate (Dow AgroSciences, Indianopolis,IN) was applied to both plots (Plate 1). This understorycomponent was not significant (�10 to 15 percent) giventhe shading produced by the dominant-codominant andsuppressed tree crown classes existent on both sites.
In situ LAI MeasurementsA number of LAI validation studies have utilized the integra-tion of optical instruments to capture gap fraction measure-ments and gap size distributions to estimate Le and �E.Leblanc and Chen (2001) combined the TRAC with LICORPCA measurements for in situ LAI, as did Jonckheere et al.(2005). TRAC-DHP integration LAI estimation was assessed inthe P. taeda pine forests of North Carolina and Virginia withgood correlation to whole-tree harvest LAI estimates (Iiames,2006). Recently, �E has been extracted from gap size
Figure 1. North Carolina (Appomattox) and Virginia(Hertford) P. taeda site locations.
Figure 2. Distribution of understory (percent Stems/ha)tree species sampled on the Appomattox site.
area of a tree at 1.4 m above the tree base per unit area. Thecrown closure was 71 percent for this forest type (Table 1).
The North Carolina (Hertford) site, located in HertfordCounty, NC (36.383°N, �77.001°W), is approximately 5.8 kmWSW of Winton, NC (Figure 1). This coastal plain site is8 to 10 m above mean sea level with a moderately welldrained thermic Aquic Hapludult soil type (Cravenfine sandy loam). P. taeda was planted in 1983 and by
Figure 3. Distribution of understory (percent Stems/ha)tree species sampled on the Hertford site.
06-091.qxd 10/11/08 8:44 PM Page 1391
1392 Novembe r 2008 PHOTOGRAMMETRIC ENGINEER ING & REMOTE SENS ING
distribution within DHP measurements, potentially eliminat-ing the requirement of TRAC measurements to obtain thesame parameter (Leblanc et al., 2005). However, Chen et al.(2006) cautioned against exclusive use of DHP to estimate �Edue to (a) the effect of multiple scattering causing a loss ofleaf/needle resolution in the vertical direction, and (b) the
distortion of the gap size distribution resulting from the lossof these small gaps.
Indirect optical estimation of LAI utilizing the TRAC-DHPmethod was completed on both sites immediately prior to(i.e., collection 2 [C2]: July 2002) and immediately following(i.e., collection 3 [C3]: August 2002) understory removal.In situ LAI change from these measurements would later becontrasted with NDVI change within-image for each site afterharvest. In addition to the C2 and C3 LAI estimates, TRAC-DHPmeasurements were made on the Appomattox site in May2002 (collection 1 [C1]) in order to assess LAI differencescorresponding to the image-to-image NDVI change foundduring the same period. The TRAC-DHP indirect opticalestimation method employs an equation (Equation1) devel-oped by Chen (1996) based on the Beer-Lambert (Beer, 1853)light extinction model, taking into account that the totalamount of radiation intercepted by a canopy layer isdependent on the incident irradiance, canopy structure andoptical properties of the site (Jonckheere et al., 2005). Thisequation (modified Beer-Lambert light extinction model)solves for true LAI and is defined:
(1)
where LAI is the leaf area index representing one-half of thetotal leaf area per unit ground surface area, � is the woody-to-total area ratio, Le is the effective LAI, �E is the needle-to-shoot area ratio, and VE is the element clumping index.In summary, the effective LAI, Le, is estimated from DHP gapfraction measurements; the element clumping index, VE, iscalculated from gap size distributions determined from TRACmeasurements; the woody-to-total area and needle-to-shootarea ratios are calculated using a combination of field andlaboratory methods.
The TRAC sunfleck-profiling instrument consists of threequantum photosynthetically active radiation (PAR) (400 to700 nm) sensors (LICOR, Lincoln, NE, Model LI-190SB),two uplooking and one downlooking, mounted on a wandwith a built-in datalogger (Leblanc et al., 2002). Theinstrument is hand-carried approximately 1 m above theground in direct sun conditions along a linear transect at aconstant speed of 0.3 m/s. Typical transect lengths of 50 mto 100 m or greater are oriented close to perpendicular tothe direction of the sun and are marked in fixed intervals,typically 10 m subdivisions. A user-defined time stampinitiates the transect collection with each intermediate 10 msubdivision also marked by the user progressing along thetransect. The instrument records the downwelling solarphotosynthetic photon flux density (PPFD) from one of theuplooking sensors in units of mol/m2/s at a samplingfrequency of 32 HZ. The datalogger records light-darktransitions as the direct solar beam is alternately transmit-ted and eclipsed by canopy elements. A 30° to 60° solarzenith angle () is recommended for TRAC measurements inorder to process gap fraction. TRAC data are processed byTRACWin software (Leblanc et al., 2002) to yield theelement clumping index (Ve) from the deviation of themeasured gap size distribution from that of randomlydistributed foliage (Morisette et al., 2006).
DHP measurements were made with a Nikon Cool-Pix 995 digital camera with a Nikon FC-E8 fish-eye con-verter in diffuse light conditions. An image size of 1,600pixels � 1,200 pixels was selected at an automatic expo-sure. The camera was mounted on a tripod and was leveledover each stake at a height of 1.4 m using a combination oftwo bubble levelers, one on the tripod and one mounted onthe lens cap. Proper leveling of the instrument ensured thatthe “true” horizon of the photograph was captured. Thecamera was oriented to true north in order to compare
LAI � (1 � a) � [Le(lE/VE)],
Plate 1. Appomattox, Virginia: (a) understory harvest,(b) pre-harvest conditions, and (c) post-harvestconditions.
06-091.qxd 10/11/08 8:44 PM Page 1392
PHOTOGRAMMETRIC ENGINEER ING & REMOTE SENS ING Novembe r 2008 1393
metrics derived from other canopy gap instruments (e.g., TRAC, densitometer, etc.). The operator would select adelayed (3 to 10 second) exposure to eliminate any vibra-tion incurred when depressing the shutter.
Gap Light Analyzer (GLA) software (Simon FraserUniversity, Burnaby, British Columbia, Canada) was used toprocess the DHP imagery. GLA relies on the accurate projec-tion of a three-dimensional hemispherical coordinate systemonto a two-dimensional surface. After downloading theimages, a GLA configuration file was created for both sites.A configuration file contains information regarding imageorientation, projection distortion and lens calibration, sitelocation coordinates, length of growing season, sky-regionbrightness, and atmospheric conditions. GLA requires thateach image be registered with respect to the location of duenorth on the image and the image circular area. This imageregistration process required that the FC-E8 fish-eye lens berecalibrated due to an actual field of view of 185°, not 180°.The image radius was reduced accordingly so that the 90°represented the true horizon. After the image was registered,an analyst-derived threshold value was assigned, delineatingsky (white pixels) from no-sky (black pixels). GLA softwarereturns gap fraction values for the following ’s: 5.6°, 16.9°,28.1°, 39.4°, 50.6°, 61.9°, 73.1°, and 84.4°. Miller (1967)found that gap fraction measurements made at 1 radian(�57.3°) for a variety of leaf or needle structures converge ata 0.5 projection coefficient (Beer-Lambert variable). Thistheoretical insensitivity of gap fraction to leaf angle distribu-tion at 57.3° eliminates the requirement for gap fractionmeasurements over the entire range of ’s. The gap fractionat 57.3° can be determined by plotting gap fraction valuesagainst the corresponding ’s. Solving for Le from the Beer-Lambert equation results in:
(2)
where P() is the gap fraction at .The needle-to-shoot area (�E) and woody-to-total area
(a) ratios were measured from samples taken from twoadditional sites located within the same physiographicprovinces as the Appomattox and Hertford sites. Theneedle-to-shoot area ratio was obtained through laboratoryanalysis of shoot samples following the methodology ofChen and Black (1992a and b) and Fassnacht et al. (1994).The woody-to-total area ratio was estimated using ERDASImagine® image processing software through an unsuper-vised classification technique employing the ISODATAclustering algorithm (Iiames, 2006).
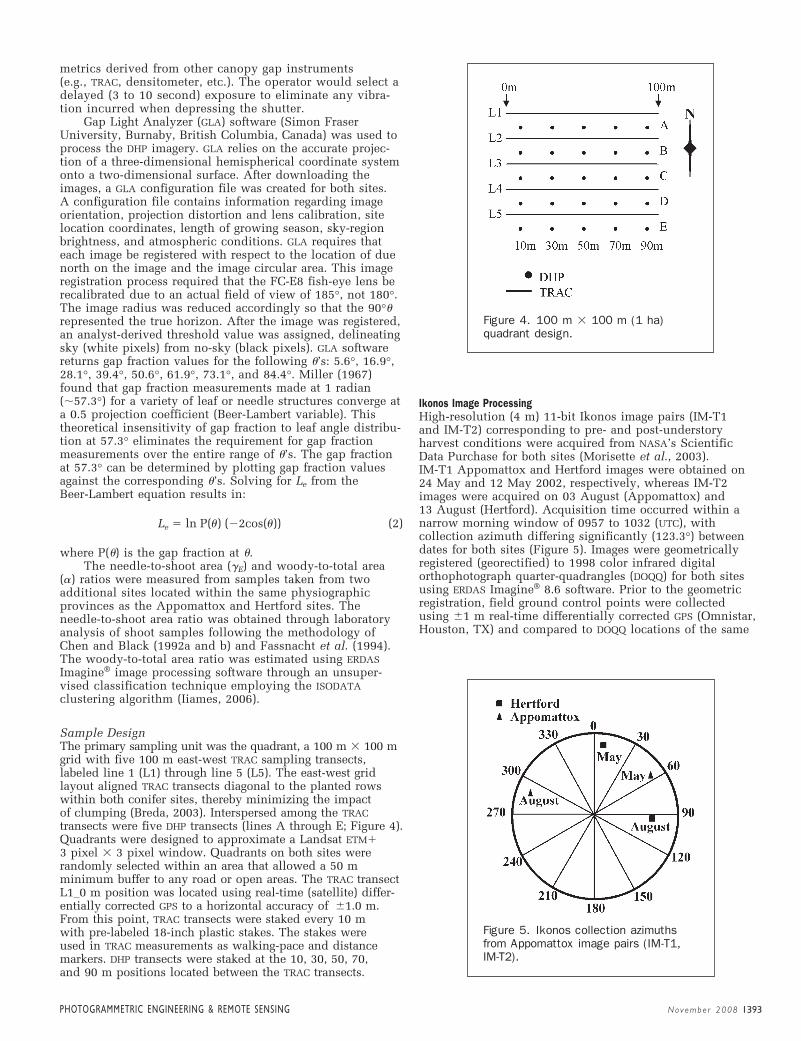
Sample DesignThe primary sampling unit was the quadrant, a 100 m � 100 mgrid with five 100 m east-west TRAC sampling transects,labeled line 1 (L1) through line 5 (L5). The east-west gridlayout aligned TRAC transects diagonal to the planted rowswithin both conifer sites, thereby minimizing the impactof clumping (Breda, 2003). Interspersed among the TRACtransects were five DHP transects (lines A through E; Figure 4).Quadrants were designed to approximate a Landsat ETM 3 pixel � 3 pixel window. Quadrants on both sites wererandomly selected within an area that allowed a 50 mminimum buffer to any road or open areas. The TRAC transectL1_0 m position was located using real-time (satellite) differ-entially corrected GPS to a horizontal accuracy of �1.0 m.From this point, TRAC transects were staked every 10 mwith pre-labeled 18-inch plastic stakes. The stakes wereused in TRAC measurements as walking-pace and distancemarkers. DHP transects were staked at the 10, 30, 50, 70,and 90 m positions located between the TRAC transects.
Le � ln P(u) (�2cos(u))
Ikonos Image ProcessingHigh-resolution (4 m) 11-bit Ikonos image pairs (IM-T1and IM-T2) corresponding to pre- and post-understoryharvest conditions were acquired from NASA’s ScientificData Purchase for both sites (Morisette et al., 2003). IM-T1 Appomattox and Hertford images were obtained on24 May and 12 May 2002, respectively, whereas IM-T2images were acquired on 03 August (Appomattox) and13 August (Hertford). Acquisition time occurred within anarrow morning window of 0957 to 1032 (UTC), withcollection azimuth differing significantly (123.3°) betweendates for both sites (Figure 5). Images were geometricallyregistered (georectified) to 1998 color infrared digitalorthophotograph quarter-quadrangles (DOQQ) for both sitesusing ERDAS Imagine® 8.6 software. Prior to the geometricregistration, field ground control points were collectedusing �1 m real-time differentially corrected GPS (Omnistar,Houston, TX) and compared to DOQQ locations of the same
Figure 4. 100 m � 100 m (1 ha)quadrant design.
Figure 5. Ikonos collection azimuthsfrom Appomattox image pairs (IM-T1,IM-T2).
06-091.qxd 10/11/08 8:44 PM Page 1393
1394 Novembe r 2008 PHOTOGRAMMETRIC ENGINEER ING & REMOTE SENS ING
point. Offsets in the X and Y direction were assessed forDOQQ accuracy prior to assuming this data layer as the basefor georectification.
After the georectification process was completedimage analysis was conducted to test: (a) image-to-imageNDVI CDA using relative radiometric normalization tech-nique (Appomattox site only), (b) within-image NDVI CDA(Appomattox and Hertford IM-T2 images), (c) spatialaveraging unit appropriate for the P. taeda forest type,and (d) differences between NDVI and four other vege-tation indices.
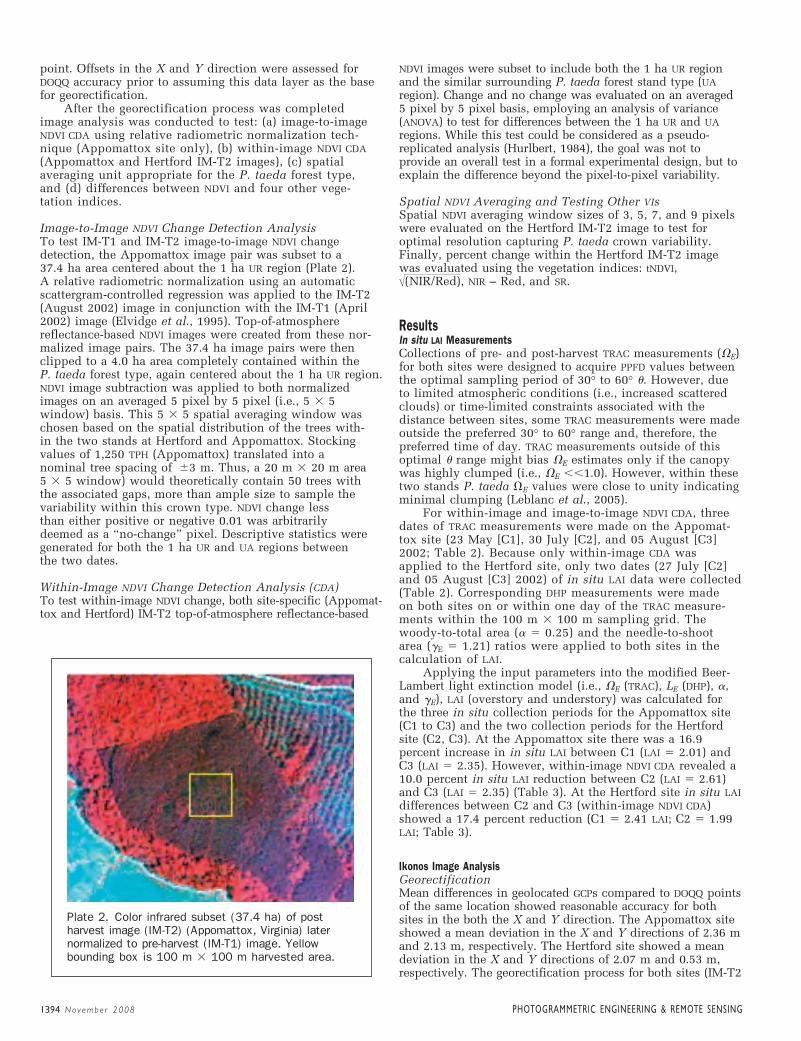
Image-to-Image NDVI Change Detection AnalysisTo test IM-T1 and IM-T2 image-to-image NDVI changedetection, the Appomattox image pair was subset to a37.4 ha area centered about the 1 ha UR region (Plate 2).A relative radiometric normalization using an automaticscattergram-controlled regression was applied to the IM-T2(August 2002) image in conjunction with the IM-T1 (April2002) image (Elvidge et al., 1995). Top-of-atmospherereflectance-based NDVI images were created from these nor-malized image pairs. The 37.4 ha image pairs were thenclipped to a 4.0 ha area completely contained within theP. taeda forest type, again centered about the 1 ha UR region.NDVI image subtraction was applied to both normalizedimages on an averaged 5 pixel by 5 pixel (i.e., 5 � 5 window) basis. This 5 � 5 spatial averaging window waschosen based on the spatial distribution of the trees with-in the two stands at Hertford and Appomattox. Stockingvalues of 1,250 TPH (Appomattox) translated into anominal tree spacing of �3 m. Thus, a 20 m � 20 m area 5 � 5 window) would theoretically contain 50 trees with the associated gaps, more than ample size to sample thevariability within this crown type. NDVI change lessthan either positive or negative 0.01 was arbitrarilydeemed as a “no-change” pixel. Descriptive statistics weregenerated for both the 1 ha UR and UA regions betweenthe two dates.
Within-Image NDVI Change Detection Analysis (CDA)To test within-image NDVI change, both site-specific (Appomat-tox and Hertford) IM-T2 top-of-atmosphere reflectance-based
NDVI images were subset to include both the 1 ha UR regionand the similar surrounding P. taeda forest stand type (UAregion). Change and no change was evaluated on an averaged5 pixel by 5 pixel basis, employing an analysis of variance(ANOVA) to test for differences between the 1 ha UR and UAregions. While this test could be considered as a pseudo-replicated analysis (Hurlbert, 1984), the goal was not toprovide an overall test in a formal experimental design, but toexplain the difference beyond the pixel-to-pixel variability.
Spatial NDVI Averaging and Testing Other VIsSpatial NDVI averaging window sizes of 3, 5, 7, and 9 pixelswere evaluated on the Hertford IM-T2 image to test foroptimal resolution capturing P. taeda crown variability.Finally, percent change within the Hertford IM-T2 imagewas evaluated using the vegetation indices: tNDVI,
, NIR – Red, and SR.
ResultsIn situ LAI MeasurementsCollections of pre- and post-harvest TRAC measurements (�E)for both sites were designed to acquire PPFD values betweenthe optimal sampling period of 30° to 60° . However, dueto limited atmospheric conditions (i.e., increased scatteredclouds) or time-limited constraints associated with thedistance between sites, some TRAC measurements were madeoutside the preferred 30° to 60° range and, therefore, thepreferred time of day. TRAC measurements outside of thisoptimal range might bias �E estimates only if the canopywas highly clumped (i.e., �E ��1.0). However, within thesetwo stands P. taeda �E values were close to unity indicatingminimal clumping (Leblanc et al., 2005).
For within-image and image-to-image NDVI CDA, threedates of TRAC measurements were made on the Appomat-tox site (23 May [C1], 30 July [C2], and 05 August [C3]2002; Table 2). Because only within-image CDA wasapplied to the Hertford site, only two dates (27 July [C2]and 05 August [C3] 2002) of in situ LAI data were collected(Table 2). Corresponding DHP measurements were madeon both sites on or within one day of the TRAC measure-ments within the 100 m � 100 m sampling grid. Thewoody-to-total area (� � 0.25) and the needle-to-shootarea (�E � 1.21) ratios were applied to both sites in thecalculation of LAI.
Applying the input parameters into the modified Beer-Lambert light extinction model (i.e., �E (TRAC), LE (DHP), �,and �E), LAI (overstory and understory) was calculated forthe three in situ collection periods for the Appomattox site(C1 to C3) and the two collection periods for the Hertfordsite (C2, C3). At the Appomattox site there was a 16.9percent increase in in situ LAI between C1 (LAI � 2.01) andC3 (LAI � 2.35). However, within-image NDVI CDA revealed a10.0 percent in situ LAI reduction between C2 (LAI � 2.61)and C3 (LAI � 2.35) (Table 3). At the Hertford site in situ LAIdifferences between C2 and C3 (within-image NDVI CDA)showed a 17.4 percent reduction (C1 � 2.41 LAI; C2 � 1.99LAI; Table 3).
Ikonos Image AnalysisGeorectificationMean differences in geolocated GCPs compared to DOQQ pointsof the same location showed reasonable accuracy for bothsites in the both the X and Y direction. The Appomattox siteshowed a mean deviation in the X and Y directions of 2.36 mand 2.13 m, respectively. The Hertford site showed a meandeviation in the X and Y directions of 2.07 m and 0.53 m,respectively. The georectification process for both sites (IM-T2
w( NIR/Red)
Plate 2. Color infrared subset (37.4 ha) of postharvest image (IM-T2) (Appomattox, Virginia) laternormalized to pre-harvest (IM-T1) image. Yellowbounding box is 100 m � 100 m harvested area.
06-091.qxd 10/11/08 8:44 PM Page 1394

PHOTOGRAMMETRIC ENGINEER ING & REMOTE SENS ING Novembe r 2008 1395
TABLE 4. IMAGE-TO-IMAGE NDVI CDA (5 � 5 AVERAGED) OF 23 MAY (IM-T1) AND 03 AUGUST 2002 IMAGES
(IM-T2) (APPOMATTOX)
UR (n � 16) UA (n � 60)
5/23/02 8/3/02 % Reduction 5/23/02 8/3/02 % Reduction 0.58 0.49 14.3 0.57 0.52 9.1� 0.004 0.004 0.009 0.006
TABLE 3. CALCULATION OF IN SITU LAI (TRAC-DHP) FOR APPOMATTOX (VA) AND HERTFORD (NC) SITES
Site Collection Month/Year VE LE �E � LAI 1ADJ LAI
APPO C1 MAY 2002 0.91 1.79 1.21 0.25 1.78 2.01APPO C2 JULY 2002 0.89 2.25 1.21 0.25 2.30 2.61APPO C3 AUGUST 2002 0.90 2.07 1.21 0.25 2.08 2.35HERT C2 JULY 2002 0.92 2.21 1.21 0.25 2.13 2.41HERT C3 AUGUST 2002 0.89 1.78 1.21 0.25 1.76 1.99
Note: ADJ LAI (i.e., adjusted LAI): LAI estimates were adjusted upward by a factor of 1.132 to adjust for the differences accounted between insitu TRAC-DHP estimated LAI and allometrically-derived LAI estimates from destructive harvests (Iiames, 2006).
images) resulted in root mean square error (RMSE) within one-half pixel (i.e., approximately 2 m). RMSE was below one-half pixel for the Hertford site (RMSE � 0.27 m) and close toone-half pixel for the Appomattox site (RMSE � 2.10 m).The IM-T1 images (Appomattox and Hertford) were registeredto the corrected IM-T2 images for georectification.
Image-to-Image NDVI Change Detection AnalysisTesting image-to-image NDVI change at both sites wasproblematic in that the time between the two image dates(IM-T1 and IM-T2) was lengthy (73 days: Appomattox; 94days: Hertford). Also, the nominal collection azimuthsdiffered within the Appomattox image pairs (236.7°) and theHertford image pairs (83.8°). Therefore, this method wasapplied only to the Appomattox image pair to determine ifany change could be detected.
The mean UA region NDVI for the IM-T1 (May 2002)image was reduced 9.1 percent between image acquisitiondates (Table 4). Within the 1 ha UR region, a 14.3 percentdecrease in NDVI was observed between the IM-T1 imageand the IM-T2 image. Between-date ANOVA results indicatethat there were significant differences between the 1 haUR (p � �0.0001, F � 1303.9, df � 1) and the UA regions(p � �0.0001, F � 3010.2, df � 1). Within the 1 ha URregion an NDVI image subtraction (pre-harvest image NDVIminus post harvest image NDVI) resulted in 81.2 percent ofthe area exhibiting a decrease in NDVI greater than 0.01NDVI change threshold. The remaining 18.8 percent of the1 ha UR region indicated no change in NDVI. Within the UAregion 11.9 percent of the area showed an NDVI decrease(�0.01), 8.5 percent resulted in an NDVI increase (�0.01),and the rest of the area was unchanged.
TABLE 2. IN SITU LAI PARAMETERS FOR APPOMATTOX AND HERTFORD SITES FOR THREE COLLECTION PERIODS
(C1-MAY 2002; C2-JULY 2002; C3-AUGUST 2002)
C1 C2 C3
APPO APPO HERT APPO HERT
W/IN-IM X X X X
IM-IM X X
DATE 23 May 2002 30 July 2002 27 July 2002 06 August 2002 05 August 2002
TIME (UTC) 13:54–14:25 9:13–9:41 11:38–12:18 9:34–9:54 12:59–13:26
18.9–22.9° 57.0°–51.3° 27.2°–21.1° 53.8°–49.9° 19.8°–19.7°
S. AZIMUTH 211.6°–228.7° 91.0°–95.6° 122.9°–140.9° 96.3°–99.8° 169.4°–188.6°
TRANSECTS (D) L1–5 (W–E) L1–5 (W–E) L1–5 (W–E) L1(10,50,90) (N–S)1 L1–5 (W–E)
PPFD (mol/m2/s) 1850–1920 340–1013 585–928 401–668 1345–1416
VE(�) 0.91 (0.04) 0.89 (0.05) 0.92 (0.03) 0.90 (0.04) 0.89 (0.03)
DATE 23 May 2002 29 July 2002 25 July 2002 06 August 2002 05 August 2002
A(10,50,90) All All B(30,50,70) B(30,50,70)POINTS C(10,50,90) (A,B,C,D,E) (A,B,C,D,E) C(30,50,70) C(30,50,70)
E(10,50,90) D(30,50,70) D(30,50,70)
LE (�) 1.79 (0.21) 2.25 (0.28) 2.21 (0.28) 2.07 (0.20) 1.78 ((0.10)
Note: TRAC lines were run N-S due to solar position. TRAC runs began at L1_10 then proceeded south through L2, L3, L4, and L5_10. Thenext TRAC run began at L5_50, then proceeded north along the 50 m markers. The same process was repeated for L1_90, proceeding south.
DH
PT
RA
C
06-091.qxd 10/11/08 8:44 PM Page 1395

1396 Novembe r 2008 PHOTOGRAMMETRIC ENGINEER ING & REMOTE SENS ING
Within-image NDVI Change Detection AnalysisSignificant differences were detected between the 1 ha URand the UA regions within the IM-T2 (Appomattox) NDVI image(p � �0.0001, F � 300.9, df � 1) and the IM-T2 (Hertford)NDVI image (p � �0.0001, F � 30.3, df � 1) (Figures 6 and 7).A 5.0 percent decrease in NDVI was detected between the 1ha UR and the UA regions of the IM-T2 (Appomattox) NDVIimage (UR NDVI � 0.493; UA NDVI � 0.519), whereas onlya 1.8 percent decrease was detected between the 1 haUR and UA regions within the IM-T2 (Hertford) NDVI image(UR NDVI � 0.425; UA NDVI � 0.433; Table 5).
Spatial Averaging Window SizeThe mean values between four spatial averaging windowsizes (3 � 3, 5 � 5, 7 � 7, and 9 � 9) for both the 1 ha URand the UA regions were identical (Figure 8). All p-valuesindicated significant differences in the means for the tworegions (UR versus UA) within each window size (p � 0.001).Note the random noise associated with image A in Figure 8that resulted from the 4 m NDVI values occurring overcanopy gap areas with no understory vegetation (darkerpixels) and other 4 m NDVI values occurring over crown tops(light pixels). The spatial averaging in panels B through E(Figure 8) resolve NDVI decreases at the canopy level.
Other Vegetation IndicesAnalysis of the four additional vegetation indices besidesNDVI revealed that NDVI and NIR – Red resulted in the detec-
tion of the largest change across all four indices (Table 6).The vegetation index tNDVI was the least sensitive detectorof change.
DiscussionUnderstory effects on spectral signal to the sensor areconfounded by a number of factors including the spatialdistribution of variable illumination conditions (directsunlight, sunflecks, penumbra, shade) (Miller et al., 1997).For example, in the Boreal Ecosystem-Atmospheric Study(BOREAS), these illumination variables affected VI responsedependent on forest stand type when evaluating overseasons and time-of-day (Miller et al., 1997). Gamon et al.(2004) suggested that optical signature variability in theboreal conifer forests render LAI derived from VIs intoquestion. It has also been shown that understanding theunderstory contribution to overall LAI has significance inthe evaluation of ecosystem flux data. Ponderosa pinecarbon-water interactions as well as Slash pine water andenergy exchange have been aided by the assessment of theunderstory LAI contributions (Williams et al., 2001; Powellet al., 2005).
With our research, the image-to-image NDVI CDAwithin the Appomattox site did show a larger decreasein NDVI within the 1 ha UR region between image dates(14.3 percent) than did the IM-T2 within-image NDVIdecrease between the 1 ha UR and UA regions (5.0 percent).However, the image-to-image processing technique hadsome underlying issues in that the IM-T1 Ikonos acquisi-tion was 2.5 to 3 months prior to the IM-T2 acquisition.Ikonos acquisition azimuthal differences between thetwo image dates (123.3°) could affect shadowing and the
TABLE 5. WITHIN-IMAGE NDVI CDA (5 � 5 AVERAGED) OF 03 AUGUST 2002(IM-T2) (APPOMATTOX) AND 13 AUGUST 2002 (IM-T2) (HERTFORD) IKONOS
IMAGERY
UR UA Reduction %
Appomattox 0.493 0.519 5.0Hertford 0.425 0.433 1.8
Figure 6. Appomattox 23 May 2002 (IM-T1): (a)NDVI, and (b) 5 � 5 NDVI; Appomattox 03 August 2002 (IM-T2):(c) NDVI, and (d) 5 � 5 NDVI. Note: Darker regions indicateareas of low NDVI. Figure 7. Hertford 12 May 2002 (IM-T1):
(a) NDVI, and (b) 5 � 5 NDVI; Hertford 13 August2002 (IM-T2): (c) NDVI, and (d) 5 � 5 NDVI.
06-091.qxd 10/11/08 8:44 PM Page 1396

PHOTOGRAMMETRIC ENGINEER ING & REMOTE SENS ING Novembe r 2008 1397
amount of NIR reflectance received at the sensor. Also, P.taeda incurs tremendous change over the growing season,with the addition of two to three needle flushes commonwithin this species. Sampson et al. (2003) found that P.taeda LAI varied twofold inter-annually with a minimumLAI in March to April and a maximum in September. Thistrend is evident when comparing the increase of in situ LAI(29.9 percent) from May 2002 (C1), to July 2002 (C2), then
the expected decrease (10 percent) between C2 and C3.Viewing only in situ LAI change between C1 and C3, anincrease of 16.9 percent was recorded, even though signifi-cant leaf biomass had been removed (Figure 9). NDVI,contrary to the in situ LAI trend, exhibited a continuallydecreasing tendency between C1 to C2 (9.7 percent), thenC2 to C3 (5.0 percent), with an overall NDVI decrease fromC1 to C3 of 14.3 percent (Figure 9). Possible explanationsfor this decrease in NDVI with a corresponding increase insitu measured LAI may result from higher NIR reflectivityand red absorption from planophile broadleaf foliage in theunderstory compared to erectophile foliage typical ofconifer needles (Turner et al., 1999) (Table 4). Anotherpossible explanation may be related to the relative visibil-ity of the deciduous understory in the low LAI P. taedaconditions typical for the early-late spring period. A directcomparison of empirically-derived LAI, i.e., the correlationof spectral data with in situ estimated LAI, and in situ LAIwas not possible due to the narrow range of LAI valueswithin this stand.
Within-image NDVI CDA compared the 1 ha UR and UAregions for both sites within each corresponding IM-T2(August 2002) image. Significant differences between bothregions (UR and UA) were detected. However, within the1 ha UR region, the Appomattox and Hertford sites behaveddifferently with respect to the percent reduction in NDVIand the in situ estimated reduction in LAI. The Appomattoxsite showed a larger decrease in NDVI than the Hertford sitewithin the 1-ha UR regions (5 percent versus 1.8 percent),yet the Hertford site exhibited a greater reduction in LAI(17.4 percent versus 10.0 percent). One possible explana-tion for this result may be the large percentage of Ilex
TABLE 6. VEGETATION INDICES DIFFERENCES EVALUATING BIOMASS CHANGE DETECTION FOR THE 13 AUGUST
2002 (IM-T2) HERTFORD IKONOS NDVI IMAGE (H = HARVESTED; NH = NON-HARVESTED)
NDVI tNDVI NIR/Red NIR-Red NIR/Red
(H:NH) (H:NH) (H:NH) (H:NH) (H:NH)
0.425:0.433 0.963:0.966 1.580:1.591 401.4:408.8 0.426:0.434� 0.004:0.005 0.003:0.002 0.010:0.009 7.79:7.56 0.004:0.004% Diff 1.80 0.33 0.73 1.80 1.72p �0.001 �0.001 �0.001 �0.001 �0.001
Figure 8. Comparison of various spatial averag-ing windows on Hertford 13 August 2002 (IM-T2)NDVI image: (a) Raw NDVI, (b) 3 � 3 NDVI,(c) 5 � 5 NDVI, (d) 7 � 7 NDVI, and(e) 9 � 9 NDVI.
Figure 9. Image-to-image NDVI CDA and in situ LAItrends over three collection periods (C1-May 2002;C2-July 2002; C3-August 2002) Appomattox, Virginia.
06-091.qxd 10/11/08 8:44 PM Page 1397

opaca (American Holly) existent within the Hertfordunderstory (60 percent). This species is extremely shadetolerant, thus exhibits characteristics typical of this shadeclass (increased photosynthetic and respiratory efficiency,increased light use efficiency, and, increased leaf surfacearea). There is a visible difference between the leaf under-side and top of leaf. The non-Lambertian surface (leaf andcanopy) could produce significantly spectral differencesdependent on the image acquisition angle. In addition tothe Ilex opaca issue, returned reflectance to the sensor mayfurther have been reduced by the larger presence of organicsoils in this coastal plain site compared to the piedmontsite (Appomattox).
The question arises on how other sensor-derived NDVImight detect subtle changes in forest stand structure.Spectral vegetation indices may not be comparable due tosensor spectral and spatial characteristics (Hill andAifadopoulou, 1990; Teillet et al., 1997; Steven et al., 2003;Soudani et al., 2006). The primary issue affecting NDVIdifferences between sensors was the spectral characteristicof the red band (i.e., width, location) (Teillet et al., 1997;Soudani et al., 2006). Ikonos-derived NDVI was observedto be systematically lower than Landsat ETM -and SPOTHRVIR-derived NDVI, with an observed offset approximately0.11 and 0.20 NDVI units dependent on image preprocessingtechniques (i.e., atmospheric corrections) (Soudani et al.,2006). No generalized Ikonos NDVI-LAI regression model wasfound in the literature for P. taeda in the southeastern U.S.However, a general comparison was made between within-image Ikonos-derived NDVI change observed on both sitesand retrieved NDVI differences from a species-specificnonlinear regression model developed from the HyMap(Integrated Spectronics Pty Ltd., 1997) sensor (Flores, 2003).This equation was developed by regressing in situ estimatedLAI with HyMap-retrieved NDVI on two P. taeda standslocated in the North Carolina Sandhills and Coastal Plainregions. Flores (2003) found this equation to be transferableacross sites, stand structures, and seasons. By applyingC2 and C3 in situ LAI estimates into the Flores regressionmodel, predicted NDVI values were retrieved for both theAppomattox and Hertford sites. The HyMap NDVI was shownto be 0.21 (Appomattox) and 0.28 (Hertford) NDVI unitsabove those observed with the Ikonos sensor, values similarto differences observed between the Landsat ETM and SPOTHRVIR sensors. Results were indifferent as to which sensormight have more appropriate detection abilities. On theAppomattox site, a 2.8 percent NDVI reduction was predictedby the Flores regression model as compared to a larger NDVIreduction (5.0 percent) observed with the Ikonos-derivedNDVI. On the other site, the Flores regression model pre-dicted a larger NDVI reduction than that observed withIkonos sensor (5.0 percent versus 1.8 percent). It would beexpected that, if available, actual observed HyMap-derivedNDVI values would be more highly detectable due to thehigher spectral resolution and the corrections for atmos-pheric interference.
The 5 � 5 spatial averaging window was chosen tooffset issues inherent within higher spatial resolutionsensors: (a) the introduction of heterogeneity at a finerscale than that from which in situ LAI is measured, and(b) the resolving of canopies at the individual tree level(Cohen et al., 1990; Turner et al., 1999). Regarding thecomparison of the various VIs, NDVI detected the mostchange in biomass compared to the other four indices. Bothsites had yet to reach the asymptotic point in the NDVI-LAIrelationship; thus, the relationship was described as linear.However, the SR vegetation index may be more useful inareas of higher biomass due to the linear relationship withLAI (Flores, 2003).
ConclusionsAppomattox results showed that the percentage of removedunderstory detected by the Ikonos sensor in a piedmontsite was 5.0 percent when compared to an actual in situ LAIreduction of 10.0 percent. The Hertford results showed thata larger percentage of NDVI change was undetected by theIkonos sensor (1.8 percent) when compared to the actualLAI reduction as measured in situ (17.4 percent). Possiblereasons for these differences may be based upon underly-ing soil types (organic) and/or bi-directional reflectancedistribution functions for the non-Lambertian Ilex opacacanopy. Off-nadir image acquisitions for both sites wouldinhibit view of understory conditions for both sites (solarelevation � 65°).
AcknowledgmentsThe authors wish to express their gratitude to Jerry Hansenof International Paper Corporation and Vick Ford of Mead-Westvaco who facilitated access to the Appomattox andHertford sites. Ikonos imagery was provided through theNASA Data Buy Program managed by Jeff Morisette and JaimeNickeson. In addition, John Duncan, Malcolm Wilkins,Milton Bowen, and Govind Gawdi provided network andlogistical support. Administrative, statistical, and technicalsupport was given by John Lyon, L. Dorsey Worthy, RossLunetta, David Holland, Megan Mehaffey, Jayantha Ediri-wickrema, and Joe Knight. Lastly, we would like to thankthree anonymous reviewers who provided input to thisarticle as well as the UNH Dissertation Committee whocritiqued the initial study design and results: John D. Aber,Mark J. Ducey, Mary E. Martin, and M.L. Smith. The U.S.Environmental Protection Agency funded and conducted theresearch described in this paper. It has been subject to theAgency’s programmatic review and has been approved forpublication. Mention of any trade names or commercialproducts does not constitute endorsement or recommenda-tion for use.
ReferencesAber, J.D., and J.M. Melillo, 2001. Terrestrial Ecosystems, Academic
Press, San Diego, California, 556 p.Avery, T.E., and H. Burkhart, 1993. Forest Measurements, New
York, McGraw Hill Text, 331 p.Baret, F., and G. Guyot, 1991. Potentials and limits of vegetation
indices for LAI and APAR assessment (absorbed photosyntheti-cally active radiation), Remote Sensing of Environment,35:161–173.
Beer, A., 1853. Einleitung in die höhere Optik, Vieweg und Sohn,Braunschweig, Germany, 430 p.
Badhwar, G.D., R.B. MacDonald, F.G. Hall, and J.G. Carnes, 1986.Spectral characterization of biophysical characteristics in aboreal forest: relationship between Thematic Mapper bandreflectance and leaf area index for aspen, IEEE Transactions onGeoscience and Remote Sensing, GE-24:322–326.
Bouman, B.A., 1992. Accuracy of estimating the leaf area indexfrom vegetative indices derived from crop reflectance character-istics, A simulation study, International Journal of RemoteSensing, 13:3069–3084.
Breda, N.J.J., 2003. Ground-based measurements of leaf area index:A review of methods, instruments and current controversies,Journal of Experimental Botany, 54(392):2403–2417.
Carlson, T.N., and D.A. Ripley, 1997. On the relation betweenNDVI, fractional vegetation cover and leaf area index, RemoteSensing of Environment, 62:241–252.
Chason, J.W., D.D. Baldocchi, and M.A. Huston, 1991. A comparisonof direct and indirect methods for estimating forest canopy leafarea, Agricultural and Forest Meteorology, 57:107–128.
1398 Novembe r 2008 PHOTOGRAMMETRIC ENGINEER ING & REMOTE SENS ING
06-091.qxd 10/11/08 8:44 PM Page 1398

Chen, J.M., and T.A. Black, 1992a. Defining leaf-area index for non-flat leaves, Plant Cell and Environment, 15(4):421–429.
Chen, J.M., and T.A. Black, 1992b. Foliage area and architecture ofplant canopies from sunfleck size distributions, Agriculturaland Forest Meteorology, 60:249–266.
Chen, J.M., and J. Cihlar, 1996. Retrieving leaf area index of borealconifer forests using Landsat TM images, Remote Sensing ofEnvironment, 55:153–162.
Chen, J.M., 1996. Optically-based methods for measuring seasonalvariation of leaf area index in boreal conifer stands, Agriculturaland Forest Meteorology, 80:135–163.
Chen, J.M., G. Pavlic, L. Brown, J. Cihlar, S.G. Leblanc, H.P. White,R.J. Hall, D.R. Peddle, D.J. King, J.A. Trofymow, E. Swift,J. Vander Sanden, and P.K.E. Pellikka, 2002. Derivation andvalidation of Canada-wide coarse-resolution leaf area indexmaps using high-resolution satellite imagery and groundmeasurements, Remote Sensing of Environment, 80:165–184.
Chen, J.M., A. Govind, O. Sonnentag, Y. Zhang, A. Barr, andB. Amiro, 2006. Leaf area measurements at Fluxnet-Canadaforest sites, Agricultural and Forest Meteorology, 140:257–268.
Cohen, W.B., T.A. Spies, and G.A. Bradshaw, 1990. Semivariogramsof digital imagery for analysis of conifer canopy structure,Remote Sensing of Environment, 34:167–178.
Cohen, W.B., and T.A Spies, 1992. Estimating structural attributes ofDouglas-fir/western hemlock forest stands from Landsat andSPOT imagery, Remote Sensing of Environment, 41:1–17.
Danson, F.M., and P.J. Curran, 1993. Factors affecting the remotelysensed response of coniferous forest plantations, RemoteSensing of Environment, 43:55–65.
Elvidge, C.D., D. Yuan, R.D. Weerackoon, and R. Lunetta, 1995.Relative radiometric normalization of Landsat MultispectralScanner (MSS) data using an automatic scattergram-controlledregression, Photogrammetric Engineering & Remote Sensing,61(11):1255–1260.
Fassnacht, K.S., S.T. Gower, J.M. Norman, and R.E. McMurtrie,1994. A comparison of optical and direct methods for estimat-ing foliage surface area index in forests, Agricultural and ForestMeteorology, 71:183–207.
Flores, F., 2003. Using Remote Sensing Data to Estimate Leaf AreaIndex and Foliar Nitrogen of Loblolly Pine Plantations, Ph.D.dissertation, North Carolina State University, Raleigh, NorthCarolina, 115 p.
Franklin, S.E., M.B. Lavigne, M.J. Deuling, M.A. Wulder, andE.R. Hunt, 1997. Estimation of forest leaf area index usingremote sensing and GIS for modelling net primary production,International Journal of Remote Sensing, 18(16):3459–3471.
Gamon, J.A, K.F. Huemmrich, D.R. Peddle, J. Chen, D. Fuentesa,F.G. Hall, J.S. Kimball, S. Goetz, J. Gug, K.C. McDonald, J.R. Miller,M. Moghaddamh, A.F. Rahman, J.L. Roujean, E.A. Smith,C.L. Walthall, P. Zarco-Tejadan, B. Hui, R. Fernandes, and J. Cihlar, 2004. Remote sensing in BOREAS: Lessons learned,Remote Sensing of Environment, 89(2):139–162.
Gates, D.M., J.J. Keegan, J.C. Schleter, and V.R. Weidner, 1965.Spectral property of plants, Applied Optics, 4(1):11–20.
Gausmann, H.W., W.A. Allen, and R. Cardenas, 1969. Reflectance ofcotton leaves and their structure, Remote Sensing of Environ-ment, 1:110–122.
Gholz, H.L., 1982. Environmental limits on above-ground netprimary production, leaf-area, and biomass in vegetation zonesof the Pacific Northwest, Ecology, 63(2):469–481.
Gower, S.T., and J.M. Norman, 1991. Rapid estimation of leaf-areaindex in conifer and broad-leaf plantations, Ecology,72(5):1896–1900.
Hall, R.J., D.P. Davidson, and D.R. Peddle, 2003. Ground and remoteestimation of leaf area index in Rocky Mountain forest stands,Kananaskis, Alberta, Canadian Journal of Remote Sensing,29(3):411–427.
Hill, J., and D. Aifadopoulou, 1990. Comparative analysis ofLandsat-5 TM and SPOT HRV-1 data for use in multiple sensorapproaches, Remote Sensing of Environment, 34:55–70.
Huemmrich, K.F., and S.N. Goward, 1997. Vegetation canopyPAR absorbance and NDVI and assessment for ten tree species
with the SAIL model, Remote Sensing of Environment,61:254–269.
Hurlbert, S.H., 1984. Pseudoreplication and the design of ecologicalfield experiments, Ecological Monographs, 54:187–211.
Iiames, J.S., 2006. Assessing the Accuracy of the MODIS LAI 1-KMProduct in Southeastern United States Loblolly Pine Planta-tions: Accounting for Measurement Variance from Ground toSatellite, Ph.D. dissertation, University of New Hampshire,Durham, New Hampshire, 184 p.
Jensen, J.R., 2000. Remote Sensing of the Environment: An EarthResource Perspective, Prentice-Hall, Upper Saddle River, NewJersey,. 544 p.
Jonckheere, I., B. Muys, and P. Coppin, 2005. Allometry andevaluation of in situ optical LAI determination in Scots pine:a case study in Belgium, Tree Physiology, 25:723–732.
Law, B.E., S. Van Tuyl, A. Cescatti, and D.D. Baldocchi, 2001.Estimation of leaf area index in open-canopy ponderosa pineforests at different successional stages and management regimesin Oregon, Agricultural and Forest Meteorology, 108:1–14.
Leblon, B., L. Gallant, and H. Grandberg, 1996. Effects of shadowingtypes on ground-measured visible and nearinfrared shadowreflectances, Remote Sensing of Environment, 58:322–328.
Leblanc, S.G., and J.M. Chen, 2001. A practical scheme for correct-ing multiple scattering effects on optical LAI measurements,Agricultural and Forest Meteorology, 110:125–139.
Leblanc, S.G., J.M. Chen, and M. Kwong, 2002. Tracing Radiationand Architecture of Canopies. TRAC Manual, version 2.1.3.,Natural Resources Canada, Canada Centre for Remote Sensing,Ottawa, Ontario, Canada, 25 p.
Leblanc, S., J.M. Chen, R. Fernandes, D.W. Deering, and A. Conley,2005. Methodology comparison for canopy structure parametersextraction from digital hemispherical photography in borealforests, Agricultural and Forest Meteorology, 129:187–207.
Lee, K.-S., W.B. Cohen, R.E. Kennedy, T.K. Maiersperger, andT. Gower, 2004. Hyperspectral versus multispectral data forestimating leaf area index in four different biomes, RemoteSensing of Environment, 91:508–520.
Miller, J.B., 1967. A formula for average foliage density, AustralianJournal of Botany, 15:141–144.
Miller J.R., H.P. White, J.M. Chen, D.R. Peddle, G. Mcdermid,R.A. Fournier, P. Shepherd, I. Rubinstein, J. Freemantle,R. Soffer, and E. Ledrew, 1997. Seasonal change in understoryreflectance of boreal forests and influence on canopy vegetationindices, Journal of Geophysical Research,102(d24):29,475–29,482.
Morisette, J.T., J.E. Nickeson, P. Davis, Y.J. Wang, Y.H. Tian,C.E. Woodcock, N. Shabanov, M. Hansen, W.B. Cohen,D.R. Oetter, and R.E. Kennedy, 2003. High spatial resolutionsatellite observations for validation of MODIS land products:IKONOS observations acquired under the NASA Scientific DataPurchase, Remote Sensing of Environment, 88:100–110.
Morisette, J.T., F. Baret, J.L. Privette, R.B. Myneni, J. Nickeson,S. Garrigues, N. Shabanov, M. Weiss, R. Fernandes, S. Leblanc,M. Kalacska, G. Sánchez-Azofeifa, M. Chubey, M.B. Rivard,P. Stenberg, M. Rautiainen, P. Voipio, T. Manninen, A. Pilant,T. Lewis, J. Iiames, R. Colombo, M. Meroni, L. Busetto,W. Cohen, D. Turner, E. Warner, G.W. Petersen, G. Seufert, andR. Cook, 2006. Validation of global moderate-resolution LAIProducts: A framework proposed within the CEOS land productvalidation subgroup, IEEE Transactions of Geoscience andRemote Sensing, 44(7):1804–1817.
Myers, V.I., 1970. Soil, water, and plant relations, Remote Sensingwith Special Reference to Agriculture and Forestry, NationalAcademy of Sciences, Washington, D.C., pp. 253–297.
Nemani, R., L. Pierce, and S. Running, 1993. Forest ecosystemprocesses at the watershed scale: Sensitivity to remotely sensedleaf area index estimates, International Journal of RemoteSensing, 14(13):2519–2534.
Peterson, D.L., and S.W. Running, 1989. Applications in forestscience and management, Theory and Application of OpticalRemote Sensing (G. Asrar, editor), Wiley, New York, 429–473 p.
Pierce, L.L., and S.W. Running, 1988. Rapid estimation of conifer-ous leaf-area index using a portable integrating radiometer,Ecology, 69(6):1762–1767.
PHOTOGRAMMETRIC ENGINEER ING & REMOTE SENS ING Novembe r 2008 1399
06-091.qxd 10/11/08 8:44 PM Page 1399

Powell, T.L., G. Starr, K.L. Clark, T.A. Martin, and H.L. Gholz,2005. Ecosystem and understory water and energy exchangefor a mature, naturally regenerated pine flatwoods forest innorth Florida, Canadian Journal of Forest Research,35:1568–1580.
Sampson, D.A., T.J. Albaugh, K.H. Johnsen, H.L. Allen, andS.J. Zarnoch, 2003. Monthly leaf area index estimates frompoint-intime measurements and needle phenology forPinus taeda, Canadian Journal of Forest Research,33:2477–2490.
Schlerf, M., C. Atzberger, and J. Hill, 2005. Remote sensing of forestbiophysical variables using HyMap imaging spectrometer data,Remote Sensing of Environment, 95:177–194.
Soudani, K., C. Francois, G. le Maire, V. Le Dantec, and E. Dufrene,2006. Comparative analysis of IKONOS, SPOT, and ETM� datafor leaf area index estimation in temperate coniferous anddeciduous forest stands, Remote Sensing of Environment,102:161–175.
Spanner, M.A., L.L. Pierce, D.L. Peterson, and S.W. Running, 1990.Remote sensing of temperate coniferous forest leaf area index:The influence of canopy closure, understory vegetation andbackground reflectance, International Journal of RemoteSensing, 11(1):95–111.
Stenback, J.M., and R.G. Congalton, 1990. Using Thematic Mapperimagery to examine forest understory, PhotogrammetricEngineering & Remote Sensing, 56(9):1285–1290.
Steven, M.D., T.J. Malthus, F. Baret, H. Xu, and M.J. Chopping,2003. Intercalibration of vegetation indices from different sensorsystems, Remote Sensing of Environment, 88(4):412–422.
Teillet, P.M., K. Staenz, and D.J. Williams, 1997. Effects of spectralspatial and radiometric characteristics of remote sensingvegetation indices of forested regions, Remote Sensing ofEnvironment, 61:139–149.
Turner, D.P., W.B. Cohen, R.E. Kennedy, K.S. Fassnacht, andJ.M. Briggs, 1999. Relationships between leaf area index andLandsat TM spectral vegetation indices across three temperatezone sites, Remote Sensing of Environment, 70:52–68.
Williams, D.L., 1991. A comparison of spectral reflectance proper-ties at the needle, branch, and canopy level for selected coniferspecies, Remote Sensing of Environment, 35:79–93.
Williams, M., B.E. Law, P.M. Anthoni, and M.A. Unsworth, 2001.Use of a simulation model and ecosystem flux data to examinecarbon-water interactions in ponderosa pine, Tree Physiology,21:287–298.
Yoder, B.J., and R.H. Waring, 1994. The normalized differencevegetation index of small Douglas-fir canopies with varyingchlorophyll concentrations, Remote Sensing of Environment,49:81–91.
(Received 21 August 2006; accepted 06 February 2007; revised04 April 2007)
1400 Novembe r 2008 PHOTOGRAMMETRIC ENGINEER ING & REMOTE SENS ING
November Layout.indd 1400November Layout.indd 1400 10/14/2008 1:42:26 PM10/14/2008 1:42:26 PM