leads for sharon block (2213 a&b) offshore namibiaecooilandgas.com/_resources/reports/sharon...
TRANSCRIPT

Leads for Sharon Block (2213 A&B) Offshore Namibia
Prepared According To National Instrument 51-101
Date of this Report: March 6, 2012
Prepared for:
ECO Atlantic Oil and Gas
and
Kinley Exploration LLC
Prepared By:
Phone: 1-303-443-2209, Fax: 1-303-443-3156
E-mail: [email protected]

Leads for Sharon Block (2213 A&B) Offshore Namibia
Prepared According To National Instrument 51-101
Date of this Report: March 6, 2012
Prepared for:
ECO Atlantic Oil and Gas
and Kinley Exploration LLC
Prepared By:
Letha C. Lencioni Registered Petroleum Engineer
State of Colorado #29506
Phone: 1-303-443-2209, Fax: 1-303-443-3156 E-mail: [email protected]

3/6/2012 1 Gustavson Associates
1. EXECUTIVE SUMMARY
The subject area is located in the offshore of Namibia which is on the west coast of southern
Africa situated south of Angola, north of South Africa, and west of Botswana. ECO Atlantic Oil
and Gas acquired the licenses to four blocks in the Namibian offshore. This report describes the
preliminary assessment of the hydrocarbon potential of Blocks 2213A and 2213B collectively
named Sharon Block, which covers approximately 10,000 square kilometers. This block is
within the Walvis Basin in water depths ranging from 10 to 500 meters.
The data provided includes speculative 2D seismic data and reports from four wells that were
drilled in the vicinity of the block. The interpretation of 606 line kilometers of 2D seismic data
that was acquired by Western-GECO over Sharon Block has produced two leads. The leads
which are interpreted as structures with associated faults are identified as the North Structure and
the Wedge. The faults that help to set up the leads are interpreted to extend down into the Lower
Permian (Artinskian) aged lacustrine Whitehill source rock and would provide a migration
pathway to potential reservoir quality rocks. The leads appear to be within Lower Cretaceous
aged strata. The total potential reservoir section through the Lower Cretaceous interval is
estimated to be up to 500 meters thick and would most likely be sourced by Lower Permian or
Hauterivian aged rocks. In addition there is the potential for Albian aged reef carbonate plays
similar to those discovered in the Santos Basin in the offshore of Brazil.
The current Lower Cretaceous leads range in size from 47 to 1,207 square kilometers and are
estimated to be 25 to 150 meters thick at a depth of 2,600 to 2,700 meters at the top of the
structures. The hydrocarbon generated by the Lower Permian source rocks is expected to be a 32
degree API oil with an associated Gas Oil Ratio (GOR) of 1,500 cubic feet per barrel. Based on
probabilistic estimates, the Prospective Resources for the two leads are listed below in Table 1-1.

3/6/2012 2 Gustavson Associates
Table 1-1 Gross Prospective Resource Estimates by Lead
Oil in Place, MMBO Prospective Oil Resources, MMBO
Lead Low
Estimate Best
EstimateHigh
EstimateLow
EstimateBest
Estimate High
EstimateN Structure 2,699 8,149 18,690 604 1,864 4,449 Wedge 9,362 25,843 62,016 2,132 5,933 14,706 Total 12,062 33,992 80,706 2,736 7,798 19,155 (MMBO = million barrels of oil)
Note that these estimates do not include consideration for the risk of failure in exploring for these
resources. Prospective Resources are defined as “those quantities of petroleum estimated, as of a
given date, to be potentially recoverable from undiscovered accumulations by application of
future development projects. Prospective Resources have both an associated chance of discovery
and a chance of development. Prospective Resources are further subdivided in accordance with
the level of certainty associated with recoverable estimates assuming their discovery and
development and may be sub-classified based on project maturity.”1 There is no certainty that
any portion of the resources will be discovered. If discovered, there is no certainty that it will be
commercially viable to produce any portion of the resources. The Low Estimate represents the
P90 values from the probabilistic analysis (in other words, the value is greater than or equal to the
P90 value 90% of the time), while the Best Estimate represents the P50 and the High Estimate
represents the P10.2
The geologic history of the area includes the time period when the separation of the South
American continent from the African continent occurred. Many oil and gas fields have been
discovered on both sides of the Atlantic Ocean in western Africa as well as Brazil. The Santos
Basin in the offshore of southern Brazil has had a number of commercial hydrocarbon
discoveries recently and could be considered the mirror image of the Walvis Basin in Namibia
where Sharon Block is located.
1 Society of Petroleum Evaluation Engineers, (Calgary Chapter): Canadian Oil and Gas Evaluation Handbook, Second Edition, Volume 1, September 1, 2007, pg 5-7. 2 Society of Petroleum Evaluation Engineers, (Calgary Chapter): Canadian Oil and Gas Evaluation Handbook, Second Edition, Volume 1, September 1, 2007, pg 5-7.

3/6/2012 3 Gustavson Associates
ECO’s future planned expenditures for this project include a budget over the next eight years
estimated to be US$139,450,000. The next phase of the exploration of this block would include
the acquisition of new 2D and 3D seismic data. ECO would then drill a well to test the ideas
presented in this report.

3/6/2012 4 Gustavson Associates
2. TABLE OF CONTENTS
PAGE
1. EXECUTIVE SUMMARY ...................................................................................................... 1
2. TABLE OF CONTENTS .......................................................................................................... 4
3. INTRODUCTION .................................................................................................................... 7
3.1 AUTHORIZATION ......................................................................................................... 7 3.2 INTENDED PURPOSE AND USERS OF REPORT ..................................................... 7 3.3 OWNER CONTACT AND PROPERTY INSPECTION................................................ 7 3.4 SCOPE OF WORK .......................................................................................................... 7 3.5 APPLICABLE STANDARDS ........................................................................................ 7 3.6 ASSUMPTIONS AND LIMITING CONDITIONS ....................................................... 8 3.7 INDEPENDENCE/DISCLAIMER OF INTEREST........................................................ 8
4. DISCLOSURES REGARDING LEADS ................................................................................. 9
4.1 LOCATION AND BASIN NAME .................................................................................. 9 4.2 GROSS AND NET INTEREST IN THE PROPERTY ................................................. 10 4.3 EXPIRY DATE OF INTEREST ................................................................................... 10 4.4 DESCRIPTION OF TARGET ZONES ......................................................................... 10 4.5 DISTANCE TO THE NEAREST COMMERCIAL PRODUCTION ........................... 12 4.6 PRODUCT TYPES REASONABLY EXPECTED ...................................................... 12 4.7 RANGE OF POOL OR FIELD SIZES .......................................................................... 13 4.8 DEPTH OF THE TARGET ZONE ............................................................................... 13 4.9 IDENTITY AND RELEVANT EXPERIENCE OF THE OPERATOR ....................... 13
4.10 RISKS AND PROBABILITY OF SUCCESS .................................................... 13 4.11 FUTURE WORK PLANS AND EXPENDITURES .......................................... 15 4.12 MARKET AND INFRASTRUCTURE .............................................................. 15
5. GEOLOGY ............................................................................................................................. 16
5.1 STRUCTURE ................................................................................................................ 16 5.2 STRATIGRAPHY ......................................................................................................... 20 5.3 PETROLEUM SYSTEM ............................................................................................... 20 5.4 SOURCE ROCKS ......................................................................................................... 22 5.5 GENERATION AND MIGRATION ............................................................................ 22 5.6 RESERVOIR ROCKS ................................................................................................... 23 5.7 TRAPS AND SEALS .................................................................................................... 23 5.8 ANALOGOUS FIELDS ................................................................................................ 23
5.8.1 Angola ................................................................................................................... 23 5.8.2 Santos Basin .......................................................................................................... 24
5.9 EXPLORATION HISTORY ......................................................................................... 24 5.10 CONTRACT AREAS .................................................................................................... 25 5.11 MINIMUM WORK OBLIGATIONS ........................................................................... 26 5.12 LEADS ........................................................................................................................... 27 5.13 DATABASE .................................................................................................................. 32
5.13.1 Seismic Data ....................................................................................................... 32

3/6/2012 5 Gustavson Associates
5.13.2 Well Data ............................................................................................................ 32
6. PROBABILISTIC RESOURCE ANALYSIS ........................................................................ 33
6.1 GENERAL ..................................................................................................................... 33 6.2 INPUT PARAMETERS ................................................................................................ 33 6.3 PROBABILISTIC SIMULATION ................................................................................ 35 6.4 RESULTS ...................................................................................................................... 35
7. REFERENCES ....................................................................................................................... 38
8. CONSENT LETTER .............................................................................................................. 40
9. CERTIFICATE OF QUALIFICATION ................................................................................. 41

3/6/2012 6 Gustavson Associates
LIST OF FIGURES
FIGURE PAGE
Figure 4-1 Map Showing Location of Sharon Block within the Walvis Basin .............................. 9 Figure 4-2 World Location of Namibia ....................................................................................... 10 Figure 4-3 Location of Leads in Sharon Block Namibia ............................................................. 11 Figure 4-4 Seismic Line at Well 2012/13-001 Location ............................................................. 12 Figure 5-1 Diagram of the Opening of the South Atlantic Margin.............................................. 17 Figure 5-2 Close-up of the Subject Area During the Opening of the South Atlantic Margin ..... 18 Figure 5-3 Rift to Drift Configuration in the South Atlantic ....................................................... 18 Figure 5-4 Sedimentary Basins in offshore Namibia ................................................................... 19 Figure 5-5 Generalized Stratigraphic Chart of Offshore Namibia ............................................... 21 Figure 5-6 Location of Sharon Block .......................................................................................... 26 Figure 5-7 Map showing the locations of the Sharon Block Leads, and seismic data base ........ 28 Figure 5-8 Map and Seismic line showing North Structure Lead ............................................... 30 Figure 5-9 Map and Seismic line showing Wedge Lead .............................................................. 31 Figure 6-1 Distribution of Prospective Oil Resources, N. Structure Lead .................................. 36 Figure 6-2 Distribution of Prospective Oil Resources, Wedge Lead ........................................... 36
LIST OF TABLES TABLE PAGE Table 1-1 Gross Prospective Resource Estimates by Lead ............................................................. 2 Table 4-1 Range of the Probability of Success (POS) ................................................................. 14 Table 5-1 Coordinates of Sharon Block ....................................................................................... 25 Table 5-2 Minimum Work Obligations ....................................................................................... 27 Table 6-1 Input Parameters Common to Both Leads ................................................................... 34 Table 6-2 Input Parameters Varied by Lead ................................................................................ 34 Table 6-3 Gross Prospective Resource Estimates by Lead .......................................................... 35

3/6/2012 7 Gustavson Associates
3. INTRODUCTION
3.1 AUTHORIZATION
Gustavson Associates LLC (the Consultant) has been retained by ECO Atlantic Oil and Gas and
Kinley Exploration LLC collectively known as ECO (the Client, ECO) to prepare a Report
under Canada's National Instrument 51-101, Standards of Disclosure For Oil and Gas Activities,
regarding the Blocks 2213A and 2213B (collectively known as Sharon Block) concession
position in the offshore of the country of Namibia
3.2 INTENDED PURPOSE AND USERS OF REPORT
The purpose of this Report is to support the Client’s potential filing with the Toronto Stock
Exchange (TSX).
3.3 OWNER CONTACT AND PROPERTY INSPECTION
This Consultant has had frequent contact with the Client. This Consultant has not personally
inspected the subject property.
3.4 SCOPE OF WORK
This Report is intended to describe and quantify the Lead Prospective Resources contained
within Sharon Block that are subject to a petroleum license agreement with the Namibian
government.
3.5 APPLICABLE STANDARDS
This Report has been prepared in accordance with Canadian National Instrument 51-101. The
National Instrument requires disclosure of specific information concerning prospects, as are
provided in this Report.

3/6/2012 8 Gustavson Associates
3.6 ASSUMPTIONS AND LIMITING CONDITIONS
The accuracy of any estimate is a function of available time, data and of geological, engineering,
and commercial interpretation and judgment. While the interpretation and estimates presented
herein are believed to be reasonable, they should be viewed with the understanding that
additional analysis or new data may justify their revision. Gustavson Associates reserves the
right to revise its opinions, if new information is deemed sufficiently credible to do so.
3.7 INDEPENDENCE/DISCLAIMER OF INTEREST
Gustavson Associates LLC has acted independently in the preparation of this Report. The
company and its employees have no direct or indirect ownership in the property appraised or the
area of study described. Ms. Letha Lencioni is signing off on this Report, which has been
prepared by her as a Qualified Reserves Evaluator, with the assistance of others on Gustavson’s
staff. Our fee for this Report and the other services that may be provided is not dependent on the
amount of resources estimated.

3/6/2012 9 Gustavson Associates
4. DISCLOSURES REGARDING LEADS
4.1 LOCATION AND BASIN NAME
The Sharon Block is located within the Walvis Basin as seen in Figure 4-1 which is located in
the offshore of Namibia on the west coast of southern Africa situated south of Angola, north of
South Africa, and west of Botswana, Figure 4-2. The ECO acreage is located in the southern
part of the Walvis Basin.
Figure 4-1 Map Showing Location of Sharon Block within the Walvis Basin

3/6/2012 10 Gustavson Associates
Figure 4-2 World Location of Namibia
(Trek, 2008)
4.2 GROSS AND NET INTEREST IN THE PROPERTY
ECO Atlantic Oil and Gas owns 90% of the license with NAMCOR, the National Petroleum
Corporation of Namibia, holding the remaining 10%.
4.3 EXPIRY DATE OF INTEREST
The expiration date for the Exploration License 0033 in Sharon Block (Block 2213A&2213B) is
four years from the date of issue, specifically March 14, 2015. ECO has the ability to extend this
date of expiration if desired through a permit renewal prior to the expiration date.
4.4 DESCRIPTION OF TARGET ZONES
The preliminary interpretation of over 520 kilometers of 2D seismic data in offshore Namibia
acquired by Western-GECO over Sharon Block has shown excellent Lower Cretaceous reflectors
that are tied back to the Ranger 2213/6-001 well. These reflectors have been mapped throughout
the project area and form the basis for geologic horizon identification. The Leads identified as
North Structure and Wedge, Figure 4-3, are structural in nature and fault bounded.

3/6/2012 11 Gustavson Associates
Figure 4-3 Location of Leads in Sharon Block Namibia
The zone of interest is defined as the Lower Cretaceous which is depicted within the ‘Lead and
Zones of Interest’ in Figure 4-4. The seismic line in Figure 4-4 goes west to east through Sharon
Block. There is no direct seismic tie to the 2213/6-1/Ranger Oil well, which was a dry hole, in
the north half of the license area. The borehole has been projected into the plane of the nearby
2D seismic data.

3/6/2012 12 Gustavson Associates
Figure 4-4 Seismic Line at Well 2012/13-001 Location
4.5 DISTANCE TO THE NEAREST COMMERCIAL PRODUCTION
Oil is being produced in the offshore of Angola approximately 900 kilometers to the north from
multiple fields and gas has been produced from the Kudu Field approximately 600 kilometers to
the south in the offshore of Namibia.
4.6 PRODUCT TYPES REASONABLY EXPECTED
Oil of 30 to 34 degrees API with associated gas is the expected hydrocarbon type to be found in
these leads due to the Lower Permian aged source rock being within the hydrocarbon generating
window.

3/6/2012 13 Gustavson Associates
4.7 RANGE OF POOL OR FIELD SIZES
The two leads have minimum to maximum areas of closure ranging from 47 to 1,207 square
kilometers with gross thicknesses ranging from 25 to 150 meters. The gross thickness is
estimated from the top of the structure to the depth of closure.
4.8 DEPTH OF THE TARGET ZONE
These leads are estimated to occur at a depth range of 2,600 to 2,700 meters with a normal
pressure and temperature gradient. This is based on a time-depth relationship utilized by Shell
Oil since no check shot information or VSP data was available at the time of interpretation.
4.9 IDENTITY AND RELEVANT EXPERIENCE OF THE OPERATOR
ECO Atlantic Oil & Gas (“ECO”) is a wholly owned subsidiary of ECO Oil & Gas Ltd. ECO
Oil & Gas Ltd is an integrated oil and gas exploration company. ECO was founded in 2008 and
is headquartered in Toronto, Ontario, Canada, with offices in the British Virgin Islands and
Windhoek, Namibia. ECO is focusing its efforts on the new energy plays in Namibia. In the
offshore of Namibia, ECO holds three license blocks (2213A and 2213B/Sharon License,
2012A/Cooper License, 2111B and 2211A/Guy License) which cover more than 25,000 square
kilometers (6,177,000 acres). Onshore, ECO holds licenses to two blocks covering 30,000
square kilometers (7,413,000 acres). The directors of ECO have varied experience over the
mining and exploration industries, including multi-commodity resource development,
geotechinical analysis, and investment.
4.10 RISKS AND PROBABILITY OF SUCCESS
Due to the paucity of available data, the subject leads have a high level of risk. The database is
limited to sparse 2D seismic data coverage and very few wells in the area. The lead section,
Lower Cretaceous, had not been evaluated in detail in the wells drilled in the area. The

3/6/2012 14 Gustavson Associates
quantification of risk or the chance of finding commercial quantities of hydrocarbons in any
single lead for this play can be characterized with the following variables:
Structure: defined as the presence of a structure or stratigraphic feature that could act as a trap
for hydrocarbons;
Seal: defined as an impermeable barrier that would prevent hydrocarbons from leaking out of the
structure;
Reservoir: defined as the rock that is in a structurally favorable position having sufficient void
space present whether it be matrix porosity or fracture porosity to accumulate hydrocarbons in
sufficient quantities to be commercial; and
Presence of Hydrocarbons: defined as the occurrence of hydrocarbon source rocks that could
have generated hydrocarbons during a time that was favorable for accumulation in the structure.
Table 4-1 shows the range of the Probability of Success (POS) or favorability that the above
defined variables would occur. The Overall POS is the product of all four variables.
Table 4-1 Range of the Probability of Success (POS)
Probability of
Success (POS)
Range %
Min Max Comments
Structure 50 80 Seismic data indicates the presence of structures
Seal 20 50 Typical shale layers
Reservoir 10 50 Assumed to be similar to other areas in the world
Presence of HC 10 50 Analogous production in Angola
Overall 0.1 10.0 The product of the above factors
The predominant risks relate to the presence of an intact seal, the timing of source maturation,
and the presence of an effective reservoir sufficient for the creation of commercial accumulations
of oil and gas. This range of risk values is typical of leads to wildcat exploratory prospects where
data is scarce.
3/6/2012 15 Gustavson Associates
4.11 FUTURE WORK PLANS AND EXPENDITURES
The total future budget for the next eight years is estimated by ECO to be US$139,450,000. The
first phase of exploration, estimated to last one year from the effective date of the license
agreement, includes a desktop study that is estimated to cost US$550,000. ECO will acquire and
review all available information and assess that information to complete the interpretation and
selection of exploration targets.
The second phase in 2012 and 2013 will include the acquisition of 1,000 square kilometers of 3D
seismic data within the license block after potential drilling targets have been selected. The
anticipated budget for this phase which will include seismic acquisition, processing, and
interpretation, is US$10,400,000.
Phase three entails the drilling of an exploratory well, which will be drilled to a depth that will be
defined from the 3D seismic intrepretation. A rig will be contracted in 2014 and drilling will
commence in 2015. The budget for exploratory drilling is US$122,750,000.
A two year renewal of the license is planned for 2015 to continue the resource, production, and
engineering assessments with a budget of US$750,000. The license will then be renewed for an
additional two years to acquire an additional 500 square kilometers of seismic data and conduct
additional geologic and target assessments with a budget of US$5,000,000.
4.12 MARKET AND INFRASTRUCTURE
Oil is being produced in the offshore of Angola to the north from multiple fields and gas has
been produced from the Kudu Field to the south in the offshore of Namibia. The market and
infrastructure near the license area will have to be developed as exploration continues.

3/6/2012 16 Gustavson Associates
5. GEOLOGY
5.1 STRUCTURE
During the Triassic Period, Africa and South America were connected as a part of Gondwana.
Gondwana began to rift or spread apart during the Jurassic Period and the South Atlantic margin
started to open. The Namibian offshore basins were formed in this passive margin during the
opening of the South Atlantic and the continental break up. The basins were further developed
while the continents continued to drift apart from each other during the Cretaceous Period until
Recent time. The opening of the South Atlantic margin is depicted in Figure 5-1, from Versfelt.
The yellow box highlights Namibia along with the Santos Basin in Brazil, which is considered an
analogous play area. A detailed map of the opening of the South Atlantic in the area of interest
in offshore Namibia and the Santos Basin in Brazil is shown in Figure 5-2. The Santos Basin has
had a number of commercial hydrocarbon discoveries recently and could be considered the
mirror image of the Walvis Basin in Namibia. Figure 5-3 shows the rift to drift configuration of
the South Atlantic margin. (Versfelt, 2010)

3/6/2012 17 Gustavson Associates
Figure 5-1 Diagram of the Opening of the South Atlantic Margin. (Versfelt, 2010) Highlighted is Namibia and Brazil
Cretaceous to Tertiary sediments were deposited over early Cretaceous rift sediments to form the
basin system that extends along offshore Namibia. A distinct hinge line separates the area of
thin late drift sediments from the zone of rapid sediment thickening to the west. The hinge line
also marks the wedge-out of the syn-rift sediments. The rift zone is characterized by tilted
blocks bounded mostly by landward dipping normal faults. This series of tilted blocks runs the
entire length of the margin. The rift section passes westward into a thick wedge of westward
dipping reflectors. These seismic reflectors are thought to be volcanic and precursors to oceanic
spreading. The reflectors overlie the western edge of the syn-rift section and pass westward into
oceanic basement.

3/6/2012 18 Gustavson Associates
Figure 5-2 Close-up of the Subject Area During the Opening of the South Atlantic Margin
(Versfelt, 2010)
Figure 5-3 Rift to Drift Configuration in the South Atlantic (Versfelt, 2010)

3/6/2012 19 Gustavson Associates
The sedimentary basins in offshore Namibia are illustrated in Figure 5-4 where the area of
interest is within the Walvis Basin.
Figure 5-4 Sedimentary Basins in offshore Namibia (Bray, Lawrence, Swart, 1998) Yellow box highlights Sharon Block

3/6/2012 20 Gustavson Associates
5.2 STRATIGRAPHY
The basin system in offshore Namibia consists of four tectono-stratigraphic units - Permo-
Carboniferous pre-rift Karoo section, Early Cretaceous syn-rift section, Late
Barremian/Cenomanian early drift section, late drift section - separated by three unconformities -
base rift unconformity, base drift unconformity, Tertiary unconformity. Figure 5-5 is a
generalized stratigraphic chart of the area. The early Cretaceous syn-rift section is comprised of
aeolian sandstones and basalts. The uppermost part of this section is penetrated at the Kudu
Field in southern offshore Namibia. The base drift unconformity, which separates the early
Cretaceous syn-rift section from the late Barremian/Cenomanian age early drift section, is the
transition from non-marine to marine sediments. The late Barremian/Cenomanian age early drift
section consists of marine claystone sequences which include organic rich intervals. The late
drift section is Turonian to Recent in age and is the main part of the basin fill. This section is
dominantly a progradational sequence and is divided into the lower and upper units by the
Tertiary unconformity. (Bray, Lawrence, Swart, 1998)
5.3 PETROLEUM SYSTEM
In a frontier exploration area, any information on the petroleum system is applied or modeled to
the extent possible. However, there is usually very limited data of this sort in sparsely explored
areas and consequently, petroleum companies primarily target anticlines and fault traps for
exploratory drilling.
Petroleum systems are based on the factors affecting hydrocarbon accumulations including3:
1. trap (a structure or limit to the quality of the reservoir rock that is capable of holding
hydrocarbons) – this block has at least two structures
2. reservoir rock (one or more rock layers that has sufficient porosity and permeability to
store hydrocarbons) – the Lower Cretaceous strata are expected to be sand and shale with
sufficient porosity and permeability to store hydrocarbons
3 Magoon, 1988

3/6/2012 21 Gustavson Associates
Figure 5-5 Generalized Stratigraphic Chart of Offshore Namibia (Bray, Lawrence, Swart, 1998)

3/6/2012 22 Gustavson Associates
3. source rock (a rock layer in the region that has sufficient organic content to provide for
hydrocarbons) – the Lower Permian (Artinskian) source rock (Number 1 in Figure 5-5)
is thought to be the source rock for the zone of interest
4. maturation (the burial of the source rock sufficient to generate hydrocarbons from the
organic material within the source rock) – the Lower Permian (Artinskian) source rock
(Number 1 in Figure 5-5) should be in the oil window at this time
5. migration (the path of movement of the generated hydrocarbons from the source rock to a
trap), seal (a layer that is impermeable to hydrocarbon and prevents the hydrocarbon from
escaping the trap) – faults that would act as migration pathways have been identified on
the seismic data. These faults extend from the Lower Permian (Artinskian) source rock
(Number 1 in Figure 5-5) up into the lead structures.
6. timing (the events must occur in the correct order to create and preserve a hydrocarbon
accumulation) – the generation of hydrocarbons would have occurred recently, most
likely after the structures were formed.
5.4 SOURCE ROCKS
During early rifting, lacustrine environments were developed that were capable of preserving
organic rich, oil-prone claystones. Hauterivian (Neocomian) aged lacustrine source rocks are
present just south of the area of interest in the Orange Basin. Permian aged (Artinskian) marine
source rocks, such as the Whitehill Formation, are also believed to be present in the offshore of
Namibia.4
5.5 GENERATION AND MIGRATION
Oil would be generated from the source rocks downdip of the lead traps and would migrate along
faults that intersect both the source rock at depth and the lead section. These faults are not
observed to have reached the ocean bottom.
4 Bray, Lawrence, and Swart, “Source Rock, maturity data indicate potential off Namibia”, Oil and Gas Journal, August 1998.
3/6/2012 23 Gustavson Associates
5.6 RESERVOIR ROCKS
No core information through the Early Miocene and Late Oligocene was provided. It is assumed
that the Upper Oligocene rocks would be similar sand-shale sequences as observed in many parts
of the world and would have similar petrophysical characteristics. A core taken in the Paleocene
section in the 1911/15-1 well, which is located less than 300 kilometers northwest of Sharon
Block, at a depth of 2,423 to 2,463 meters had 90 meters of sand with an average porosity of
24.5%5.
5.7 TRAPS AND SEALS
Structural and fault traps with shale layers as a seal form the leads identified on the 2D seismic
data. These seals have not been observed in the few wells drilled in the area and the structures
are based on seismic time maps.
5.8 ANALOGOUS FIELDS
5.8.1 Angola
In 1996 Elf discovered the Girassol oil field in Oligocene turbidite clastics. The water depth of
the field is 1,400 meters and the reservoir is relatively shallow at 2,400 meters, thus the
sedimentary section overlying the reservoir is only 1,000 meters thick. Since 2001, Girassol was
on production at a steady rate of 200,000 barrels of oil per day until 2007 when production
decline commenced. Production of up to 30,000 barrels of oil per day has been achieved from
single wells.
Since the discovery of Girassol, over 70 oil fields with reserves of some 14 billion barrels have
been discovered in the Tertiary sediments of the Lower Congo Basin. These fields occur in the
following blocks: Sonangot P&P Block 4, BP Block 18, Total Block 17, Esso Block 15, Chevron
Block 14, BP Block 31 and Total Block 32. The reservoirs occur in the Miocene and Oligocene
5 Petrophysical Evaluation Report Well 1911/15-1 Norsk Hydro

3/6/2012 24 Gustavson Associates
turbidites associated with the ancestral Congo River drainage system. This play continues to
expand as indicated by the recent announcement that BP discovered its 17th oil field in Block 31
of which 5 have been sub-salt discoveries. The 15th oil discovery has been announced on Block
32.
5.8.2 Santos Basin
The Santos Basin in Brazil consists of drift and rift sections that are of similar age to the drift and
rift sections of offshore Namibia. Volcanism was present during formation, much like the early
Cretaceous syn-rift section in Namibia. Albian/Aptian carbonates are also present in the Santos
Basin like in the early drift section in Namibia. (UFRJ and Gustavson, 1999) The Tupi Oil Field
in the Santos Basin, discovered in 2006, is estimated to contain up to 8 billion barrels of
recoverable oil. (Fessler, 2011)
5.9 EXPLORATION HISTORY
The offshore of Namibia is an underexplored area with only 14 exploration wells drilled in an
area of more than 500,000 square kilometers. Five of these wells are located in the southern part
of the offshore area in Kudu Field which was drilled in 1974 and is the only discovery so far.
Offshore leases were first offered in 1968 and 1972. All of the wells drilled to date are shallow
shelf wells. By 1975 approximately 33,000 line kilometers of 2-D seismic data were shot, but
only one well was drilled. 6 A United Nations mandate in 1976 voided all concessions granted to
foreign companies by the government of South Africa and for the next 10 years there was
virtually no oil or gas activity until in 1987 and 1988. At that time, two more wells in Kudu
were drilled for Namcor. In 1989 Intera, ECL, and Halliburton Geophysical Services Inc. shot a
10,600 line kilometer regional speculative seismic survey off Namibia. This was followed up
with an infill survey of some 3,500 line kilometers and additional speculative surveys shot in the
early to mid 1990’s by TGS and Western. A total of 4 wells have been drilled in the vicinity of
Sharon Block, one of which is in Block 2213A. The 1911/15-1 well was drilled in early 1994
6 NAMIBIA, PRACTICALLY UNEXPLORED, MAY HAVE LAND, OFFSHORE POTENTIAL; Apr 8, 1991; M.P.R. Light, H. Shimutwikeni
3/6/2012 25 Gustavson Associates
and the 1911/10-1 well was drilled in early 1995 by Norsk Hydro Namibia. The Ranger Oil
Namibia Ltd 2213/6-1 was drilled in early 1995 and the Sasol 2012/13-1 well was drilled in early
1997.
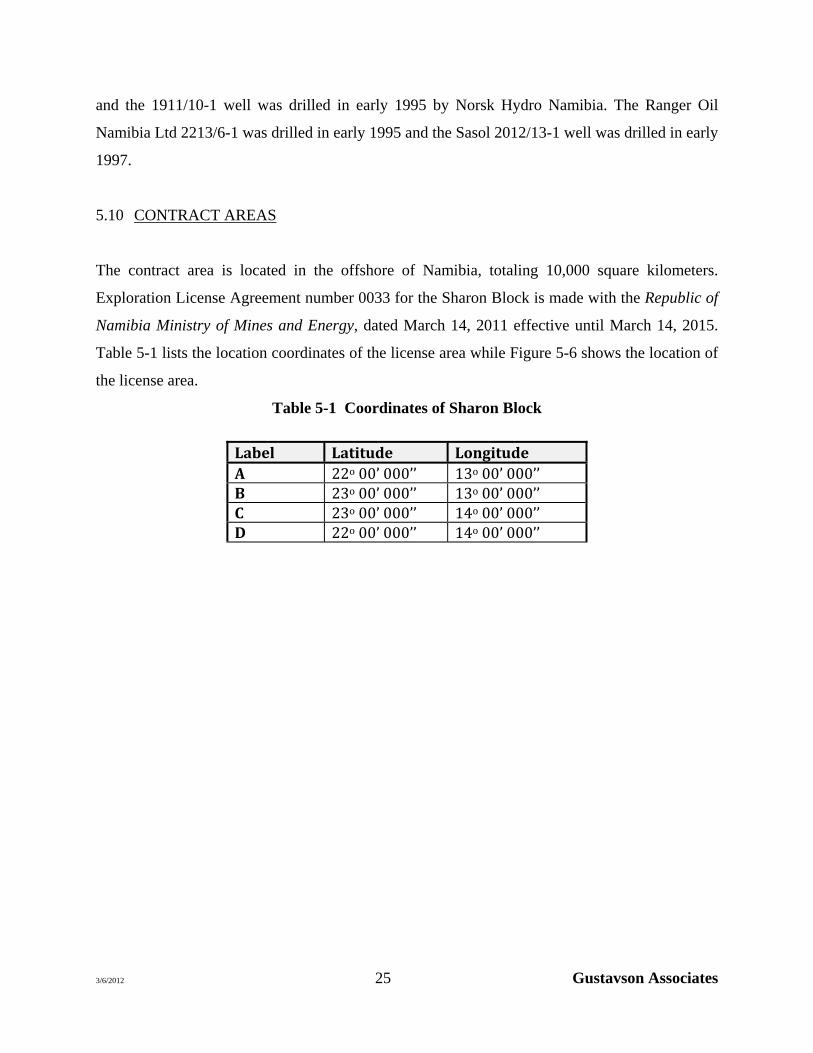
5.10 CONTRACT AREAS
The contract area is located in the offshore of Namibia, totaling 10,000 square kilometers.
Exploration License Agreement number 0033 for the Sharon Block is made with the Republic of
Namibia Ministry of Mines and Energy, dated March 14, 2011 effective until March 14, 2015.
Table 5-1 lists the location coordinates of the license area while Figure 5-6 shows the location of
the license area.
Table 5-1 Coordinates of Sharon Block
Label Latitude Longitude A 22o 00’ 000’’ 13o 00’ 000’’ B 23o 00’ 000’’ 13o 00’ 000’’ C 23o 00’ 000’’ 14o 00’ 000’’ D 22o 00’ 000’’ 14o 00’ 000’’

3/6/2012 26 Gustavson Associates
Figure 5-6 Location of Sharon Block
5.11 MINIMUM WORK OBLIGATIONS
The minimum work obligations and expenditures for the Sharon Block license are summarized
in Table 5-2 according to the Petroleum Agreement Between The Government of the Republic of
Namibia and ECO Atlantic Oil and Gas:

3/6/2012 27 Gustavson Associates
Table 5-2 Minimum Work Obligations
Minimum Exploration Work INITIAL EXPLORATION PERIOD (4 YEARS)
Minimum Exploration Expenditure
PHASE 1 DESKTOP STUDY – YEAR 1
Acquire and review all available information for this license based on information in Namibia and through internationally based research libraries including available geophysical studies, local and regional well logs and basin interpretation. Assess information and complete the Company’s interpretation and selection of regional targets and definition of 3D parameters.
US $550,000
PHASE II SEISMIC ACQUISITION SURVEY – YEARS 2 & 3
The Company will complete a survey of 1000 square kilometers of 3D Seismic with each license after regional target selection.
US $10,400,000
PHASE III DRILLING EXPLORATORY WELL – YEARS 3 & 4
Assuming a target has been defined after interpretation of the 3D survey, a well will be committed to be drilled on each license. The well will be drilled to depth to intersect the targets determined in the 3D processing. Based on the current processing schedule, the company will contract a rig in year three and drill in year four. If the company is awarded more than one license it is anticipated the same rig would be used for the committed drilling and our timing for completion of drilling the wells would be adjusted accordingly.
US $122,750,000
1ST RENEWAL PERIOD (2 years)
PHASE IV RESOURCE ASSESSMENT & PRODUCTION ASSESSMENT - YEAR 5
US $250,000
PHASE V OFFTAKE/PRODUCTION ENGINEERING ASSESSMENT & PLANNING - YEAR 6
US $500,000
2ND RENEWAL PERIOD (2 years)
PHASE VI - ADDITIONAL SEISMIC ACQUISITION SURVEY OF 500 KM2, GEOLOGICAL ASSESSMENT AND TARGET
ASSESSMENT, YEARS 7 & 8
US $5,000,000
5.12 LEADS
The interpretation of over 606 kilometers of 2D seismic data in offshore Namibia acquired by
Western-GECO over Sharon Block has produced two leads. The leads are called North Structure

3/6/2012 28 Gustavson Associates
and Wedge and are interpreted as structures with associated faults. These faults are interpreted to
extend down into the Lower Permian aged source rock.
The expected reservoir parameters of the leads are discussed in Section 6.2.
Figure 5-7 Map showing the locations of the Sharon Block Leads, and seismic data base

3/6/2012 29 Gustavson Associates
The leads are all in the west portion of Sharon Block (Figure 5-7). The 2D seismic data was tied
into the Ranger 2213/6-1 well which is located in the north portion of the block of interest. As
no seismic line runs directly across the well, the borehole was projected into the plane of nearby
2D seismic data.
The North Structure Lead is structural in nature, Figure 5-8. It is fault bounded and has structural
closure over 400 meters. The bounding faults extend to the Lower Permian and would provide a
convenient path for hydrocarbon migration from the deeper Lower Permian source rocks.
The Wedge lead is a stratigraphic pinchout, Figure 5-9. The abnormally thick sequence of Lower
Cretaceous rocks, in excess of 1,000 meters, abruptly truncates to the east as it hits basement and
appears absent on the north and south flanks. Deep normal faulting is prevalent throughout the lead
and is believed to be a conduit for hydrocarbon migration.

3/6/2012 30 Gustavson Associates
Figure 5-8 Map and Seismic line showing North Structure Lead

3/6/2012 31 Gustavson Associates
Figure 5-9 Map and Seismic line showing Wedge Lead

3/6/2012 32 Gustavson Associates
5.13 DATABASE
There is a paucity of well data in the offshore of Namibia and the bulk of the seismic data
consists of speculative 2D data acquired by TGS-NOPEC, Western-GECO and CGG-Veritas.
5.13.1 Seismic Data
ECO has purchased the rights to 527 line kilometers of 2D seismic data from Western-GECO
over Sharon Block. The data acquired by ECO is adequate to identify two large lead areas on the
block.
5.13.2 Well Data
A total of four wells have been drilled in the vicinity of Sharon Block, one of which is in Sharon
Block. These wells include the 1911/10-1 well drilled by Norsk Hydro Namibia in early 1995 to
a depth of 4,185 meters in a water depth of 631 meters; the 1911/15-1 well drilled by Norsk
Hydro Namibia in early 1994 to a depth of 4,586 meters in a water depth of 521.5 meters. The
Sasol 2012/13-1 well was drilled in early 1997 to a depth of 3,714 meters in a water depth of 688
meters. The seismic data is tied into the Ranger Oil Namibia Ltd 2213/6-1 located in the north
section of Sharon Block. The well was drilled in early 1995 to a depth of 2,627 meters in a water
depth of 218 meters. All of the available reports offered by Namcor, the Namibian National oil
company, were copied for ECO. These reports are largely biostratigraphic studies and core
reports of cores taken in the deeper Campanian and Albian sections. No electric well log files or
prints were provided or available at this time. The petrophysical characteristics for the Upper
Oligocene section were assumed from other sand shale accumulations in other parts of the world.

3/6/2012 33 Gustavson Associates
6. PROBABILISTIC RESOURCE ANALYSIS
6.1 GENERAL
A probabilistic resource analysis is most applicable for projects such as evaluating the potential
resources of an exploratory area like the Sharon Block, where a range of values exists in the
reservoir parameters. The range of the expected reservoir data is quantified by probability
distributions, and an iterative approach yields an expected probability distribution for potential
resources. This approach allows consideration of most likely resources for planning purposes,
while gaining an understanding of what volumes of resources may have higher certainty, and
what potential upside may exist for the project.
The analysis for this project was carried out considering the range of values for all parameters in
the volumetric resource equations.
6.2 INPUT PARAMETERS
This method involves estimating probability distributions for the range of reservoir parameters
and performing a statistical risk analysis involving multiple iterations of resource calculations
generated by random numbers and the specified distributions of reservoir parameters. To do this,
each parameter incorporated in our resource calculation was evaluated for its expected
probability distribution.
Because little data are available about the likely distribution of the reservoir parameters, simple
triangular distributions with specification of minimum, most likely or mode, and maximum
values were used for most of the parameters. The exception to this is the reservoir area, for
which triangular distributions with specification of P90 or P95, most likely or mode, and P10
values were used.7 Note that these parameters represent average parameters over the entire
prospect. So, for example, the porosity ranges do not represent the range of what porosity might
7 The original intention was that the low values specified would represent P90 values rather than minima; however, this assumption resulted in some negative values for the N. Structure lead. The probability associated with the specified low-end value was therefore reduced until the input distribution included no negative values..

3/6/2012 34 Gustavson Associates
be in a particular well or a particular interval, but rather the reasonable range of the average
porosity for the whole prospect. Gustavson is of the opinion that this is a reasonable
approximation, and has used the same methodology. A summary of input parameters is shown in
Table 6-1 and Table 6-2.
Table 6-1 Input Parameters Common to Both Leads
Parameter MinimumMost
Likely Maximum Net to Gross % 25% 50% 75% Porosity % 10% 18.0% 26.0% Oil Saturation % 65.0% 70.0% 75.0% GOR, SCF/Bbl 500 1000 1500 Recovery Factor 15% 20% 35% Pressure Gradient, psi/ft 0.44 0.45 0.48 API Gravity 30 35 40 Gas Gravity 0.65 0.7 0.75
Table 6-2 Input Parameters Varied by Lead
Lead Area (Sq Km) Gross Thickness (m) Depth (m)
P90 Mode P10 Min Mode Max Min Mode Max N Structure 47.5* 112.7 230 50 100 150 2,400 2,600 2,800 Wedge 413.8 638 1207 25 50 100 2,400 2,600 2,800
* P95
In a probabilistic analysis, dependent relationships can be established between parameters if
appropriate. For example, portions of a reservoir with the lowest effective porosity generally
may be expected to have the highest connate water saturation, whereas higher porosity sections
have lower water saturation. In such a case, it is appropriate to establish an inverse relationship
between porosity and water saturation, such that if a high porosity is randomly estimated in a
given iteration, corresponding low water saturation is estimated. The degree of such a
correlation can be controlled to be very strong or weak. This type of dependency, with a
medium strength of -0.7, was used in this study for porosity with water saturation and with
net/gross ratio. Similarly, the low end of the gross thickness distributions for this prospective
accumulation would generally be expected to occur when the productive area is small; therefore,
a positive correlation of 0.7 was assigned to gross thickness and productive area.

3/6/2012 35 Gustavson Associates
6.3 PROBABILISTIC SIMULATION
Probabilistic resource analysis was performed using the Monte Carlo simulation software called
“@ Risk”. This software allows for input of a variety of probability distributions for any
parameter. Then the program performs a large number of iterations, either a large number
specified by the user, or until a specified level of stability is achieved in the output. The results
include a probability distribution for the output, sampled probability for the inputs, and
sensitivity analysis showing which input parameters have the most effect on the uncertainty in
each output parameter.
After distributions and relationships between input parameters were defined, a series of
simulations were run wherein points from the distributions were randomly selected and used to
calculate a single iteration of estimated potential resources. The iterations were repeated until
stable statistics (mean and standard deviation) result from the resulting output distribution. This
occurred after 5,000 iterations.
6.4 RESULTS
The output distributions were then used to characterize the Prospective Resources. Graphs of
cumulative probability versus prospective resources were constructed. Results are summarized
in Table 6-3. Note that these estimates do not include consideration for the risk of failure in
exploring for these resources. The distribution graphs for the resource estimates can be found in
Figure 6-1 and Figure 6-2.
Table 6-3 Gross Prospective Resource Estimates by Lead
Oil in Place, MMBO Prospective Oil Resources, MMBO
Lead Low
Estimate Best
EstimateHigh
EstimateLow
EstimateBest
Estimate High
EstimateN Structure 2,699 8,149 18,690 604 1,864 4,449 Wedge 9,362 25,843 62,016 2,132 5,933 14,706 Total 12,062 33,992 80,706 2,736 7,798 19,155

3/6/2012 36 Gustavson Associates
Figure 6-1 Distribution of Prospective Oil Resources, N. Structure Lead
Figure 6-2 Distribution of Prospective Oil Resources, Wedge Lead
P90=604
P50=1,864
P10=4,449
0%
10%
20%
30%
40%
50%
60%
70%
80%
90%
100%
0 2,000 4,000 6,000 8,000 10,000 12,000
Per
cen
t of
Val
ues
Gre
ater
Th
an o
r E
qu
al T
o
Prospective Oil Resources, Millions of Barrels
Prospective Oil Resources / N Structure
P90=2,132
P50=5,933
P10=14,706
0%
10%
20%
30%
40%
50%
60%
70%
80%
90%
100%
0 5,000 10,000 15,000 20,000 25,000 30,000 35,000 40,000 45,000
Per
cent
of V
alue
s G
reat
er T
han
or E
qual
To
Prospective Oil Resources, Millions of Barrels
Prospective Oil Resources / Wedge

3/6/2012 37 Gustavson Associates
Prospective Resources are defined as “those quantities of petroleum estimated, as of a given date,
to be potentially recoverable from undiscovered accumulations by application of future
development projects. Prospective Resources have both an associated chance of discovery and a
chance of development. Prospective Resources are further subdivided in accordance with the
level of certainty associated with recoverable estimates assuming their discovery and
development and may be sub-classified based on project maturity.”8 There is no certainty that
any portion of the resources will be discovered. If discovered, there is no certainty that it will be
commercially viable to produce any portion of the resources. The Low Estimate represents the
P90 values from the probabilistic analysis (in other words, the value is greater than or equal to the
P90 value 90% of the time), while the Best Estimate represents the P50 and the High Estimate
represents the P10.9
It should be noted that the shape of the probability distributions all result in wide spacing
between the minimum and maximum expected resources. This is reflective of the high degree of
uncertainty associated with any evaluation such as this one prior to actual field discovery,
development, and production. Also note that, in general, the high probability resource estimates
at the left side of these distributions represents downside risk, while the low probability estimates
on the right side of the distributions represent upside potential. These distributions do not include
consideration of the probability of success of discovering commercial quantities of oil, but rather
represent the likely distribution of oil discoveries, if successfully found.
8 Society of Petroleum Evaluation Engineers, (Calgary Chapter): Canadian Oil and Gas Evaluation Handbook, Second Edition, Volume 1, September 1, 2007, pg 5-7. 9 Society of Petroleum Evaluation Engineers, (Calgary Chapter): Canadian Oil and Gas Evaluation Handbook, Second Edition, Volume 1, September 1, 2007, pg 5-7.

3/6/2012 38 Gustavson Associates
7. REFERENCES
Bray, Richard, Steve Lawrence, and Roger Swart, “Source Rock, Maturity Date Indicate Potential off Namibia”, Oil and Gas Journal, August 1998.
“Conventional Core Analysis Well: 1911/10-1 Field: 1911/10”, Norsk Hydro, August 1995,
Conventional Core Analysis 1911_10_1 .pdf. ECO Atlantic Oil and Gas, http://www.ecooilandgas.com/ Accessed July 12, 2011. Fessler, David, “Three Ways to Profit from the Oil Market’s ‘New World Order’”, Peak Energy
Strategist, February 18, 2011, http://peakenergystrategist.com/archives/tag/santos-basin/, Accessed June 15, 2011.
“Final Well Report Well 1911/10-1”, Norsk Hydro Namibia as, December, 1995, 1911_10-1
Norsk Hydro as_Final Well Report_Well_PL001_Namibia_December 1995.pdf. “Final Well Report Well 1911/15-1”, Norsk Hydro Namibia as, 1911 15-1 FINAL WELL
REPORT, LICENSE 001 , NAMIBIA.pdf. “Licence 007, Areas 2313A&B: 2313/5-1 (Shark) Well Proposal”, Shell Namibia Exploration
B.V., November 1997. Magoon, L.B., 1988, The Petroleum System: A Classification Scheme for Research 1
Exploration and Resource Assessment, in L. B. Magoon , ed., Petroleum Systems of the United States: U.S. Geological Survey Bulletin 1870, pages 2-15.
“Petroleum Agreement Between The Government of the Republic of Namibia and ECO Atlantic
Oil and Gas”, February 2011, DEN-23065-3-Petroleum 2213A and 2213B (2).doc. Republic of Namibia, Ministry of Mines, “Petroleum Exploration Licence”, Licence No. 0033,
14 March 2011, ALL BUT 2012COOPER.pdf. Swart, Roger, “Namibia – Current Developments”, NAMCOR Ltd., Oil Africa 2006, Cape
Town, March 23, 2006. Trek International Safaris, Inc., 2008, http://www.treksafaris.com/namibia,category.asp,
Accessed June 20, 2011. UFRJ and Gustavson Associates, “Santos Basin Report for Brazil Round 1”, 1999. Versfelt, Joseph W., “South Atlantic Margin Rift Basin Asymmetry and Implications for Pre-Salt
Exploration”, Search and Discovery Article #30112, March 3, 2010.

3/6/2012 39 Gustavson Associates
“Well: 1911/15-1 Conventional Core Analysis”, Norsk Hydro Namibia a.s., February 1994, 1911_15_1 Norsk Hydro Namibia AS_Conventional Core Analysis.pdf.

3/6/2012 40 Gustavson Associates
8. CONSENT LETTER
Gustavson Associates LLC hereby consents to the use of all or any part of this Lead Evaluation
Report for the Sharon Block concessions, as of March 6, 2012, in any document filed with any
Canadian Securities Commission by ECO Atlantic Oil and Gas or Kinley Exploration LLC.
Letha C. Lencioni Vice-President, Petroleum Engineering
Gustavson Associates LLC

3/6/2012 41 Gustavson Associates
9. CERTIFICATE OF QUALIFICATION
I, Letha Chapman Lencioni, Professional Engineer of 5757 Central Avenue, Suite D, Boulder,
Colorado, 80301, USA, hereby certify:
1. I am an employee of Gustavson Associates, which prepared a detailed analysis of the oil
and gas properties of ECO Atlantic Oil and Gas and Kinley Exploration LLC. The
effective date of this evaluation is March 6, 2012.
2. I do not have, nor do I expect to receive, any direct or indirect interest in the securities of
ECO Atlantic Oil and Gas or Kinley Exploration LLC or their affiliated companies, nor
any interest in the subject property.
3. I attended the University of Tulsa and I graduated with a Bachelor of Science Degree in
Petroleum Engineering in 1980; I am a Registered Professional Engineer in the State of
Colorado, and I have in excess of 30 years’ experience in the conduct of evaluation and
engineering studies relating to oil and gas fields.
4. A personal field inspection of the properties was not made; however, such an inspection
was not considered necessary in view of information available from public information
and records, and the files of ECO Atlantic Oil and Gas and Kinley Exploration LLC.
Letha Chapman Lencioni
Chief Reservoir Engineer/ Vice-President, Petroleum Engineering
Gustavson Associates, LLC Colorado Registered Engineer #29506