leadingagekansas is exploring opportunities to provide
TRANSCRIPT

LeadingAge Kansas is exploring opportunities to provide support to Member Organizationswith the specific objective of addressing the high staff turnover for nurse and nurse aides.The first phase of research included an online survey on job satisfaction. This survey wasdesigned to give an overall impression, spanning the state of Kansas, on the satisfactionsand reasons for termination of the nurse and nurse aides. The second phase of theresearch included focus groups. The purpose of these groups was to get a deeperunderstanding of the results of the survey, address any remaining questions and providecolorful qualitative data to support the opportunities for retention improvement.
1

Phase 1 of the Research included an online survey .
2

The Survey was sent to 25 non-profit member agencies. Those agencies that agreed to participate were then instructed share the survey with all CNAs, CMAs, LPNs, RN, and Nurse Leaders.
Each agency was asked to share the survey by email, but also created a local Kiosk where any member who did not have email or internet access could complete the survey and enter the incentive drawing.
The survey was not directly tied to the incentive in order to keep names and information shared anonymous.
Incentive winners were randomly drawn from those who entered the raffle.
3

4

5

6

The following section includes an overview of the 471 participants who completed the online survey.
7

To note: CAN also included CMA or other Aide positions.
8

9

10

11

12

13

These were self selected by the participant and did not include any specific boundary markings.
14

The participant numbers reflected in this report are likely not reflective of the ethnic/racial makeup of the current staffing of the local organizations. This is based on leadership assumptions and insights.
15

16

The next section of the online survey included a Matrix of questions to assess Job Satisfaction.
17

8 areas of Job Satisfaction were identified including colleagues, compensation, management/leadership, orientation/training, personal/emotional, professional growth, commitment and work culture.
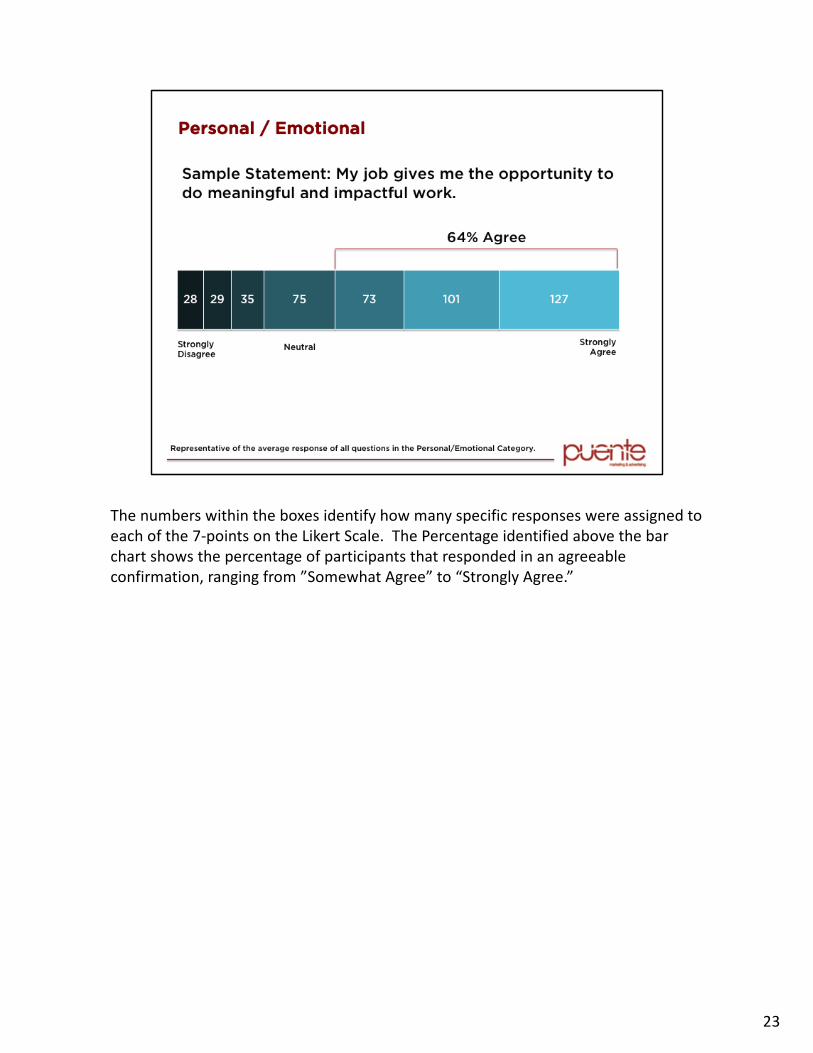
39 Statements were divided across these 8 categories. Each statement was given and participants were asked to respond on a 7 point Likert scale how much they agreed with the statement. Four statements were reverse coded to asses for validly. Thereverse coded questions were aligned with responses within the category showcasingthat the survey was in fact valid.
18

The numbers within the boxes identify how many specific responses were assigned to each of the 7-points on the Likert Scale. The Percentage identified above the bar chart shows the percentage of participants that responded in an agreeable confirmation, ranging from ”Somewhat Agree” to “Strongly Agree.”
19

The numbers within the boxes identify how many specific responses were assigned to each of the 7-points on the Likert Scale. The Percentage identified above the bar chart shows the percentage of participants that responded in an agreeable confirmation, ranging from ”Somewhat Agree” to “Strongly Agree.”
20

The numbers within the boxes identify how many specific responses were assigned to each of the 7-points on the Likert Scale. The Percentage identified above the bar chart shows the percentage of participants that responded in an agreeable confirmation, ranging from ”Somewhat Agree” to “Strongly Agree.”
21

The numbers within the boxes identify how many specific responses were assigned to each of the 7-points on the Likert Scale. The Percentage identified above the bar chart shows the percentage of participants that responded in an agreeable confirmation, ranging from ”Somewhat Agree” to “Strongly Agree.”
22
The numbers within the boxes identify how many specific responses were assigned to each of the 7-points on the Likert Scale. The Percentage identified above the bar chart shows the percentage of participants that responded in an agreeable confirmation, ranging from ”Somewhat Agree” to “Strongly Agree.”
23

The numbers within the boxes identify how many specific responses were assigned to each of the 7-points on the Likert Scale. The Percentage identified above the bar chart shows the percentage of participants that responded in an agreeable confirmation, ranging from ”Somewhat Agree” to “Strongly Agree.”
24

The numbers within the boxes identify how many specific responses were assigned to each of the 7-points on the Likert Scale. The Percentage identified above the bar chart shows the percentage of participants that responded in an agreeable confirmation, ranging from ”Somewhat Agree” to “Strongly Agree.”
25

The numbers within the boxes identify how many specific responses were assigned to each of the 7-points on the Likert Scale. The Percentage identified above the bar chart shows the percentage of participants that responded in an agreeable confirmation, ranging from ”Somewhat Agree” to “Strongly Agree.”
26

The above chart reflects the average response for all participants, separated by each of the 8 Job Satisfaction categories. Compensation was identified as having the lowest average while Orientation/Training has the highest average. The numbers and averages are based on the 7-point Likert Scale.
27

The next section of the online survey included open ended questions.
Participants were given a comment box and asked to write their responses. ThePuente Marketing team then read every response and identified recurring themes. The language of the themes were selected by the Puente Marketing research team based on the direct participant language.
28

29

The x-axis represents the themes that were identified based on the open ended responses. The numbers above each bar indicated how many responses were within that specific theme.
Note: the total number of responses exceeds the number of participants. Although participants were asked for the ”Primary” reason, the research team coded up to 3 themes for each, based on the content of the open ended answer.
Overwhelming, participants indicate they serve in their current positions out of a desire to help the residents.
30

The Word Bubble showcases the language used by the participants. All responses were entered into a software that identified the most often occurring words. The larger the word and darker the hue, the more frequently those words were directly written by participants in the survey.
31

The quotes are direct Reponses provided by participants. They were selected byrandom sampling, but represent answers to the open ended question answered.
32

33

The x-axis represents the themes that were identified based on the open ended responses. The numbers above each bar indicated how many responses were within that specific theme.
Note: the total number of responses exceeds the number of participants. Although participants were asked for the ”Primary” reason, the research team coded up to 3 themes for each, based on the content of the open ended answer.
The three most common themes include Better Salary/Benefits, Poor Leadership, and Inadequate Staffing/Workload.
34

The Word Bubble showcases the language used by the participants. All responses were entered into a software that identified the most often occurring words. The larger the word and darker the hue, the more frequently those words were directly written by participants in the survey.
35

The above quotes are direct responses provided by participants. They were selected by random sampling from those coded under the theme “Better Salary / Benefits.”
36

The above quotes are direct responses provided by participants. They were selected by random sampling from those coded under the theme “Poor Leadership.”
37

The above quotes are direct responses provided by participants. They were selected by random sampling from those coded under the theme “Inadequate Staffing and Workload.”
38

39

The x-axis represents the themes that were identified based on the open ended responses. The numbers above each bar indicated how many responses were within that specific theme.
Note: the total number of responses exceeds the number of participants. Although participants were asked for the ”Primary” reason, the research team coded up to 3 themes for each, based on the content of the open ended answer.
The four most common themes include Additional Staff and Supports, Increased Pay, Better Teamwork/Attitudes, and None.
Note: “None” may have been a common response as this was near the end of the survey and the third open ended question. Survey fatigue may have been a factor in the responses and should be considered.
40

The Word Bubble showcases the language used by the participants. All responses were entered into a software that identified the most often occurring words. The larger the word and darker the hue, the more frequently those words were directly written by participants in the survey.
41

The above quotes are direct responses provided by participants. They were selected by random sampling from those coded under the theme “Additional Support and Staff.”
42

The above quotes are direct responses provided by participants. They were selected by random sampling from those coded under the theme “Increased Pay.”
43

The above quotes are direct responses provided by participants. They were selected by random sampling from those coded under the theme “Better Teamwork and Attitudes.”
44

The above quotes are direct responses provided by participants. They were selected by random sampling from those coded under the theme “Improved Leadership Staff.”
45

46

47

48

49

50

51

52

The second phase of the research included in person Focus Groups. The purpose of these groups was to get a deeper understanding of the results of the survey, address any remaining questions and provide colorful qualitative data to support the opportunities for retention improvement.
Participants were recruited according to approved Screener Guide. Attempt was made to include a variety of ages, length of tenure, positions, and Member Organizations represented per group. Recruitment method was multi-pronged. Any participant who completed the Phase 1 Survey was given the opportunity to opt-in with interest in participating in a focus group. Participants that opted in with interest were then contacted by the Recruitment Team, given details of the group and invited to participate if passed the screener.Two additional emails were drafted and provided to all Member Organizations. The Member Organizations were encouraged to share with their nurses and nurse aides. The emails contained information on the focus groups and invitations to participate. This allowed participants to still express interest in attending regardless of whether they completed the Phase 1 Survey.
53

The follow Focus Group dates and locations were selected with input and support from the LeadingAge Kansas team:March 19: Wichita, KSMarch 20: Dodge City, KSMarch 21: Kansas City, KSTwo focus groups would be held within each of these determined locations. Sessions started at 5:15PM and 7:00PM to attempt to accommodate as many shifts as possible. Due to low recruitment in Dodge City, an additional method was executed to encourage participation. One member of leadership from each Member Organization serving the Dodge City area was contacted via email and asked to encourage staff to participate.
Recruitment and Attendance data as follows: Wichita Group 1: 10 Recruited, 5 Participants Wichita Group 2: 10 Recruited, 4 Participants Kansas City Group 3: 8 Recruited, 4 ParticipantsKansas City Group 4: 8 Recruited, 3 Participants
54

The following themes arose as a common topics through each of the four conducted focus groups. Communication: Fostering an open dialogue between leadership and staff without negative ramifications.
Transparency: Sharing decision-making processes with staff to give insight into why directions are being pursued.
Recognition and Growth: Showcasing loyalty, appreciation and commitment to those on the front-line.
Culture: Enhancing the overall atmosphere and creating an environment of support and teamwork.
Training: Setting up expectations for new staff and providing a sufficient, timely and resident centered training.
55

56

In each of the focus groups conducted, communication was a common theme that arose to the surface as an area in much need of improvement. Participants shared many examples of the failings of communications, as well as few examples of successes. It is clear that many organizations are attempting to incorporate new strategies of communication, creating town hall meetings and sending out email blasts, trying to find ways to disseminate information with staff. But those methods are falling short in effectiveness. Participants shared a desired for communication to be an open process, going back and forth between and staff and leadership. Many shared examples of receiving information, being given directions, while not having an opportunity to share information back. Participants feel a strong connection to the work they do and the residents they serve, and want to have an opportunity to share their ideas, work on projects and further their participation with the organization. When information is shared back, there is a threat of repercussions and insecurity with job stability based on information shared. Working in small organizations, participants shared that no information is kept confidential, from private meetings with HR to surveys, and that many feel their job is at risk when negative information is delivered back to the leadership. Participants shared a desire to have a written record of organizational communication. Meetings that were held, forums, town halls, organization decisions, should be documented and accessible by all staff members.
57

58

Similar to and often overlapping with communication, transparency arose as an area of high need. Participants shared clear and strong motivations for serving in the roles they serve – not driven by money but by a desire to help and care for others. Most acknowledge that this field is mentally and physically challenging, and they often don't understand why they work harder than appears necessary. Participants asked for transparency from the leadership, requesting information on ‘why’ decisions are made and not just ‘what’ decisions are made. Participants also shared that job roles throughout all levels of organizations are muddled. They want clearly defined job roles, showcasing where those roles overlap, who is responsible in those times, and what the best delegation looks like. Participants shared that when a “superior position” gives directions, they feel obligated to comply even when it feels incongruent with the mission of the organization. Showcasing the roles, from aides to leadership, will provide a better understanding for why staff members are asked to do certain job aspects and not others, while allowing improved communication between overlapping roles. Participants shared that in almost all organizations, it is widely accepted that front-line staffing is short. Yet, from their perspective, new leaderships positions are created with the limited budget and resources. Participants shared that having a better understanding of what the leadership is working on will be helpful in understanding the direction of the organization and where their role fits in.
59

60

Participants shared that moving up in a career path is challenging; noting it is nearly impossible to find the time and finances to support returning to school or attending a certification. Participants shared that often even renewing their licensure can be a challenge to afford. Yet in spite of those challenges, most participants serving in an aide role were interested in moving up in career growth in some capacity. By providing creative financial support solutions, LKS and Member Organizations can support the further development of staff members. LKS and Member Organizations can also serve creative solutions to promote career development outside of the traditional formal education and certificate programs. Participants shared an interest in serving in new capacities in their role that align with their interests and personal motivations. Participants also addressed the topic of loyalty. Many shared that they felt tenure at an organization was not recognized by leadership nor reflected in pay or support.
61

62

Another overarching theme presented through the focus groups addresses the topic of culture. Many participants shared that they work in a culture that fosters disconnection and unappreciation. Participants noted a distinct divide from the leadership and report that they feel culture change comes from the top down. Participants identified that the culture changes within the organizations, targeted for resident support (allowing residents to drive decision making over their lives) is not a value given to staff members. With a silenced voice and low recognition, participants shared that this physically and emotionally demanding job becomes even harder. Participants shared that seeing leadership on the floor, hearing a simple “thank you” or having someone touch base for a download after a particularly hard day would make a big impact on their job satisfaction. Participants also shared a great pressure, enacted by themselves as well as colleagues and leadership, to over-exert themselves for their role and put their own health and self-care as secondary. Participants shared that organizations should encourage staff self-care, time off, etc. and that in turn, would demonstrate commitment to long-term care and commitment from employees.
63

64

65

Participants repeatedly identified the lack of training within organizations at this time, but recognize that the time constraints and the lack of current staffing are interwoven into this training challenge. Participants shared that the primary insufficiency for training was the time allowed. Many participants shared they received only a half day to 2-day orientation with patients and were then on their own, thrust into a demanding environment without having a clear plan on where to turn for questions or how to navigate much of the work.
Some participants identified that they were given sufficient training, in some cases up to a month of training, and that the thorough training is greatly relational to their continued employment and success in their position.
Participants also shared the value of personalized training and working with patients, rather than watching videos or completing online training, education or certification updates.
66
67

68

69

70

Quick Takeaway: The older the participant, the more likely they have worked for more providers.
71

**Note the Y-Axis is Zoomed In to clarify discrepancies. The full range is 1-7.
Quick Takeaway: Almost without fail, as age increases, so does the average satisfaction score. Indicating that the older a nurse or nurse aide, the more satisfaction they have with their overall job.
72

Quick Takeaway: Overall, when combining all 8 categories of Job Satisfaction, the age of the participant and the average satisfaction score are proportionally increased.
73

74

75

76

77

78

79

80

81

82

83