leading lisbon against carbon emissions a paradigm shift ... · susana carvalho, nuno domingues,...
TRANSCRIPT

Susana Carvalho, Nuno Domingues, Jorge Lucas, Afonso Sebastião, Leading Lisbon against carbon emissions, 45th ISOCARP Congress 2009
1
Leading Lisbon against carbon emissions A paradigm shift in Urban Mobility
Introduction and Framework
One of the EU concerns transmitted in the Commission Communication of 15 May 2001 – Sustainable Development in Europe for a Better World: European Union Strategy, in favour of sustainable development, states that “Traffic congestion has been increasing rapidly and is reaching a situation of paralysis. This phenomenon essentially affects urban areas which are also facing other problems such as, for example, city centre degradation, expansion of suburban areas and concentration of serious poverty and social exclusion”. The Stockholm European Council, in March 2001, determined that the Lisbon Strategy should be completed with the inclusion of an environmental dimension, thus bringing together the three dimensions of sustainable development - economic development, social cohesion and environmental protection. This policy guideline was put into practice by the Gothenburg European Council in June 2001, with the adoption of the EU sustainable development strategy, which recognised the need for urgent action to be taken in four priority intervention areas: climate change, sustainable transport, public health risks and natural resources. An increase in internal wealth of a country leads to an increase in car ownership, given that cars are associated with a certain social status. However, it can be seen that in countries with a higher Gross Domestic Product (GDP) people are more environmentally aware, opting in much larger percentages for the use of public transport (PT). In Portugal, there has been a reduction in the annual rate of increase in wealth production since 2000; this, however, has not been accompanied by a corresponding reduction in primary energy consumption and in greenhouse gas emissions (Relatório de Estado do Ambiente, 2006). Big cities like London, Paris, Berlin, among others, have invested heavily on PT infrastructures due to the increasing number of users. Nevertheless, despite the decrease in Portuguese purchasing power, people are still using individual transport (IT) in detriment to PT. This leads us to wonder about the motives behind this inversion and how we can combat this risk and tendency. In 2006, only 49.6% of young people (20-24 years old) in Portugal had completed the highest level of secondary education (Year 12), well below the EU-25 average (77.7%). Portugal had the second highest school drop-out rate in the EU-25 in 2006 - Relatório de Estado do Ambiente, 2006. Environmental awareness is very often accompanied by a higher level of educational qualifications. People who are more aware of environmental matters and the pressing nature of sustainability at global level are generally those who are more willing to change their habits, to change their attitudes in order to achieve what is ethically correct and which therefore has a normative value with enormous opportunity costs. The sixth Community Environment Action Programme and the Renewed European Sustainable Development Strategy (2006), in conjunction with the re-launched Lisbon Strategy (2005), present as the overall goal of the EU the attainment of sustainable production and consumption standards. Bearing in mind quality of life, intra- and inter-generational equity and policy integration, it intends to make a difference on the relationship between the increase in economic growth in each one of the sectors of activity and the negative environmental impacts resulting from the use of natural resources. The National Climate Change Programme (2006 PNAC) and the National Strategy for Sustainable Development (ENDS 2015), published, respectively, in August 2006 and August 2007, as well as the new goals for fighting climate change announced by the government in January 2007, also recommend these objectives (Relatório de Estado do Ambiente, 2006). In recent years, the energy and transport sectors – those which produce the highest greenhouse gas emissions – have shown a tendency towards dissociation between energy

Susana Carvalho, Nuno Domingues, Jorge Lucas, Afonso Sebastião, Leading Lisbon against carbon emissions, 45th ISOCARP Congress 2009
2
consumption – which has continued to increase – and the corresponding emissions of acidifying substances and ozone precursors – which have been decreasing. In 2005, of the more than 86,000 kt of greenhouse gases emitted nationally, it is estimated that approximately 23% were produced by national transport. Despite the constant increase in the number of vehicles on the roads, the emissions of some pollutants associated with the transport sector have remained the same or even decreased – nitrogen oxides (NOx), carbon monoxide (CO), non-methane volatile organic compounds (NMVOC) – a reflection of efforts made and of the introduction of new technology. Transport was the sector of economic activity which, in 2005, consumed the most final energy in Portugal (35.4%), in proportion to the increase in the number of vehicles on the roads, which has increased by almost 90% since 1990 (Relatório de Estado do Ambiente, 2006).
Framework and Targets
This paper studies commuting movements on the Great Lisbon Area (GLA) and gives an analysis of the cost of each passenger transportation mode and its relation with the energy consumptions and the Carbon emissions. In particular, we consider the 26 commuting corridors to/ from the residential suburbs to the centre of Lisbon. Traffic (vehicles and people) movements inside Lisbon were excluded due to poor data availability. A Base Scenario was built, on which the current status on the commuting movements in the GLA was studied on a cost/ energy consumption/ CO2eq. emissions framework according to a life cycle perspective, for each transportation mode, individual and public. On top of this Base Scenario, three Alternative Scenarios have been built with the correspondent analysis by comparison to Base Scenario and a Business. Conclusions are drowned based on the cost, energy consumption and CO2 eq. emissions (in global and local terms). The three scenarios are as follows: • Scenario A – migration of 15% from IT to PT; • Scenario B – migration of 40% from IT to PT, the migration that levels the costs of the transportation modes mix in Lisbon; • Scenario C – shift of the current fleet to one within the Euro V standards; and the impact the Euro V will have on the overall CO2eq. emissions.
Commuting Movements in the Great Lisbon Area
The report took most of the information from the document “Lisboa – o desafio da mobilidade”. The GLA was divided geographically as explained bellow. The number of inhabitants of the GLA, according to the statistics (CENSOS, INE, 2001[2]) was affected by the provisional growth rate for 2007. ESTIMATION OF 2,330,514 INHABITANTS ON THE GREAT L ISBON AREA IN 2007.
The number 2,330,514 of inhabitants was also validated by the extrapolation of the population data from the 1991-2001 census for the GLA and projected to the 2001-2007 period; the number given by the second validation, 2,321,307 inhabitants, shows a 0.4% deviation from the first. From the 2,330,514 value, commuters (working people and students) on each zone of the GLA (1991-2001 data) were eliminated in terms of % on the total population and on active population, and the % of the active population (working people and students) that commute on a private car (1991-2001 data). The GLA population profile is very young, with the active population giving the higher % (the number of not yet on school age is very small, being an extra political concern since it will have a negative impact on the next generation of working population, 20 years from now). For each item presented above, it was determined the % delta for the 1991-2001 period and estimated the same delta for the 2001-2007 period, taking into consideration the same growth rate as the one experienced for the 1991-2001 period. The number of commuters on

Susana Carvalho, Nuno Domingues, Jorge Lucas, Afonso Sebastião, Leading Lisbon against carbon emissions, 45th ISOCARP Congress 2009
3
PT was subtracted from the total commuters number since the number on PT is already known. The trend from 2001 to 2007 is for an increase in the number of commuting individuals by 16%, with a 35% increase on private transportation and only 3,4% increase on PT. Lisbon inhabitants are moving from Centre Town towards the suburbs where the housing costs are lower, even when commuting turns out to be hard due to the lack of well suited road infrastructures and/ or lack of proper PT.
0
20.000
40.000
60.000
80.000
100.000
120.000
140.000
(pax/ano)
Inbound traffic
IT PT
On the graphic above, one sees that the largest commuting movement towards Lisbon is from Cacém, with PT dominating over IT. People commute by train, which runs on four lanes, allowing slow and fast trains (express trains) to run on the same direction. The use of PT in this area contributes with 15% to the total CO2eq. emissions of the GLA (IT+PT). Probably, one of the reasons why the rail mode can’t attract more passengers in this area is safety which is pointed as being very low. In the Cascais area, the relative wealth of the population leads to a higher use of IT, being PT, mainly train, used below its maximum capacity.
ROAD TRANSPORT
INDIVIDUAL TRANSPORT (IT) Concerning IT we assumed that the commuters use 6 road corridors as the ones presented on the figure below. The number of commuting cars is presented on following table.
TABLE 1 – TRAFFIC ENTRANCE INTO LISBON (INBOUND)
Corridor/Axis Cars/day
(extrapolation for 2007)
Cascais (A5 / Marginal) 73,042
Sintra (IC19) 104,300
Loures / Oeste (A8) 61,299
Norte (A1) 46,949
Sul (A2 – Ponte 25 de Abril) 57,735
Sul (A2 – Ponte Vasco da Gama) 19,954
TOTAL 363,279

Susana Carvalho, Nuno Domingues, Jorge Lucas, Afonso Sebastião, Leading Lisbon against carbon emissions, 45th ISOCARP Congress 2009
4
FIGURE 1– IDENTIFICATION OF THE MAIN AXIS OF ENTRANCE INTO DOWNTOWN FROM ALL ZONES OF THE
METROPOLITAN AREA OF LISBON
PUBLIC TRANSPORT (PT) For Bus/Coach passenger transport we used the data from the efered report Error! Reference source not found. mentioned above. We assumed that commuting by bus is done between downtown and 7 geographical zones as shown bellow.
FIGURE 2 – IDENTIFICATION OF THE 7 SECTORS OF THE COLLECTIVE ROAD TRANSPORTATION OF PASSENGERS
The number of commuting buses is shown on the chart below; the same data registered on 1999 was assumed for 2007.
TABLE 2 - PUBLIC ROAD TRANSPORTATION CHARACTERIZATION
Sector Buses(or Coaches)/day
(Year 2007)
V.F. Xira 393
Loures 1,690
Sintra/Oeste 491
Cascais 202
Almada/Setúbal 427
Montijo/Alcochete 170
TOTAL 3,373

Susana Carvalho, Nuno Domingues, Jorge Lucas, Afonso Sebastião, Leading Lisbon against carbon emissions, 45th ISOCARP Congress 2009
5
Loures is the largest contributing zone to commuting, almost 50% of the total volume. These numbers do not reflect the subway network currently available; traffic was considered as it was in 1999, being the subway an inner city transportation mode, not included in the scope of this paper.
RAIL TRANSPORT
The rail transport data was obtained from the rail operators in the GLA, CP and Fertagus official documentation (available online). The lines for Cascais, Sintra, Azambuja, were considered to have in 2007 the same end users as in the published data for 2002. These lines have consolidated traffic, having Sintra and Cascais experienced a small decrease of users from 1999 to 2002. On the Linha do Sul, operated by Fertagus, we used the published data from 2005, assuming it remained similar for 2007. The published data was transformed into working day number of passengers, considering the users on weekends and holidays to be 25% than those on working days, and the number of trains around 50% of those on the working days.
WATERBORNE TRANSPORT
South commuters enter Lisbon by crossing the Tagus. The river has 6 boat corridors, where the two connecting Lisbon to Cacilhas have the largest capacity. The number of passengers in 2007 was assumed the same as in 1999, and as published by the operators. We assumed the number of weekend/ holliday commuters would be 25% of the ones on a working day.
PUBLIC TRANSPORTATION COMMUTING MIX
We proceed to find a distribution of all passengers entering Lisbon using the different PT modes (four rail lines, five waterborne lines and six bus/coach axis). The assignment of the number of people per each transportation mode on each day, was done manually and assuming that commuters on each zone fill first the transportation mode with the highest capacity before going to the next one. The report only focuses on the commuting movements towards Lisbon, while some of the transportation modes are used by commuters that do not enter Lisbon. Also, some commuters coming from the same area were distributed by different corridors for the same transportation mode, according to the awareness of the commuting movements towards Lisbon. On the zone n. 12, Sintra, we assigned 70% to the Sintra train corridor, with the remaining 30% assigned to the Cascais train corridor. On the zone nr 22, Barreiro, 18% were assigned to the Cacilhas river boat, 73% to the Barreiro river boat and the remaining to the bus line crossing the river on the Vasco da Gama Bridge.
COMMUTING D ISTANCES
Commuting distances took into account the following assumptions: • Road distances were measured form the geometrical centre of the zone to the entry corridor in Lisbon. River distances were measured on the corridors published by the operatorsError! Reference source not found.; • Train distances were measured on each corridor; • Complementary distances to the train and river transportation modes were measured from the centre of the zone to the connecting point to these 2 modes, and considering people would be travelling by bus towards those terminals (train and river boat); • Distances were measured on a digital map at the scale 1:25,000 using an AutoCAD software.

Susana Carvalho, Nuno Domingues, Jorge Lucas, Afonso Sebastião, Leading Lisbon against carbon emissions, 45th ISOCARP Congress 2009
6
Financial Life Cycle Assessment of the Commuting Movements
The financial life cycle assessment of commuting movements took into account the investment in infrastructures, the maintenance costs of that infrastructure and the fixed and variable operational costs calculated on per pax basis of number of users. The financial analysis highlights the advantage of the private car and the river boats over the other transportation modes as shown on the following table.
TABLE 3 – AVERAGE ANNUAL COSTS PER PASSENGER BY MODE OF TRANSPORT – SCENARIO BAU
€/pax Individual Transport
Bus/Coach Waterborne Rail
Zero tax 0.76 6.92 0.95 2.53
On a costs basis, the right political decision is to promote the private car over the rest of the transportation modes on the GLA. Cost profiles reflect the high volume of investment and the operational costs of trains; bus costs are impacted negatively by the low occupancy rate as a consequence of after peak hour’s operations; river boat transportation benefits from a high rate of occupancy that absorbs the investments on infrastructure.
TABLE 4 – AVERAGE ANNUAL COSTS PER KILOMETRE BY MODE OF TRANSPORT
€/km Individual Transport
Bus/Coach Waterborne Rail
Investment 1.79 6.43 4.52 3.60 Maintenance 0.15 0.16 0.21 0.66 Fixed Operation Costs 0.10 0.25 0.19 0.39 Variable Operation Costs 0.09 0.48 4.66 2.00
TOTAL 2.13 7.32 9.58 6.65
TABLE 5 – OCCUPANCY RATES
% Individual Transport
Bus/Coach Waterborne Rail
Average Occupancy Rate
35 30 40-45 29
PT investments by the government can be diluted to the point of having lower LCA costs if 40% of the private cars users shift to PT. 1) The decrease private car circulation in Lisbon will allow for a higher traffic circulation speed, currently around 15 km/ h, which facilitates the flow of commuters; 2) Decreasing numbers of private cars will allow a deviation of the current investment on parking lots to other areas related to the management of commuting movements of the GLA; 3) Train transportation will be profitable on a scenario of migration of 85% of the number of users to the train corridors; 4) Buses will benefit a lot from the decrease in private cars circulating in the city and consequent increase in circulation speed, from the decrease in infrastructure investments, acquisition and maintenance of vehicles and on the fuel consumptions due to a less numbered circulating fleet.
INBOUND C IRCULATION IN L ISBON
Charging a circulation tax in Lisbon might be the solution to enforce a migration of commuters from the private car to the public sector. The taxation base scenario considered charging a €5 daily flat tax; this tax corresponds to about 5% of the net salary of a middle class family with a net monthly income of €2.000, about 36% of the monthly transportation cost, where we assumed a decrease of 15% of the total number of private cars commuting to/ from Lisbon, just as in London at the time that a similar tax was introduced. In a different framework, one could charge higher taxes to the most pollutant cars, or charge an extra to cars with less occupancy, or even constraining the entry in Lisbon to a selected group of cars on specific week days.
Susana Carvalho, Nuno Domingues, Jorge Lucas, Afonso Sebastião, Leading Lisbon against carbon emissions, 45th ISOCARP Congress 2009
7
The application of a similar tax should be preceded by a political campaign searching for the endorsement of the population for the fight against the pollution problem.
ECONOMIC IMPACT
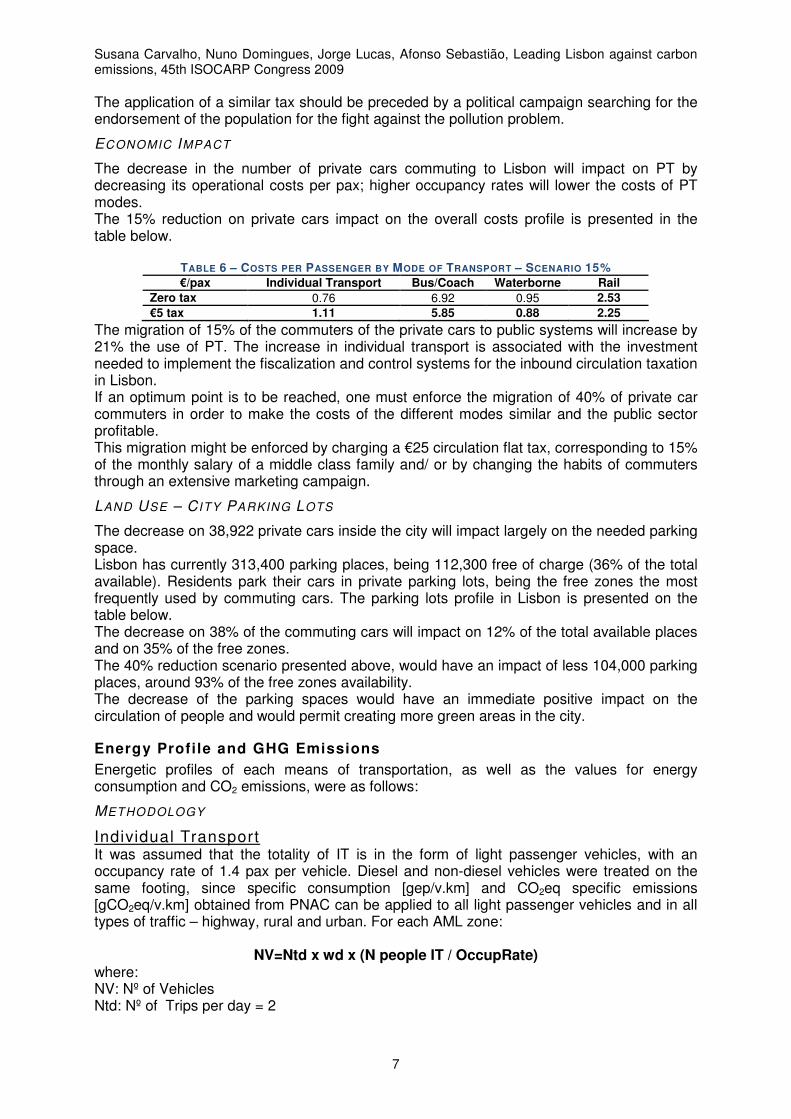
The decrease in the number of private cars commuting to Lisbon will impact on PT by decreasing its operational costs per pax; higher occupancy rates will lower the costs of PT modes. The 15% reduction on private cars impact on the overall costs profile is presented in the table below.
TABLE 6 – COSTS PER PASSENGER BY MODE OF TRANSPORT – SCENARIO 15%
€/pax Individual Transport Bus/Coach Waterborne Rail
Zero tax 0.76 6.92 0.95 2.53
€5 tax 1.11 5.85 0.88 2.25
The migration of 15% of the commuters of the private cars to public systems will increase by 21% the use of PT. The increase in individual transport is associated with the investment needed to implement the fiscalization and control systems for the inbound circulation taxation in Lisbon. If an optimum point is to be reached, one must enforce the migration of 40% of private car commuters in order to make the costs of the different modes similar and the public sector profitable. This migration might be enforced by charging a €25 circulation flat tax, corresponding to 15% of the monthly salary of a middle class family and/ or by changing the habits of commuters through an extensive marketing campaign.
LAND USE – C ITY PARKING LOTS
The decrease on 38,922 private cars inside the city will impact largely on the needed parking space. Lisbon has currently 313,400 parking places, being 112,300 free of charge (36% of the total available). Residents park their cars in private parking lots, being the free zones the most frequently used by commuting cars. The parking lots profile in Lisbon is presented on the table below. The decrease on 38% of the commuting cars will impact on 12% of the total available places and on 35% of the free zones. The 40% reduction scenario presented above, would have an impact of less 104,000 parking places, around 93% of the free zones availability. The decrease of the parking spaces would have an immediate positive impact on the circulation of people and would permit creating more green areas in the city.
Energy Profile and GHG Emissions
Energetic profiles of each means of transportation, as well as the values for energy consumption and CO2 emissions, were as follows:
METHODOLOGY
Individual Transport It was assumed that the totality of IT is in the form of light passenger vehicles, with an occupancy rate of 1.4 pax per vehicle. Diesel and non-diesel vehicles were treated on the same footing, since specific consumption [gep/v.km] and CO2eq specific emissions [gCO2eq/v.km] obtained from PNAC can be applied to all light passenger vehicles and in all types of traffic – highway, rural and urban. For each AML zone:
NV=Ntd x wd x (N people IT / OccupRate) where: NV: Nº of Vehicles Ntd: Nº of Trips per day = 2

Susana Carvalho, Nuno Domingues, Jorge Lucas, Afonso Sebastião, Leading Lisbon against carbon emissions, 45th ISOCARP Congress 2009
8
wd = nº of working days/year = 260 N People IT: Nº of people entering Lisbon via IT OccupRate: Occupancy Rate v= 1,4
Final Energy[tep] = (Distance x NV x SC)/106
where SC: specific consumption [gep/v.km]
Primary Energy [tep] = Final Energy [tep] x conversion factor where: conversion factor Primary Energy – Final Energy = 1.154
CO2eqEmissions [tCO2eq] = (Distance x NV x SE)/106
where: SE: specific emissions of CO2eq [gCO2eq /v.km]
For Public Transport Modes (Rail, Bus, Waterborne) analogous methodology was applied.
SCENARIO “BUSINESS AS USUAL ”
The main objective of this scenario was to analyze the actual paradigm in terms of primary energy consumption and local/global CO2 eq. emissions, taking into account user distribution by the different types of transportation (IT, PT), on the Lisbon entrances. The following graph shows the energy consumption for each Lisbon entrance. As expected, it is possible to observe that Cacém (in terms of corridors) and the IT have the highest impact in terms of energy consumption. PT has a higher share in the Almada, Seixal and Barreiro corridors (namely because of river boat transportation) and in the Bucelas and Odivelas corridors (namely because of bus transportation). The total energy consumption was 172,401 toe.
LOCAL EMISSIONS Local emissions for IT were determined by the software Copert (version IV, developed by the Laboratory of Applied Thermodynamics, from Aristotle University of Thessaloniki and financed by the European Environment Agency, which allows the calculation of polluting emissions associated with road traffic), and by the reference values showed at PNAC. The null impact of train use, in terms of local CO2 equivalent emissions, is also shown.
INDIVIDUAL TRANSPORT

Susana Carvalho, Nuno Domingues, Jorge Lucas, Afonso Sebastião, Leading Lisbon against carbon emissions, 45th ISOCARP Congress 2009
9
Local CO2eq emissions from IT were computed with Copert IV software and are based on PNAC values. They are presented in the next graphics. Values obtained through the software are higher than the reference values from PNAC but are of the same order of magnitude and respect the same relative proportions. GLOBAL EMISSIONS
INDIVIDUAL TRANSPORTATION
In terms of Individual Transport, Cacém shows the higher specific global CO2eq emissions (tCO2eq./km) immediately followed by Amadora municipality. The less consuming municipalities (in specific terms) are Pêro Pinheiro and Poceirão (both in the south margin of river Tagus).
RAILWAY TRANSPORTATION
In terms of Rail Transport, Cacém shows the higher specific global CO2eq emissions (tCO2eq./km) immediately followed by Seixal municipality. The less consuming municipalities (in specific terms) are Sintra and Poceirão.
WATERBORNE TRANSPORTATION
In terms of Waterborne Transport, Almada shows the higher specific global CO2eq emissions (tCO2eq./km) immediately followed by Barreiro municipality. The less consuming municipalities (in specific terms) are Costa da Caparica and Alcochete.
PUBLIC ROAD TRANSPORT – BUS /COACH
In terms of Public Road Transport, Bucelas shows the higher specific global CO2eq emissions (tCO2eq./km) immediately followed by Odivelas municipality. The less consuming municipalities (in specific terms) are Pêro Pinheiro and Poceirão (both in the south margin of river Tagus).

Susana Carvalho, Nuno Domingues, Jorge Lucas, Afonso Sebastião, Leading Lisbon against carbon emissions, 45th ISOCARP Congress 2009
10
0
10.000
20.000
30.000
40.000
50.000
60.000
70.000
80.000
90.000
tCO2eq.
Global Emissions of CO2eq. by Municipality/Region of the GLA
IT Rail Waterborne Bus/Coach
SCENARIO “MODAL TRANSFERENCE ”
15% SHIFT SCENARIO As implemented in London, a 5€ tax led to a 15% decrease in traffic volume. London is presently considering a 300% tax increase for the most polluting classes of vehicles and a smaller increase for more ecological vehicles. The scenario considers a 15% passenger transference from IT to PT, according to the matrix presented previously. For this scenario we obtained energy consumption and GEE emissions as shown in the next graphics. The total primary energy consumption is 155168 toe. With a 15% reduction in IT one obtains an 11% CO2 eq global emissions reduction relative to the reference scenario. In the present scenario the most critical areas remain the same as for the reference scenario.
0
10.000
20.000
30.000
40.000
50.000
60.000
70.000
80.000
90.000
tCO2eq.
Global Emissions CO2eq. - 15% Shift Scenario
TI Rail Waterbirne BUS/Coach 40% SHIFT SCENARIO A 40% decrease in number of vehicles gives the point where PT costs are equivalent to IT costs, according to a Life Cycle Analysis (as explained previously). We studied a scenario with a 40% reduction in IT, assuming a modal transference to PT according to the distribution matrix considered previously. For this scenario energy consumption and GEE emissions are shown next. The total primary energy consumption is 123,374 toe. With a 40% reduction in IT, one reaches a 29% reduction in CO2 eq global emissions relative to the reference scenario.

Susana Carvalho, Nuno Domingues, Jorge Lucas, Afonso Sebastião, Leading Lisbon against carbon emissions, 45th ISOCARP Congress 2009
11
90% SHIFT SCENARIO We also present a “wishful thinking” scenario, assuming a 90% modal transference from IT to PT. This allows for a determination of a maximal impact from IT reduction. Again, the same transference matrix was used. For this scenario the total primary energy consumption is 68647 toe. With a 90% reduction in IT one obtains a 66% global emissions reduction, relative to the reference scenario. It is interesting to note that in this uthopic scenario one starts to observe changes in the critical areas contributing to emissions. There is a sharp decrease in emissions from areas that previously were the most contributing for global emissions, due to a transference to the railroad. PT modes where transportation is based on internal combustion motors (Bus and Waterborne transportation) increase their contribution. An example is the case of Barreiro, where waterborne transportation was already significant in the reference scenario due to high occupancy rates. COMPARISON BETW EEN SCENARIOS
0
100.000
200.000
300.000
400.000
500.000
600.000
BAU 15% 40% 90%
tCO2eq.
Scenario
Global CO2 eq emissions - Scenarios comparison
BUS/Coach
Waterborne
Rail
IT
TABLE 7 – SCENARIO COMPARISON
Scenarios Cars [-]
Emissions CO2
[tCO2 eq]
Primary Energy Cons. [toe]
IT Costs [€/pax]
BUS/Coach Costs [€/pax]
Rail Costs [€/pax]
Waterborne Costs [€/pax]
Base 259,484 522,176 172,401 0.76 6.92 2.53 0.95 - 15% 220,561 465,086 155,168 1.11 5.85 2.25 0.88 - 40% 155,690 369,702 123,374 a a a a -90% 25,948 178,490 68,647 - - - -
In order to reduce the present environmental and energetic profiles in Lisbon, one needs to decrease the flux of private cars entering the city daily. Besides its economical impact, such reduction will also increase quality of life for city citizens. IMPROVING CAR PARK In the MEET document, one finds the distribution (assumed identical to the national one) of cars flowing to the city, in terms of type of engine, age and power. We considered a scenario where this distribution is changed by an increase in the number of environmentally better performing cars, namely in terms of greenhouse effect gas emissions. We used the software Copert IV and assumed that all cars comply with the Euro 5 standards. Using Global Warming Potential (conversion factors for CO2) CO2 eq emissions, one obtains for the reference scenario 8.660 t and 10.770 t for the scenario with improved car quality. The slight increase in emisions can be justified by heavier vehicles (due to improved technology and security features). However, CO2 eq emissions have reduced significantly, to about 60% relative to the reference scenario. This is due to a reduction in emissions of NOx and CH4, which contribute to greenhouse effect. There is also a considerable reduction in emissions of volatile organic compounds (VOC e NMVOC).

Susana Carvalho, Nuno Domingues, Jorge Lucas, Afonso Sebastião, Leading Lisbon against carbon emissions, 45th ISOCARP Congress 2009
12
In a simplified model, assuming a 60 % reduction in CO2 eq emissions, improved car quality leads to a 280,000t per year emissions reduction (Copert model emissions for the reference scenario are about 670,000 t of CO2 eq).
Conclusions and Perspectives for the Future
Commuting to and from Lisbon is based on private transportation; 259.484 vehicles enter the city daily through 6 roadway corridors. This translates into an average circulation speed of 15km/h, in abusive soil occupation by parked cars on week daysl and in a city empty of traffic, parked cars and people on weekends, due to a lack of green areas and other entertainment opportunities. In addition, this profile implies: 1) Negative economical impact since PT becomes more expensive than IT due to the PT low occupancy rates preventing a good management of operation costs and investment; 2) High CO2 emissions, of about 520,000 tonCO2 eq, of which 82% come from IT; 3) Unsatisfactory energetic efficiency, with costs of about 170.000 toe, with 80% coming from IT. Reduction of IT and increase in PT will improve the global scenario, allowing for better traffic flow and the use of soil for other purposes, such as green spaces, for the benefit of Lisbon residents and commuters from the GLA. The decrease in the number of people entering Lisbon through IT daily will imply a change of habits and mentality. This will require educational campaigns and will take time to be achieved, certainly more than 2 or 3 years, if it is to be effective. The desired decrease in the number of private cars flowing through the city might be achieved through a circulation tax that will force a change in the profile of the GLA commuters. Similar schemes to the one applied in London (the 15% scenario described) will have to be implemented by stages and should be accompanied by strong information campaigns to gather the support of major portions of citizens. The emphasis should be put on improving the quality of life for residents and commuters and not on the consequent tax gains by the city. In conclusion, as IT decreases, global emissions of CO2eq will rise only slightly for the other means of transportation and in a progressive way. In the limit, we will reach a situation where the means of transportation with less local emissions (the train) will present the largest fraction of global CO2eq emissions (based on a 90% IT reduction scenario). We note that if the emission values for IT obtained with the software Copert IV turn out to be more rigorous (as compared with the PNAC values), then global CO2 eq emissions would be even higher, so that their reduction would produce a greater impact.
REFERENCES
[1] Relatório “Lisboa – o desafio da mobilidade”, Câmara Municipal de Lisboa, Licenciamento Urbanístico e Planeamento Urbano;
[2] Censos de 2001, INE [3] Orientações estratégicas do sector ferroviário, MOPTC [4] Programa Nacional para as Alterações Climáticas (PNAC) – 2006 [5] Relatório do Estado do Ambiente, 2006 [6] Methodology for calculating Transport Emissions and Energy Consumption – Project
MEET Susana Carvalho, Environmental Engineer and Consulter at Ferconsult, S.A., DFA MIT Portugal, Portugal – Correspondent Author, Telephone: +351 914 210 205, [email protected]