leading gifted horses to water: the economics of climate … · bethany cooper and lin crase...
TRANSCRIPT

Bethany Cooper and Lin Crase
Leading gifted horses to water: The economics of climate adaptation in government-sponsored irrigation in Victoria
Synthesis and Integrative ResearchFinal report


Leading gifted horses to water: The economics of climate adaptation in government-sponsored
irrigation in Victoria
La Trobe University
AUTHORS Bethany Cooper (La Trobe University)
Lin Crase (La Trobe University)

Published by the National Climate Change Adaptation Research Facility 2013
ISBN: 978-1-925039-49-8 NCCARF Publication 78/13
Australian copyright law applies. For permission to reproduce any part of this document, please approach the authors.
Please cite this report as: Cooper, B & Crase, L 2013, Leading gifted horses to water: The economics of climate adaptation in government-sponsored irrigation in Victoria, National Climate Change Adaptation Research Facility, Gold Coast, 67 pp.
Acknowledgement This work was carried out with financial support from the Australian Government (Department of Climate Change and Energy Efficiency) and the National Climate Change Adaptation Research Facility (NCCARF).
The role of NCCARF is to lead the research community in a national interdisciplinary effort to generate the information needed by decision makers in government, business and in vulnerable sectors and communities to manage the risk of climate change impacts.
Disclaimer The views expressed herein are not necessarily the views of the Commonwealth or NCCARF, and neither the Commonwealth nor NCCARF accept responsibility for information or advice contained herein.
Cover image Yarrawonga Weir © Murray-Darling Basin Authority

TABLE OF CONTENTS
ABSTRACT .................................................................................................................. 1
EXECUTIVE SUMMARY .............................................................................................. 2
1. OBJECTIVES OF THE RESEARCH ...................................................................... 4
2. RESEARCH ACTIVITIES AND METHODS ........................................................... 7
2.2.1 Determining attributes and levels of the choice experiment ....................... 10 2.2.2 Focus group phase .................................................................................... 12 2.2.3 Attributes for conduct of pilot experiment ................................................... 13 2.2.4 Design of choice experiment ..................................................................... 14 2.2.5 Pilot survey phase ..................................................................................... 14 2.2.6 Extended review and consultation ............................................................. 15
3. RESULTS AND OUTPUTS .................................................................................. 17
3.1.1 Full cost recovery ...................................................................................... 18 3.1.2 Regulatory price setting ............................................................................. 18 3.1.3 Goulburn–Murray Water tariffs in review .................................................... 21 3.2.1 Best–Worst Scaling: Attributes and levels ................................................. 25 3.2.2 Design of Best–Worst Scaling experiment ................................................. 28 3.2.3 Survey development, piloting and administration ....................................... 28 3.3.1 Background ............................................................................................... 29 3.3.2 Best–Worst Scaling: multinomial logit model ............................................. 30
4. DISCUSSION ....................................................................................................... 35
4.1.1 Important lessons from the Best–Worst Scaling results ..................... 35
5. GAPS AND FUTURE RESEARCH DIRECTIONS ............................................... 38
APPENDIX A: THEORETICAL ELEMENTS OF CHOICE MODELLING, EXPLANATION OF ORIGINAL CHOICE ATTRIBUTES AND DESIGN CONSIDERATIONS ................................................................................................... 40
APPENDIX B: SAMPLE BEST–WORST SCALING SURVEY INSTRUMENT ........... 46
REFERENCES ........................................................................................................... 64

List of tables Table 2. 1 Characteristics of study locations ............................................................... 10
Table 2. 2 Attributes and Levels in Choice Experiment ............................................... 13
Table 3. 1 Best–Worst Attributes and Levels ............................................................... 27
Table 3. 2 Socio-demographics of the survey respondents ......................................... 29
Table 3. 3 Example dummy coding ............................................................................. 29
Table 3. 4 Multinomial logit model results ................................................................... 31
Table 3. 5 Normalised parameters (0-1): betas constrained to zero ............................ 32
List of figures Figure 2. 1 Example choice set ................................................................................... 14
Figure 3. 1 Index of most to least preferred probable outcomes .................................. 34

Shortened terms
ACCC: Australian Competition and Consumer Commission, the Commonwealth entity with oversight of anti-competitive behaviour and charged with providing guidance on water markets and termination charges in irrigation.
AASB: Australian Accounting Standards Board.
Best-Worst Scaling: A survey technique used to provide data about attributes (of a product/service or thing) that are most and least preferred by individuals.
Choice Modelling: A survey technique used to provide data about the relative value of the attributes of a product/service or thing.
DTF: Department of Treasury and Finance (Victoria).
ESC: Essential Services Commission, the economic regulator for water and other utilities in Victoria.
G-MID: Goulburn-Murray Irrigation District, sometimes used to refer to G-MW.
G-MW: Goulburn-Murray Water, the state-owned irrigation entity in Northern Victoria.
LRMC: Long-Run Marginal Cost, a way of estimating the additional cost of operating a utility which includes the operating costs plus the costs of maintaining and upgrading infrastructure.
ML: Megalitre, one million litres.
NVIRP: Northern Victorian Irrigation Renewal Project, a major irrigation upgrade project in the G-MW area with the aim of generating so-called ‘water savings’ to be returned to improve environmental outcomes in the Murray-Darling Basin.
NWC: National Water Commission, the commonwealth agency responsible for monitoring and reporting on the National Water Initiative.
NWI: National Water Initiative, a framework agreed by all governments for reforming tariffs for water, amongst other reforms.
PC: Australian Productivity Commission.
PSASB: Public Sector Accounting Standards Board.
RAB: Regulatory Asset Base, the asset base on which regulated water prices are established.
SRMC: Short-Run Marginal Cost, a way of exterminating the additional costs of operating a utility but generally excludes additions or upgrades to infrastructure.
VAGO: Victorian Auditor-General’s Office, the Auditor-General is appointed under legislation to examine, on behalf of Parliament and Victorian taxpayers, the management of resources within the public sector in that state.
WACC: Weighted Average Cost of Capital, usually set as the accepted return on assets held by a government-owned utility where the risks of different capital are assigned different weights.
Water Plan: A five-year plan of expenditures and revenues required by water utilities in Victoria, the Water Plan sets the framework for the economic regulator to assess the merits of price increases (decreases).


Leading gifted horses to water 1
ABSTRACT
The aim of this research was to understand how gifted infrastructure provided to irrigation corporations in northern Victoria impacts on farmer adaptation. The project sought to assist in designing incentives that would ensure farmers continued to adapt to changing water availability. Whilst there is ample evidence that farmers adjust in response to short-term climatic conditions like drought (see NWC 2012), the public provision of upgraded irrigation infrastructure means that farmers could be misguided about the true cost of increasing water scarcity, especially over the longer term.
A critical component of the existing tariff structure relates to the ability of farmers to understand the drivers of higher or lower water charges and any relationship to water availability. Without knowledge of the link between resource availability and the total cost of accessing and using water, farmers come to rely on heuristics that potentially limit adjustment to alternative production technologies.
A second critical element of the project related to termination fees, applied when an irrigator chooses to exit the industry or reduce the size of their irrigation enterprise. Termination fees relate to the ongoing legacy costs of infrastructure and, while potentially legitimate on some grounds, stand to severely impede industry adjustment. Excessive termination charges constrain the capacity of farming businesses to progressively contract, should water become increasingly scarce and/or less reliable.
This study assumed that greater understanding of the preferences of farmers, as they relate to tariffs, could guide a tariff reform process that would result in enhanced adaptation. This required information about what aspects of tariffs could be adjusted and willingly accepted by farmers. Two approaches were used, with a technique known as Best–Worst Scaling delivering the best results.
The Best–Worst Scaling data assembled from this project highlights the aspects of tariff reform that can be undertaken with least resistance from farming communities. The main findings from the empirical work are that farmers would heavily favour tariffs that:
• were more easily understood; • embodied lower termination charges, and; • allowed for staged payment of water charges.
This information has already been taken up by the bulk water supplier in northern Victoria (Goulburn–Murray Water) with the supplier now undertaking a major reconfiguration of tariffs for farmers in the region.
The project also sheds light on the potential for sending mixed messages about adaptation when water buy-back is undertaken simultaneously with infrastructure upgrades.
Whilst we acknowledge that tariff reform and clearer price signals are only one component of improving the adaptation by irrigation farmers, we recommend that any future gifting of irrigation infrastructure should be attended by a requirement on the part of irrigation companies to simultaneously reform tariffs. Material reductions in termination charges should be part of these reforms to ensure that mixed messages do not unduly slow farmer adaptation.

2 Leading gifted horses to water
EXECUTIVE SUMMARY
Objectives There are several concerns about the gifting of irrigation assets to irrigation districts. A critically important but under-investigated feature of this policy approach is that water users are not obliged to subsequently pay water prices that reflect the full cost of this infrastructure. More specifically, the value of the infrastructure need not be included in the regulatory asset base, which is used to calculate water prices paid by water users. A question thus arises as to whether publicly funded infrastructure of this form distorts production choices, especially over the longer term, possibly exposing enterprises and communities to sudden future climatic shocks. What approaches are available to ensure water users continue to receive the necessary price and non-price signals that will foster adaptation to future climates?
Approach It was important to employ an iterative approach to building the evidence base required to adequately address the objective. The starting point was to assemble information on the architecture of existing tariff regimes and to develop a clear understanding of the institutional constraints that would need to be negotiated to bring about tariff reform. The second stage involved working closely with farmers, groups of farmers and related stakeholders to gain an intimate understanding of their perceptions of existing and future tariffs. This involved both qualitative and quantitative components. The third phase employed the quantitative work on farmers and their perceptions of tariffs to interrogate the impact on farm businesses and the water supply corporation responsible for maintaining services. The final phase provided an opportunity to reflect on the overall efficacy of policy and to inform the development of a reform pathway.
Progress The work undertaken highlights the complexity of real and perceived incentives embodied in the current water pricing and water marketing arrangements. For example, under current arrangements farmers could face as many as 400 different types of charges emanating from different sources. These arrangements clearly play some part in shaping the information received by farmers and thus their adaptation responses. Our overriding concern has been that the gifting of assets to irrigation entities does not impact on the costs then borne by irrigators and may thus perversely encourage enterprise expansion when water, in all probability, is likely to become increasingly scarce as a result of climate change We do not seek to proscribe enterprise suitability as this would simply replicate some of the planning errors of the past. Rather, the intention is to foster approaches that would send signals that can encourage individuals to respond. To maintain the practical usefulness of the work we operate within the bounds of the institutions that regulate water pricing in Victoria to avoid the problems associated with assuming utopian planning by some benevolent state. It was clear from our review of the institutional architecture that the prospect of including gifted assets in the regulatory asset base is remote, and the regulator (Essential Services Commission) has largely prohibited consideration of this approach. It was also clear from the work undertaken reviewing tariffs and from the qualitative research with farmers that there is a good deal of customer dissatisfaction with the existing tariff structures.

Leading gifted horses to water 3
Tariff reform also involves a degree of coercion, insomuch as there will be different preferences associated with alternative pricing structures depending on enterprise type and history of use. For example, a large water user will likely be worse off relative to a smaller water user should tariffs be recalibrated with greater emphasis on the volumetric component (other things being equal). Against that background it is important to understand the range and strength of preferences for different elements of a water tariff — this helps understand the distributional effects of reform. A Best–Worst Scaling technique was deployed to provide evidence on how to structure tariffs that take into account the preferences of water users and simultaneously assist adaptation. A Best–Worst Scaling experiment is a survey technique that presents participants with a range of features (in this case attributes of a tariff) and asks them to rate the least and most preferred elements. The experiment is repeated continuously and the range of attributes varied such that data then provides a complete ranking — in this case of tariff reform options. The results for the Best–Worst Scaling experiment showed several changes that would be strongly supported by farmers. First, a simplification of the tariff so that it communicated adequate information about water use, service and the underlying relationship to cost and water availability would be well regarded. Second, there was strong support for an option to use multiple payment periods. Third, farmers were keen to see a reduction in the termination fees faced by irrigators. These findings are particularly important in the context of adaptation. In the case of the communicability attribute, it is self-evident that a charge that is understandable will help promote adjustment, provided that there is a relationship between resource availability and cost. Given the oversight of the Essential Services Commission we have some grounds for feeling optimistic that this latter condition will be met. The capacity to have multiple payments is also important from an adaptation perspective, since this allows farming enterprises to better manage cash flow during periods of change. And in the case of the support for reduced termination charges there is a clear link between changes on this front and the scope for irrigation enterprises to scale down or exit industries completely should water become increasingly scarce or supplies less reliable over the longer term. Importantly, these findings have been influential and impacted directly on the water supply corporation. In February 2013 the water corporation announced plans to overhaul its tariff structure, including actions to simplify pricing and facilitate staged payments. The arrangements for termination charges are also being reviewed. The project also sheds light on the potential for sending mixed messages about adaptation when water buy-back is undertaken simultaneously with infrastructure upgrades. This adds weight to the call for adjusting tariffs to at least provide some incentives for adaptation behaviour and the requirement to limit the perception of being penalised for opting to reduce the extent of irrigation or leave the industry. Whilst we acknowledge that tariff reform and clearer price signals are only one component of improving the adaptation by irrigation farmers, we recommend that any future gifting of irrigation infrastructure should be attended by a requirement on the part of irrigation companies to simultaneously reform tariffs. Material reductions in termination charges should be part of these reforms to ensure that mixed messages do not unduly slow farmer adaptation.
4 Leading gifted horses to water
1. OBJECTIVES OF THE RESEARCH
Irrigated agriculture in Victoria accounts for over 30per cent of agricultural output in the state (ABS 2010) and occurs mainly in northern Victoria. This sector is highly exposed to the predicted influences of climate change; thus, irrigators must adapt to manage with less water. Government response to water reform over the past decade has seen buy-back of water rights and public investments in irrigation infrastructure. In the context of the latter approach, the Victorian and Australian governments have committed over $2 billion for infrastructure upgrades in northern Victoria, purportedly with the aim of making irrigation more water-use efficient. Almost all of this investment is to occur in the area controlled by Goulburn–Murray Water (G-MW) and sometimes referred to as the Goulburn-Murray Irrigation District (GMID). There are several concerns with this approach (see, for example, Crase 2011) but a critically important but under-investigated feature of this policy response is that water users are not obliged to subsequently pay water prices that reflect the full cost of this infrastructure. More specifically, the capital value of the infrastructure need not be included in the regulatory asset base, which is used to calculate water prices paid by water users. A question thus arises as to whether publicly funded infrastructure of this form distorts production choices, especially over the longer term, possibly exposing enterprises and communities to sudden future climatic shocks. There is a potential long-term risk that water users will fail to progressively adapt to climate change and a risk of mal-adaptation. One approach to gaining insights into industry adjustment under climate change would involve offering water users ‘scenarios’ and seeking their reaction to alternative tariffs/prices. We contend that this approach carries serious risks on several grounds. First, such an approach presumes that the future can be reasonable described by the chosen scenarios and we contend that modelling is not yet adequately advanced to offer meaningful high-resolution scenarios at the scale of this project. Second, this approach would require heroic assumptions about effectively communicating the future to farmers and having them treat that communication seriously. In this context the published literature on stated preference techniques already leaves scope for scepticism about the usefulness of data derived in this way, let alone adding another potential layer of subjectivity to the analysis. Finally and most importantly, we contend that getting tariffs aligned to costs and resource availability now offers the most tangible way of dealing with changes in water availability in the future. We nonetheless note that prices alone will not singularly drive all adaptation behaviour. Given these limitations, what approaches are available to ensure water users continue to receive the necessary price and non-price signals that will foster adaptation to future climates?1 Perhaps ironically, increasing the asset base of irrigation corporations encourages managers of water supply businesses to raise termination or exit charges for fear that the remaining customer base would subsequently be required to fund the expanded costs of upkeep and that this would be untenable. These are the charges faced by 1 We acknowledge that modification of prices is only one part of any adaptation approach. In the context of the scope endorsed by NCCARF and resources available for this project we deal primarily with the signals that emanate from water pricing arrangements.

Leading gifted horses to water 5
irrigators opting to reduce the scale of their water use and/or those exiting irrigation entirely. High termination charges are likely to be particularly problematic should climatic or market factors undermine the financial viability of some industries that rely heavily on the irrigation network (and vice versa). The core of this research project involved coming to grips with the balance between the preferred financial model for current water users and water suppliers without completely muting the incentives that would facilitate longer-term adjustment.
1.1 Understanding farmers’ attitudes to different tariff
structures The tariffs faced by irrigation farmers in northern Victoria represent a complex system of historical decisions, often made during times of relatively high water availability. The process for adjusting price signals is thus influenced by the legacy of earlier decisions — we do not start with a blank canvas. Complications also arise from the regulatory framework used for establishing prices charged by monopoly water suppliers, where the water corporation is required to consider the impacts on customers of any adjustments. Thus, dealing with the issue of gifted assets in irrigation requires an appreciation of the starting point for water users and their attitudes to change. In addition, whilst tariffs are notionally established at arms’ length from government, the political reality of water pricing also necessitates that any change takes account of those options favoured by end-users. This information is also important when contemplating transition arrangements to deal with less favourable reforms. Against this background, the first objective of this project was to build our understanding of the components within existing and potentially new tariffs most (and least) favoured by irrigators in northern Victoria.
1.2 Understanding financial impacts Tariffs necessarily impact on farms via input costs. It is also the case that not all farms will be materially impacted by changes to tariffs and different tariffs will have differing impacts on alternative types of water users (see, for instance, Frontier Economics 2008). For example, a tariff regime that is heavily structured around fixed costs offers some irrigation businesses greater certainty and improves cash flow planning but also realises few financial savings when usage is reduced. The point is that not all farms will receive the same adaptation signal with any tariff configuration and it is helpful to know which farm businesses are most likely to respond to changes in tariffs. The overall split between fixed and variable costs in water tariffs also has important implications for water supply businesses. Under the regulatory framework used to set water prices in Victoria, water businesses are permitted to recoup only sufficient revenue to cover the costs of providing services. By and large, the apportionment of this revenue to fixed or variable sources rests with the water supplier, although clearly this impacts on the risks of any revenue shortfall. In times of constrained water supply, heavy reliance on variable charges can lead to a revenue shortfall for the water supply corporation. In contrast, during periods of drought, heavy reliance on fixed charges shores up revenue for the water business but also runs the risk of alienating customers, who could be expected to face a downturn in

6 Leading gifted horses to water
earnings at this time. There is also an expectation from government that water supply corporations will send ‘conservation signals’ and thus not completely rely on fixed charges to customers. Providing guidance on the balance between the financial impacts on water businesses, the impost on irrigated farm businesses, and creating incentives to adapt to changes in water availability was the second objective of this project.
1.3 Mapping reform pathways It is increasingly important to appreciate the sequencing and timing of reforms in the water sector (see, for example, Crase, Kinoshita and O’Keefe 2012). For instance, undertaking a buy-back program that is ostensibly aimed at restructuring irrigation industries needs to be carefully planned if simultaneous policies are instigated that encourage the retention or expansion of an industry, for example via infrastructure subsidies. Failure to take account of the sequencing of reforms and their interaction with the wider policy landscape can substantially raise the costs to taxpayers and the community more generally. It can also result in mixed signals to individuals and firms, thereby raising the costs of adaptation and increasing the prospect of maladaptation. More specifically the current policy approach runs the risk of having high opportunity costs; encouraging unnecessary reliance on others while also potentially stimulating rent seeking; and creating path dependency insomuch as the capital investments are difficulty to modify to suit changed circumstances — all conditions illustrative of maladaptation (Barnett and O’Neill 2010). Taking account of tariff reform as part of a wider suite of changes impacting on water markets and agricultural production was the third important objective of this project. The overall aim was to better understand the policy reform mix, the reform pathway and to illuminate the role of tariffs as part of this process.

Leading gifted horses to water 7
2. RESEARCH ACTIVITIES AND METHODS
Given the objectives of this research and its relationship to current policy decisions it was important to employ an approach that could iteratively build on the information that was revealed during the various stages of the project. The starting point was to assemble information on the architecture of existing tariff regimes and to develop a clear understanding of the institutional constraints that would need to be negotiated to bring about tariff reform. Critical to this part of the project is an understanding of the notion of full cost recovery, as espoused in the National Water Initiative (NWI). The theoretical literature relating to different forms of Discrete Choice experiments was also reviewed and updated as required by the information emerging as part of the project. This part of the work related specifically to the appropriate research method for gaining input from water users, as the party who would ultimately receive any signals offered by tariffs2. The second stage involved working closely with individual farmers, groups of farmers and related stakeholders to gain an understanding of the way existing and future tariffs are perceived. This involved both qualitative and quantitative components (described in detail below and in the appendices). The third phase sought to understand the potential impacts of tariff reform on farm businesses and the water supply corporation responsible for maintaining services. The final phase provided an opportunity to reflect on the overall efficacy of policy and to inform the development of a reform pathway.
2.1 Literature review of institutional architecture and theoretical frameworks
The institutional architecture for water pricing was reviewed using scholarly and grey literature; in the case of the latter, the various government reports that relate to water pricing in Victoria, and as recommended by the project advisory committee were critical. The pricing of irrigation water in Victoria and the related Northern Victorian Irrigation Renewal Project (NVIRP) have attracted considerable attention from the Victorian Auditor-General’s Office (VAGO) with several reports detailing concerns about the processes by which policy choices were made, in addition to potential breaches of privacy legislation that attended the roll-out of the modernisation works. Whilst important in shaping the administration of some phases of this project and the reaction of farmers, these elements of the literature were not specifically included in the review, since they relates to a wider set of issues and not specifically to the formulation of tariffs. As noted earlier, the review was informed by the project advisory committee established for this research. The committee comprised government and enterprise stakeholders (end-users), and academic experts. The committee was influential in guiding the use of industry reports and particularly the interpretation of complex extant tariffs faced by irrigators in Victoria’s north.
2 It is worth noting that the involvement of farmers in the development and implementation of a discrete choice experiment also carries the advantage of engaging with them on this topic and improving communication generally.

8 Leading gifted horses to water
Important documents in this context include Pricing Signals Study for the Food Bowl Modernisation Project by Frontier Economics (2008) and the so-called 1992 McDonald Review (Future Management Review of the Rural Water Commission) which was persistently cited by industry stakeholders and others as indicative of the impacts of legacy choices. The second element of the literature review dealt with the theory of choice behaviour. The aim in this case was to use elements of both the economic and psychology approaches to gain a more comprehensive picture of irrigators’ preferences for rural water tariffs. This requires a technique that is capable of capturing both economic and psychological variables. Choice Modelling allows this in a relatively realistic experimental procedure3. Thus, a choice experiment that included survey questions relating to psychographic, socio-economic and demographic variables, in addition to the choice task itself, was initially expected to prove useful in developing empirical data that explained choices in the current context. More specifically, if a water bill is treated as a ‘product’, then it should be possible to enumerate its attributes and determine their relative importance to irrigators. Moreover, such an approach would presumably facilitate an examination of the influence of variables such as irrigation district and farm size on consumer choice behaviour and thus guide the design of new tariffs that could encourage adaptation. Attitudes to climate change, risk and environmental values could also provide insights that might assist communication about adjustment practices and options and data on these can be assembled using choice modelling. The project advisory committee provided oversight of the methodological approach and endorsed the use of Choice Modelling in the first instance. The committee also supported the research team’s decision to adjust this approach later in the project (described later). The deployment of the Choice Modelling approach is based on several iterative phases to ensure the assembled data ultimately provide answers to the underlying research questions. In most cases this amounts to defining and then refining attributes and then identifying levels within attributes as the study progresses. In the case of this project some intervening factors (described in 2.2.5) resulted in a more significant reconfiguration and thus necessitated additional scrutiny of the theoretical literature. More specifically, additional literature relating to Best–Worst Scaling was ultimately included in the review, primarily on account of the response to a ‘price’ attribute in the choice experiment. The methodology was also adjusted to reflect this difference in approach. Best–Worst Scaling is an abridged form of discrete choice analysis, which is based on a multiple-choice style questionnaire (Coltman et al. 2011). To our knowledge, this approach has never been used in the context of complex rural water tariffs (e.g. Lee, Soutar, and Louviere 2007; Buckley et al., 2007) and additional detail about this approach is offered in section 3.
3 A detailed discussion of the theoretical underpinnings of Choice Modelling is offered in Appendix A.

Leading gifted horses to water 9
2.2 Determining attributes and levels of the choice experiment
This research initially followed the experimental design used by Hensher et al. (2005), involving focus interviews, focus groups, and survey pre-testing. It was anticipated that this process would reveal the relevant attributes and levels of the ‘product’, i.e. a rural water tariff that explained the behaviour and preferences of water users. A group of a priori attributes of agricultural water tariffs (and likely levels within those attributes) was developed from an extensive review of the water pricing literature and discussions with key stakeholders associated with rural water pricing in northern Victoria. The perspective of customers of G-MW was also considered. This was captured through focus group discussions with water service committees, which comprised representative customers from the six gravity irrigation districts in northern Victoria, namely Central Goulburn, Murray Valley, Rochester–Campaspe, Shepparton, Torrumbarry and Loddon. These six districts were selected to draw the sample for conducting the choice experiment. These six irrigation districts allow for comparison on several dimensions, including:
• different land use activities; • historical soil salinity and water use levels; • levels of investment and density of service infrastructure; and importantly • different histories of water pricing.
From a climatic perspective, districts in the eastern portion of the study region generally receive more rainfall than those in the west. Reliability of rainfall also declines moving east to west. Importantly however, localised rainfall is less significant to irrigation enterprises than rainfall in the servicing catchments. This arises because water rights in this part of Victoria are all defined similarly (i.e. as high-security or high reliability rights). Thus, the issues of localised variations in rainfall will usually be outweighed by the status of upstream storage, since farming enterprises (i.e. land use activities) have already been structured around variations in localised climate and soils. The upshot, as witnessed in the drought at the start of the century, is that major production impacts are universally shared when upstream stored water falls well below capacity. How businesses adjust when there is persistent water shortage in the feeder catchments is thus more important to adaptation than localised variations in rainfall. Some relevant characteristics of the pre-defined study location are presented in Table 2.1 in order to provide a broad context to the analysis.

10 Leading gifted horses to water
Table 2. 1 Characteristics of study locations
Irrigation district
Basin Irrigation properties
Land use Irrigation channels
Average volume of water used for irrigation in region per annum
Planned works — connections project
Central Goulburn
Goulburn River Basin
4, 132
Dairying; fruit production; sheep; crop production
1, 352 km 172 GL
70 km of channel lining;
1, 086 regulator gates;
1, 788 metres
Murray Valley
Murray River Basin
2, 181 Dairying; grazing; forestry 930 km 363 GL
120 km of channel lining; 669 regulator gates; 1, 237 metres
Rochester Campaspe Basin 1, 802
Dairying; fruit and vine growing; dryland farming
553 km 94 GL
59 km of channel lining; 453 regulator gates;
1, 080 metres
Shepparton Goulburn River Basin
2, 408 Dairying and fruit production 723 km 72 GL
Stage 1 of the Connections program did not include provision for modernisation works; Stage 2 works will focus on reducing redundant assets including sections of channel
Torrumbarry
Mallee; Avoca; Loddon Basins
3, 249
Dairying; dryland agriculture; grazing and cropping; fruit, vegetable and forest industries; pig and poultry farming
1, 569 km 334 GL
73 km of channel lining; 546 regulator gates;
1, 212 metres
Loddon Loddon River Basin
568
Sheep and cattle grazing; crop production; fruit, vegetable and forest industries; pig and poultry farming
1,744 km 92 GL
58 km of channel lining; 564 regulator gates; 977 metres
Source: www.g-mwater.com.au 2012
2.2.1 Determining attributes and levels of the choice experiment Semi-structured in-depth interviews were conducted with a number of experts including the:
• Managing Director of G-MW, • General Manager of Social Economic Analysis for the Murray–Darling Basin
Authority,

Leading gifted horses to water 11
• Principal Advisor for Industry and Economics in the Office of Water for the Department of Sustainability and Environment,
• Senior Policy Analyst from the Department of Treasury and Finance, • Executive Director of the Policy Services Division for the Department of Primary
Industries, • Senior Regulatory Manager of Water for the Essential Services Commission, • Stakeholder Relations Manager for G-MW, • Manager of Economics and Tariffs for G-MW, Customer Service Regional
Managers for G-MW, and • Academic experts in climate change and water policy.
A total of 14 industry experts participated in the interview process. The discussion in these interviews focused on the current and proposed structure of the rural water tariff and the regulations circumscribing the price setting process. The interviews revealed three themes pertinent in the context of this project:
• the complexity of the tariff structure; • the complexity of the pricing regulation process; and • the significant influence of historical pricing decisions.
Complexity of the tariff structure The break-down of the charges for water users alone makes the tariff structure complex. There are slightly more than 400 potential charges for customers of G-MW. These can be broadly categorised into bulk water, entitlement storage, water delivery and drainage charges. The charges also differ across the six gravity irrigation districts. For instance, the charge for each delivery share presently ranges from $2,700 to $4,700 and, since these charges also determine termination fees, will also likely impact on incentives to adjust the scale of irrigation should climate change result in permanent reductions in water availability. The subsidised infrastructure modernisation also means that current charges do not reflect the service provided to irrigators, raising questions about the long term sustainability of this approach and any attempts to improve the efficiency of the price signals so generated. For example, the level of service provided by the so-called ‘service points’ differs across the GMID; however, the current charge is not differentiated on the basis of quality of service. Complexity of the pricing regulation process The regulations surrounding the tariff add another layer of complexity. Firstly, there are numerous regulatory bodies that influence the charges that G-MW presents to its customers including the Essential Services Commission (ESC), the Australian Competition and Consumer Commission (ACCC), and the state government’s Department of Treasury and Finance (DTF). In addition, the findings of the ACCC are critical in determining the equivalent of termination (exit) fees payable by those choosing to opt out of irrigation on a permanent basis. More specifically, the ACCC sets an upper limit of ten times the delivery share charge as the maximum termination fee that can be levied. A delivery share gives irrigators the right to access and use the capacity of the system and presently represents the most substantive cost for most irrigators (described in full in 3.2.1). Irrigation entities can set this fee at a lower level but, in the case of Goulburn–Murray Water, the maximum multiple (10) is the current practice. Secondly, the regulations around trading water rights also influence the charges customers are required to pay. For instance, a customer may sell all of their water
12 Leading gifted horses to water
allocations on an annual basis or permanently sell their water entitlements, but still be required to pay a delivery share charge, which essentially comprises the infrastructure access fee. As we have already noted, this is a critical determinant of the willingness of irrigators to adjust the scale of their enterprise(s) to longer term changes in water availability. Set too high, termination charges will limit the capacity of farmers to adjust to alternative means of production or ease out of irrigation. Thirdly, stakeholders such as the DTF, the Department of Primary Industries and the Department of Sustainability and Environment also play an important part in this domain. Examples of influence include the establishment of rules around the borrowings of water utilities and the setting of rates of return on capital. Perhaps not surprisingly, there is no obligation for the various regulatory bodies to share common objectives or communicate about their approaches to farmer adaptation. Influence of historical pricing decisions Notwithstanding its development almost thirty years earlier, the interview phase confirmed earlier advice that the so-called McDonald Report continued to influence the logic behind water tariffs in the region, at least from a farmer perspective. Core components of this report and its relevance to this project are briefly described in section 3.
2.2.2 Focus group phase G-MW has formalised networks for gaining input on water prices and irrigation management. This takes the form of Water Services Committees that include key stakeholders, such as the Victorian Farmers Federation. Focus groups were conducted with the six water service committees from the GMID. This provided the opportunity to gain irrigators’ views about water tariffs across all of G-MW’s gravity irrigation districts in northern Victoria. The focus groups comprised eight to ten customers and also two to three customer managers from G-MW for the particular district. Meetings were recorded on audio tape, taking approximately one to three hours. These were later reviewed to identify important themes that relate specifically to the pricing structure for water and water services4. Each focus group session began with an introduction defining the objectives of the research, identifying the funding body and highlighting the purpose of the focus meeting; namely, what were participants’ thoughts and attitudes towards the current tariff structure and billing process and what modifications were appropriate from their perspective, especially as they related to farm adjustment? Participants were then asked to discuss how well they understood the tariff structure and what factors they believed should influence charges to irrigators in light of recent infrastructure changes and the recent history of changed water availability. Where an attribute was raised, participants were then pressed to discuss the likely range of that attribute. For example, after the ratio of fixed and variable charges was mentioned as being an important element of the tariff structure, participants were asked to suggest what ratio would be appropriate. Once the focus group had canvassed the various attributes an additional question was posed. Participants were specifically asked if they would be prepared to pay for a different tariff structure that better matched their preferences and if so, how should it be levied and how much they would be willing to pay for this ‘modernised’ structure. The
4 Such sessions are common practice for behavioural experiments of this form. They are not intended to form the basis of detailed qualitative analysis per se, but act to ensure that any survey instrument is crafted to resonate with participants.

Leading gifted horses to water 13
primary aim of this approach was to establish the strength of existing preferences for changing the tariff regime. Explanations were offered from a G-MW perspective in the form of a likely requirement to update billing systems, employ new technologies and the like, in order to then deliver the preferred practice. The discussion in these sessions reaffirmed concerns about the complexity of the tariff structure and the differing views of irrigators not only across districts, but within districts. Importantly, there was clear evidence in these sessions of a positive willingness to pay and thus adequate grounds to continue employing a Choice Modelling approach (i.e. an approach that necessarily includes a price or cost attribute and a limited but relevant set of other attributes). It was also common for participants in the focus sessions to express their views about the administration of the water bill and the payment process. The link between the structure of the tariff and the way it was administered guided parts of the next phase.
2.2.3 Attributes for conduct of pilot experiment Five attributes were initially identified from the literature, interviews and focus groups. The attributes and levels used in the choice experiment pilot are summarised in Table 2.2. An explanation of each appears in the Appendix A. Table 2. 2 Attributes and Levels in Choice Experiment
5 An earlier study along the lines of water tariffs has shown that water users resonate with the description of the bifurcation of fixed and variable charges in this form (see, for example, Crase, O’Keefe and Dollery 2008). The focus groups for this project confirmed that view.
ATTRIBUTES DESCRIPTOR STATUS QUO LEVELS
Risk and Control5 Ratio of fixed and variable costs
90% fixed costs; 10% variable costs
70% FC: 30% VC; 80% FC: 20% VC; 100% FC: 0% VC
Pricing strategy Pricing approach across gravity irrigation districts
Differentiated across districts
Uniform; Differentiated
Complexity Understandability of the water bill 400 potential charges
Increase break-down of charges; Decrease break-down of charges
Payment instalments
Options for payment of water bill
Upfront or 4 instalments over 5 months
Once a month over 12 months; Once a month over 10 months; Once a month over 8 months
Cost Willingness to pay for modernised tariff $0
$500; $1,000; $10,000; $20,000; $40,000

14 Leading gifted horses to water
2.2.4 Design of choice experiment Once attributes and levels were identified, an efficient D-design was used to create choice sets. Choice sets comprise many attributes and levels potentially generate a large number of combinations that could be presented to respondents. Early design approaches focussed on orthogonality but there is a growing trend towards more efficient designs for choice experiments. More specifically, algorithms have been developed that allow the researcher to identify combinations of attributes that will yield the most meaningful data, without the need for orthogonality. This approach generates improved models with smaller samples. Figure 2.1 illustrates an example of a single choice set and the details of the design process are also summarised in Appendix A. These sets were presented to respondents in the pilot phase.
Which tariff option would you choose?
Complexity Risk & Control
Pricing Strategy
Payment Options
Price
Option 1 Yes 100% FC Uniform Upfront $10,000
Option 2 No 80% FC: 20% VC Differentiated
Once a month over 12 months
$500
Current Situation No 90% FC:
10% VC Uniform Upfront $0
Figure 2.1 Example choice set
2.2.5 Pilot survey phase The initial choice experiment was piloted with three of the Water Service Committees; namely the Murray Valley, Shepparton and Rochester gravity irrigation districts. It became evident that, whilst the respondents had a strong preference for the ‘modernisation’ of their water tariff and an appetite to restructure the water bill, their original willingness to support such an approach with a payment had dwindled. This change can be attributed to several intervening factors including the public release of information about the serious financial challenges confronting G-MW and several reports relating to the costs and decision making processes that attended the NVIRP project. It is also plausible that the ‘group’ opinions expressed in focus groups sessions were now challenged, once respondents were faced with a written survey that sought a commitment to honestly reveal their individual willingness to pay6. The upshot was that respondents in the pilot survey continuously selected the status quo option when presented with choice sets and showed in their responses to follow-up 6 It is important to understand that the framing of any choice experiment is critical to its success and the usefulness of the resulting data. For instance, it may be possible to purposely paint a particular scenario of water availability and the future in order to prompt a WTP. In the case of this experiment our focus was on limiting the bias in the framing of the experiment to establish genuine enthusiasm for moving away from the status quo.

Leading gifted horses to water 15
questions that they held strong reservations about paying anything extra, even if it meant receiving a tariff structure that better aligned with preferences. The respondents also expressed some distrust that authorities would deliver on any reform. As discussed earlier a choice experiment requires a cost attribute to be included to establish a basis for measuring the Marginal Rate of Substitution (in effect, the dollar amounts become the way of measuring how respondents are making cognitive trade-offs). In this case, the pilot phase indicated that a choice experiment was not likely to be an effective tool in gauging customers’ preferences7. Against this background, an additional round of consultations took place accompanied by expanded work on the theoretical literature.
2.2.6 Extended review and consultation The 2012 G-MW Water Service Committee Workshop was held in August 2012 where all water service committee members attended. This comprised approximately 160 customers of G-MW and the Board members of G-MW and was conducted over two days. One of the main topics of discussion was farmers’ opinions about the recently released Draft Tariff Strategy for the yet-to-be approved Water Plan8. Subsequently, G-MW also conducted a number of public consultation meetings in each of the gravity irrigation districts to discuss the Draft Tariff Strategy. Other meetings were convened by the Essential Services Commission and were attended by a large number of irrigators who voiced their concerns about increases in water prices. Researchers from this project attended three of these meetings that had 30 to 40 participants and were conducted over one to two hours. Importantly, this allowed the capture of opinions and preferences of customers other than members of Water Service Committees. The Water Service Committee Workshop and the public consultation meetings that followed highlighted the importance of preferences for additional aspects of the tariff reform beyond those initially contemplated in the choice experiment. General animosity about the prospect of higher water charges was also evident. A technique that is capable of capturing the preferences for a larger number of attributes than those suitable to a choice model was thus now required. It was also clear that an approach that did not rely on a price attribute to adjudge the acceptability of tariff reform would overcome the persistent deferral to the status quo witnessed in the pilot phase. Best–Worst Scaling was identified as a technique that fulfilled these criteria. The approach employing Best–Worst Scaling is reported in detail in section 3.
7 One option to deal with this approach would be to present respondents with a range of scenarios, including those forecasting dire consequences of climate change and water availability. As noted, we find this approach objectionable on numerous grounds, not least that it is likely to generate data that is largely irrelevant to solving extant problems that, if addressed now, would lead to enhanced adaptation behaviour. 8 In Victoria water businesses release a Water Plan that establishes the proposed price path for the next five years. These plans are based on estimates of water availability and the cost of providing that water. The five year timing frame means that the plans adjust quite slowly to changes in water availability but this need to be traded off against the administrative costs of developing plans on a more frequent basis.

16 Leading gifted horses to water
2.3 Quantitative analysis of financial impacts As noted at the beginning of this section, the third main set of activities related to understanding the financial impacts of different tariff structures on irrigation business and the water supply corporation. For example, opting for a pricing regime that embodies reduced termination charges eases constraints around adjusting the scale of irrigation but simultaneously impacts on the financial sustainability of the supply corporation. The Best–Worst Scaling survey specifically included a number of economic and farm related measures that can be interacted with the discrete choice data. This type of modelling can ultimately give an indication of the interplay between productive activities and the reconfiguration of tariffs. At the scale of the water supply corporation, it is important to note that G-MW was intimately involved in the conduct of all phases of this project. Helpful suggestions were made and incorporated into the survey that was distributed to farmer irrigators. In many cases these suggestions have been founded on internal G-MW modelling of the business impacts of different tariff regimes. For example, one question within the survey sought to establish the willingness of farmers to accept a 5 per cent reduction in total charges in exchange for a 100 per cent fixed water charge. This option is based on the modelled value of revenue risk to G-MW. Accordingly, the calculation of financial impacts on the water supply corporation was already embodied in the survey proper.
2.4 Mapping reform pathways Setting aside the difficulties associated with some earlier phases of this project, progress on the third objective — mapping general lessons and a reform pathway — was possible with the Best–Worst Scaling approach. This is discussed in greater detail in section 3.

Leading gifted horses to water 17
3. RESULTS AND OUTPUTS
As noted earlier, the project did not follow the original research plan, but used the information revealed through the various iterative phases to adjust and refine the method. The outputs from earlier phases, specifically the piloted choice model experiment, are included in appendices in the interest of transparency and completeness. This section deals primarily with the results from the investigation into institutional architecture and the modelling from the Best–Worst Scaling exercise9. The rationale for adjusting the research plan is summarised below:
• Initially it was intended to use Choice Modelling to establish the Marginal Rate of Substitution for different elements of a tariff regime. This would enable the researchers to prioritise tariff reform against customer preferences whilst ensuring adaptation signals were not distorted.
• The Choice Modelling approach requires respondents to rank the elements of a product (in this case a tariff regime) against a ‘price’ attribute. This type of experiment is challenging, but has nonetheless been shown to be effective in the case of urban water tariffs (see Crase, O’Keefe and Dollery 2008)10.
• Establishing attributes and levels involved extensive interviews and focus group sessions conducted across the irrigation districts. The progress with focus groups was tested with the advisory group and support for the work continued.
• As the development of the Choice Experiment moved towards the finalisation of attributes and levels, media releases by the VAGO, G-MW and the ESC attracted the attention of local residents. There were several elements to these:
o G-MW faced a number of financial challenges, including substantial on-going debt;
o NVIRP, which had previously operated separately, was to be absorbed into G-MW, along with its costs;
o The roll-out of NVIRP had been linked to controversial governance procedures, including likely breaches of privacy legislation;
o The ESC was to conduct a range of public meetings to provide a vehicle for farmers to air concerns about changes to water prices over the coming five years.
• The upshot from the final pilot survey of the Choice Experiment was that the research landscape had markedly changed; it was now highly unlikely that a usable response would be received for the ‘willingness to pay’ questions. Moreover, a poor response to the choice experiment generally would mean that very little could be salvaged from the project.
• To deal with these issues a decision was made to revert to a Best–Worst Scaling experiment. This approach was supported by the advisory group and was likely to meet with less opposition from farmers. This required a repeat of some focus sessions to establish new attributes and definitions thereof. Additional piloting of the experiment and refinement of the design was required to optimise the response rate, albeit set against a volatile political environment.
The outputs listed below relate to the Best–Worst Scaling preceded by the review of institutions and price setting arrangements.
9 We gratefully acknowledge the assistance of Professor John Rose, University of Sydney, with the design and application of parts of the Best-Worst Scaling experiment. Errors and omissions are attributable to the authors. 10 This approach was successfully employed by Crase, O’Keefe and Dollery (2008) to enumerate the preference of urban water consumers in Victoria. Their study showed a strong preference for water users to have greater control over their total water bill and thus supported an increase in the portion assigned to the volumetric element of water tariffs. Interestingly, these results also applied to urban customers who had historically used larger volumes of water.

18 Leading gifted horses to water
3.1 Findings on the institutional architecture
3.1.1 Full cost recovery The notion that users of a resource should pay for the benefits so derived, is at the core of conventional economic thinking. In essence, it follows that the rational water user will only use the resource up to the point where the additional benefits equate the costs. If benefits exceed costs but users are prevented from gaining additional water then there is an inherent incentive to increase supply to meet the extra demand. It is through these basic mechanics that a cost-reflective water price should simultaneously rein in excessive demand and stimulate the provision of augmentation works to efficiently satisfy end-users. These same mechanisms should transpose into adaptation behaviours that match progressive changes in resource availability11. The elegance of the full cost recovery argument is, however, challenged by a number of factors.
• First, water use may have broader public benefits that go beyond the individual’s willingness to pay.
• The provision of water and related services does not start from scratch, as noted earlier. A dam built 50 years ago, with the purpose of providing flood mitigation, might now be considered a hindrance to the achievement of ecological sustainability.
• The value of water itself is not easily established. Where water markets exist it is possible to use these revealed preferences to gain insights into the relative scarcity of water and its value in differing applications. However, the high variability of water availability means that during very wet seasons, the scarcity value should approach zero, but few seem willing to accept this notion (Dwyer 2006).
• The fact that single suppliers deliver water to end-users provides scope for monopoly rents via the charges they levy.
In simple terms, the theoretical notion of full cost recovery represents an ideal state to which policy makers might aspire, but the practical challenges of establishing prices that reflect cost in this setting are non-trivial. In addition, the development of accounting conventions which align with these notions is no simple matter and understanding these nuances was an important contribution of this project.
3.1.2 Regulatory price setting In order to provide some insights into the mechanics for resolving some of these problems, we briefly describe the processes employed by Victorian water businesses in the development of pricing submissions presented to the ESC. The ESC procedures necessitate the preparation of regulatory accounting statements in accordance with the ESC (2009) Water Industry Regulatory Code. Whilst serving an important part of the price setting process, complete regulatory accounts are not publicly available12. Regulatory accounts contrast with the preparation of annual statutory financial reports. Statutory reports are prepared following accrual accounting principles and in accordance with Australian Accounting Standards Board (AASB) accountings
11 The complications that limit this assumption are addressed later in this section. 12 This raises some questions about the transparency of price setting in Victoria but this is beyond the scope of this project.

Leading gifted horses to water 19
standards, Victorian Department of Treasury and Finance (DTF) Financial Reporting Directives (FRDs), together with Victorian Water Minister Ministerial Reporting Directions (MRDs). Ryan, Guthrie and Day (2007) reported that the current Australian sector neutral approach to standards contrasts with the pre-2000 arrangements whereby a separate body of public sectors standards was developed by the Public Sector Accounting Standards Board (PSASB). The PSASB was subsequently merged with the ‘old’ private sector AASB to form the ‘new’ AASB. As has been discussed elsewhere (see, for example, Clarke 1998; Lee & Fisher 2004; Walker, Clarke & Dean 2000), the use of the same accounting standards by both public and private sectors followed a greater emphasis on the financial results of public sector entities. This was further premised on an assumption that meaningful comparisons of private and public sector performance could be made and acted as a lever for driving public sector efficiency enhancements. As further outlined and contrasted below, regulatory and statutory accounting practices differ on a number of grounds, including the measurement basis for infrastructure, and the treatment of gifted assets. An evaluation of these differences highlights a number of key pricing issues and the role of accounting conventions in influencing the reported financial performance and position of water entities. ESC tariff setting processes are consistent with the principles embodied in the NWI and can thus be interpreted more generally, although nuances also occur between jurisdictions. Water businesses are required to present a five-year water plan to the Commission which forms the basis for establishing water tariffs over that period. The starting point for this process is the ‘building block approach’, or what is sometimes called Long-Run Marginal Cost (LRMC) estimation. LRMC estimation is a pragmatic approach and accordingly falls short of the idealised elements of price, as portrayed in neo-classical economics and described earlier. LRMC is a relatively static concept that slowly adjusts to reflect water scarcity. In effect, LRMC is estimated by taking the Short-Run Marginal Cost (SRMC) and adding a margin to capture the average cost of bringing forward the next supply augmentation to meet likely demand. SRMC is primarily the current costs associated with delivering the next unit of water. When water supplies are variable, as is the case in rain-dependent systems in Australia, the LRMC will often fail to reflect the true scarcity value of water. More specifically, in wet years LRMC will over-price water and will discount the resource in dry years. LRMC is also not well-suited to deal with uncertainty and works best when future demands are easily predicted and future supply costs are known (PC 2011). In the context of greater variability in water supplies associated with climate change there are grounds for reviewing the national-accepted approach to water pricing and its foundations in LRMC. A review of this scale is beyond the scope of this report but nonetheless urgently required. The potential for LRMC to discount water in dry years was raised by the Victorian Auditor-General’s Office (VAGO 2011) in their recent analysis of 2010–11 Water Entity annual report audits. This report noted that the current water plans, covering the period 2008–13, were developed during a period of serious ongoing drought. This problem was compounded by the subsequent periods of above average rainfall experienced post 2008 which further reduced demand. The VAGO (2011b, p. xi) cautioned that “in the event that revenue further reduces due to reduced demand for water, financial stability [of Water Entities] may be adversely affected”. Of course the corollary of this

20 Leading gifted horses to water
argument is that water users may be unwittingly encouraged into expanding production when LRMC results in under-pricing during dry phases. Capital costs represent the main cost of running a water utility and determining an appropriate method for estimating these costs has significant ramifications on water charges, as we will see. The RAB is employed in the case of water tariffs in Victoria and an important feature of the RAB approach is that it includes a return on capital, to reflect the opportunity cost of the investment of funds, and a return of capital, to reflect the depreciation costs of the infrastructure. These are then summed with forecast operating costs to determine the overall benchmark revenue requirement for the business. Given that water businesses entering a regulatory phase carry legacy assets, a method is required to account for the value of these pre-existing investments. In the case of Victoria and some other jurisdictions, a ‘line in the sand’ approach was adopted which ostensibly fixed the rate of return on previous investments. Whilst a number of valuation techniques are available to establish the value of legacy assets, there is at least some evidence that the initial asset valuations in Victoria were based on ‘back-solving’ using an acceptable rate of return, also determined by the regulator, and ensuring amenable price rises would emerge as a result (see, for example, ESC 2005, p. 42). In the case of rural water utilities in Victoria the RAB was initially set at zero, ensuring a low tariff at the commencement of regulation. The rate of return (i.e. the weighted average cost of capital split between debt and equity funding) in this instance was purportedly derived from the capital asset pricing model. In the initial price determinations, this was set at 5.1 per cent for metropolitan water entities and 5.8 per cent for others. This was seen as reflecting the opportunity cost of capital in water businesses. The resulting prices were also seen as giving rise to incentives to undertake efficient investment in new infrastructure, but not too lucrative to allow for over-investment and thus bestow inefficiencies on downstream markets. Clearly, much of the analysis in this context relates to judgments around what constitutes ‘efficient’ versus ‘excessive’ investment. Having established an initial rate of return (WACC) and asset base, the process for future price determinations hinges largely on additional infrastructure investments and their relationship to the demands of water customers. Some of these can be adjudged on the basis of forecast growth in the customer base, although consumption patterns in this context are subject to a range of factors making accurate modelling a challenge. Changed government policy can also impact on the water used by customers (see, for example, Cooper, Burton & Crase 2011; Cooper, Rose, & Crase 2012). An important, although arguably misunderstood, element of the building block approach relates to infrastructure assets that are ‘gifted’ to water businesses. In some instances, state and federal governments may see the need for enhanced water infrastructure which is adjudged to be beyond the means or scope of water customers. For example, it might be the case that the state sees merit in reducing the discharge of effluent to streams and, given the wider environmental benefits, opts to fund the improved wastewater infrastructure from general revenue, rather than accruing this amount from charging water users. Similarly, the state might impose some minimum standard of service and undertake to subsidise the infrastructure to meet this benchmark on equity grounds, especially given the scale economies that attend some water infrastructure. Gifted assets may also be contributed by developers required, for example, to install and gift water and sewer assets as part of land developments.

Leading gifted horses to water 21
Statutory accounting principles require gifted assets to be recognised at fair value with assets gifted by governments generally treated as an equity contribution. Assets gifted by developers, on the other hand, are recognised as revenue (see, for example, AASB 116 Property, Plant and Equipment; AASB 118 Revenue; AASB 120 Accounting for Government Grants and Disclosure of Government Assistance; AASB 1004 Contributions; FRD 119 Contributions By Owners). Whilst potentially a material source of income from a financial reporting perspective, for the purposes of tariff setting, the ESC (2009) Water Industry Regulatory Code specifically disallows water entities from increasing their RAB to reflect newly gifted assets. Put simply, gifted assets appear under statutory reporting requirements but are omitted from the regulatory assets that underpin the determination of water prices. The logic of this exclusion hinges on the notion of double-counting on the part of the water utility. More specifically, if the assets have been gifted by the state on the basis that it serves some wider public good, it would then be inconsistent to require specific water users to pay for them. However, there is also a corollary to this argument. Namely, if these assets are not adequately accounted for within prices, there is a risk that insufficient funds will be set aside to replace them in due course, unless of course the state intends to continually replace them. By way of illustration, consider the inability of Goulburn–Murray Water to adjust their prices to reflect the need to prepare for the future replacement of $600 million worth of assets that will be gifted as part of the Northern Victoria Irrigation Renewal Project (NVIRP) (Goulburn–Murray Water 2010). Such issues are likely to be particularly problematic when the gifting of assets arises because of a short-term political advantage and is not supported by some reasonable public good rationale. Put differently, gifting assets by government and then excluding them from the RAB have the potential to unnecessarily depress prices thereby distorting the signals received by water users. If current water usage is thus encouraged to expand it follows that the consequences of any reduction in water availability though climate change will be made more severe than would otherwise be the case.
3.1.3 Goulburn–Murray Water tariffs in review As noted at the outset, this project does not have the luxury of dealing with a blank canvas — there is a long and difficult history to negotiate in order to understand and then modify water tariffs13. Critical elements in the history of reform are illustrated in the so-called McDonald Report (1992) and Frontier Economics (2008) and the key message relating to this project are summarised below. Future management review of the Rural Water Commission — The McDonald Report The McDonald review was undertaken at a time of important structural change within the rural water sector and the Australian economy generally. Enthusiasm for a national competition policy was translated into calls for greater attention to user-pay principles, including in the provision of water services. The McDonald review made transparent the shortfall of revenues against the costs of irrigation activities in Victoria. Importantly, the authors observed that “while irrigated agriculture provides major flow on benefits to other sectors of the economy, these benefits do not, in themselves, justify the wider
13 We do not claim that this is a unique challenge associated with reforming water prices.

22 Leading gifted horses to water
community contributing to the cost of rural water systems” (McDonald et al. 1992, p. v)14. The mechanism for addressing this shortfall was to be the devolution of decision making to lower levels of authority thereby realising cost savings, via improved management and accountability. The magnitude of the projected savings was non-trivial. For example, the existing 42 per cent shortfall in revenues for irrigation in 1992 was projected to transform into a breakeven position by 2004–05, provided that increased localised decision making took place. The underlying assumptions of this rather miraculous transformation included:
• an increase in customer charges not exceeding 1.86 per cent per annum;
• the exclusion of existing long-term debt already assembled by the Rural Water Commission such that it was absorbed by the state;
• continued government contribution to cover headworks charges till 2000–01 and government absorbing all backlogged infrastructure replacement costs identified at that time.
The promise of irrigation paying its own way was thus premised on the ceding of control of irrigation districts to farmers, albeit without the necessity of corporatisation and some ongoing, but limited, contribution of capital from the state government. The McDonald Report’s focus on paying for the share of services provided by irrigation networks and subsequent calls for unbundling of water rights saw the emergence of the notion of delivery shares in irrigation districts. The concept of a delivery share represents an attempt to capture the gross benefits that accrue to ‘owning’ part of an irrigation network and then apportioning costs on the basis of the benefits so derived15. In the case of G-MW this is presently translated into the ownership of a portion of the irrigation infrastructure based on the size of the water entitlements held by each farmer. This approach loosely equates to a right to receive a given quantum of water for the period of the irrigation season, subsequently apportioned to a daily volume of water received. Put simply, a delivery share should roughly represent the amount of water an irrigator can access from a communal irrigation network within a given time frame. This forms the basis of much of the tariff paid by water users. However, in practice its current configuration makes no, or limited, account of the level of service that attends delivery of that water or the costs of meeting that obligation, say through a farmer holding multiple delivery outlets from the irrigation network to an individual farm. These anomalies are set to worsen under NVIRP and without tariff reform the distortions that presently attend water access and use could become more influential under climate change. For example, a relatively inefficient irrigator that presently receives a subsidy, by virtue of a service fee that is under-priced, could conceivably displace a more efficient irrigator without subsidy when competition for water becomes intense. This type of competition was witnessed during the drought at the start of the century and repeated instances in the face of underlying price distortions could lead to an irrigation network dominated by the relatively inefficient producers.
14 Perhaps ironically, the Business Case to justify NVIRP included the so-called flow-on benefits from government expenditure on water infrastructure to achieve a positive net benefit. 15 Additional information about the current arrangements that attend delivery shares is provided in section 3.2.

Leading gifted horses to water 23
As noted earlier, the delivery share model also underpins the termination charges should an irrigator seek to adjust the scale of their enterprise. It is our contention that this poses additional risks to efficient adaptation within the sector. At a broader level it remains a moot point as to whether the 2010–12 investment of more than $2 billion of public monies accords with the earlier expectations of full cost recovery espoused in the McDonald report. It is nonetheless the case that many in the sector (perhaps selectively) recall elements of these reforms and culminated in it being regarded as a landmark document. Pricing signals study for the Food Bowl Modernisation Project — Frontier Economics More than one and a half decades after the McDonald Report, Frontier Economics was commissioned in 2008 by the Victorian Department of Sustainability and Environment to review, amongst others, the impacts of tariff structures under FBMP (later known as NVIRP). The purpose of this study was to better understand the motivations for farmers voluntarily connecting to the NVIRP project, which had already been committed to by government. Frontier Economics (2008, p. 4) observed that the tariff structures that attended water use could potentially play an important part in shaping the reaction of farmers to infrastructure projects like NVIRP. They further noted that the approach to pricing and tariffs would require special attention to cost apportionment, which was described in terms of “changing the district based approach [to tariffs] to a more disaggregated approach over time to encourage efficient provision of assets”. They also observed that a cost recovery mechanism was an important element of such projects and noted that in the case of FBMP this “included shifting the balance [of G-MW’s revenue recovery] from fixed delivery share charges to a fixed per outlet charge to better reflect future cost drivers”16. In line with the findings from the qualitative research in this project, Frontier Economics (2008, p. 4) also observed that more efficient price signals to farmers connected to NVIRP would have to be balanced against minimising “complexity in the overall tariff design”, “potential equity impacts particularly associated with the historical legacy of district based contributions” and “consideration of other impacts, such as those on termination fees and water trade”. Frontier Economics did not have access to data that would inform a ranking of these trade-offs, which is clearly achievable within the current project. In addition, Frontier Economics noted that:
“To comprehensively address the issues associated with tariff reform it is important to undertake thorough, integrated and evidence-based assessment and empirical modelling of costs into the future, tariff structure options and resultant tariff levels. We recommend that such work include broad examination of the potential for tariff reform options that could provide the flexibility to address longer-term challenges associated with ageing assets and adjustment pressures, in addition to the impact of FBMP” (p. 4).
This NCCARF project directly deals with those practical challenges and thus hopes to foster adaptation behaviour.
16 As noted earlier, a delivery share represents a volume of water received over a period of time. This takes no account of the technology by which that volume is accessed from the supply network. For example, an irrigator might have multiple outlets from which she draws water at any time, each requiring maintenance by the water supplier. An irrigator with an equivalent delivery share may use only a single outlet, requiring much less maintenance than multiple outlets. Under the present arrangement both irrigators pay the same delivery share charge, which constitutes the majority of most users’ bills.

24 Leading gifted horses to water
3.2 Findings on the Best–Worst Scaling experiment As noted earlier the theoretical framework that underpins this work was modified in response to the changing backdrop to the research. The theoretical material relating to Best–Worst Scaling is summarised below, before presenting empirical results. Best–Worst Scaling is centred on an ordering task that requires participants to make a selection from a collection of items by choosing the ‘best’ (most preferred) and ‘worst’ (least preferred) items in a series of blocks that contain three or more items. The items may be attributes of a product, options in a decision, or bundles of services and products. The method allows for numerical ordering of some set of objects or items to identify their ‘degree of importance’ or ‘extent of preference’. As with choice modelling, this is a stated preference technique and the results must be adjudged accordingly. More specifically, the technique assumes that respondents are able to make rational decisions in the context of the survey instrument and that these choices are reasonably representative of how individuals would behave were the scenarios real. Critics of techniques of this form note that actual behaviour can diverge from stated behaviour and question the capacity of individuals to make choices between complex options, especially if circumscribed by uncertainty, as would be the case with climate change. There are also questions about the extent to which preferences can be aggregated17. Our view is that the current research question lends itself to this approach, notwithstanding a requirement to treat the data with some caution. More specifically, we contend that the respondents are reasonably well-placed to form a choice, arguably more so than external experts. Moreover, since the elicited choices aim to guide rather than proscribe tariff reforms we contend that the approach is worth pursuing. The Best–Worst Scaling approach to determine preferences is particularly effective in creating a numerical ordering in cases characterised with a large number of product attributes or options. Theoretically, the method is in line with the precepts of random utility theory18 (McFadden 1974) and it provides results that are empirically consistent with more complex ordering tasks (Coltman 2011). Marley and Louviere (2005) highlight the formal statistical and measurement properties for Best–Worst Scaling analysis. One of the important characteristics of Best–Worst Scaling is that it measures all of the attributes on a common scale (Auger et al. 2007). Moreover, the method addresses the scalar inequivalence problem that characterises the way respondents use rating scales (Cohen and Neira 2003). Best–Worst Scaling can be categorised into Case 1 and Case 2. The Case 1 method involves participants being presented with subsets of alternatives or brands and being required to identify their best and worst option. Unlike choice experiments, the alternatives or brands are not represented as bundles of attributes and the Case 2 method focuses on attributes, not alternatives. In this instance respondents are asked to identify their best and worst option out of the levels of attributes presented to them.
17 The aggregation issue can be dealt with in many cases by developing latent class models that accommodate the heterogeneity of preferences. Since we are primarily interested in the overarching approach to reform we have not reported such models here and detail the standard MNL model only. 18 Random utility theory is a cornerstone of approaches like CM. It has been widely accepted as a reasonable basis when using surveys to elicit information about preferences. Some of the modelling constraints that accompany random utility theory have been overcome but a voluminous literature remains as testament to its overall usefulness in this context.

Leading gifted horses to water 25
3.2.1 Best–Worst Scaling: Attributes and levels Case 2 Best–Worst Scaling was adjudged most appropriate for this study. This would allow the capture of preferences for each of the levels of the specified attributes. In total, eight attributes were identified to be included in the Best–Worst experiment (refer to Table 3.1) and each is described briefly below. Service Point Fees Currently, this charge is set at a standard rate of $250 per service point across all irrigation districts. The fee does not cover the full ‘whole-of-life-cost’ of each outlet and the balance is recovered through higher infrastructure access fees. This proved to be a contentious issue and was therefore included as an attribute. This attribute was expressed in two levels, including the status quo. The second level was designed to capture preferences for an increase in the service point fee matched by a decrease in the infrastructure access fee. Pricing Strategy As discussed earlier, the current tariff structure differentiates some charges across the different districts. Customers expressed varying opinions regarding any move towards a uniform tariff on this front. In the case of the experiment, this attribute was expressed in terms of the delivery share charge with two levels, including the status quo. The status quo was expressed as keeping charges for delivery share (ML/day) set by each irrigation district and the other level presented the option of adopting a single charge for delivery share (ML/day) across all irrigation districts. Delivery Share The Infrastructure Access Fee is a fixed charge for the right to access the irrigation channel. Currently, it is charged per ML/day of delivery share held, irrespective of the volume of water owned or used. The delivery share charges are different for each of the six irrigation districts in the G-MID. These fees are set with reference to the level of delivery share held (in ML/day) and vary between $2,700/Delivery Share (with Rochester) and $4,700/Delivery Share (Shepparton). This variance reflects the historic decision taken regarding the levels of investment and density of service infrastructure in each district. Currently, the delivery share gives irrigators the right to access and use the capacity of the system. Each delivery share gives the right to 1ML/day of delivery capacity. Holding more delivery shares provides priority access when the capacity of the channel is constrained. Currently, 270ML is set as the upper limit that may be delivered for each ML/day of delivery share held (i.e. 1ML/day over 270 days). The discussions regarding the Draft Tariff Strategy with the customers of G-MW revealed this to be an important and controversial aspect of the tariff structure. The preferences of participants were mixed, with some arguing that the upper limit of the delivery share should be reduced to increase the scarcity of shares. Alternatively, others voiced concern about changing the rules associated with delivery shares as significant business decisions had already been made by customers. Delivery share charges were included as an attribute in the experiment with two levels, including the status quo. The second level offered the option to reduce the volume of delivery share from 270 ML per delivery share to 150 ML per delivery share. Control The ratio of fixed and variable charges remained an important element of the tariff strategy. As mentioned previously, customers expressed various preferences for the ratio, with some favouring a higher variable charge than the status quo and others a lower variable charge than the status quo. This attribute was included and expressed in three levels, including the status quo. The other two levels comprised an increase in fixed costs to 100 per cent and a decrease in fixed costs to 80 per cent.

26 Leading gifted horses to water
Casual Use Fee Casual use fees are levied when water usage exceeds a customer’s entitlement. Currently, casual use fees are set to represent 150 per cent of total charges that would normally be paid. Typically, the fee is $80/ML representing about double the total delivery charges that would be paid at normal rates. Discussion with customers regarding the Draft Tariff Strategy also highlighted this as an important part of a reformed tariff structure. Thus, casual use fee was included as an attribute and expressed with two levels; the first being the status quo and the second representing an increase in the current casual use fee to $100/ML. Termination Fee Currently, the termination fee is exclusively attached to the infrastructure access charge and is set at 10 times the cost of each delivery share. The focus groups stressed the role of the termination fee and its potential to locking irrigators into ongoing channel access, even though a more appropriate adaptation strategy might include dryland farming. Thus, this was included as an attribute to identify preferences for reducing the termination fee. Notably, if the termination fee is reduced this will increase the cost for the remaining customers who will likely also be those that most value irrigation19. Two levels were used to express this attribute. This included the status quo of the termination fee and a level for reducing the termination fee from 10 to eight times the cost of each delivery share. Payment Instalment Options Respondents in focus groups identified a need to increase the variety of payment options that circumscribes their water bills. Currently, respondents receive one bill per year that covers fixed charges. This represents about 90 per cent of water charges for most irrigators. Water users are given the option to pay this upfront or in four instalments over five months. In addition to the status quo an option to increase the number of payment options to monthly instalments over 12 months was also included. Break-down of Charges Currently, there are up to 400 different potential charges in the GMID, arguably increasing the complexity of the bill. Although no consensus was reached amongst respondents in regards to the preferred break-down of charges, it proved to be a contentious and popular issue and was thus included as an attribute. In this case, the status quo was expressed as ‘Keep the existing breakdown of charges that appear on your bill’ and the second level was described as ‘Reduce the number of charges to simplify the bill’.
19 There are some equity issues that attend changes on this front, including whether those exiting an industry should pay to secure the future of others. The pecuniary nature of externalities when farmers exit irrigation has been a major driver of the government programs that lead to the gifting of assets.

Leading gifted horses to water 27
Table 3.1 Best–Worst attributes and levels Attribute Level 1 Level 2 Level 3
Service point fees
Leave service point charge at a low fee of $250/service point per year; and a high infrastructure access fee
(Service Point Fees1)
Increase the service point charge from $250 to $1000/service point per year; and lower the infrastructure access fee by reducing the cost of each Delivery Share by $600
(Service Point Fees2)
Pricing strategy
Keep charges for Delivery Share (ML/day) set by each irrigation district
(Pricing Strategy1)
Move to a Single charge for Delivery Share (ML/day) across all irrigation districts
(Pricing Strategy2)
Delivery share
Keep current volume at 270 ML per Delivery Share
(Delivery Share1)
Reduce volume of Delivery Share from 270 ML per Delivery Share to 150 ML per Delivery Share.
(Delivery Share2)
Control
Keep current ratio of 90% fixed costs and 10% variable costs
(Control1)
Move to 100% fixed charges (currently 90% fixed costs:10% variable costs)
(Control2)
Move to 20% variable charges and 80% fixed charges (currently 90% fixed costs:10% variable costs)
(Control3)
Casual Use Fee
Keep Casual Use Fees as they are. Typically, the fee is $80/ML
(Casual Use Fees1)
Increase Casual Use Fees from $80/ML to $100/ML
(Casual Use Fees2)
Termination Fee
Keep the termination fee at 10 times the cost of each Delivery Share
(Termination Fees1)
Reduce the termination fee from 10 to 8 times the cost of each Delivery Share
(Termination Fees2)
Payment instalment options
Keep the existing payment instalment options (i.e. upfront or with 4 instalments over 5 months)
(Payment Instalment Options1)
An increase the number of payment instalment options that are available to you e.g. the option to pay once a month over 12 months
(Payment Instalment Options2)
Break-down of charges
Keep the existing breakdown of charges that appear on your bill
(Break Down of Charges1)
Reduce the number of charges to simplify the bill
(Break Down of Charges2)
The label used for each attribute level in following tables and figures appears in parentheses in Table 3.1.

28 Leading gifted horses to water
3.2.2 Design of Best–Worst Scaling experiment A balanced incomplete block design (BIBD) was used to determine which of the eight attributes should be shown to respondents. A review of Table 3.1 shows that some attributes had three levels while others were represented by only two. Given the large number of attribute it is possible that any survey design could generate a very large number of combinations across levels and attributes to then present to respondents. The task is thus to use a design that captures the required information without the necessity for each respondent to face an onerous number of choices. A total of 56 choice tasks were generated using the BIBD and this comprised thirteen blocks. Put differently, the design resulted in thirteen versions of the survey and each respondent was faced with only four choice tasks. Each choice task comprised four components — each component being a single level and attribute of the bill and the respondent nominating the best and worst of those four components.
3.2.3 Survey development, piloting and administration The survey comprised four parts. The first part included questions to capture the socio-demographics of the respondents, their water trading history and intentions, and their attitudes towards the irrigation infrastructure modernisation scheme. The second part presented respondents with a range of questions to identify their level of understanding of the pricing process and the current tariff structure. The Best–Worst Scaling experiment questions were presented in the third section of the survey while the final part comprised questions about respondents’ attitudes towards the environment, climate change and risk. The full survey was piloted with three of the Water Service Committees, namely those covering Murray Valley, Rochester and Shepparton districts. This allowed further refinement of some of the terminology. As a result of these trial surveys, some minor changes were made to the instrument itself, mainly to improve clarity. The choice of survey administration mode is one of the more fundamental decisions that confront the non-market valuation practitioner when developing a suitable instrument to elicit the values being sought (Champ 2003). To date, no single mode has proven unambiguously superior (Champ 2003). Experimental studies have traditionally favoured the use of in-person surveys, based on the assumption that the cognitive difficulties associated with the exercise can be ameliorated by this personal contact (see, for instance, Akaah 1991; Mitchell and Carson 1989). Recent research by Hensher (2004) suggests that a properly designed experiment overcomes concerns regarding cognitive burden. Moreover, Akaah’s (1991) review of alternative conjoint administration modes suggests that telephone and mail surveys can also yield data suitable for analysis. More specifically, there would appear to be no significant difference in the predictive performance of conjoint data collected either by mail, telephone or in-person interviews (Akaah 1991).
In this case, the characteristics of the target sample suggested a mail-out survey to be the most appropriate mode of data collection. More specifically, those who participated in the pilot experiment noted that an on-line version would be inaccessible, given their access to technology, and phone surveys invariably interrupted farming tasks. The administration processes broadly followed the Dillman approach, with pre-paid envelopes, introductory letters and the establishment of a help line. In light of the concerns about the privacy of customer information, the mail survey was administered from the offices of G-MW with 2000 surveys circulated. A copy of the survey appears as Appendix B.

Leading gifted horses to water 29
3.3 Findings on the Best–Worst Scaling experiment
3.3.1 Background The Sample
The data used in this report were collected from across the GMID from later 2012 till January 2013.
The main survey was followed by press releases to stimulate additional responses and direct encouragement from Water Service Committee members was also offered. The help line was particularly active with numerous farmers choosing to engage in lengthy discussions about elements of the survey.
The response rate to the survey was approximately 14 per cent. Of the 274 survey responses received, 27 per cent were incomplete and therefore excluded from the sample. The final data set consisted of 199 respondents generating 6368 choices on which to formulate empirical models.
The characteristics of the sample are summarised in Table 3.2.
Table 3.2 Socio-demographics of the survey respondents Male 82% Median age 55 to 64 years (32%) Obtained a tertiary degree or higher degree 22% Median income before tax per annum Greater than $100,000 (38%) Median profit before tax per annum Less than -$50,000 (40%) High reliability water shares (ML) Less than 100 (41%) Low reliability water shares (ML) Less than 100 (56%) Connected to the backbone 57% District: Central Goulburn 38% Loddon Valley 5% Murray Valley 14% Rochester-Campaspe 13% Shepparton 10% Torrumbary 20% Coding of variables
The qualitative nature of some of the attributes means that the potential of nonlinearity in the marginal utilities between levels needs to be contemplated. Generally, such nonlinear relationships are represented using one of two data structures, namely dummy coding and effects coding. Dummy coding employs a series of 0s and 1s to relate each attribute level of the original variable to the newly created columns. In this case, all of the attributes were dummy coded. Table 3.3 demonstrates the dummy coding for the delivery share attribute used in the current experiment. Table 3. 3 Example dummy coding Delivery share attribute levels
Original code Dummy code Level 1 Level 2
Level 1 0 1 0
Level 2 1 0 1

30 Leading gifted horses to water
3.3.2 Best–Worst Scaling: multinomial logit model In this report, we discuss the results of a multinomial logit model. The model will allow us to directly compare respondents’ preferences for the variables included in the Best–Worst Scaling experiment. Essentially, the model captures the effect of the attribute and the effect of the attribute levels on respondents’ preferences.
To capture the effect of the attribute levels, the attribute levels were included as variables in the multinomial logit model.
The dummy coding used here differs somewhat to that normally applied elsewhere. This is because of the way the survey questions were asked. Typically, dummy variables require one level of each attribute to be coded as all zeros, and this level represents for that attribute or variable ‘the base level’. The level that is coded 1 is then interpreted as being relative to the base level of that attribute. Here, only one base level is constructed for all attributes. As such, the model results are interpreted as being relative to the base level of this attribute, rather than each attribute having its own reference or base level. More specifically, dummy variables were established for 𝑘 − 1 attributes. In this case, as there were eight attributes in the Best–Worst experiment, seven dummy variables were created. This is because each choice task was designed with four of the eight attributes, thus the dummy variables reflect the presence or absence of an attribute. In this instance, there was no dummy variable created for the break-down of charges attribute in order to create a base attribute.
The utility structure used in the current study is shown as Equations (a-d). 𝑈(𝑏𝑤1) = 𝛽𝑥𝐷𝑏𝑤1 + 𝛽𝑥𝑏𝑤1 (a) 𝑈(𝑏𝑤2) = 𝛽𝑥𝐷𝑏𝑤2 + 𝛽𝑥𝑏𝑤2 (b) 𝑈(𝑏𝑤3) = 𝛽𝑥𝐷𝑏𝑤3 + 𝛽𝑥𝑏𝑤3 (c) 𝑈(𝑏𝑤4) = 𝛽𝑥𝐷𝑏𝑤4 + 𝛽𝑥𝑏𝑤4 (d) where 𝛽𝑥𝐷𝑏𝑤𝑗 are the parameters associated with the dummy variables and 𝛽𝑥𝑏𝑤𝑗 are the parameters associated with the attribute levels.
Table 3.4 presents the results for the multinomial logit model estimated.

Leading gifted horses to water 31
Table 3. 4 Multinomial logit model results Parameters Standard
errors
Service Point Fees (D) -0.470** 0.196
Service Point Fees2 -0.826*** 0.193
Pricing Strategy (D) 0.064 0.171
Pricing Strategy2 -0.644*** 0.162
Delivery Share (D) -0.033 0.169
Delivery Share2 -0.963*** 0.185
Control (D) -0.044 0.172
Control2 -0.933*** 0.206
Control3 -0.098 0.210
Casual Use Fee (D) -0.146 0.174
Casual Use Fee2 -0.104 0.173
Termination Fee (D) -1.217*** 0.155
Termination Fee2 1.338*** 0.161
Payment Instalment Options (D) 0.996*** 0.177
Payment Instalment Options2 -1.048*** 0.177
Break-Down of Charges2 0.939*** 0.193
Model statistics
Log-likelihood -1994.04
Pseudo-R2 (ρ2) 0.096
No. of Observations 1592
No. of Parameters 16
Chi-square 212.94 *** Significant at the 1 per cent level ** Significant at the 5 per cent level (D) Indicates the dummy variables created for 7 attributes
The pseudo-R2 is one way to determine the model fit of the data. In this case, the model explains approximately 25 per cent of the variation in the data. Seemingly low pseudo-R2 is a common feature of this type of approach and a result of 0.1 is acceptable for the initial multinomial logit approach. Further research can usually adjust the model fit upwards by exploring taste heterogeneity and by interacting the demographic variables with the attributes. As we noted earlier, for the purposes of adjudging the sequencing of tariff reform and those elements which will result in least resistance the multinomial logit model is adequate. Encouragingly, the analysis of the actual and predicted choices shows that the model correctly predicted the actual choice outcome for 32 per cent of cases. This is better than 25 per cent, which you would expect if it were just pure chance of being picked up.
The model has dummy variables and variables of the attribute level that are statistically significant at the 5 per cent level or better. This indicates that there are significant attribute effects and attribute level effects on respondents’ preferences. The model reveals respondents’ most and least probable outcome.

32 Leading gifted horses to water
The Termination Fee2 variable is positive and significant at the 1 per cent level with a coefficient of 1.338, which indicates that this is the variable that respondents are most likely to agree with i.e. most likely to select as the ‘best’ option. More specifically, this option was defined as reducing the termination fee from 10 to eight times the cost of each delivery share. Moreover, because the variables are measured on the same metric we can interpret them directly relative to each other.
In this model, the parameters are relative to a level 1 of the Break-Down of Charges attribute. Thus, if we normalise the parameters between 0 and 1, we can develop an index to compare the probable outcomes (i.e. list most to least preferred structure).
Table 3.5 reports the parameters that have been normalised from 0 to 1, where parameters that are not statistically significant are constrained to 0. Table 3. 5 Normalised parameters (0-1): betas constrained to zero
Parameters Normalised (0-1)
Service Point Fees2 -1.296 0
Termination Fee1 -1.217 0.035
Delivery Share2 -0.996 0.131
Control2 -0.977 0.139
Pricing Strategy2 -0.581 0.312
Service Point Fees1 -0.470 0.360
Payment Instalment Options2 -0.05231 0.542704
Pricing Strategy1 0 0.565529
Delivery Share1 0 0.565529
Control1 0 0.565529
Control3 0 0.565529
Casual Use Fee1 0 0.565529
Casual Use Fee2 0 0.565529
Break-Down of Charges1 0 0.565529
Termination Fee2 0.121 0.618526
Break-Down of Charges2 0.939 0.975332
Payment Instalment Options1 0.995783 1
As highlighted earlier, the base attribute in this instance is the Break-Down of Charges attribute. Accordingly, the normalised parameters are relative to level 1 for this attribute. This attribute and level were defined as ‘keep the existing break-down of charges that appear on your bill’.
The attribute levels that have normalised parameters equal to zero are all equally preferred to level 1 of the specified ‘Break-Down of Charges’ attribute, as both have a marginal utility of zero. Note that the parameters are normalised, so a utility of zero does not mean indifferent. These variables include Pricing Strategy1, Delivery Share1, Control1, Control3, Casual Use Fee1, and Casual Use Fee2.

Leading gifted horses to water 33
The variables that have normalised parameters less than the Break-Down of Charges1 variable (0.565529) are less preferred than this variable. These variables include Service Point Fees2, Termination Fee1, Delivery Share2, Control2, Pricing Strategy2, and Service Point Fees1.
The least preferred tariff structure options identified by respondents are listed below, in order from the most egregious to those less egregious:
1. Increase the service point charge from $259 to $1000/service point per year; and lower the infrastructure access fee by reducing the cost of each delivery share by $600.
2. Keep the termination fee at 10 times the cost of each delivery share. 3. Move to 100% fixed charges (currently 90% fixed costs and 10% variable
costs). 4. Move to a single charge for delivery share (ML/day) across all irrigation
districts. 5. Leave service point charge at a low fee of $250/service point per year; and
a high infrastructure access fee.
The variables that have normalised parameters greater than the ‘Break-Down of Charges1’ variable (0.565529) are more preferred than this variable. These variables include Termination Fee2, Break-Down of Charges2, and Payment Instalment Options1.
The preferred tariff structure options selected by respondents in order of most preferred are:
1. Reduce the termination fee from 10 to 8 times the cost of each delivery share.
2. Reduce the number of charges to simplify the bill. 3. Increase the number of payment instalment options that are available e.g.
the option to pay once a month over 12 months. Given that all of the variables in the model are dummy coded, they are all on the same data scale so can be directly compared. The normalised parameters can be graphed to create an index to illustrate the most and least probable outcomes. These are summarised in Figure 3.1.

34 Leading gifted horses to water
Figure 3. 1 Index of most to least preferred probable outcomes
Figure 3.1 provides an index that illustrates the most to least preferred probable outcomes, where the most probable outcome has the highest value and the least probable the lowest value. For instance, the most favourable option was Payment Instalment Options1, followed by Breakdown of Charges2, and Termination Fee2. Alternatively, the least preferred option was Service Point Fees2. The implications of these results in the context of water availability and climate change are addressed in the following section.

Leading gifted horses to water 35
4. DISCUSSION
4.1 Research lessons The attempt to apply the Choice Modelling technique in this project offers salient lessons for practitioners in this field and for those who increasingly rely on techniques like Choice Modelling to provide insights into customer preferences. This is particularly important because economic regulators, such as the ESC, have shown a growing enthusiasm to use the results from choice experiments when assessing the merits of proposed tariff adjustments by water utilities. Choice Modelling can deliver useful information about tariffs and the services that relate to them. And when customers are dealing with monopoly suppliers it is useful for regulators to have an understanding of underlying demand and customers’ preferences. However, it is important to also understand that the information generated from any choice experiment is context specific. In the case of this project the marked change in the context of the experiment suggested that the resulting data would be of little use in answering the policy question at hand. Arguably, it is equally important for the users of information generated by ‘successful’ Choice Models to also understand the context within which the data were generated before reaching any policy conclusions. The decision to use Best–Worst Scaling as a substitute for Choice Modelling in this project represents a significant departure from the techniques used by regulatory agencies to explore customer preferences. The statistical soundness of the empirical models reported above suggests that the Best–Worst Scaling approach has much to offer. However, the inability of Best–Worst Scaling to assign a monetary value to marginal changes in attributes also suggests that there may be some reluctance on the part of utilities to fully explore Best–Worst Scaling its usefulness as part of the price determination process. Given that CM results are so heavily reliance on contextual factors we would urge utilities and regulators to consider the full suite of research techniques on offer in this domain and give acknowledgement to the limitations and benefits that attend each approach. In simple terms, the inability to assign a marginal dollar value using Best–Worst Scaling should not be used as an argument for excluding this method from the processes already established to validate tariff reform.
4.1.1 Important lessons from the Best–Worst Scaling results The results for the Best–Worst Scaling experiment showed several changes that would be strongly supported by farmers. First, a simplification of the tariff so that it communicated adequate information about water use, service and the underlying relationship to cost and water availability would be well regarded. Whilst this was supported on theoretical grounds in the earlier work by Frontier Economics (2008), the empirical data collected as part of this project arguably offers a more compelling argument for change. On the one hand, regulators have been keen to advocate that tariffs need to explicitly detail the basis of various charges. On the other hand, this detail comes at a cost to those who must interpret complex water bills. The data collected by this project suggests that adjustments on favour of a simplified and clear tariff are long overdue.

36 Leading gifted horses to water
Second, there was strong support from the modelled data for an option to use multiple payment periods. This goes beyond the findings of Frontier Economics (2008) and emphasises the importance of understanding the synergies between revenue management on the part of the water supply corporation and cash flow of farm businesses that access water. The strong support for this option amongst farmers may also highlight the extent to which the water suppliers’ approach to revenue collection has not kept pace with revenue collection processes adopted by other suppliers of farm inputs. Third, farmers were keen to see a reduction in the termination fees faced by irrigators. These findings have implications beyond the water supply corporation involved in this project. Governments that are involved in gifting assets have been keen to promote this policy approach as a panacea for communal irrigation. Moreover, both state and federal governments have expressed a preference to gift assets and impose limits on the repurchase of water rights by government. The support of farmers for refurbished and gifted infrastructure has often been presumed in the public advocacy of this approach. However, clearly farmers are reluctant to be locked into infrastructure choices of this form, as evidenced by their desire to see a reduction in termination fees. This raises serious questions about the efficacy of a policy approach that claims to be supporting irrigation communities in the long run when there is evidence that it is counter to the motivations of individual irrigators. These findings are also particularly important in the context of adaptation. In the case of the communicability attribute, it should be self-evident that a charge that is understandable will help promote adjustment, provided that the relationship to resource availability and cost is sound. Given the keen oversight of the Essential Services Commission we have some grounds for feeling optimistic that this latter condition will be met. The capacity to have multiple payments is also important from an adaptation perspective since this allows farming enterprises to better manage cash flow during periods of change. And in the case of the support for reduced termination charges there is a clear link between changes on this front and the scope for irrigation enterprises to scale down or exit industries completely should water become increasingly scarce or supplies less reliable over the longer term. Importantly, these findings have already been considered by the water supply corporation involved in this study. In February 2013 the water corporation announced plans to overhaul its tariff structure, including actions to simplify pricing and facilitate staged payments20. The arrangements for termination charges are also being reviewed and adjustments on this front would be most welcome in the context of harmonising policy measures. The project also sheds light on the potential for sending mixed messages about adaptation when water buy-back is undertaken simultaneously with infrastructure upgrades. This adds weight to the call for adjusting tariffs to at least provide some incentives for adaptation behaviour and the requirement to limit the perception of being penalised for opting to reduce the extent of irrigation or leave the industry. Whilst we acknowledge that tariff reform and clearer price signals are only one component of 20 Details of these adjustments are available at http://www.g-mwater.com.au/news/media-eleases/2013_media_releases/mrgoulburn-murraywaterannouncesfiveyearblueprint.html

Leading gifted horses to water 37
improving the adaptation by irrigation farmers, we recommend that any future gifting of irrigation infrastructure should be attended by a requirement on the part of irrigation companies to simultaneously reform tariffs. Material reductions in termination charges should be part of these reforms to ensure that mixed messages do not unduly slow farmer adaptation.
4.2 Communication with and uptake by stakeholders It was noted earlier that key stakeholders have been engaged with this project via the Project Advisory Group since inception. In addition, the researchers have forged strong relationships with key personnel within G-MW and with farmer groups. These linkages have been critical to the development of the project and are expected to facilitate rapid uptake of the work beyond the measures already adopted. Section 2 provided details of the extent of engagement with stakeholders. In addition, it is worth noting that the survey instrument itself provided an additional basis for developing communication between the research community and end-users. In sum, whilst the delays experienced proved problematic on some fronts, the research team is buoyed by the prospect of rapid uptake of the work stemming from the numerous iterations that have defined this project. The project has generated several publishable outputs to date and these have been used in parts of this report. Other published material is under development, especially those elements that further explore the Best–Worst Scaling data. Extant publications include: Pawsey, N. and Crase, L. “The mystique of water pricing and accounting” (accepted for publication in Economic Papers) Cooper, B., Crase, L. and Pawsey, N. “Best practice pricing principles vs. the politics of water pricing” presented at the WIT conference, Adelaide, November 2012 (presently under review for Journal of Agricultural Water Management) Crase, L., Pawsey, N. and O’Keefe, S. “Gifted assets: A note on contradictions in Australia water policy” presented at the NCCARF Water Markets Workshop, Canberra, August 2012 (now accepted for publication in Economic Papers). Whilst this body of work makes some progress to delivering answers to the research questions, the empirical work that buttresses a substantial part of the project has already been taken up by the water supply corporation.

38 Leading gifted horses to water
5. GAPS AND FUTURE RESEARCH DIRECTIONS
In many respects the project represents the first endeavour of this type. A relatively novel empirical technique has been deployed to analyse what prima facie might be regarded as a modest influencer over farmer behaviour. However, this has enabled us to better understand the immediate preferences of water users and how accommodating those might assist adaptation. The data now assembled supports the view that water tariffs are a prominent feature of the decision making landscape for irrigators and even modest adjustments stand to bring significant changes to the flexibility and adaptive capacity of actors. However, greater attention and research is required on additional fronts and some of these are detailed below.
5.1 Expanding our understanding of heterogeneity To date the Best-Wost Scaling data have been modelled using a standard multinomial logit configuration. This has the advantage of quickly verifying the stability of the underlying model and generating useful and practical information, like the relative ordering of attributes that have the potential to be changed by the water supply corporation. It is now also possible to use this empirical data to advocate for tariffs that are more conducive to adaptation, for instance by arguing for reduced termination fees. However, more sophisticated modelling techniques are also on offer to interrogate these data. The development of nested and latent class models would be an obvious refinement worth pursuing. The overall structure of these models is often driven by trends within the data itself but we propose further work with strong engagement with the executive team at G-MW and farmer groups. More specifically, we envisage using the networks established by this project to shape additional pertinent questions that can be answered by these data. Accordingly, we expect the effort to develop models that can account for heterogeneity will not only be of academic interest but also answer ongoing questions about the motivations for accepting (or rejecting) changes.
5.2 Financial impacts Some of the financial impacts flowing from altered tariffs can be inferred from the input of the water supply company involved in this project and the farmer responses to the survey instrument. An alternative approach to understanding farmer and supply corporation impacts involves using economic modelling techniques. These techniques aim to predict the longer term changes that might arise if tariffs are modified in different ways. This can be done using a variety of techniques, such as linear programming models or simulation models, especially if uncertainty around particular variables is problematic. The results can then help direct researchers towards those areas of greatest interest to resolving some of these uncertainties.
5.3 Regulatory reform The institutional review that formed an early phase in this project pointed to several concerns about the current regulations that influence water prices. First, concerns were expressed about the appropriateness of the LRMC (building block) approach to pricing and its capacity to deal with variable water supplies. Earlier in the report we noted that tackling this issue was beyond the scope of a project of this form and the research team is aware of some developments within the water sector in response to the underlying weaknesses in the LRMC approach. Nonetheless, we contend that much more needs to be done and a greater convergence between the disciplines of accounting and economics in this instance would assist.

Leading gifted horses to water 39
5.4 Policy reform The data assembled from the project show that farmers hold a strong preference for reducing the quantum of termination fees. Clearly, this would encourage greater adaptation by some, especially those downsizing irrigation. We have further noted that the gifting of assets may well be adding to the financial burdens of water supply companies, albeit providing a means of accruing lower political costs as environmental water is secured. One of the key observations from this project has been that the various policy approaches of buying back water entitlements and providing gifted infrastructure need not work against each other. Rather, the process of gifting assets could provide an opportunity to encourage water suppliers to lower termination charges. The mechanism of bringing about these conditional changes requires further testing and analysis.
5.5 Climate change and water reform in the Murray–Darling Basin
This research was undertaken against a vibrant and changing policy environment. The Murray–Darling Basin Authority finalised elements of the Murray–Darling Basin Plan and this was then passed by Parliament. The Plan sets the overarching framework for allocating water between consumptive users and environmental claimants. Nonetheless, there remains much more detailed work to follow. Important elements pertinent to the current project include improving our understanding of how to efficiently deliver the best environmental outcomes from the existing water resources that make up what has become known as the environmental reserve. Discussions are presently underway between state and federal governments and within state agencies about the potential for works and measures (i.e. infrastructure) to form part of optimising environmental water. Similarly, there is growing interest in the role that farmer groups, like those in GMID, can play in delivering the desired environmental outcomes. In the context of optimising water for environmental ends there is considerable scope for modifying the timing with which water is delivered. Additional research in this domain, especially as it related to changing agricultural demands, clearly overlaps with how projects like NVIRP operate and how incentives can be changed to modify their operation.
It is important to note that the Murray–Darling Basin Plan is primarily premised on existing water use and current water availability21. We have already observed that the predictions from climate change modelling suggest that water availability will change within the Basin, with northern Victoria likely to experience increased scarcity. Nonetheless, such models are also highly variable and subject to uncertainty. The challenge for researchers remains to identify and promote policies that will not close off options for future generations of farmers (and taxpayers) thus fostering greater adaptation capacity.
21 Whilst undoubtedly relevant, our contention is that the MDB Plan was not a logical starting point for this project. Rather we were primarily concerned with longer term adaptation to climate, as opposed to changes brought on by meeting existing environmental claims.

40 Leading gifted horses to water
APPENDIX A: THEORETICAL ELEMENTS OF CHOICE MODELLING, EXPLANATION OF ORIGINAL CHOICE ATTRIBUTES AND DESIGN CONSIDERATIONS
Theoretical considerations in choice modelling Choice Modelling can be traced back to the seminal work of Louviere and Hensher (1982) and Louviere and Woodworth (1983). However, Carroll and Green (1995) contend that choice modelling itself simply represents an extension of conjoint analysis, which stems largely from the theoretical contributions of Luce and Tuckey (1964), Kruskal (1965), Carroll (1973) and Roskam (1968). Notably, this relationship is contested within the literature, with Louviere et al. (2000) and Wassenaar, Chen, Chang and Sudjianto (2003) highlighting the distinctive nature of discrete choice modelling. The Choice Modelling conjoint methodology differs from the other conjoint techniques in that it must be estimated at the aggregate rather than the individual level. Choice Model analysis also allows for interaction effects between attributes, unlike traditional and adaptive conjoint methods. For example, consumers who have a preference for a particular brand, but only at a particular price may be modelled using this technique. One of the strengths of choice modelling is that it forces respondents to consider substitution possibilities. Hence, the method is useful not only as a value estimation technique, but also for assessing policy options. By representing respondents with a description of alternative policy options and seeking an indication of the single preferred option, policy preferences can be elicited. For example, in a study of water supply policy alternatives, Blamey, Gordon and Chapman (1999) illustrates how choice models can be used to provide both value estimates corresponding to policy changes involving one or more attributes and community rankings of multiple policy options. Choice Modelling also has the advantage of being able to examine situations in terms of attributes and levels that do not exist in currently available options. In addition, Wills (2006, p.189) suggests that choice modelling studies “can alleviate the incentives for strategic distortions of valuations, and reduce the difficulties of understanding individual survey questions”. Theoretical basis of choice modelling The behavioural basis of choice modelling is random utility theory developed by Thurstone (1927) and extended by McFadden (1974). Random utility theory assumes that the probability of an individual choosing a particular good from an array of goods is dependent on the utility of the good relative to the utilities of the other alternatives. It suggests that consumers seek to maximise utility when they make choices. According to random utility theory, the utility of a good is made up of an observable component that is a function of a vector of attributes and individual characteristics, along with an unobservable error component. Thus, random utility theory-based choice models allow inferences to be made about preferences for choice attributes, based on stated preferences. Since random utility theory concedes that there is an unobservable component to utility, assumptions must be made about this random component. Most commonly, an independently and identically distributed error term is assumed, implying that a multinomial logit (MNL) model can be employed to analyse the observable component of utility. Following Morrison et al. (1996), a typical MNL model with the probability of choosing a given option, i, is given by:

Leading gifted horses to water 41
[X.1]
Here V represents the observable component of utility for a particular alternative, and j takes values from one to n. The scale parameter, λ, is inversely related to the variance and is arbitrarily equated to unity in most cases. A conditional indirect utility function of the form shown in equation [X.2] can be generated from the MNL model: Vij = ASCj + β1X1 + β2X2 + ... + βkXk + γ1(S1*ASCj) + ...+ γp(Sp*ASCj) [X.2] (Blamey, Bennett and Morrison 1999) Here β1 to βk is the vector of coefficients attached to the vector of attributes (X) describing the product. The socio-economic attributes of individual S are included by interaction with the alternative-specific constant (ASC). The ASCj (i.e. the ASC for the jth alternative) is usually derived by estimating a set of j-1 constants as per conditional logit models (Blamey, Bennett and Morrison 1999). Constants either take on a value for alternative j or are assigned a value of zero. Accordingly, the ASC captures the mean effect of unobservable factors in the error term and results in a zero mean for unobservable utility. Moreover, the average probability of each alternative is equated to the proportion of respondents choosing an alternative (Blamey, Bennett and Morrison 1999). Using this model, it is possible to include psychographic and demographic variables such as the respondent’s level of income or their attitude towards climate change. It is not feasible to include these types of variables directly into utility functions as they are invariant across the alternatives in a choice set (Morrison, Bennett, and Blamey 1998). Alternatively, they must be estimated interactively, either with the product attributes or the ASC.22 The parameters from the choice model can also be used to estimate the welfare change in the form of compensating surplus. This can be achieved using the following method: W = [ln Σ jεCi evi0 - ln Σ jεCi evi1 ] / μ1 (Hanemann 1984). [X.3] Here μ1 is the marginal utility of income, vi0 and vi1 describe utility before and after the change and Ci is the policy relevant choice set for respondent I. Essentially, if the choice set contains a single before and after option the estimate of welfare change reduces to: W = [vi0 - vi1 ] / μ1 (Blamey, Bennett and Morrison 1999). [X.4] Put differently, the welfare change associated with a single attribute can be estimated from the ratio of marginal utility for the attribute in question and the price attribute (Hensher and Johnson 1981).
22 The latter is achieved by employing equation [X.2].
∑=
)exp()exp(
i
ii V
VPλ
λ

42 Leading gifted horses to water
Estimation considerations It was observed earlier that choice experiments are founded on random utility theory where utility comprises both observable and unobservable components (McFadden 1974). By adopting a Gumbell extreme value error term, the choice probabilities correspond to the convenient closed-form MNL model (Rolfe and Bennett 2002). However, one of the consequences of this assumption is the independence from irrelevant alternative (IIA) property, which requires that the ratio of choice probabilities for any two alternatives is independent from the observable utility of other alternatives. Violations of the IIA property assumption can be detected using a test developed by Hausman and McFadden (1984). Alternatives are omitted from the choice sets to test for significant changes in parameter estimates. In reality, violations of this property are common and occur for many reasons, not the least of which is the existence of heterogeneous preferences. Louviere et al. (2000, p.138) observe that although the majority of studies do not progress beyond the MNL model, non-trivial research efforts have centred upon the relaxation of this restrictive assumption in a manner that is “…behaviourally enriching, computationally tractable and practical”. In practice, violations might arise where respondents have not made consistent choices because they found it difficult to frame their choices (Rolfe and Bennett 2002). Rolfe and Bennett (2002) also observe that there are a number of other reasons why violations might occur. Whilst Blamey, Rolfe, Bennett and Morrison (1997) offer options for dealing with the problem of IIA violations, the assumption itself makes it difficult to predict between close alternatives (Hair et al. 1998). Accordingly, a number of more advanced models, such as the nested logit (NL) or mixed logit, which relax the IIA assumption, have recently gathered popularity in the literature (see, for example, Hensher et al. 2005; Train 2003). Explanation of original choice attributes Cost of modernising the tariff A monetary attribute, which is required to estimate welfare changes, was included in the choice experiment. The levels of the monetary attribute used and the payment vehicle employed were determined as a result of the initial focus groups with an expectation that minor refinement would be required after the piloting phase (see, for example, Birol, Karousakis and Koundouri 2006). It has been noted that ‘payment vehicle bias’ is a potential flaw of all stated preference methods, and of Choice Modelling in particular (see, for instance, Morrison et al. 1996). Bennett (1999) has emphasised that the payment vehicle must be compulsory and have broad coverage to be relevant to all respondents, as used in Rolfe, Bennett and Blamey (2000). The rationale for employing the compulsory payment vehicle is that the use of a donation as a payment vehicle promotes strategic responses (Bennett 1999). Therefore, it is suggested that respondents must be convinced that they will be required to actually pay the amount they agree when choosing an option from choice sets. In this case, the participants’ water bill was specified as the payment vehicle, which is both compulsory and relevant to all respondents. More specifically, the payment vehicle was a one-off payment on customers’ fixed charges water bill. Six levels were included for piloting the COST attribute, with the lower bound level being $500 and the upper bound $40,000. The status quo level was included as $0 i.e. respondents do not pay an additional amount on their water bill to maintain the status quo billing regime. Identifying these levels proved challenging as participants were reluctant to reveal their willingness to pay to modify the tariff during focus sessions and the quantum of water bills varied enormously between users. In the context of the latter, a $500 payment could appear trivial to some water users and exorbitant to

Leading gifted horses to water 43
others, at least relative to the total value of charges. Nonetheless, there was general agreement in focus groups that a positive willingness to pay to achieve tariff reform was plausible and the lower bound was sufficiently enticing to elicit a response. In light of some of the early concerns, a dissonance minimising format was included at the conclusion of the choice sets (Blamey, Bennett and Morrison 1999; Loomis, Traynor and Brown 1999). The dissonance minimising format involved adding response categories that permitted respondents to express support for a modernised tariff/billing structure without having to vote in favour of increased expenditure on their part. In this case, these extra response categories were adapted from Blamey, Bennett and Morrison (1999) and included statements such as the following: • ‘I think a modernised tariff is important, but cannot afford to pay anything for it’; • ‘I think a modernised tariff is important, but the government should pay for it’; • ‘I think a modernised tariff is important, but Goulburn–Murray Water should pay
for it’. By decoupling the choice of whether or not to support the modernisation of the water tariff from the commitment of dollars, this questioning format attempts to reduce dissonance and hypothetical bias (Morrison and Brown 2007). Risk and Control Many of the focus group participants considered the ratio of fixed costs and variable costs to be an important element of the tariff structure. Therefore, this was identified as an attribute and labelled ‘risk and control’. In terms of risk, the ratio of fixed and variable charges, in part, reflects the extent to which the supplier or water users ultimately carry the risk of water supply shortages. For instance, a higher ratio of fixed charges implies that G-MW is guaranteed a high portion of their revenue regardless of water usage or demand. Alternatively, a higher variable charge equates to the supplier carrying an increased risk of water shortages. In terms of control, a higher variable charge relative to fixed charges gives the customer increased control over the total value of their water bill, at least to the extent that they can adjust water use. The status quo across all districts is approximately 90 per cent fixed charges and 10 per cent variable charges. The participants within the focus groups expressed differing opinions regarding the ratio of fixed and variable charges. One participant noted that: “I would like to see G-MW carry more of the risk” Alternatively, a participant stated that: “The current ratio gives some predictability when it comes to the bill” Three levels were employed to describe this attribute. The levels were expressed in terms of a ratio i.e. percentage of fixed and variable charges. These levels were chosen such that respondents may reasonably believe them to be feasible. The lower bound ratio was 70 per cent fixed costs: 30 per cent variable costs and the upper bound 100 per cent fixed costs. Pricing Strategy Many respondents expressed concerns about moving to a uniform pricing strategy across all six gravity irrigation districts, for instance one respondent claimed: “I fear that all costs will be socialised — and that’s not fair given the history of how this has worked”. The current pricing strategy differentiates costs across districts. For instance, the delivery share charge ranges from $2,700 in the Rochester district to $4,700 in the

44 Leading gifted horses to water
Shepparton district. These price differences are largely due to various historical anomalies (McDonald et al. 1992) and take little account of the upgrades from gifted infrastructure. As one would expect, this view was not unanimously shared. A pricing strategy attribute was included and expressed in two levels, namely a uniform pricing strategy and a differentiated pricing strategy that corresponded with the status quo. Complexity Interestingly, a prominent comment mentioned in all focus groups was the complexity of the water bill. More specifically, the complexity was a combination of concern about the limited understanding of the charges and the extensive break-down of the charges presented on the water bills. One participant claimed: “I need a degree to work out the bill”. The literature suggests that improving understandability can be achieved by either education or simplification (Australian Accounting Standards 2010). In this case, there appeared to be a need to increase the clarity with which charges are described to achieve transparency, albeit somewhat at odds with calls for increased simplicity in the tariff design. In the context of adaptation to climate change, understanding of price signals is a prerequisite to rational adaptation — if end-users cannot understand the bill, its relationship to resource availability (short and long term) and its relationship to their behaviour they are unlikely to make sound adaptation choices. Therefore, complexity was included as an attribute and described in terms of the option to receive an explanation of the break-down of charges as well as a summary page of the water bill. Two levels were used to represent the attribute; Yes and No. Payment instalments Numerous participants identified the need for an increase in the payment instalment options offered to G-MW’s customers. Currently, customers have an option to pay upfront when they receive their water bill or to pay in four equal instalments spread over five months. Respondents recognised the scope for different and more flexible payment options, similar to that offered by other utility providers such as those offered by telephone companies. Three levels were used to express the attribute including the option to pay once a month over a twelve month period. Design considerations In designing the choice sets, the researcher faces a number of related and, in some cases, interdependent challenges. Namely, attributes and levels must be specified; the ‘product’ or hypothetical experience must be described; and the status quo must either be overtly explained to participants, or alternatively, the survey must be designed so this information can be gleaned from their responses (Hair et al. 1998). There has been a shift in the literature away from orthogonal design towards more efficient designs (Burgess and Street 2005; Kanninen 2002; Sandor and Wedel 2001). From a statistical perspective, experimental designs governing stated preference tasks should impart the maximum amount of information about the parameters of the attributes relevant to each specific choice task (Sandor and Wedel 2001). Concurrent with a move within the literature toward the use of efficient (and often non-orthogonal) designs, this study initially employed a D-efficient design, where uninformative priors were used to develop the design for the pilot phase. It was planned to use the parameter estimates from the preliminary data collected in the pilot study as parameter priors for the development of an additional D-efficient design for the main survey (see, for instance, Hensher et al. 2005; Hensher and Greene 2003). In the

Leading gifted horses to water 45
case of the design for the pilot, each respondent evaluated 12 stated choice sets, where each choice set comprised three alternatives and the third alternative was always the status quo. Whilst the specified attributes were common across all options, the levels differed from one option to another (except for the status quo, of course). An efficient design considers explicitly the importance of the levels of the attributes and ensures that the alternatives in the choice sets provide more information about the trade-offs between the different attributes. Consequently, an efficient design minimises the sample size required to generate a robust Choice Model.

46 Leading gifted horses to water
APPENDIX B: SAMPLE BEST–WORST SCALING SURVEY INSTRUMENT
A SURVEY ON BILLING OPTIONS FOR IRRIGATORS

Leading gifted horses to water 47
A SURVEY ON BILLING OPTIONS FOR IRRIGATORS The purpose of this survey is to find out what you think about irrigation water bills. By answering this survey you will help water suppliers understand your opinion about the current water bill. The results will influence future billing options made available to rural water users in northern Victoria. Different irrigation districts in northern Victoria have different sources of water supply and different standard tariffs. These tariffs usually comprise a number of fixed and variable water charges. We want to know what type of tariff options you would prefer. Who should complete this survey? The person who makes most of the farm management decisions should complete this survey. If the decisions are made jointly, then the person whose birthday falls next should complete the survey. There are no right or wrong answers in this survey and your participation is voluntary. All surveys are anonymous and individual responses are strictly confidential. Results from this study may appear in scientific publications and will be available to participants on request. To view a copy of a typical water bill for customers in the gravity irrigation district go to: http://www.g-mwater.com.au/customer-services/pricingsimulator2011 This survey has four main parts (the last part is optional): Part A: Has some questions about you to help us check that we have a wide range of respondents in the survey. Part B: Has some questions to see what you know about current water charges. Part C: Presents different billing options and asks you to choose your MOST preferred and LEAST preferred. Part D: Is OPTIONAL and has questions about your opinions on a range of water-related topics. Please note there is a separate sheet enclosed that lists the definitions of the current water charges.

48 Leading gifted horses to water
PART A: QUESTIONS ABOUT YOU These questions will be used to tell us whether we have a reasonable cross-section of respondents in the survey.
1. Gender (Please tick one) Male Female
2. Age
(Please tick one) 18 to 24 yrs 25 to 44 yrs
45 to 54 yrs 55 to 64 yrs 65 yrs plus
3. Are you currently a member of a Water Service Committee? (Please tick one) Yes No
4. What is the highest level of education that you have completed? (Please tick one) Year 9 or below at Secondary Year 10 at Secondary Year 11 at Secondary Year 12 at Secondary Diploma or Trade Certificate
Tertiary degree or Higher Degree
5. Have you completed any formal training/courses in agriculture? (Please tick one) Yes No
6. How many years have you been farming (approximately)?
(Please write in space provided) _______years
7. How long have you worked on this farm? (Please tick one)
Less than 1 year 21 to 30 ye a rs 1 to 5 years 31 to 40 ye a rs 6 to 10 years 41 ye a rs or more 11 to 20 years

Leading gifted horses to water 49
8. What is your main source for irrigation water
(Please tick one or more) Gravity Irrigation area River diversion
Groundwater Other ____________
9. In which district is your farm located? (Please tick one or more) Broken Murra y Va lle y Bullarook Normanville Campaspe Ove ns Central Goulburn Upper Ovens Goulburn Lowe r Ove ns Katunga S he ppe rton Kinglake S pring Hill Loddon Torrumba rry East Loddon Tyntynde r West Loddon Tunga ma h Upper Loddon Woorine n Mid Loddon Roche s te r Loddon Valley Other______________
10. How long have you lived in this district? (Please tick one)
Less than 1 year 21 to 30 ye a rs 1 to 5 years 31 to 40 ye a rs 6 to 10 years 41 ye a rs or more 11 to 20 years
11. What are you currently farming? (Please tick one or more)
Dairy Fruits Beef Vegetables Sheep Grapes Nuts Othe r_________________
Grains (e.g. maize, wheat,
barley, oats, canola)

50 Leading gifted horses to water
12. What have you farmed in the past?
(Please tick one or more)
Dairy Fruits Beef Vegetables Sheep Grapes Nuts Othe r_________________
Grains (e.g. maize, wheat,
barley, oats, canola)
13. What proportion of household income comes from your farming activities?
(Please tick one) 100% 99% to 75% 74% to 50% 40% to 25% 24% to 0%
14. Do you have a succession plan for your farm(s)? (Please tick one) Yes No
15. How many years do you plan to continue farming?
(Please tick one) Less than 1 year 1-5 years 6-10 years More than 10 years
16. What is the approximate total land area of your property/properties (ha)?
(Please tick one) ______ha
17. What is your level of High Reliability Water Shares (ML)? (Please tick one)
Less than 100 700 to 899 100 to 299 900 to 1099

Leading gifted horses to water 51
300 to 499 1100 or more
500 to 699
18. What is your level of Low Reliability Water Shares (ML)? (Please tick one)
Less than 100 700 to 899 100 to 299 900 to 1099
300 to 499 1100 or more
500 to 699
19. How many service points do you currently have (D&S/Irrigation)? (Please tick one) 1 or 2
3 or 4 5 or 6 7 or more
20. How large is the drainage area that you are billed for (ha)? (Please tick one) Less than 40 ha 221 to 280 ha 41 to 100 ha 281 to 340 ha 101 to 160 ha 341 to 400 ha 161 to 220 ha 400 or more ha None
21. Have you sold temporary water allocations in the past? (Please tick one) Yes No
22. Have you bought temporary water allocations in the past?
(Please tick one) Yes No
23. Have you sold permanent water entitlements in the past?
(Please tick one) Yes No

52 Leading gifted horses to water
24. Have you bought permanent water entitlements in the past? (Please tick one) Yes No
25. Do you plan on trading temporary water in the future? (Please tick one) Yes No Not sure
26. Do you plan on trading permanent water in the future? (Please tick one) Yes No Not sure
27. Have any of the following limited your trade of permanent water? (Please tick one or more) Cap imposed on districts The on-going cost of delivery shares Concerns about the future of farming and communities None
28. Please rate the following statement by ticking the box that corresponds
with the strength of your views about the statement. Strongly
Disagree Disagree Neither
Agree Nor Disagree
Agree Strongly Agree
I feel informed about the irrigation infrastructure modernisation programs in northern Victoria
29. Has your farm(s) been connected to the backbone? Yes No In progress

Leading gifted horses to water 53
30. What do you see as the main benefits of infrastructure modernisation? (please tick one or more) Allow water to be used more efficiently Allow other farm inputs (like labour) to be used more efficiently Help diversify into other cropping or farming Increases the capital value of your farm Reduce costs Other, (please specify) _____________
31. What do you see as the main limits of infrastructure modernisation? (please tick one or more) Cause water to be used less efficiently Cause other farm inputs (like labour) to be used less efficiently Limit you in diversifying in other cropping or farming Decreases the capital value of your farm Increase costs Other, (please specify) _____________
32. What is the range of your annual total water charges? (please tick one) Less than $200 $25,001 - $35,000 $1001 - $5,000 $35,001 - $45,000 $5,001 - $15,000 $45,001 - $55,000 $15,001 - $25,000 $55,0001 plus
33. Do you feel you are given sufficient notice about the dates on which G-MW will issue your next water bills?
(Please tick one) Yes No
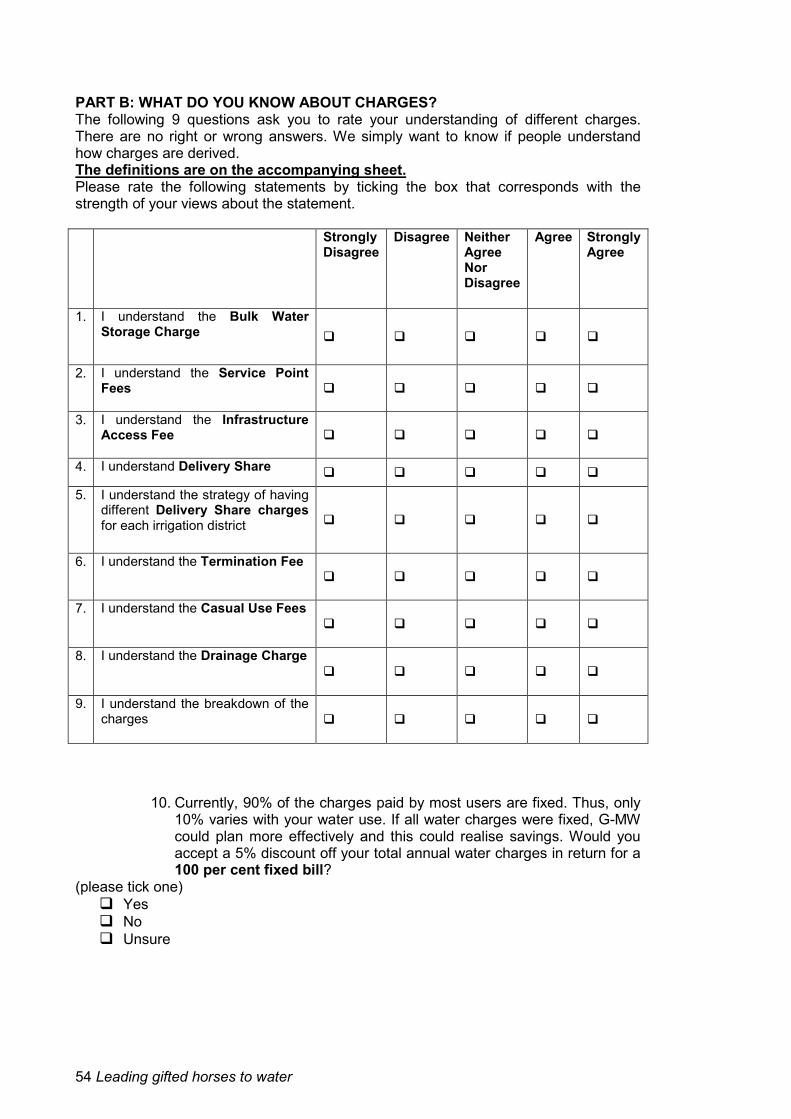
54 Leading gifted horses to water
PART B: WHAT DO YOU KNOW ABOUT CHARGES? The following 9 questions ask you to rate your understanding of different charges. There are no right or wrong answers. We simply want to know if people understand how charges are derived. The definitions are on the accompanying sheet. Please rate the following statements by ticking the box that corresponds with the strength of your views about the statement. Strongly
Disagree Disagree Neither
Agree Nor Disagree
Agree Strongly Agree
1. I understand the Bulk Water Storage Charge
2. I understand the Service Point Fees
3. I understand the Infrastructure Access Fee
4. I understand Delivery Share
5. I understand the strategy of having different Delivery Share charges for each irrigation district
6. I understand the Termination Fee
7. I understand the Casual Use Fees
8. I understand the Drainage Charge
9. I understand the breakdown of the charges
10. Currently, 90% of the charges paid by most users are fixed. Thus, only 10% varies with your water use. If all water charges were fixed, G-MW could plan more effectively and this could realise savings. Would you accept a 5% discount off your total annual water charges in return for a 100 per cent fixed bill?
(please tick one) Yes No Unsure

Leading gifted horses to water 55
PART C: WHAT DO YOU THINK? How to answer this section of the survey This section presents hypothetical billing options for irrigation water in your district. Each question presents you with four options and asks you to select your MOST PREFERED and LEAST PREFERED option. Each question will have different options for you to rate. Even though some of the options are hypothetical, your answers will provide information that is very important to improving the billing processes and tariff structures for rural water users in your district. Please consider the options carefully and make your choices as if they were real. There may be a number of things that affect your decision to select a different water bill options in your district. However, we want you to consider only the options in each question and imagine that all other factors do not change from the current situation. For simplicity, please refer to the separate definition sheet that explains the present charges. Example Answer: Below is an example of how to fill out the next 6 questions. Options Which option do you
LEAST prefer? (Select ONLY ONE)
Sets of options for you to consider
Which option do you MOST prefer? (Select ONLY ONE)
1 Reduce volume of Delivery Share from 270 ML per Delivery Share to 150 ML per Delivery Share
2 Move to 100% fixed charges (currently 90% fixed costs:10% variable costs)
3 Keep Casual Use Fees as they are. Typically, the fee is $80/ML.
4 Move to a Single charge for Delivery Share (ML/day) across all irrigation districts.
In the example above, the selection means a person is saying that out of the four options listed:
• the option they LEAST prefer is ‘Reduce volume of Delivery Share from 270 ML per Delivery Share to 150 ML per Delivery Share’
• the option they MOST prefer is ‘Keep Casual Use Fees as they are’ The following will present 4 questions, similar to the one above and ask you to choose your MOST preferred option and LEAST preferred option out of 4 possible options. It is important that you complete all of the following 4 questions.
Note: Only one box is ticked in each of these columns

56 Leading gifted horses to water
1. Although there may be other parts of the bill you would like to consider, for this question please ONLY consider the options below. Which of these billing options below do you MOST prefer and which option do you LEAST prefer?
Options Which option do you
LEAST prefer? (Select ONLY ONE)
Sets of options for you to consider
Which option do you MOST prefer? (Select ONLY ONE)
1 Reduce volume of Delivery Share from 270 ML per Delivery Share to 150 ML per Delivery Share.
2 Move to 100% fixed charges (currently 90% fixed costs:10% variable costs)
3 Keep Casual Use Fees as they are. Typically, the fee is $80/ML.
4 Keep the termination fee at 10 times the cost of each Delivery Share
If you are having trouble with this section, please feel free to ring Bethany for assistance on 02 60249842

Leading gifted horses to water 57
2. Although there may be other parts of the bill you would like to consider, for this question please ONLY consider the options below. Which of these billing options below do you MOST prefer and which option do you LEAST prefer?
Options Which option do you
LEAST prefer? (Select ONLY ONE)
Sets of options for you to consider
Which option do you MOST prefer? (Select ONLY ONE)
1
Leave service point charge at a low fee of $250/service point per year; and a high infrastructure access fee.
2 Reduce volume of Delivery Share from 270 ML per Delivery Share to 150 ML per Delivery Share.
3 Reduce the termination fee from 10 to 8 times the cost of each Delivery Share
4 Keep the existing breakdown of charges that appear on your bill

58 Leading gifted horses to water
3. Although there may be other parts of the bill you would like to consider, for this question please ONLY consider the options below. Which of these billing options below do you MOST prefer and which option do you LEAST prefer?
Options Which option do you
LEAST prefer? (Select ONLY ONE)
Sets of options for you to consider
Which option do you MOST prefer? (Select ONLY ONE)
1
Increase the service point charge from $250 to $1000/service point per year; and lower the infrastructure access fee by reducing the cost of each Delivery Share by $600
2
Move to 20% variable charges and 80% fixed charges (currently 90% fixed costs:10% variable costs)
3 Increase Casual Use Fees from $80/ML to $100/ML.
4 Reduce the number of charges to simplify the bill

Leading gifted horses to water 59
4. Although there may be other parts of the bill you would like to consider, for this question please ONLY consider the options below. Which of these billing options below do you MOST prefer and which option do you LEAST prefer?
Options Which option do you
LEAST prefer? (Select ONLY ONE)
Sets of options for you to consider
Which option do you MOST prefer? (Select ONLY ONE)
1 Keep current volume at 270 ML per Delivery Share
2 Move to 100% fixed charges (currently 90% fixed costs:10% variable costs)
3 Keep the existing payment instalment options (i.e. upfront or with 4 instalments over 5 months)
4 Reduce the number of charges to simplify the bill
5. Do you think the bill should stay as it is? Yes No
6. Do you think the current tariff structure should stay as it is? Yes No
7. Are there any other parts of the tariff or bill you would like to see improved that
were not covered in the options above? Yes No
If Yes, please specify:____________________________________________________________________________________________________________________________________
8. Are there any additional comments you would like to make about the options presented to you above?
_______________________________________________________________________________________________________________________________________________________________________________________________________________

60 Leading gifted horses to water
9. Thinking about the information and options presented in this part of the survey, please indicate how strongly you agree or disagree with the following two statements.
Strongly Disagree
Disagree Neither Agree Nor Disagree
Agree Strongly Agree
I understood the information in this section of the survey
I needed more information than was provided to answer the questions in this section
The following questions are very important and necessary to ask because studies suggest that income influences people’s choices
10. Please indicate the approximate profit from your on-farm activities before tax and per household:
Loss $120,001 to $160,000 $0 to $40,000 $160,001 to $200,000 $40,001 to $80,000 $200,001 to $240,000 $80,001 to $120,000 Over $240,000
11. Please indicate the approximate equity in the farm at the end of last financial year:
Greater than 90% (i.e. very little debt) 70% to 90% 50% to 69% Less than 50% Thank you for taking the time to complete this survey. Your opinions are very important to us. The following part is optional, but should take only a few minutes to complete.

Leading gifted horses to water 61
OPTIONAL PART PART D: WHAT IS YOUR OPINION? We know that people’s attitudes to a range of things is important so we want you to answer the following honestly.
1. The following questions relate to your thoughts about the environment. Please rate the following statements by ticking the box that corresponds with the strength of your views about the statement.
Strongly Disagree
Disagree Neither Agree Nor Disagree
Agree Strongly Agree
I find it hard to get too concerned about water issues
It makes me sad to see natural environments destroyed
I get concerned that there will not be enough water for future generations
It is important to preserve the environment
I’m opposed to programs to conserve resources
It seems to me that most water conservationists are negative and paranoid

62 Leading gifted horses to water
2. The following questions relate to the concept of ‘climate change’.
‘Climate change’ means that the climate system is continuing to warm, including warming oceans and melting snow and ice, both of which contribute to rising sea levels (Australian Government, DCCEE 2012).
Please rate the following statements by ticking the box that corresponds with the strength of your views about the statement.
Strongly Disagree
Disagree Neither Agree Nor Disagree
Agree Strongly Agree
I think that climate change will lead to water security problems in my region in the future
I consider myself a sceptic about climate change
I believe climate change will increase the uncertainty of rainfall patterns
I believe climate change will increase the uncertainty of water security
I believe climate change will increase the uncertainty of the intensity and frequency of extreme events such as droughts and floods

Leading gifted horses to water 63
3. The following questions relate to your thoughts about risk Please rate the following statements by ticking the box that corresponds with the strength of your views about the statement.
Strongly Disagree
Disagree Neither Agree Nor Disagree
Agree Strongly Agree
Betting a day’s income at the horse races
Investing 10% of your annual income in a moderate growth mutual fund
Betting a day’s income at a high stake poker game
Investing 5% of your annual income in a very speculative stock
Betting a day’s income on the outcome of a sporting event (e.g. baseball or football)
Investing 5% of your annual income in a conservative stock
Investing 10% of your annual income in government bonds (treasury bills)
Gambling a week’s income at a casino
Please use the space below to add any other comments ______________________________________________________________________________________________________________________________________________________________________________________________________________________________________________________ Thank you for taking the time to complete this survey.

64 Leading gifted horses to water
REFERENCES ABS (2010) Agriculture and industry statistics, Australian Bureau of Statistics, cat. No. 4610.0.55.008 released 29.11.2010. Akaah, I. (1991) Predictive performance of self-explicated, traditional conjoint, and hybrid conjoint models under alternative data collection modes. Journal of the Academy of Marketing Science. 19(4): 309-314. Auger, P., Devinney, T. M. and Louviere, J. J. (2007) Using Best–Worst Scaling Methodology to Investigate Consumer ethical Beliefs Across Countries. Journal of Business ethics, 70, pp. 299-326. Barnett, J. and O’Neill, J. (2010) Maladaptation, Global Environmental Change, 20, pp. 211-213. Bennett, J. (1999) Some fundamentals of environmental choice modeling. Choice Modelling Research Report No.11. Working Paper. School of Economics and Management. The University of New South Wales, Sydney. Birol, E., Karousakis, K. and Koundouri, P. (2006) Using economics methods to inform water resource management policies: a survey and critical appraisal of available methods and an application, science of the total environment [online] Available: www.ayuguila.com/documentos/comparacion/metodos/devaloracion.pdf [Accessed 27 September 2007]. Blamey, R., Bennett, J. and Morrison, M. (1999) Yea-saying in contingent valuation surveys. Land Economics. 75(1): 126-141. Blamey, R., Gordon, J. and Chapman, R. (1999) Choice modelling: assessing the environmental values of water supply options. Agricultural and Resource Economics. 43: 337-358. Blamey, R., Rolfe, J., Bennett, J. and Morrison, M. (1997) Environmental choice modelling: issues and qualitative insights. Working Paper. The University of New South Wales, Sydney. Buckley, P. J., Devinney, T. and Louviere, J. J. (2007) Do Managers Behave the Way Theory Suggests? A Choice Theoretic Examination of Foreign Direct Investment Location Decision Making, Journal of International Business, 38(7), pp. 1069-95. Burgess, L. and Street, D. (2005) Optimal designs for choice experiments with asymmetric attributes. Journal of Statistical Planning and Inference. 134(1): 288-301. Carroll, D. and Green, P. (1995) Psychometric methods in marketing research: Part 1 conjoint analysis. Journal of Marketing Research. 34(4): 385-391. Carroll, J. (1973) Models and algorithms for multidimensional scaling, conjoint measurement and related techniques, multiattribute decisions in marketing. Hinsdale: Dryden Press. Champ, P. (2003) Collecting survey data for nonmarket valuation. In A Primer on Nonmarket Valuation, ed. P. Champ, K. Boyle and T. Brown. Dordrecht: Kluwer Academic Publishers. Clarke, F. L. (1998) Deprival Value and Optimized Deprival Value in Australasian Public Sector Accounting: Unwarranted Drift and Contestable Serviceability', ABACUS, Vol. 34, pp. 8-17. Cohen, S. H. and Neira, L. (2003) Measuring preference for product benefits across countries: Overcoming scale usage bias with Maximum Difference Scaling. ESOMAR 2003 Latin America Conference Proceedings. Amsterdam: The Netherlands.

Leading gifted horses to water 65
Coltman, T., Devinney, T. and Keating, B. (2011) Best–Worst Scaling Approach to Predict Customer Choice for 3PL Services, Journal of Business Logistics, 32(2), pp. 139-153. Cooper, B., M. Burton and L. Crase (2011) Urban water restrictions: Attitudes and avoidance, Water Resources Research, Vol. 47, No 2, W12527. Cooper, B., J. Rose and L. Crase (2012) Does anybody like water restrictions? Some observations in Australian urban communities', Australian Journal of Agricultural and Resource Economics, Vol. 56, No 1, pp. 61-81. Crase, L. (2011) The Fallout to the Guide to the Proposed Basin Plan, Australian Journal of Public Administration, Vol. 70, No 1, pp. 84-93. Crase, L., O’Keefe, S. & Kinoshota, Y. (2012) Enhancing Agri-Environmental Outcomes: Market-Based Approaches to Water in Australia's Murray–Darling Basin, Water Resources Research, 48, W09536, doi: 10.1029/2012WR012140, 2012, pp.1-7. Crase, L., O’Keefe, S. & Dollery, B. (2008). Urban Water and Wastewater Pricing: Practical Perspectives and Customer Preferences”, Economic Papers, Vol. 27, No. 2, pp. 194-206. DSE (2011) Water Corporations, Available: http://www.water.vic.gov.au/governance/water-corporations [Accessed 16 April 2012]. Dwyer, T. (2006) Urban water policy: In need of economics, Agenda, Vol. 13, No 1, pp. 3-16. ESC (2005) Water price review, Essential Services Commission, Melbourne, Australia. ESC (2009) Review of water regulatory accounting code and templates: Final code and template amendments paper, Available: http://www.esc.vic.gov.au/NR/rdonlyres/D99F4E1D-493C-4EF0-9200-FF580AD48483/0/ReviewofWaterRegulatoryAccountingCodefinalamendmentspaper20091029.pdf [Accessed 25 Jan 2012]. Frontier Economics (2008) Pricing signals for the food bowl modernisation project, Frontier Economics Pty Ltd., Melbourne, Australia. Goulburn Murray Water (2010) Corporate Plan 2010/11 - 2014/15', Available: http://www.g-mwater.com.au/downloads/aboutUs/reportsAndPublications/G_MW_Corporate_Plan_2010_11.pdf [Accessed 3rd April 2012]. Goulburn–Murray Water (2012) Connections Program [online] Available: http://www.g-mwater.com.au/connections/connections-project [Accessed 1 November 2012]. Hair, J., Anderson, R., Tatham, R. and Black, W. (1998) Multivariate analysis. New Jersey: Pearson Prentice-Hall. Hanemann, W. (1984) Discrete continuous models of consumer demand. Econometrica. 52: 541-562. Hausman, D. and McFadden, D. (1984) Specification tests for the multinomial logit model. Econometrica. 52(5): 1219-1240. Hensher, D. and Green, W. (2003) The mixed logit model: the state of practice. Transportation. 30(2): 133-176. Hensher, D. and Johnson, L. (1981) Applied discrete choice modelling. New York: Wiley. Hensher, D., Rose, J. and Greene, W. (2005) Applied choice analysis: a prime. Cambridge, United Kingdom.

66 Leading gifted horses to water
Kanninen, B. (2002) Optimal design for multinomial choice experiments. Journal of Marketing Research. 39: 214-217. Kruskal, J. (1965) Analysis of factorial experiments by estimating monotone transformations of the data. Journal of the Royal Statistical Society. 27: 251-263. Lee, J. and G. Fisher (2004) Infrastructure assets disclosure in Australian public sector annual reports, Accounting Forum, Vol. 28, pp. 349-368. Lee, J. A., Soutar, G. N. and Louviere, J. (2007) Measuring Values Using Best–Worst Scaling: The LOV Example, Psychology and Marketing, 24(12), pp. 1043-1058. Loomis, J., Traynor, K. and Brown, T. (1999) Trichotomous choice: a possible solution to dual response objectives in dichotomous choice contingent valuation questions. Journal of Agricultural and Resource Economics. 24(2): 572-583. Louviere, J. and Hensher, D. (1982) On the design and analysis of simulated choice or allocation experiments in travel choice modelling. Transportation Research Record. 890: 11-17. Louviere, J., Hensher, D. and Swait, J. (2000) Stated choice methods: analysis and application. Cambridge, United Kingdom: Cambridge University Press. Louviere, J. and Woodworth, G. (1983) Design and analysis of simulated consumer choice or allocation experiments: an approach based on aggregate data. Journal of Marketing Research. 20(4): 350-367. Luce, D. and Tuckey, J. (1964) Simultaneous conjoint measurement: a new type of fundamental measurement. Journal of Mathematical Psychology. 1: 1-27. Marley, A. A. J., & Louviere, J. J. (2005) Some probabilistic models of best, worst, and Best–Worst choices. Journal of Mathematical Psychology, 49, 464-480. McDonald, S., Bertolus, P., Dole, D., McGauchie, D. and Swan, D. (1992) Future management review rural water commission, Gutteridge Haskins and Davey, ACIL Australia, Ernst and Young. McFadden, D. (1974) Conditional logit analysis of qualitative choice behaviour, frontiers in econometrics. New York: Academic Press. Mitchell, R. and Carson, R. (1989) Using surveys to value public goods: the contingent valuation method. Washington DC: Resources for the Future. Morrison, M., Bennett, J. and Blamey, R. (1998) Valuing improved wetland quality using choice modelling. Sydney: University of New South Wales. Morrison, M., Blamey, R., Bennett, J. and Louviere, J. (1996) A comparison of stated preference techniques for estimating environmental values. Sydney: University of New South Wales. Morrison, M. and Brown, T. (2007) Testing the effectiveness of dissonance-minimisation, certainty scales and cheap talk in reducing hypothetical bias in contingent valuation. Proceedings of the Australian Agricultural and Resource Economics Society Conference, February 12-16, 2007. Queenstown, New Zealand. National Water Commission (2011) The National Water Initiative - Securing Australia’s Water Future: 2011 Assessment (NWC, Canberra).

Leading gifted horses to water 67
NWC, National Water Commission. (2012) Impacts of water trading in the southern Murray–Darling Basin between 2006-07 and 2010-11. Commonwealth of Australia, National Water Commission, Canberra, Australia. PC (2011), Australia’s Urban Water Sector, Productivity Commission, Melbourne, Australia. Rolfe, J. and Bennett, J. (2002) Assessing rainforest conservation demands. Economic Analysis and Policy. 32(2): 51. Roskam, E. (1968) Metric analysis of ordinal data in psychology. Netherlands: Vam Voorschoten. Ryan, C., J. Guthrie and R. Day (2007), 'Politics of Financial Reporting and the Consequences for the Public Sector', ABACUS, Vol. 43, pp. 474-487. Sandor, Z. and Wedel, M (2001) Designing conjoint choice experiments using managers’ prior beliefs. Journal of Marketing Research. 38: 430-444. Thurstone, L. (1927) A law of comparative judgment. Psychological Review. 34: 273-286. Train, K. (2003) Discrete choice methods with simulation. Cambridge: Cambridge University Press. VAGO (2011) Victorian Auditor-General's Report: Water Entities - Results of the 2010-11 Audits', Available: http://www.audit.vic.gov.au/publications/20111109-Water-Entities/20111109-Water-Entities.pdf [Accessed 7 Feb 2012 Wassenaar, H., Chen, W., Cheng, J. and Sudjianto, A. (2003) Enhancing discrete choice demand modelling for decision-based design. Journal of Mechanical Design. 127(4): 514-523. Wills, I. (2006) Economics and the environment: a signalling and incentives approach 2nd edition. Sydney: Allen and Unwin. Wills, I., F.L. Clarke, G. W. Dean( 2000) Use of CCA in the Public Sector: Lessons From Australia’s Experience With Public Utilities, Financial Accountability & Management, Vol. 16, pp. 1-32.


Griffith University Gold Coast Campus
Parklands Drive, Southport
QLD 4222, Australia
Telephone 07 5552 9333
Facsimile 07 5552 7333
www.nccarf.edu.au