leadership styles and sme performance: the …
TRANSCRIPT

LEADERSHIP STYLES AND SME PERFORMANCE: THE MEDIATING
EFFECT OF MARKET ORIENTATION
By
Nkopane Washington Miya
Student number 2006061887
A dissertation submitted in fulfilment for the degree
Magister Commercii (MCom) in Business Management
Faculty of Economics and Management Science
Department of Business Management
Study Leader: Dr Neneh Brownhilder
University of the Free State
Bloemfontein, South Africa
2017
i
ABSTRACT
The need for effective leadership has increased tremendously as a result of the complexity of
businesses and tough competition in today’s business environment. Every business requires
effective leaders to steer the business through turbulent times and envision a future. As such, one
of the driving forces for the future success of small and medium enterprises (SMEs) is the
development of good leadership. Furthermore, for businesses to compete and survive in the
current highly contested global market place, they have to more aware and alert about the needs
of their customers. Being more aware and alert about the customers’ needs means businesses
have to engage in market orientation. The leadership styles of top managers play vital roles in
shaping the organisational culture which leads to the implementation of good market orientation.
The primary objective of this study is to examine the mediating effect of market orientation on the
leadership-performance relationship. The empirical study was carried out in the Mangaung
Metropolitan Municipality (Bloemfontein, Botshabelo and Thaba’Nchu). A total of 354
questionnaires were distributed, 250 questionnaires were received from the respondents, however
only 229 were considered in the study because they were fully completed and generated a response
rate of 64.7%.
Key findings of the study showed that:
SME owners/managers engage in supportive, achievement oriented, transformational and
transactional leadership styles.
SME owners/managers highly engaged in customer orientation, but only moderately
engage in competitor orientation and Inter-functional coordination.
SME owners/managers perform better in terms of non- financial performance, but only
have a moderate performance in terms of financial performance.
With regards to the impact of leadership styles on SME performance (financial and non-
financial performance), the results established that supportive, participative, achievement,
consultative, democratic, and transformational leadership styles have a positive
relationship with non-financial performance, while laissez-fair has a negative relationship
with non-financial performance. With respect to financial performance, the results show
ii
that only democratic and transactional leadership styles have a positive relationship with
financial performance and this result are significant at the 5% level.
With regards to the dimensions of market orientation, the result revealed customer
orientation and competitive orientation have a significant positive relationship with non-
financial performance, while all three construct of MO (customer orientation, competitive
orientation, and inter-functional coordination) have a positive relationship with financial
performance.
With regards to the mediating relationship between market orientation and leadership
styles, the results established a partial and full mediation. In terms of the full mediation,
this study established that competitor orientation fully mediates the relationship between
consultative leadership style and non-financial performance; customer orientation fully
mediates the relationship between laissez-faire leadership style and non-financial
performance; and competitor orientation fully mediates the relationship between
democratic leadership style and financial performance. In terms of a partial mediation, this
study showed that customer orientation partially mediates the relationship between
supportive leadership style and non-financial performance; competitor orientation partially
mediates relationship between supportive leadership style and non-financial performance;
competitor orientation partially mediates the relationship between participative leadership
style and non-financial performance; customer orientation partially mediates the
relationship between participative leadership style and non-financial performance;
customer orientation partially mediates the relationship between achievement leadership
style and non-financial performance; competitor orientation partially mediates the
relationship between achievement leadership style and non-financial performance;
competitor orientation partially mediates the relationship between democratic leadership
style and non-financial performance; customer orientation partially mediates the
relationship between transformational leadership style and non-financial performance;
competitor orientation partially mediates the relationship between transformational
leadership style and non-financial performance; and competitor orientation partially
mediates the relationship between transactional leadership and financial performance.
The recommendations are provided more in depth in chapter 7 of the literature chapters.

iii
DEDICATION
This thesis is dedicated to my late mother and grandmother Malefu and Mampopi Miya. Thank
you very much for instilling discipline and positive attitude in me. The life lessons and values you
taught me have contributed significantly to the person I am today. May your souls rest in peace.

iv
DECLARATION
I, Nkopane Washington Miya, declare that the thesis titled “Leadership styles and SME
performance: Mediating effect on market orientation” is my own work. All the sources and
quotations I have used in this study were acknowledged by means of complete references.
Nkopane Washington Miya
________________________ _____________________
Signature Date

v
ACKNOWLEDGEMENTS
I would like to express my sincere gratitude to all the people who supported me from the
beginning of my master’s journey until completion.
First and foremost, my sincere gratitude and appreciation goes to my supervisor Dr.
Brownhilder Ngek Neneh for believing in me, especially when I was about to give up on
myself. Thank you for being patience with me, for your guidance, valuable input, support,
constructive criticism, and prompt feedback provided me from the beginning to the
completion of my thesis. I truly appreciate your intellectual guidiance and professionalism,
for without you this study would not have happened.
Also, I would like to thank Mrs Ekaete Benedict and Dr. Johan Van Zyl for the support and
confidence they have shown in me throughout this journey.
I would like thank my family and two best friends Thandaza Tshabalala and Jabulani
Motaung for their support, conviction, and prayers that saw me through this journey.
Importantly, my heartfelt gratitude goes to uncle Sello Christopher Miya for all the
sacrifices and financial support he gave to ensure that I get education. Thank you very
much for everything you have done for me.
Lastly, special thanks to Ms. Stella Shulika for the excellent work done in edting this thesis.
Above all, to God be the glory for giving me strength and courage to
complete this study.
vi
TABLE OF CONTENTS
ABSTRACT ................................................................................................................................................................ i
DEDICATION .......................................................................................................................................................... iii
DECLARATION ...................................................................................................................................................... iv
ACKNOWLEDGEMENTS ..................................................................................................................................... v
TABLE OF CONTENTS ........................................................................................................................................ vi
APPENDICES ......................................................................................................................................................... xii
LIST OF ACRONYMS ......................................................................................................................................... xiii
CHAPTER ONE ........................................................................................................................................................ 1
INTRODUCTION AND BACKGROUND TO THE STUDY ........................................................................... 1
1.1. INTRODUCTION ................................................................................................................................... 1
1.2. PROBLEM STATEMENT .................................................................................................................... 5
1.3. OBJECTIVES OF THE STUDY ........................................................................................................... 7
1.4. CONTRIBUTIONS OF THE STUDY ................................................................................................. 8
1.5. SUMMARY OF RESEARCH METHODOLOGY USED FOR THE STUDY ............................... 8
1.5.1. Research design ........................................................................................................................... 9
1.5.2. Population and sample ............................................................................................................. 9
1.5.3. Sampling design ....................................................................................................................... 10
1.5.4. Data collection methods ........................................................................................................ 10
1.5.5. Data analysis .............................................................................................................................. 11
1.6. CHAPTER OUTLINE ......................................................................................................................... 11
1.7. CHAPTER SUMMARY ...................................................................................................................... 12
CHAPTER TWO ................................................................................................................................................... 13

vii
LEADERSHIP STYLES AND SME PERFORMANCE ................................................................................. 13
2.1. INTRODUCTION ..................................................................................................................................... 13
2.2. DEFINITIONS OF LEADERSHIP ........................................................................................................ 13
2.3. COMPONENTS OF LEADERSHIP ...................................................................................................... 14
2.3.1. The leader ......................................................................................................................................... 15
2.3.2. The followers .................................................................................................................................. 15
2.3.3. The situation ................................................................................................................................... 15
2.4. THEORIES ON LEADERSHIP ............................................................................................................. 15
2.4.1. Trait approach ................................................................................................................................ 15
2.4.2. Behavioural approach ................................................................................................................. 16
2.4.3. Contingency theory....................................................................................................................... 17
2.5. LEADERSHIP STYLE ............................................................................................................................. 21
2.5.1. Directive leadership style........................................................................................................... 21
2.5.2. Supportive leadership style ....................................................................................................... 22
2.5.3. Participative leadership style ................................................................................................... 22
2.5.4. Achievement orientated leadership style ............................................................................ 22
2.5.5. Autocratic leadership style ........................................................................................................ 23
2.5.6. Consultative leadership style .................................................................................................... 23
2.5.7. Democratic leadership style ...................................................................................................... 24
2.5.8. Laissez-faire leadership style ................................................................................................... 24
2.5.9. Pace setting ...................................................................................................................................... 24
2.5.10. Coaching leadership style ........................................................................................................ 25
2.5.11. Visionary leadership style ....................................................................................................... 25
2.5.12. Transformational Leadership style ..................................................................................... 26
2.5.13. Transactional Leadership style ............................................................................................. 26
2.6. DEFINITION OF SMEs .......................................................................................................................... 27
2.6.1. SME Performance .......................................................................................................................... 28
2.6.2. Measures of SME Performance ................................................................................................ 29
2.7. CHAPTER SUMMARY ........................................................................................................................... 30
CHAPTER THREE ............................................................................................................................................... 31
MARKET ORIENTATION AND SME PERFORMANCE ........................................................................... 31

viii
3.1. INTRODUCTION ..................................................................................................................................... 31
3.2. DEFINITIONS OF MARKET ORIENTATION ................................................................................. 31
3.3. HISTORY OF MARKET ORIENTATION .......................................................................................... 32
3.4. DIMENSIONS OF MARKET ORIENTATION .................................................................................. 33
3.4.1. Behavioural dimension (Kohli and Jaworski) .................................................................... 33
3.4.2. Cultural dimension (Narver and Slater) ............................................................................... 35
3.5. THE ROLE OF THE EXTERNAL ENVIRONMENT ....................................................................... 38
3.5.1. Market turbulence......................................................................................................................... 39
3.5.2. Competitive intensity ................................................................................................................... 39
3.5.3. Technological turbulence ........................................................................................................... 40
3.6. MARKET ORIENTATION AND SME PERFORMANCE ............................................................... 41
3.7. MEASURING MARKET ORIENTATION .......................................................................................... 42
3.8. CHAPTER SUMMARY ........................................................................................................................... 42
CHAPTER FOUR .................................................................................................................................................. 44
THE MEDIATING EFFECT OF MARKET ORIENTATION ON THE LEADERSHIP STYLES
PERFORMANCE RELATIONSHIP .................................................................................................................. 44
4.1. INTRODUCTION ..................................................................................................................................... 44
4.2. MEDIATING EFFECT OF MARKET ORIENTATION ON THE LEADERSHIP STYLES–PERFORMANCE RELATIONSHIP ............................................................................................................. 44
4.3. CONCEPTUAL FRAMEWORK LINKING LEADERSHIP STYLES AND MARKET ORIENTATION TO SMES PERFORMANCE ........................................................................................... 46
4.4. RESEARCH HYPOTHESES .................................................................................................................. 47
4.5. CHAPTER SUMMARY ........................................................................................................................... 49
CHAPTER FIVE .................................................................................................................................................... 50
RESEARCH METHODOLOGY .......................................................................................................................... 50
5.1. INTRODUCTION ..................................................................................................................................... 50
5.2. THE BUSINESS RESEARCH PROCESS ............................................................................................ 50
5.2.1. Problem statement and research objectives ...................................................................... 52
5.2.2. Stage 2 Research design .............................................................................................................. 53
5.2.3. Stage 3 Sample selection ............................................................................................................ 58
ix
5.2.4. Stage 4 Data collection ................................................................................................................ 61
5.2.5. Measurements techniques ......................................................................................................... 65
5.3. LIMITATIONS OF THE STUDY .......................................................................................................... 69
5.4. CHAPTER SUMMARY ........................................................................................................................... 69
CHAPTER SIX ....................................................................................................................................................... 71
RESEARCH RESULTS: PPRESENTATION OF EMPIRICAL FINDINGS ............................................. 71
6.1. INTRODUCTION ..................................................................................................................................... 71
6.2. REGIONAL DISTRIBUTION ................................................................................................................ 71
6.3. RELIABILITY OF THE CONSTRUCTS .............................................................................................. 73
6.4. FACTOR ANALYSIS ............................................................................................................................. 75
6.5. SECTION A: EMPIRICAL FINDINGS ............................................................................................... 81
6.5.1. Descriptive/Demographic Information of the Respondents ........................................ 81
6.5.2. Gender of the respondents ........................................................................................................ 81
6.5.3. Age distribution of the respondents ...................................................................................... 82
6.5.4. Race distribution of the respondents .................................................................................... 83
6.5.5. Business age .................................................................................................................................... 84
6.5.6. The stages of business life cycle .............................................................................................. 85
6.5.7. Educational qualifications of the respondents .................................................................. 86
6.5.8. Types of degree program completed ..................................................................................... 87
6.5.9. Different types of business management related course attended in Mangaung Metropolitan Municipality, 2017. ....................................................................................................... 88
6.5.10. Conclusion on the descriptive/demographic information of the SME
owner/manager ......................................................................................................................................... 89
6.6. THE NATURE OF THE BUSINESS .................................................................................................... 89
6.6.1. The industry in which the business operates in the Mangaung Metropolitan
Municipality, 2017 .................................................................................................................................... 90
6.6.2. The number of people the business employed .................................................................. 91
6.6.3. Start-up capital ............................................................................................................................... 92
6.6.4. Reasons/motives for starting the business in the Mangaung Metropolitan
Municipality region, 2017 ...................................................................................................................... 93
6.6.5. Prior experience in the business sector the business is operating ............................ 94
6.6.6. Family member owned or operated a business ................................................................ 95
x
6.6.7. Conclusion on nature of the business .................................................................................... 96
6.7. LEADERSHIP STYLES ........................................................................................................................... 98
6.7.1. Correlation analysis .................................................................................................................... 100
6.8. MARKET ORIENTATION ................................................................................................................... 102
6.9. SME PERFORMANCE .......................................................................................................................... 102
6.10. SECTION B: HYPOTHESES TESTING ........................................................................................ 104
6.10.1. Leadership styles and SME performance ........................................................................ 104
6.10.2. Market orientation and SME performance ..................................................................... 107
6.11. THE MEDIATING RELATIONSHIP BETWEEN MARKET ORIENTATION AND
LEADERSHIP STYLES ................................................................................................................................. 109
6.11.1. Mediating effect using Baron and Kenny ......................................................................... 109
6.11.2. Mediating effect using Sobel’s Test and Bootstrapping ............................................. 113
6.12. CHAPTER SUMMARY ....................................................................................................................... 144
CHAPTER SEVEN .............................................................................................................................................. 147
DISCUSSION, CONCLUSION AND RECOMMENDATIONS .................................................................. 147
7.1. INTRODUCTION ................................................................................................................................... 147
7.2. PART A: CONCLUSION ON THE THEORETICAL CHAPTERS ............................................... 147
7.2.1. Chapter one - Introduction to the study ............................................................................. 147
7.2.2. Chapter two - Leadership styles and SME performance .............................................. 148
7.2. 3. Chapter three: Market orientation and SME performance ....................................... 148
7.2. 4. Chapter four: Mediating effect of MO on leadership style performance
relationship ................................................................................................................................................ 148
7.2. 5. Chapter five: Research Methodology ................................................................................. 149
7.3. PART B: CONCLUSION ON THE EMPIRICAL FINDINGS ....................................................... 149
7.3.1. Descriptive information of the SME owner/manager ................................................... 149
7.3.2. The nature of the business ....................................................................................................... 150
7.3.3. Leadership styles ......................................................................................................................... 151
7.3.4. Market orientation ...................................................................................................................... 151
7.3.5. SME performance ........................................................................................................................ 152
7.3.6. Leadership styles and SME performance ........................................................................... 152
7.3.7 MO and SME performance ........................................................................................................ 153

xi
7.3.8 The mediating relationship between market orientation and leadership styles 153
7.4. PART C: ACHIEVEMENT OF THE OBJECTIVE OF THE STUDY ........................................... 154
7.4.1. Primary objective ........................................................................................................................ 154
7.5. PART D: RECOMMENDATIONS TO THE STUDY ...................................................................... 156
7.6. PART E: LIMITATIONS TO THE STUDY ...................................................................................... 158
7.7. PART F: FUTURE RESEARCH .......................................................................................................... 158
7.8. CHAPTER SUMMARY ......................................................................................................................... 158
BIBLIOGRAPHY ................................................................................................................................................. 160
Appendix 1: Information letter to the participants in the study .................................................. 184
Appendix 2: Questionnaire .......................................................................................................................... 185
Appendix 3: Language Editorial Certification Letter ........................................................................ 195
Appendix 4: Mangaung Metropolitan Municipality Map ................................................................. 196

xii
APPENDICES
Appendix 1: Information letter to the participants in the study ............................................... 184
Appendix 2: Questionnaire ................................................................................................................ 185
Appendix 3: Language Editorial Certification Letter ................................................................... 195
Appendix 4: Mangaung Metropolitan Municipality Map ............................................................ 196

xiii
LIST OF ACRONYMS
SMEs Small and Medium Enterprises
MO Market Orientation
GDP Gross Domestic Product
SEDA Small Medium Enterprise Development Corporation Agency
FDC Free State Development Corporation
DTI Development of Trade and Industry
SPSS Statistical Package for Social Science
LCP Least Preferred Co-Worker
NPM Net Profit Margin
ROE Return on Equity
ROA Return on Assets
ROI Return on Investment
USA United States of America
NYDA National Youth Development Agency
EDP Entrepreneurial Developmental Program
NEPAB Network of Entrepreneur Practitioners and Academics in Business
ANOVA Analysis of Variance
KMO Kaiser Meiyer Olkin
1
CHAPTER ONE
INTRODUCTION AND BACKGROUND TO THE STUDY
1.1. INTRODUCTION
The need for effective leadership has increased tremendously as a result of the complexity of
businesses and tough competition in today’s business environment. Every business requires
effective leaders to steer the business through turbulent times and envision a future. Studies by
(Chandrakumara, De Zoysa and Manawaduge, 2009; Mohd Sam, Tahir and Abu Bakar, 2012)
have established that the success or failure of every business depends on the type of leadership
employed by business owners or managers. As such, the need for leaders who can make a huge
difference in today’s turbulent business environment is vital for the success of every business.
According to William (2014:293), leadership is defined as “the process of influencing others to
achieve group or organizational goals”. Chen (2009) views leadership as the process of using
various behavioural approaches to help guide organization members towards the achievement of
a shared goal. In the field of organisational study, leadership has been identified as one of the
important topics, given that it plays a significant role to the business prosperity. Valdiserri and
Wilson (2010) established that leadership styles of business owners and managers are vital to the
success of every business. Other studies by (Cogliser and Brigham, 2004; Bryant, 2004) found
that leadership is very critical to the success of SMEs as business people could not succeed to
establish new businesses in the absence of effective leadership behaviour.
Leadership is also vital in shaping the organisational culture that gives the business a unique
competitive advantage and implementation of effective marketing strategies that enhance the
financial position of the business (Menguc and Auh, 2008). According to Abdul Razak (2010),
one of the driving forces for the future success of SMEs is the development of good leadership.
Previous studies have shown that good leadership can enhance organisational performance
(Ogbanna and Harris, 2000; Tarabishy Solomon, Fernald and Sashkin 2005; Yang, 2008), increase
employees’ satisfaction, and improve their motivation (Papalexadris and Galanaki, 2009). Hernez-
broome and Hughes (2004) suggest that in order for SMEs owners and managers to achieve their
organisational goals and objectives, they need to develop a better understanding of leadership

2
behaviours. In this given, the survival, success, and growth of SMEs necessitate that the SME
owners and managers develop solid leadership behaviours in order to take their businesses through
good and bad times (Arham, Boucher and Muenjohn, 2013).
Besides leadership styles, there are also leadership theories. The theories on leadership distinguish
between the trait approach, behavioural approach, the situational approach (Fiedler’s contingency
approach; path-goal theory and the visionary leadership) and the power-influence approach
(Chang, 2012; William, 2014). Amongst the various leadership theories, the path-goal theory has
been widely studied (Pervez, 2005; Chang, 2012; William, 2013; Polston-Murdoch, 2013) in
management leadership research, with these researchers distinguishing between four leadership
styles (directive, supportive, participative, and achievement oriented). These various theories on
leadership explain how SME owners and managers can utilize their leadership skills to enhance
the performance and success of their businesses. Other studies by (Changanti, Cook and Smeltz,
2002; Kassim and Sulaiman, 2011) pinpoint that the leadership styles of senior executives indicate
their propensity in leadership behaviours and actions, and this is considered as a vital element
which affects business success.
Furthermore, for businesses to compete and survive in the current highly contested global market
place, they have to be more careful about the needs of customer (Darabi, Caruana, and Zegordi,
2007). In this regards, Duada and Akingbande (2010) assert that being more careful about the
customers’ needs means businesses have to engage in market orientation (i.e. change to adopted
market oriented approach as oppose to product oriented approach). Speaking of market orientation
(MO), Gudlaugsson and Schalk (2009) view it as a form of organisational culture where employees
are dedicated and devoted to constantly create superior customer value, through a set of marketing
activities that can improve the performance of a business. According to Jones, Wheelar and
Dimitratos (2011), MO is an organisations’ culture comprising of the values and beliefs about
putting the customer first in their business planning. Likewise, Gudlaugsson and Schalk (2009)
view MO as a form of organisational culture where employees in an organisation are committed
and dedicated to continuously creating superior customer value through a set of marketing
activities that can improve the performance of a business. To Tzokas, Carter and Kyriazopoulos
(2001), MO is a vital requirement for market performance and business growth, it leads to a
number of positive performance outcomes (Kennedy, Goolsby and Arnould, 2003; Weerawardena
3
and O'Cass, 2004), and gives small businesses a potential superior competitive advantage over
their competitors, as they have a closer proximity to their customers and can respond promptly to
their needs (Reijonen, Laukkanen, Komppula and Tuominen, 2012). More so, Grönroos, (2006)
and Gudlaugsson and Schalk, (2009) maintain that businesses that are market oriented turn to
outperform businesses that are less market oriented.
Other studies by (Dauda and Akingbade, 2010; Grönroos, 2006) characterise market orientation
as the key to successful SME performance and growth. Therefore, engaging in MO becomes an
imperative for SMEs, considering that it will enhance the performance of their businesses. The
theories and concepts on MO originate from the three dimensions that were first introduced by
Kohli and Jaworski (1990) and subsequently defined by Narver and Slater (1990). Narver and
Slater (1990) view MO as one-dimension construct, which consist of customer orientation,
competitor focus and inter-functional coordination, and two decision criteria - profit objective and
long term focus. While, Kohli and Jaworski (1990) state that MO comprises of the three elements:
namely, generation of market intelligence, dissemination of the intelligence, and organization
responsiveness. Based on Narver and Slater (1990) and Kohli and Jaworski (1990) dimensions of
MO, Schalk (2008) avers that the consequences of MO can be viewed into terms of SME
performance, employee response, and customer’s response. Firstly, in terms of SME performance,
MO is more likely to lead to increased sales, profits, market share, better margins, and customer
demand. Secondly, in terms of employee’s response, MO leads to a clear leadership, a better
coordination and management of sales activities, cohesive product focus, enables employees to be
able to review products and services from a global basis, which in turn translates to better product
and service differentiation. Thirdly, MO leads to happy and loyal customers who via word of
mouth refer potential customers to the business. In this way, the business reaps results in form of
a sustainable competitive advantage, decreased costs and increased profits..
The leadership styles of top managers play vital roles in shaping the organisational culture which
leads to the implementation of good MO. According to Narver and Slater, (1990), leadership style
is one important factor that shapes the formation of MO. Moreover, Narver, Slater and Tietjie
(1998) elucidate that top managers play a critical leadership role in changing the organisational
culture and ensuring that business becomes market oriented. Chiou and Chang (2009) point out
that leadership is needed to reshape the organisational culture, propose a challenging vision of the
4
future, and set a performance improvement target. Organisations that have leaders who possess
good leadership styles will afford to keep employees to stay focus and motivated during the time
of difficulties (Arham, Boucher and Meunjohn, 2013). According to Changanti and Smeltz,
(2002), the leadership styles of top managers indicate their behaviour and actions, and is a crucial
attributing attributing component which affects business success. Valdisseri and Wilson (2010)
point out that leadership style is the vital instrument that leads the business into success. Hernez-
broome and Hughes (2004) suggest that leaders of small businesses need to develop a better
understanding of leadership behaviour in order to achieve their organisational goals and objectives.
Consequently, in order for SMEs to succeed and respond to customers’ needs, a good MO has to
be formulated. SMEs need good leaders who possess good leadership styles that will inspire their
employees to adopt and execute good marketing strategies and marketing practices to give the
organisation the distinct competitive advantage in order to improve its performance and generate
profit.
In South Africa, SMEs are the cornerstone of the economy, since they play an important role in
fostering the creation of employment and economic growth (Olawale and Garwe, 2010). A study
by Kongolo (2010) found that SMEs make up about 91% of the formal businesses, contribute
about 51% to 57% of GDP and provide almost 60% of employment in South Africa. Another study
by World Wide Worx (2012) also found that SMEs in South Africa provide around 7.8 million
jobs. However, SMEs in South Africa are still faced with challenges “plagued by high failure rates
and poor performance” levels despite their many contributions. Machirori (2012) also points out
that SMEs in South Africa suffer from weak performance and a big unsuccessful rate. A study by
Neneh and van Zyl (2012) also noted that in South Africa, between 50% and 95% of the SMEs do
not survive in their fifth year of establishment, and 75% of new enterprises fail to be successful
firms, and this is the highest in the world. Also coupled with the high failure and low survival rate
amongst SMEs in South Africa is the greater number of people without jobs, with 27.7 % (Trading
economics, 2017). The high failure rate of SMEs in South Africa limits the impact that SMEs have
on unemployment, and creates negative perceptions about the viability and feasibility of
entrepreneurship as a career option (Herrington and Kew, 2010). As such, it becomes imperative
to enhance the creation and nourishing of SMEs given the great role they play in every economy.
Also, Olawale and Garwe (2010) contend that without the creation of new businesses, South Africa
risks economic stagnation.

5
All over the world, studies have shown that the success and failure of businesses depend on the
leadership style employed by the leader (Nave, 2006). Leadership is a key and vital element to
organisational prosperity and performance, precisely in the fierce contested market where SMEs
currently compete (Ireland and Hitt, 2005). The ability of SMEs’ owners to work towards the
attainment of the organisation’s objectives depend on effective leadership, which contributes to
the organisation’s success and performance (Stahl, 2007). Also, in order to ensure that SMEs
remain successful and have a distinct competitive advantage that can enable them to perform better
than rivals and succeed in the tough business environment, they need to engage in MO. Studies
(Romero, 2005; Kassim and Sulaiman, 2011; Deshpande and Farley, 2004) draw attention to the
fact that the successful development and implementation of MO depend on the type of leadership
style possessed by the business owner. MO enables SME to pay attention to the needs of their
customers and respond promptly to their complains and this gives them a competitive advantage
over their competitors (Reijonen, Laukkanen, Komppula, and Tuominen, 2012). Also, Stahl (2007)
and Ireland and Hitt (2005) established that SMEs owners have different leadership styles that
influence the organisation’s performance, as well as the creation of an adaptive organisational
culture. Therefore, in order for SMEs to succeed and respond to customers’ needs, a good MO has
to be formulated. One way of guaranteeing that a good MO is formulated is by ensuring that SMEs
owners possess good leadership styles (Kassim and Sulaiman, 2011; Changanti, Cook and Smeltz,
2002). Given the great role that SMEs play in the South African economy, it becomes vital to
identify and investigate under which type of leadership styles SMEs in South Africa can achieve
higher levels of MO and performance. A study of leadership style, MO, and its impact on SME
performance will open new arenas to theory building research. In this light, this study focuses on
establishing the mediating effect of MO on the leadership-performance relationship.
1.2. PROBLEM STATEMENT
The goal of any business is to survive and sustain its existence by enhancing its performance.
However, studies by (Machirori, 2012; Neneh and van Zyl, 2012; Olawale and Garwe 2010;
Willemse, 2010; Herrington, and Kew, 2010) have shown that SMEs are still inundated by high
failure rates, low entrepreneurial activity, and dismal performance. The high failure rate, low
entrepreneurial activity, and dismal performance of these businesses have also contributed
immensely to the high unemployment rate. Seleetse (2012) is of the view that SMEs in South

6
Africa fail within the first year of establishment, and this contributes to the increased
unemployment. The consequence of the weak SME performance is that it has limited the impact
SMEs have on enhancing job creation in the economy as a whole. This is because these SMEs are
not able to enter and stay in highly competitive markets. Due to the failures of the formal and
public sector to absorb the growing number of people looking for jobs in South Africa, more
attention has been focused on entrepreneurship and its potential in contributing to job creation and
improving the economic prosperity of the country. As such, enhancing the performance and
success rate of these businesses has become critical to the economic advancement of South Africa.
In order to meet the ever changing needs of customers in a highly competitive market. Arslan and
Staub (2013) state that businesses must continually increase performance.
Prior literature (Ullah, 2013; Ogbanna and Harris, 2000; Tarabishy Solomon, Fernald and Sashkin
2005; Yang, 2008; Wales Monsen and McKelvie, 2011) on leadership suggests that leadership
styles are critically important in enhancing the performance of businesses. However, other studies
(Aziz, Mohamood, and Abdullah, 2013; Lawal, Ajonbadi and Otokiti, 2014) failed to find any
relationship between particular leadership styles and SMEs' performance. Although the leadership
styles of SME owners/managers have a strong impact on business performance, simply adopting
a particular type of leadership is insufficient for sustainability and performance of the SMEs in the
long run. To ensure the long term performance of SMEs, its owners need to also engage in MO.
SMEs’ owners are the people responsible for developing an organisational culture that allows for
effective MO and the promotion of behaviours that are market oriented (Voola, Casimir, and
Haugen, 2003). Studies (Romero, 2005; Kassim and Sulaiman, 2011; Deshpande and Farley, 2004;
Voola, Casimir, and Haugen, 2003) have pointed out that successful development and
implementation of MO depends on the type of leadership style possessed by the business owner.
However, the leadership styles practice by SME owners may either block or encourage the
development and implementation of MO (Voola, Casimir, and Haugen, 2003). Also, studies by
(Stahl, 2007; Ireland and Hitt, 2005) have established that SME owners have different leadership
styles and these different leadership styles influence the organisation’s performance.
SMEs are often unable to take advantage of the opportunities available on the market simply
because they do not engage in a proper MO and end up employing poor marketing strategies that
contributes to the poor performance of the firms. However, businesses that have a conventional
7
leadership style and an adaptive organisational culture allow for effective MO. Hence, it becomes
vital to identify and investigate under which type of leadership styles SMEs in South Africa can
achieve higher levels of MO and performance as well as the mediating effect of MO of the
leadership-performance relationship. Understanding the meditating effect of MO on the
leadership-performance relationship can explicate why there have been mixed results regarding
the impact of different leadership styles on firm’s performances. Undertaking this examination
will provide a framework on how to use different leadership styles to enhance a firm’s MO as
means of increasing its performance. This will also play a vital role in addressing the dire issue of
poor SME performance in South Africa.
1.3. OBJECTIVES OF THE STUDY
Primary objectives
The primary objective of this study was to examine the mediating effects of MO on the leadership-
performance relationship.
Secondary objectives
i. To assess theories and concepts on leadership styles
ii. To review theoretical studies on market orientation
iii. To find out which types of leadership is practiced by SMEs owners
iv. To determine whether SMEs owners engage in MO and which type of market orientation
they engage in.
v. To determine which type of leaderships styles are essential to enhance the performance of
the SMEs.
vi. To find out the impact of MO on the performance of SMEs
vii. To find out the mediating effects of MO on the leadership styles- performance relationship
viii. To provide possible recommendations on how leaderships styles, market orientation SMEs
performance can be enhanced.

8
1.4. CONTRIBUTIONS OF THE STUDY
This study contributes to the literature in the following ways;
Prior studies (Ullah, 2013; Wales, Monsen, and McKelvie, 2011; Aziz, Mohamood, and
Abdullah, 2013; Lawal, Ajonbadi and Otokiti, 2014) on the role of leadership styles in
enhancing SME performance, and the role of MO in enhancing the SME performance
(Kennedy, Goolsby and Arnould, 2003; Weerawardena and O'Cass, 2004; Noble, Sinha
and Kumar, 2002; Hassim, Abdul-Talib, Abu Bakar, 2011) have produced mixed results.
The existing gap in the literature presents the opportunity for this study to examine how
the leadership styles and MO impact the performance of SMEs in South Africa.
Also, studies by (Voola, Casimir, and Haugen, 2003; Narver and Slater, 1990; Narver,
Slater and Tietjie, 1998; Arham et al., 2013) have established that SME owners are the
people responsible for developing an organisational culture that allows for effective MO
and promoting behaviours that are market oriented. Hence, it becomes vital to identify and
investigate under which type of leadership styles SMEs in South Africa can achieve higher
levels of MO and performance as well as the mediating effect of MO of the leadership-
performance relationship.
In addition, this study will also contribute to the on-going research on SMEs in South
Africa. By examining the relationship between leadership style and SME performance,
market orientation and SME performance, and the mediating effect of MO on the
leadership-performance relationship, this study will add to the body of knowledge that
exists on the topic. This contribution could possibly lead to the development of new
concepts and theories.
1.5. SUMMARY OF RESEARCH METHODOLOGY USED FOR THE STUDY
According to Quinlan (2011:217) the term research methodology means data collection methods
or data gathering techniques; data collection methods are the means by which researchers gather
the data required for the project. The research methodology follows a research process, which
Cooper and Schindler (2003) defines it as a step by step process of obtaining systematic
information by making use of acceptable methods of analysis as a basis for drawing conclusions.
The business research process also provides a description of how a research is designed, structured
and implemented. The various steps in the business research process will be explained below.
9
This section introduces the research methodology utilised for this study. Accordingly, overall plan
of how the study will be carried out will be presented to ensure reliability and validity of the results
of the research.
1.5.1. Research design
Burns and Grove (2003:195) define a research design as a plan to carry out research using methods
that will ensure validity of the findings. Research design can be defined as the master plan
specifying the technique and procedure for gathering and analysing the required data. It is a
framework or blueprint that plans the action for the research project (Zikmund, 2003). There are
three types of research design, namely: qualitative, quantitative and mixed research design. This
study used the quantitative research design. Quantitative research design is used to carry out a
research with a large sample size with the aim of measuring the opinions and knowledge of
individuals and it gives explanation to questions such as how much, how many and how often
(Cooper and Schindler, 2011). Furthermore, descriptive research involves data collection with the
aim of establishing a relationship between two or more variables (Cooper and Schindler, 2011).
The study also made use of descriptive research using cross-section study. This is considered a
suitable method for the study because the study does not attempt to examine trends, and the
problem of time constraints.
1.5.2. Population and sample
The population of interest of this study comprised of SMEs operating in the Mangaung
Metropolitan Municipality (Bloemfontein, Botshabelo, and Thaba Nchu). According to Centlec
there are about 4 400 businesses operating in the Mangaung Metropolitan Municipality. Out of the
4 400 businesses operating in the Manguang Metropolitan Municipality, a sample size of 354 was
used for this study based on calculations obtained when using the Raosoft sample size calculator.
Owing to the fact that there is no available list of SMEs operating in the Mangaung Metropolitan
Municipality, the researcher used the yellow page directory to identify and comply a list of
businesses located in the Mangaung Metropolitan Municipality complied. In order to access a
large number of SMEs operating in the region, the researcher attended events organised by the
Business School, Entrepreneurial Developmental Program (EDP) and Network of Entrepreneurs
Practitioners and Academics in Business (NEPAB) hosted at the University of the Free State in

10
2016. Thus, a total of 354 questionnaires were distributed among SME’s owners/managers in the
Mangaung Metropolitan Municipality. Out of 354 questionnaires that were issued, 250 were
received. From the 250 questionnaires gotten, only 229 were completed successful by the
respondents and generated a response rate of 64.7%.
1.5.3. Sampling design
There are two type of sampling designs - probability and non-probability sampling. This study
made use of a combination of probability (stratified sampling) and non-probability sampling
(convenience and snowball sampling) design. Owing to the fact that there is no available list of
SMEs operating in the Mangaung Metropolitan Municipality, the researcher used the yellow page
directory to identify and comply a list of businesses located in the Mangaung Metropolitan
Municipality complied. Stratified sampling ensured that each SME owners/managers within a
specific business sector had an equal chance of being selected. Also, the researcher attended events
organised by the Business School, Entrepreneurial Developmental Program (EDP) and Network
of Entrepreneurs Practitioners and Academics in Business (NEPAB) that was hosted at the
University of the Free State in 2016, where the researcher issued questionnaires to all the SMEs
owners/managers who attended the program. Convenience sample allowed the researcher to
collect data directly from SME owners/managers that attended the EDP and NEPAB program at
the University of the Free State. Snowball sampling method was later applied from the referrals
obtained from the SMEs owners/managers who attended the Entrepreneurial Developmental
Program (EDP) and Network of Entrepreneurs Practitioners and Academics in Business (NEPAB)
at the University of the Free State, as they referred the researcher to others SMEs owners/managers
operating in the Mangaung Metropolitan Municipality.
1.5.4. Data collection methods
Concerning data collection, this research study also made use of primary and secondary sources.
According to Quinlan (2011) primary data refers to the data directly observed or gathered by the
researcher engaged in a research project. Primary data is data collected and assembled for a
research project at hand (Sekaran and Bougie, 2013). There are three methods for the primary data
collection, namely: observation, experiment and survey (Zikmund, 2003). This research used
surveys, which involved asking questions to respondents and the responses were then analysed by
11
the researcher. The benefits of surveys are that they are relatively inexpensive; they are useful in
describing the characteristics of a large population; they can be administered from remote locations
using email, mail or telephone; very large samples are feasible and therefore make the results
statistically significant. There are various methods of conducting survey research (Zikmund,
2003). This research used interviews and questionnaires. Interviews were conducted in an informal
setting and was used for individuals who are illiterate and cannot complete the questionnaires by
themselves. The questionnaires constituted the main mode of communication, which consisted of
a series of open ended and close ended questions or statements that the street vendors were
expected to respond to.
1.5.5. Data analysis
The Statistical Package of Sciences (SPSS) version 22.0.0.0 was used by the researcher to analyse
the data collected. The data collected was interpreted using descriptive and inferential statistics.
Descriptive statistics tools like percentages, frequency distribution tables, histograms and charts,
were also used. Likewise, the researcher made use of inferential statistics, such as cross tabulation,
chi-square, t-test and Pearson correlation. Data reliability was tested by the use of Cronbach’s
Alpha reliability test. SPSS was used in this study because it enables the researcher to analyse
information gather from the statistical data accurately using graphs and other visuals.
1.6. CHAPTER OUTLINE
Chapter One: Introduction and Background to the Study. This chapter introduced the general
background to the study, which comprises of the outline of what the entire research will focus on.
Also, in this chapter, the problem statement is identified, the primary and secondary objectives of
the study and the contribution/significance to the study was put forth. Moreover, the research
methodology elaborating how the research was carried out, the chapter outline and the summary
of the entire chapter was presented.
Chapter Two: Leadership Styles and SME Performance. This chapter focused on discussing
the theories leadership style and discusses cornerstones of leadership. The chapter also examined
the various types of leadership styles, alongside defining of key terms like the SME, SME
performance, and its measurement.
12
Chapter Three: Market Orientation and SME Performance. This chapter examined Market
Orientation concepts and theories, it discusses the rationale behind the historical background of
the concept of market orientation and its origin, and the impact of market orientation on the
performance of the firms. The chapter also reviewed literature on the market orientation
measurements scale.
Chapter Four: The Mediating Effect of Market Orientation on the Leadership Styles
Performance Relationship. This chapter reviewed the relationship between leadership styles and
SME performance; the relationship between MO and SME performance, and establishes an
integrated framework linking leadership style and MO to SMEs performance. The chapter also
formulated the research hypotheses based on the relationships established.
Chapter Five: Research Methodology. This chapter provided a detailed discussion of the
research methodology used in this study, and describes the research design, data collection and
data analysis.
Chapter Six: Research Results. This chapter presented the key information gathered from field
interviews and questionnaires, and subsequently interpret the findings.
Chapter Seven: Discussion, Conclusion and Recommendations. This chapter provided a
conclusion to the study, and thus provided possible recommendations based on the findings
obtained from the study.
1.7. CHAPTER SUMMARY
This chapter provided a background to the study and gave the rationale for selecting the study. The
concept of leadership styles, leadership theories, different theories of market orientation and their
importance in the SMEs in South Africa was also succinctly discussed in this chapter. Likewise,
the chapter delineated the research problem, the primary and secondary objectives of the study, as
well as contributions it will make to the study. The chapter further presented the research
methodology employed for the purpose of the study and the outline chapter of the research
chapters. The next chapter discusses leadership theories and leadership styles, and their influence
on the performance of the SMEs.
13
CHAPTER TWO
LEADERSHIP STYLES AND SME PERFORMANCE
2.1. INTRODUCTION
To explain precisely who a leader is and the qualities him/her possess, this chapter begins with the
various definitions of leadership. The chapter distinguishes between a leader and manager and
discusses the cornerstones of leadership. Also, the theories on leadership are explained in detail.
The various types of leadership styles are discussed, and the definition of SME, SME performance,
and its measurement are also put forth. The chapter concludes by summarising the literature
reviewed on leadership styles and SME performance.
2.2. DEFINITIONS OF LEADERSHIP
Businesses all around the world require the presence of a good leader who will play a vital role in
leading the organisation when it is confronted by challenges, and ensure that it is well positioned
to overcome challenges and compete with rivals. As such, the challenges prevailing within the
organisation enables us to distinguish between a leader and manager. According to William
(2013:293) the distinction between leaders and managers is that “leaders are concerned with doing
the right things, while managers are concern with doing things right. Leaders pay attention on the
vision, mission, goals and objectives, whereas managers pay attention on productivity and
efficiency (William, 2013). Jones and George (2009:497) explicate that a person who possesses
the ability to apply his or her influence over other people and enable them to accomplish group or
organisational objectives is described as a leader.
Various definitions have been put forth to define leadership and these definitions vary from one
author to another. Daft and Marcic (2013:454) define leadership as an individual’s ability to exert
influence on the people to accomplish objectives. Oluwatoyin (2006) describes leadership as “the
art of transforming people and the organisation with the aim of improving the performance of the
organisation”. To Lawal and Chukwuebuka (2007), leadership refers to a leader’s ability to
influence the followers to do things they never thought of doing, never believed are attainable, or
things they do not want to do. Cheng (2011) posits that leadership is the process that exists within

14
the organisations and differ in form and nature to achieve organisational goals. Kassim and
Sulaiman (2011) state that leadership is the part of management that involves the supervision and
monitoring of others. To Chima (2007), leadership is the top management’s ability to direct, guide
and motivate the followers towards the achievement of a given set of goals within the organisation.
Similarly, Northouse (2007) posits that leadership is the process of influencing people and guiding
them towards achieving the goals of the organisation. According to Zumitzavan (2010),
“leadership takes place among people, it involves the use of influence, and it is used to attain
goals”. Drawing from these different definitions of leadership, this study adopts the one proposed
by (Ngambi, Cant and Van Heerden, 2010). The authors define leadership as a “process of
influencing others commitment towards realising their full potential in achieving a value added,
shared vision, with passion and integrity” (Ngambi, Cant and Heerden, 2010).
2.3. COMPONENTS OF LEADERSHIP
According to Van Der Walt (2015:205) leadership consists of three different cornerstones of
interacting parts in a system of give and take, namely; a leader, follower, and situation. The
diagram below illustrates the cornerstones of leadership. These cornerstones will be discussed in
details below.
Figure 2.1: The interactive framework of leadership
Source: Van der Walt (2015:205)
Leader
Situation Followers

15
2.3.1. The leader
A leader is viewed as a person who is vibrant in leadership operations, takes action to initiate the
operations, and have an impact on the people he or she leads (Van Der Walt, 2015). Leaders are
distinctive in their personality, experience, interest, position within the organisation as well as the
leadership styles they possess. An individual who lacks the ability to influence another person to
follow a particular direction is not be regarded as a leader (Van Der Walt, 2015).
2.3.2. The followers
Followers are people within the business that carry out actions necessary to accomplish the goal
and objectives of the business (Van Der Walt, 2015). A leader has an impact on the people he or
she leads to attain the objectives of the business and also in ensuring the successful implementation
of the action plans. Leadership is not a one-way process, to some degree is the interaction that
happens between the leader and followers. A leader cannot be successful in producing desired
outcome if subordinates do not want to follow.
2.3.3. The situation
Situation represents the state of affairs in which the leader have to show followers the way. The
situation can be affected by both internal and external factors (Van Der Walt, 2015). The
leadership style that fits successfully in one situation may not succeed in another situation. Hence,
it is crucial for leaders to familiarise themselves with the situation in order to apply the right
leadership style required by the situation.
2.4. THEORIES ON LEADERSHIP
Several theories on leadership have been put forth to help leaders and managers understand the
concept of leadership. According to William (2014) theories of leadership are classified into three
approaches, which are trait approach, behavioural approach, and contingency approach.
2.4.1. Trait approach
Studies by (Mat, 2008; William, 2014; Lawal and Chukwuebuka, 2007; Oluwatoyin, 2006; Jones
and George, 2009) suggest that trait theory emanates from the “great man” theory, which posits
that leaders are born with unique inborn or innate characteristics that set them apart from non-

16
leaders. The rationale behind trait approach was to discover what made these leaders great, and
choose future leaders who show signs of the same traits or the ones that can be taught (Daft and
Marcic, 2013). According to Jones and George (2009), the trait approach is centred on finding the
personal traits that are the basis for effective leadership. These researchers believe that effective
leaders possess some specific set of personal qualities that distinguish them from non-leaders.
William (2013) ascertains that leaders are distinguished from non-leaders because of the following
characteristics: drive, the desire to lead, honesty/integrity, self- confidence, emotional stability,
cognitive ability, and knowledge of the business. Jones and George (2009) state that leaders who
lack all these characteristics are viewed to be unsuccessful. Conversely, other researchers
Hellriegel, Jackson, Slocum, Staude, Amos, Kopper, Louw and Oosthuizen (2010) argue that traits
alone are not vital to help understand leader effectiveness given that some effective leaders do not
have all the characteristics, and those who possess them are not effective in their leadership roles.
2.4.2. Behavioural approach
Hellgriegel et al. (2010) elucidate that after finding out that leaders do not have constant set of
personal characteristics, researchers and academics shifted their concentration to point out
behaviours that are perceived as attributing features of effective leaders and how they contribute
to the success or failure of a leader (George and Jones, 2013; Daft and Marcic, 2011). As such,
the extensive research pertaining to the behavioural approach was conducted in the 1940s and
1950s at the Ohio State University, where researchers identified two fundamental types of
leadership behaviours: consideration and initiating structure. These types of leadership behaviours
are predominantly practiced by a majority of the leaders in the United States, Germany, and other
countries (Jones and George, 2009).
2.4.2.1. Considerate structure
William (2013) explicates that considerate structure refers to the degree to which a leader is
friendly, approachable, supportive, and expresses concern towards employees. Consideration
behaviour can also be defined as the extent to which leaders are concerned about developing a
close and interpersonal relationship with their subordinates. Such leaders are approachable and
employ a two way communication to demonstrate social and emotional support to their
subordinates, while helping them to feel comfortable about themselves, colleagues and their

17
situation in general (Northouse, 2010). According to Halloway (2012) leaders who engage in
considerate leadership behaviour play a critical role towards the growth of the subordinates,
ensuring that necessary support, assistance and information is provided to enable subordinates to
perform the job to the best of their abilities. They also allow individuals to make decisions in their
work, and show appreciation for the work done. Research carried out at the University of Michigan
shows that only considerate leaders are linked with effective leadership (William 2013).
2.4.2.2. Initiating structure
Hellgriegel et al. (2010) state that initiating structure points to vigorous planning, organising,
controlling, and coordination of employee’s tasks. William (2013) points out that a leader who
employs initiating structure designs the role of junior employees by putting in place goals,
providing direction, setting deadlines, and assigning tasks. Such leaders are reliant on one way
communication method as the effective tool they employ to provide explanation on what needs to
be done or what is expected to be done by their subordinates. Halloway (2012) explains that in
the initiating structure leadership style, the implementation of the plan, coordination, and
scheduling of the work related activities, is the responsibility of the task-oriented leaders. Jones
and George (2009) found inconclusive results between the considerate and initiating-structure and
performance. This is because some of the leaders are believed to be effective when they do not
practice both consideration and initiating-structure behaviours, while other leaders are considered
to be ineffective when they practice both considerate and initiating-structure behaviours (Jones
and George, 2009).
2.4.3. Contingency theory
According to Hellriegel et al (2010), the contingency model of leadership consists of four models
- Fiedler’s contingency model; Hersey and Blanchard situational model; the House’s Path-goal
model and the Leader-participation model.
2.4.3.1. Fiedler’s contingency model
Lorsch (2008) states that the concept of contingency theory of leadership is not new. According
to Lorsch (2008) the work began in the 1960s when a number of scholars and academics embarked
on the research, which pointed out that effective leadership style relies on the situation. Fiedler

18
contingency model suggests that in order to maximise work group performance, a particular
leadership style would be effective if matched with the right situation (William, 2013). According
to McLaurine (2006), Fiedler contingency model of leadership states that leadership style that
worked successfully in one situation cannot work successfully in another situation, unless it is
matched with the proper situation. Hariri (2011) suggests that Fiedler’s contingency theory is an
extensively used theory among the contingent theories in the study of organisational culture and
leadership. According to William (2014), leadership styles are fixed, meaning that leaders are
unable to change their leadership styles. However, they can be effective when their styles are
matched with the right situation.
Northouse (2007) explains that Fiedler contingency model of leadership is centred on leadership
styles and situations. Leadership styles consist of the two components namely considerate
orientated behaviour and structure orientated behaviour. Leaders with considerate orientated
behaviour are those who are concerned about maintaining a sound and healthy relationship with
their subordinates, while those with structure orientated behaviour are only concerned about
achieving goals and getting outcomes. Studies by William, (2014) and Marcic and Daft (2013)
relate that Fiedler introduced the scale known as the Least Preferred Co-Worker (LCP) to measure
the different leadership behaviour employed by leaders in various situations. George and Jones
(2009) noted that LCP proposed by Fiedler determines the leadership style by calling on the leaders
to evaluate their colleagues with whom they encountered challenges in working together on
various aspects. An example here will include; the colleague is dull or fascinating, gloomy or
cheerful, enthusiastic or unenthusiastic, cooperative or uncooperative. Leaders who are considerate
oriented explain LPC in more reciprocal terms. Their concern of establishing a healthy relationship
enables them to care, respect and think positive about their employees. On the other hand, leaders
who are task-oriented often describe LPC in a negative way. Such leaders are concerned about
achieving tasks and they have negative thoughts about others, thus making it difficult for the
employees to perform their job.
According to Northouse (2007) Fiedler contingency theory has five major strengths and three
major weaknesses. These strengths are:
This approach is backed by numerous studies.
It has broadened the understanding that situations have an impact on the leaders.

19
It is predictive of effective leadership.
The theory does not require that leaders be effective in all situations.
It can be used by organisations to provide leadership profile data.
Also, the weaknesses to Fiedler contingency theory are as follows:
It is unable to explain the reasons why leadership is effective in one situation than the other.
The theory relied strongly on the LPC scale whose validity was heavily criticised.
It is unable to explain sufficiently how the outcomes of this theory can be utilised in situational
engineering.
2.4.3.2. The situational Model
The situational model of leadership which was put forth by Hersey and Blanchard is an extension
of the behavioural approach (Daft and Marcic, 2013). The situational model focuses on the
characteristics of the subordinates in determining the most suitable leadership behaviour. The
situational approach is based on the belief that subordinates vary in their level of readiness or
maturity which is determined by their degree of willingness and ability when performing a vague
task (Hellriegel et al, 2010). In this given, these authors note that leaders need to be flexible to
adapt to changing situations. Accordingly, they define willingness as the mixture of confidence,
commitment, and motivation, as such a subordinate can be high or low in one of the three variables
mentioned (Daft and Marcic, 2013). Van Der Walt (2015) underscores that in order to ensure that
subordinates acquire essential skills relevant for optimal performance, leaders need to embrace
appropriate leadership style in the early stages. In contrast, Fiedler contingency model argues that
a leader cannot adjust his or her leadership style to maximise the group work performance. This is
to say, a specific leadership style should be matched with the right situation (Jones and Geroge,
2009).
2.4.3.3. House’s Path-goal Model
The Houses of Path Goal model was put forward by Robert House and is considered as one of the
most effective approaches to leadership (Ratyan and Mohd, 2013). Jones and George (2009) state
that the Houses of Path-goal model is centred on the idea that effective leaders encourage
subordinates to accomplish objectives by recognising the results that employees are attempting to
attain from the workplace, issue incentives to employees for exceptional performance and

20
accomplishment of goals, and clear the path for employees to attain business goals. According to
William (2013) the Houses of Path-goal model indicates that effective leaders can enhance
subordinate’s gratification and performance by explaining and simplifying path to goals, and by
rising the number and types of rewards offered to subordinates in order accomplish goals. Van
der Walt (2015) elucidates that the decision to help subordinates in their path to accomplish the
goals of the business depend on the leaders willingness. Leaders have to explain how the
subordinates can attain organisational goals, deal with hitches that are making it difficult for
subordinates to achieve stated goals, and then identify diverse rewards that will inspire
subordinates to attain goals (William, 2013).
According to (Jones and George, 2009; Daft and Marcic, 2013; Van der Walt, 2015) there are two
conditions that must be met by a leader for path clarification, path clearness, rewards towards
enhancing motivation, and efforts of the followers (subordinates). Firstly, leader’s behaviour is
regarded as a cause of future satisfaction to the subordinates. Secondly, leader’s behaviour offers
instruction, guidance, support and rewards required for the successful performance of the
followers. Similar to the other two contingency models that have been proposed, the Path-goal
model does not offer the procedure that explains the best way to lead. Instead, Path-goal model
emphasises that to be successful, a leader must choose appropriate leadership style that suits a
specific situation (Hellriegel et al., 2010). Contrary to Fiedler’s contingency model, Path-goal
model assumes that leaders have the ability to change or adjust their leadership style to fit a
particular situation (William, 2013). Path-goal model identified four leadership styles, namely:
directive, supportive, participative and achievement-orientated leadership styles, which are
explained in section 2.5 and its subsections of this chapter.
2.4.3.4. Leader-participation model
Hellriegel et al. (2010) state that leader-participation model is the latest contribution to the
contingency models. The leader-participation model was introduced by Victor Vroom and Phillip
Yetton. Researchers (Vroom and Yetton, 1973; Jago, 1988) argue that leader-participative
model’s primary focus is on the decision making process in the organisation. This model enables
leaders to determine the level of employee’s involvement regarding decision making in the
organisation (William, 2013). Hellriegel et al. (2010) state that leader-participation model offers
a set of rules needed to decide the level and method of employees participation in the decision
21
making process in the business, which has to be supported in different situations. Leader-
participation model notes that leader’s behaviour can be adjusted to be either structured or
unstructured in order to fit the task structure (Hellriegel, 2010). The leader-participation model
allows employees to make inputs in terms of decision making within the organisation. As a result,
employee’s participation will enhance manager’s leadership skills and approach to decision
making in the business.
Following the above literature on leadership theories, it becomes evident why there many theories
where leadership qualities are associated with the leader. There is no single theory that can be used
to explain the traits and behaviours of leaders. As such it becomes important to understand which
type of leadership styles leaders engage in.
2.5. LEADERSHIP STYLE
Ngodo (2008) state that leadership style is the process that allows leaders and subordinates to
persuade and motivate each other to achieve business goals. Also, studies by (Marturano and
Golsig, 2008; Jeremy, Melinde and Ciller, 2011) posit that leadership style is a structure that
consist of different parts such as traits, skills and behaviour employed by the managers when they
communicating with their subordinates. Several studies (Ireland and Hitt, 2005; Stahl, 2007;
Obiwuru, Okwu, Akpa and Nwankere, 2011) have been conducted to examine different leadership
styles practiced by the business owners/managers. This study focuses on directive, supportive,
participative, achievement orientated, autocratic, democratic, Laissez fair, pace setting, visionary,
transformational, and transactional leadership styles, explicated below
2.5.1. Directive leadership style
According to Muqsood, Bilal, Nazir and Baig (2013) directive leadership style can be defined as
the way in which leaders give instructions to their subordinates about what they have to do, how
to do it, and when it is expected of them to do it. Negron (2008) avers that directive leadership
style can be effective when the business hires new employees who lack work experience and the
situation in the business urgently necessitates decision making. Oluwotoyin (2006) points out that
directive leadership style is more relevant when a subordinate’s morale is low or activities that

22
need to be carried out are complicated and unclear. Thus, the leader enhances the job satisfaction
and motivation of the subordinates by giving more information.
2.5.2. Supportive leadership style Supportive leadership style requires leaders to be approachable and friendly towards the
subordinates. These leaders do not show favouritism, as employees are treated equally and they
strive to create friendly and conducive environment in the organisation (William, 2014). Murdoch
(2013) explains that supportive leaders learn by observing how people around them respond to
their decision making. Negron (2008) expounds that supportive leadership style is appropriate
when subordinates do not show the drive to complete tasks assign to them or lack motivation.
Pedraja-Rejas, Rodríquez and Rodríquez-Pounce (2006) found out in their study that supportive
leadership style has a positive impact on the success of SMEs in Chile.
2.5.3. Participative leadership style
William (2013) states that participative leadership style allows managers to consult subordinates
with the intention to listen to their ideas, opinions, and responses before a final decision is made.
According to Murdoch (2013), participative leaders believe in sharing their responsibilities with
subordinates by making sure that subordinates are not left out in the planning, decision making
and execution phase. This leadership style is effective because it gives subordinates the
opportunity to make inputs in the planning and implementation phase. Subsequently, it provides
them with better understanding of the tasks they have to carry out and clears misunderstanding. In
understanding the relationship between participative leadership styles and firm performance, a
study by Lawal, Ajonbadi and Otokiti (2014) did not find any significant relationship between
participative leadership styles and organisational effectiveness amongst SMEs in Nigeria. Thus,
they concluded that leadership style is not a main factor that determines the performance of SMEs
in Nigeria.
2.5.4. Achievement orientated leadership style
According to William (2014) in achievement oriented leadership style, leaders set high challenging
goals for their subordinates, and in return expect the subordinates to perform the stated goals and

23
objectives. Achievement oriented leaders believe that subordinates will take responsibility and
perform tasks to the best of their ability to ensure the business goals are achieved. Negron (2008)
insinuates that achievement orientated leadership is an appropriate leadership style for tasks that
are ambiguous and morale boosters for subordinates who may require increased confidence to be
able to accomplish tasks assigned to them.
2.5.5. Autocratic leadership style
Jogulu and Woods (2009) explicate that autocratic leaders are very strict, directive and impose
tasks and time frame on their subordinates. Their main goal is to ensure that the objectives of the
business are met. Also, autocratic leaders take advantage of the power of influence associated with
their position to control rewards and persuade their subordinates to comply with the instructions.
This type of leaders are known for taking control of all the decision making and actions by
instructing and giving orders to the subordinates on what is expected of them and how the job has
to to perform.. Additionally, the subordinates are not allowed to generate new ideas or methods
of doing their work (Jayasingam and Chen, 2009). Alkahtani, Jarad, Sulumain and Nikbin (2011)
point out that the use of autocratic leadership style can be effective in a situation whereby the
leader has all that is required to solve the problem, example being when time frame for completing
the project is limited or when the employees are all motivated. However, studies by Lawal,
Ajonbadi and Otokiti (2014) amongst SMEs in Nigeria did not find any significant relationship
between autocratic leadership styles and organisational effectiveness.
2.5.6. Consultative leadership style
Consultative leadership style is viewed as a leadership style in which leaders give subordinates the
opportunity to express their views, opinions, and ideas while embarking on the process of initiating
goals and task assignments (Jong and Hartog, 2007). According to Oluwatoyin (2006),
consultative leaders have a considerable, but not absolute trust and confidence on their
subordinates. Even though consultative leaders engage employees in the decision making, the
final decision rest on the leader. Furthermore, when subordinates believe there was no sufficient
consultation, they can declare their intentions to accept instructions issued by managers. However,
subordinates sometimes refuse to take instructions when managers based their decision making on
majority rule approach (Oluwatoyin, 2006).

24
2.5.7. Democratic leadership style
In democratic leadership style, leaders allow employees to participate in the decision making
within the organisation (Belias and Koustelious, 2014). This type of leadership style invites
members of the organisation to part take in the decision making process, as well as in deciding and
thinking about what to do and how to do it better, though the final decision still depends on the
leader (Alkahtani et al., 2011). Ojukuku et al., (2012) aver that democratic leadership style can
lead to terrible decision making and weak implementation. In addition, the enormous challenge
that lies with democratic leadership style is its assumption that everyone involved has an important
role to play in the outcome as well as the shared expertise concerning the decision (Ojukuku et al.,
2012). A study by Lucy, Ayodele, Babatunde and Timothy (2014) found a significant relationship
between democratic leadership style and SME performance. Based on this finding, these
researchers proposed that industries have to use democratic leadership style in order to increase
profit. Nonetheless, Lucy et al (2014) note that while democratic leadership style is impressive
and sounds good in theory, its implementation may be hindered by slow progress and workable
outcomes that needs massive effort.
2.5.8. Laissez-faire leadership style
Van Der Walt (2015) points out that in laissez-fair leadership style, leaders have little control over
the group of people they lead. Chaudhry and Javed (2012) state that in the laissez-fair leadership
style, subordinates are allowed to have the powers to make their own personal decision about their
work. Essien, Olesugun and Makaila, (2013) highlight that laissez-fair leadership style can lead
to distraction in and of the workplace when the employees need or want constant feedback, or
when employees are junior workers and are inexperienced to do the work on their own. Laissez-
fair leadership style can positively affect the performance of the business if the team management
is self-disciplined, well organised and well informed about their responsibilities. Zumitzavan and
Udchachone (2014) in their study found that laissez-fair leadership style has a negative relationship
with the performance of the business.
2.5.9. Pace setting
Garstka (2011) states that pace setting leadership style is applicable to the leader who establishes
high performance standards and lead by example. As such, a leader is preoccupied about getting

25
things done better and faster, and expects the same from people around him/her. Pace setting
leaders easily identifies poor performing subordinates and demand more effort from them, and
replace those who cannot meet the expectations or keep up with the pace set by the leader (Garstka,
2011). According to Constantin and Brancusi (2013), pace setting leadership style can be
successful in terms of producing desired outcomes in a short term situation. However, it can also
lead to the demotivation of subordinates in the long run. A study by Nsubuga (2008) found that
pace setting leadership style has a negative impact on subordinates’ level of self-confidence. This
is because employees get the impression that they are not trusted by the leader to do the work on
their own way. Consequently, flexibility fades away and work becomes too task focused (Nsubuga,
2008).
2.5.10. Coaching leadership style
According to Spreier, Fontaine and Malloy (2006), coaching leadership style involves the long
term participation of the executives to provide support and guidance to help enhance the
performance of the subordinates. Denton (2009) proposed that coaching leaders spent more time
with their subordinates to make them aware of their strengths and do their utmost best to help them
improve on their weaknesses and to become better than they were, in order to be successful in their
careers. The disadvantage with coaching leadership style is that some employees may interpret
personal growth as a form of control by managers. Hence, this leadership style in some situations
hinder the motivation and confidence of employees within business (Essien at al., 2011).
Similarly, Nsubuga (2008) state that coaching leadership style cannot be successful when
subordinates on the one hand require coaching, while on the other hand desire to increase
performance.
2.5.11. Visionary leadership style
To ensure that the organisation is able to attain its mission and vision, the need for visionary
leadership is vital to steer the firm in the right direction to achieve its desired goals and objectives
(Mohamad and Chiun Lo, 2012). According to William (2014:308) “Visionary leadership creates
a positive image of the future that motivates organisational member and provide direction for
future planning and goals getting”. Daft and Marcic (2013) state that visionary leaders speak to
the heart and soul of members of the organisation and allow employees to become part of

26
something greater than themselves. In situations where other leaders perceive stumbling blocks or
failures, visionary leaders remain positive and see opportunity and hope. Maladzhi (2012) stresses
that visionary leadership have a positive impact on the outcome of the subordinates, which in turn
increases the level of trust in their leader, high dedication to the leader, higher degree of
performance between subordinates, and subsequently the overall performance of the business. As
such, it becomes vital for every leader to have the ability to construct a vision for the business and
clearly communicate it to all employees in the organisation (Maladzhi, 2012).
2.5.12. Transformational Leadership style
Van Der Walt (2015:225) postulate that “a transformational leader has the ability to instil trust,
admiration, loyalty, and respect among followers and “transform” a situation, because followers
are willing to go above and beyond what the leader expects of them to do”. According to Zopiatis
and Constati (2010) transformational leadership is centred on a common vision between the leaders
and subordinates in their quest to achieve organisational goals. Garcia-Morales, Jimenez-
Barriounuevo and Gutierres (2011) maintain that transformational leadership improves the level
of awareness of the employees in terms of achieving shared goals. A transformational leader is
“attentive to the needs and goals of the followers and support them to reach their full potential”
(Northouse, 2007). Subordinates develop trust, respect, admiration and sense of loyalty for a
transformational leader (Obiwuru et al., 2011). Aziz, Mohamood and Abdullah, (2013) posit that
transformational leader motivates, inspire employees, gives them authority over their work, and
in return employees feel obliged to be committed, determined, and more dedicated to help the
organisation to achieve its goals. Transformational leadership enhances the performance of the
organisation through supportive, delegative, collaborative, and participative leadership styles, as
well as the relationship amongst subordinates (Aziz, Mohamood and Abdullah, 2013). A study by
Arham (2014) found that transformational leadership style has significant relationship with the
performance of SMEs in Malaysia.
2.5.13. Transactional Leadership style
Transactional leadership is based on the exchange between leaders and subordinates for the
attainment of specific goals (Arham, Boucher and Muenjohn, 2013). Transactional leadership
theory is centred on the transactions based on the contractual agreement between the leaders and

27
followers, provided that the tasks and assignments are accomplished (Rowold, 2011). Garcia-
Morale et al. (2011) accentuate that transactional leadership is centred on promoting the interest
of the leaders and subordinates in order to achieve contractual obligations for both parties by
establishing objectives and ensuring that the results are controlled and monitored. Arham, Boucher
and Muenjohn (2013) state that transactional leaders are described as leaders who spend time
guiding, motivating and inspiring their followers to move in the direction of achieving goals by
explaining roles and tasks that are needed to be accomplished. Transactional leaders are vital
figures that ensure organisational success both at team and individual levels (Guardia, 2007). A
study by Saasongu (2015) found that transactional leadership style influences the performance of
small scale businesses in Makurdi metropolis as appose to transformational leadership style.
In nutshell, while several studies have indicated that leadership styles enhance the performance of
a business (Ojukuku, Odetayo and Sajuyigbe, 2012; Aziz, Mohamood andAbdullah, 2013), others
have found an insignificant relationship with performance (Mgeni, 2015; Nsubuga, 2008;
Zumitzavan and Udchachone, 2014; Lawal, Ajonbadi and Otokiti, 2014). As a result, it is not
clear which leadership styles will have an impact on SME in South Africa. As such, it becomes
important to find out which of these leaderships styles are essential to enhance the performance of
SMEs.
2.6. DEFINITION OF SMEs
There are many definition of SMEs and they vary across each specific country. In South Africa,
the National Small Business Act of South Africa of 1996, as amended in 2003, defines SMEs as
“a separate and distinct entity including cooperative enterprises and non-government organisations
managed by one owner or more, including its branches or subsidiaries if any is predominantly
carried out in any sector or sub-sector of the economy mentioned in the schedule of size standard
and can be classified as SME by satisfying the criteria mentioned of size standards” (Government
Gazette of the Republic of South Africa, 2003). Equally, the National Business Act 29 of 2004
defines SMEs in terms of the total full-time equivalent of paid employees, total turnover and total
gross asset value (Department of Agriculture, Forestry and Fisheries, 2014). Table 2.1 below
shows the definition of the SMEs in South Africa.
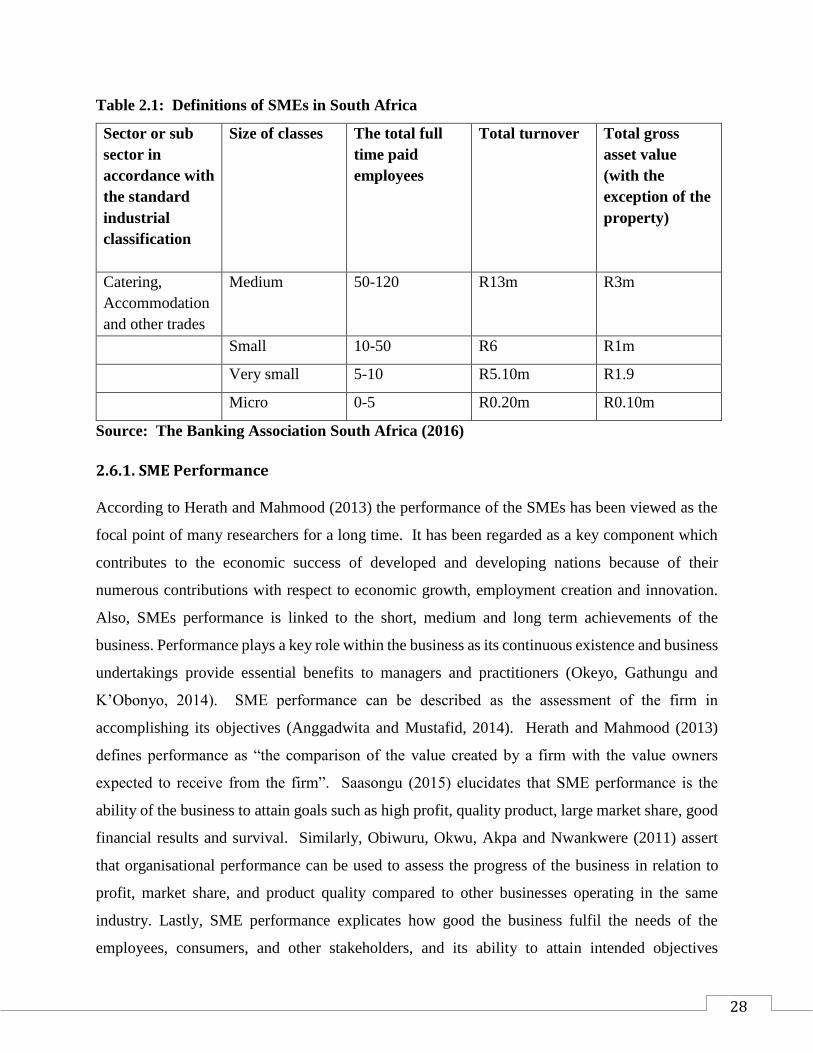
28
Table 2.1: Definitions of SMEs in South Africa
Sector or sub
sector in
accordance with
the standard
industrial
classification
Size of classes
The total full
time paid
employees
Total turnover Total gross
asset value
(with the
exception of the
property)
Catering,
Accommodation
and other trades
Medium 50-120 R13m R3m
Small 10-50 R6 R1m
Very small 5-10 R5.10m R1.9
Micro 0-5 R0.20m R0.10m
Source: The Banking Association South Africa (2016)
2.6.1. SME Performance
According to Herath and Mahmood (2013) the performance of the SMEs has been viewed as the
focal point of many researchers for a long time. It has been regarded as a key component which
contributes to the economic success of developed and developing nations because of their
numerous contributions with respect to economic growth, employment creation and innovation.
Also, SMEs performance is linked to the short, medium and long term achievements of the
business. Performance plays a key role within the business as its continuous existence and business
undertakings provide essential benefits to managers and practitioners (Okeyo, Gathungu and
K’Obonyo, 2014). SME performance can be described as the assessment of the firm in
accomplishing its objectives (Anggadwita and Mustafid, 2014). Herath and Mahmood (2013)
defines performance as “the comparison of the value created by a firm with the value owners
expected to receive from the firm”. Saasongu (2015) elucidates that SME performance is the
ability of the business to attain goals such as high profit, quality product, large market share, good
financial results and survival. Similarly, Obiwuru, Okwu, Akpa and Nwankwere (2011) assert
that organisational performance can be used to assess the progress of the business in relation to
profit, market share, and product quality compared to other businesses operating in the same
industry. Lastly, SME performance explicates how good the business fulfil the needs of the
employees, consumers, and other stakeholders, and its ability to attain intended objectives

29
(Abouzeedan, 2011). From these definitions of performance, it becomes necessary to focus on the
measures of SME performance
2.6.2. Measures of SME Performance
According to Harif, Hoe and Mohamad (2013) literature pinpoints that the quest for SME
performance measurement has intensified in the last two decades. Jan Khan, Khalique and Nor
(2014) draw attention to the point that SME performance measures attracted the attention of both
academic scholars and practitioners. Ahmad and Zabri (2015) assert that performance
measurement refers to a group of metrics employed to evaluate the efficiency and effectiveness of
activities in the business. Performance measurement is viewed as a balanced and vibrant system
that provide support to the decision making process through collecting, expounding and assessing
the data (Langwerden, 2015). Performance measurement is divide into two categories, which are
financial and non-financial or objective and subjective measures (Mohamad, et al., 2013).
Guijarro, Auken and de-Lema (2012) posit that financial performance measure comprises of
financial ratios such as net profit margin, return on equity (ROE) and return on assets (ROA).
Chong (2008) adds that a business financial performance can be measured using financial
measures such as profits, revenues, return on investment (ROI), and return on sales. Chong (2008)
explicates that while financial measures are perceived to be impartial, easy to comprehend and
calculate, there still remains a problem with financial measures, in that they are not made available
to the public due to confidential information relating to finances. Also, the information gotten
from the financial measurement is unreliable and inaccurate. As a result, non-financial
performance measure was proposed in order to provide more information that financial
performance measure was unable to produce (Ahmad and Zabri, 2015).
According to Zaman, Javaid, Arshad and Bibi (2012) non-financial performance measures include
product or service quality, market share, customer loyalty, and customer satisfaction. Similarly,
Nagy, Babaita and Ispas (2012) affirm that non-financial performance measures involve customer
satisfaction, market share, employee feedback, human resources, and product quality. Maduekwe
and Kamala (2016) postulate that non-financial performance measures can be better indicators of
the future performance of a business. Furthermore, non-financial performance measures are more
progressive as oppose to financial performance measures, seeing as managers depend on them to
make sound decisions that will influence the future of the business (Eltinay and Masri, 2014).
30
Zuriekat, Salameh and Alrawashdeh (2011) encourages the use of both financial and non-financial
performance measure as it provides the business owner with balanced opinion regarding the overall
state of the business.
2.7. CHAPTER SUMMARY
This chapter put forth and explained the various definitions of leadership. The components of
leadership were also discussed to establish the link between the leader, follower and situation (Van
De Walt, 2015). The chapter discussed the theoretical background of leadership by looking at
several theories of leadership and the different leadership styles identified under each theory
practiced by the SME owners/managers. According to William (2014), theories of leadership are
divided into three approaches, namely: trait approach, behavioural approach and contingency
approach.
Furthermore, the literature review on leadership revealed that the survival or failure of the business
is predominantly dependent on the leadership styles such as (directive leadership style, supportive
leadership style, participative leadership style, achievement orientated leadership style, autocratic
leadership style, consultative leadership style, democratic leadership style, laissez-faire
leadership style, pace setting, coaching leadership style, visionary leadership style,
transformational leadership style, transactional leadership style). This chapter sought to identify
which leadership qualities SME owners/managers have that can be developed to enhance their
leadership styles in order to grow the business.
Moreover, the definitions of SMEs were explained and it was found in the literature that the
definitions vary from country to country due to a lack of universal definition of SME. The chapter
put forth the definition of SME in South Africa. SME performance and its measurements were
also discussed, where it was revealed that performance can be measured using a combination of
both financial and non-financial measures. Financial and non-financial performance were found
to be adequate measures of performance and can be used parallel to enhance SME performance
(Zuriekat, Salameh and Alrawashdeh, 2011). The next chapter three, focuses on the concepts and
theoretical background of market orientation.

31
CHAPTER THREE
MARKET ORIENTATION AND SME PERFORMANCE
3.1. INTRODUCTION
The chapter commences by explaining definitions of market orientation (MO) proposed by
different authors. Following the definitions of market orientation, the chapter discusses the
rationale behind the historical background of the concept of market orientation and its origin.
Subsequently, the overview of the dimensions of market orientation, proposed by Kohli and
Jaworski; Narver and Slater is presented. The chapter also discusses environmental factors that
affects the performance of organisations. The impact of market orientation on the performance of
the firm is also discussed in depth. The last part of the chapter reviews literature on market
orientation measurements scale. The chapter concludes by summarily recapping the content
discussed in the literature presented.
3.2. DEFINITIONS OF MARKET ORIENTATION
Various definitions of MO have been proposed by different authors. According to Jones, Wheeler
and Dimitratos (2011) MO refers to the organisation’s-level culture, whichcomprises of values and
beliefs that emphasises on putting customer first in the business planning. Gudlaugsson and Schalk
(2009) state that MO is a form of organisational culture in which employees within the firm are
committed to the ongoing generation of superior value for customers through the series of
marketing campaigns that are meant to improve SME performance. MO can also be described as
“the organisational culture that most effectively and efficiently creates the necessary behaviours
for the creation of superior performance for the business” (Narver and Slater, 1990:21).
Kohli and Jaworski (1990) defined MO as behaviours and actions within the business. MO can be
explained as a form of organisational culture in which workers within the business are
systematically and fully devoted to create ongoing superior value for consumers (Narver and
Slater, 1990; Desphandé, Farley and Webster, 1993; Day, 1994; Ngasantil, 2001). Researchers
like (McClaure, 2010; Barnabas and Mekoth, 2010; Awwad and Agti, 2011) view MO as the
“shared values and beliefs that provide individuals with norms for behaviour in the organisation”.

32
According to Bisp (1999) MO can be defined as a sequence of activities used to acquire, examine
and gather information which involves present and prospective customers, and rivals in the
industry. Based on the above definition of MO, this study adopts two definition of MO as
propounded by Narver and Slater (1990) and Kohli and Jaworski (1990).
3.3. HISTORY OF MARKET ORIENTATION
Marketing researchers such as Kohli and Jaworsi (1990); Narver and Slater (1990); Ruekert
(1992); Gainer and Pandanyi (2005); Carr and Lopez (2007) assert that MO emanates from
marketing concept and has a significant effect on the organisation’s general strategy. In their
studies Narver and Slater (1990; 1994); Kohli and Jaworski (1990); Hunt and Morgan (1995)
alluded that the notion of market orientation deals with customer-orientation, innovation and profit
as a stimulus for creating happy customers. As noted by Greenley (1995); Han, Kom and
Srivastava (1998), theories on MO have been extensively welcomed by academics and scholars
globally either as the execution of the market(ing) idea, a form of organisational culture, or the
combination of the two. To provide clarity, “market concept” and “marketing concept” are
employed almost identically in this study. For each definition, a market is perceived as a physical
or non-physical place where goods are made available for sale and marketing the action or method
of acquiring and trading in a market by way of commercial activities that involve moving goods
from manufacturer to the consumer in the market place. Based on the information above, this
study focuses on the concept MO and its influence on the performance of the SMEs.
Kohli and Jaworski (1990); Naver and Slater (1990) published two crucial papers that firmly
introduced the concept of MO into the academics of business research. Kholi and Jaworski (1990)
were the first to propose antecedents and moderators effects of MO. Subsequently, Naver and
Slater put forward the MO framework with three cultural dimensions, namely: customer
orientation, competitor orientation and inter-functional coordination. As such, the number of
studies carried out on MO centred on three dimension that were described for the first time by
Kohli and Jaworski (1990), and thereafter proposed by Narver and Slater (1990).

33
3.4. DIMENSIONS OF MARKET ORIENTATION
Several studies by (Narver and Slater, 1990; Kohli and Jaworski, 1990) have categorised MO into
the behavioural and cultural dimensions. The behavioural dimension was put forth by Kohli and
Jaworski, while the cultural dimension was proposed by Narver and Slater, as explicated below.
3.4.1. Behavioural dimension (Kohli and Jaworski)
According to Kohli and Jaworski (1990), the behavioural dimension of MO is made up of three
sets of activities: “organisation-wide generation of market intelligence, dissemination of the
intelligence across departments and organisation-wide responsive to it”. In early 1990s Kohli
and Jaworski (1990) officially defined MO as a set of behaviours and actions within the business,
and suggested antecedents and consequences to MO. This study pays attention on the behavioural
dimension to MO proposed by both (Kohli and Jaworski, 1990). More details of behavioural
dimensions are discussed below.
Figure: 3.1 Behavioural perspective to market orientation
Source: Kohli and Jaworski (1990)
3.4.1.1. Generation of market intelligence
According to Morgan, Slotegraaf and Vorhies (2009), market intelligence can be described as the
gathering and analysis of customers’ present and prospective needs, as well as rival analysis, the
Generation of
Market
Intelligence
Dissemination
of Intelligence
Organisational
Response
Market
Orientation

34
influence of government regulation, competition, technology and other environmental forces. The
concept market intelligence entails the analysis of consumers’ needs and preferences and the
examination of how customers can be affected by environmental components. Kohli, Jaworski and
Kumar (1993:53) state that market intelligence has to be communicated and circulated in every
part of the organisation either formally or informally.
Worth noting, as postulated by Rodrigues and Pinho (2010), is the fact that market intelligence is
not only based on the customer’s opinion expressed in words, but also an extensive concept that
involves thorough consideration of external market components such as rivals. Likewise, market
intelligence takes into account present and prospective needs of customers. According to Grönroos
(1991), organisations need to possess a strong information technique, especially those in a
relationship-marketing situation. Moreover, studies by Mokhtar, Sanuri and Yussof, Zien, Ahmad
and Azinin (2014) found that market intelligence has insignificant influence on the performance
of business or how businesses perform.
3.4.1.2. Dissemination of intelligence
Dissemination of intelligence can be defined as the process or degree of exchanging market
information within the organisation (Kohli and Jaworski, 1993). According to Rodriques and
Pinho (2012), intelligence dissemination is concerned with the communication and circulation of
information to all departments and individuals in the firm through both formal and informal
channels of communication. Effective distribution of MO is regarded as a crucial act which brings
forth common basis for combined effort by different departments within the organisation. The
market intelligence view specifies behaviours that lead to enhancing organisational performance.
Studies by Mokhtar, Sanuri and Yussof, Zien, Ahmad and Azinin (2014) found a significant
relationship between dissemination of market intelligence and SMEs performance.
3.4.1.3. Organisational response
Organisational responsiveness only occurs in the business if the formalised procedure for
distributing business intelligence is not too difficult to carry out. In other words, a department,
manager or employee is merely eager to distribute information if it alludes and allures no costs
(Kohli and Jaworski, 1990). Dursun-Killic (2006) asserts that responsiveness is a speed of real
execution of a strategy or technique used to reply to the intelligence gathered and circulated. The

35
absence of response by the firms to information makes it difficult to make a forward movement to
overcome competition. MO is regarded as a vital prerequisite towards the success and profitability
of several businesses, and it demonstrates the degree of competitiveness of the business in the
market in which it functions (Kohli and Jaworski, 1990). Studies by Mokhtar, Sanuri and Yussof,
Zien and Ahmad, Azinin (2014) found an insignificant impact of organisational responsiveness on
the performance of the SMEs.
3.4.2. Cultural dimension (Narver and Slater)
Based on the cultural dimension of MO, Narver and Slater (1990:21) defined MO as “the
organisational culture that most effectively and efficiently creates the necessary behaviours for the
creation of superior value for buyers and continuous superior performance for the business”.
Following this definition, Narver and Slater (1990), identified three cultural components of MO,
namely customer orientation, competitor orientation and inter-functional coordination, all
discussed below.
Figure: 3.2 Cultural perspective to market orientation
Target Market
________________________________________________________
Source: Narver and Slater (1990:23)
cu
Long-
Term
Profit
Focus
Customer orientation
Customer
Orientation
Inter-functional
Coordination

36
3.4.2.1. Customer orientation
Day (1994) defines customer orientation as “a concept which transforms marketing into a potent
competitive weapon, shifting organisational values, beliefs, assumptions, and premises towards a
two-way relationship between customers and the firm”. According to Hashim and Abu Bakar
(2011) customer orientation focuses on understanding the needs and wants of consumers in order
to produce products or services of a superior value. Rodriguez Ricardo, Berrio and Sandra (2011)
state that customer orientation can be viewed as the understanding of present and prospective
suppliers and of customer’s value chain, as well as the generation of superior value for both
supplier and customer. Customer orientation necessitates a seller to comprehend a customer’s
value chain, not merely as it is today but as it will make progress over time subjected to internal
and market developments (Day and Wensley, 1998). Nakola, Tarus, Buigut and Kipchirchir
(2015) in their study found that customer orientation has a significant and positive influence on
the performance of the SMEs.
3.4.2.2. Competitor orientation
According to Narver and Slater (1990) competitor orientation can be defined as supplier’s
comprehension of short-term strengths and weaknesses, long-term competencies and strategies of
both present and prospective rivals. Importantly, the evaluation of present and prospective rivals
should include the whole set of technologies suitable for meeting present and future desires of the
supplier’s target customers (Narver and Slater, 1990). To Levitt (1960), organisations need to do
competitors evaluation and also think about possible ways of solving problems that can fulfil
present and prospective customer needs and expectations. Mahmoodean, Ashraf and Hassani
(2014) maintain that competitor’s orientation is regarded as a key component of MO.
Additionally, businesses that are market oriented always search for ways to find their strengths
and weaknesses within the business not only by looking at the products or marketing, but by also
considering their processes and organisation (Mahmoodean et.al, 2014). Mahmoodean et al.
(2014) further assert that maintaining a balance between firm’s attentiveness regarding customers
and competitors is important for improving SME performance. Asomaning and Abdulai (2015)
established a strong positive and significant association between competitor orientation and market
performance in their study on small businesses in Ghana. However, Alizadeh, Alipour and
37
Hasanzadeh (2013) in their study did not find a significant relationship between competitor
orientation and organisational performance.
3.4.2.3. Inter-functional coordination
According to Narver and Slater (1990) the third element of cultural behaviour is inter-functional
coordination. Inter-functional coordination encompasses communication and distribution of
information and resources, and integration and cooperation of different department within the
organisation with the goal of providing products of superior value to customers, and subsequently
outperform competitors (Bengesi and Roux, 2014). Every point in the customer’s value chain
presents the opportunity for supplier to create superior value for the customer’s organisation. As
further noted by Narver and Slater (1990), MO and other three behavioural elements are the
responsibilities of all the departments and all employees in every level of the organisation.
Therefore, there must be a shared effort among employees in the whole organisation in order to
succeed in generating the ongoing superior value for customers. The idea of inter-functional
coordination put forward by Narver and Slater can be interpreted in the same way with Kohli and
Jaworski’s two components of MO - intelligence dissemination and responsiveness to market
intelligence, which are both concerned with the coordinated use of organisational resources to
continue generating superior value for target customers (Loannou, 2008). Studies (Asomaning
and Abdulai, 2015; Alizadeh, Alipour and Hasanzadeh, 2013) found a positive and significant
relationship between inter-functional coordination and organisational performance.
3.4.2.4. Long-term profit focus
Narver and Slater (1990) incorporated the fundamentals of market concept in a satisfactory manner
by successfully joining all the elements of the marketing concept under MO and indicating the
long-term view of profit making. Their study indicated that the sole motive of the business is to
generate profit and create economic wealth (Narver and Slater, 1990). Schalk (2008) postulates
that it is only through the constant generation of superior value to customers that a firm can
generates a long-term profit. While the short term marketing promotions or sales action can
enhance sales, the business image and the creation of customers who buy products or service from
the business can only develop over time with a good name and “good word of mouth” (Schalk,
2008).
38
In a nutshell, both the behavioural and cultural dimensions are the critical component of MO.
Market orientation is vital for the success of the business in the long term. According, Pinho,
Rodrigues and Dibb (2014) the essence of MO is to generate a positive environment that supports
the business to meet customer’s needs. Literature on this shows that the main objective of market
orientation is to generate superior customer’s value, which is based on the information acquired
from the customers, the analysis of the rivals, and the method in which data is obtained and
circulated in every part of the business (Kumar et al., 2011). Jaakkola, Frösén, Santala and
Vassinen (2009) explicate that MO involves the improvement of capabilities that help the business
to identifying market opportunities and customers’ preference.
Businesses that are market orientated can accomplish long-term profit by delivering superior value
to the customers through identifying their present and prospective needs, being aware of both the
strengths and plans of the rivals, showing coordinated effort, and quick response by introducing
new products and services to influence the market environment (Kazemian et al., 2014). In this
given, it is important for the SME owners/managers in the Mangaung Metropolitan Municipality
to implement MO if the future growth of the business and customers’ needs are vital to them.
While many studies have focused on both behavioural and cultural dimension of MO, this study
only concentrates on three of the cultural dimension of MO (customer orientation, competitor
orientation and inter-functional coordination) to find out the mediating effect of MO on the
leadership styles- performance relationship
3.5. THE ROLE OF THE EXTERNAL ENVIRONMENT
Various theoretical literature reveal that the significance of MO for SME performance relies on
environmental situation (Scholastica and Maurice, 2013). Nasiripirou, Raeissi and Hosseiini-
Fahraji (2012) state that external environment can be explained as uncontrollable external elements
that have an impact on organisation activities and performance. According to Day and Wensley
(1988), examining moderating effect of the business environment on a MO performance
relationship is imperative. Marketing theorists have traced the role of external environmental
components and established that they can moderate MO’s impact on organisations performance
(Gatignon and Xuereb, 1997; Greenley, 1995; Grewal and Tansuah, 2001; Han, Kim and
Srivastava, 1998, Jaworski and Kohli, 1993, Slater and Narver, 1994; Voss and Voos, 2000).

39
Jaiyeoba (2013) draws attention to the fact that the external environment in which the firms operate
is challenging and constantly experience changes, and a notable feature of external environment is
competition. Authors like Narver and Slater (1990); Zuniga-Vincente, de la Fuente, Sabate and
Suarez-Gonzalez (2004) contend that competitive environment moderates the relationship
between MO and SME performance. Moreover, the external environmental elements such market
turbulence, technological turbulence, and competitive intensity moderate the strength of the
correlation among MO and firm’s performance (Murray, Gao and Kotabe, 2010). More details of
these moderators are discussed below.
3.5.1. Market turbulence
According to (Jaworski and Kohli, 1993; Narver and Slater, 1994) market turbulence can be
defined as the level of change in the formation of consumers, their desires and preferences.
Charles, Joel and Samwel (2012) posit that market turbulence can also refer to the changes in the
composition of customer’s taste and the steadiness of their preferences. Lam (2007) expounds that
businesses that are functioning in a highly turbulence environment are required to modify their
products and services in order to meet the ever changing needs and demands of the consumers.
Organisations that are capable of predicting and meeting the customers’ needs and expectations
turn to enjoy better organisation performance (Momrak, 2012). Furthermore, businesses that are
highly market-orientated are capable of retaining more customer, and this in turn enhances the
performance of their business in the long run, particularly the ones in the highly turbulence
marketplace in which customers’ needs and expectations change frequently (Kumar, Jones,
Venkantesan and Leone, 2011). Kohli and Jaworski (1990) argue that in a stable business
environment where customers’ needs and expectations are unchanging, very minor alterations to
the marketing mix are required. A study conducted by Aziz and Yassin (2010) found that market
turbulence did not moderate the correlation between MO and a firms’ performance in Malaysian
SME Agro-food industry.
3.5.2. Competitive intensity
According to Kohli and Jaworski (1993) competitive intensity can be defined as a degree of
competition and resources possessed by the competitors, and the ability of the business to set itself
apart from competing businesses. Similarly, Charles et al. (2012) posit that competitive intensity

40
refers to the nature of competition the business has to deal with. Lam (2007) notes that firms
operating in highly competitive environments can be compelled to respond to the fluctuating needs
and preferences of the market, and consequently be more market orientated. While, in the high
competitive intensity, customers have plenty of choices at their disposal in order to meet their
changing needs and preferences (Kumar et al., 2011). As such, firms that are not market orientated
may lose customers to the rivals who are market orientated in the market, given that such MO is
likely to be a crucial factor to performance in the high competitive intensity industry (Kohli and
Jaworski, 1993). Firms that identify the existence and intensity of rivalry search for customer’s
information, evaluate such information and use it to their benefit. Jaiyeoba (2013) expounds that
the degree of competition ascertains which strategic actions and responses the business can
implement to respond to the intensity of competition. Aziz and Yassin (2010) found that
competitive intensity did not moderate the correlation between MO and a firm’s performance in
Malaysian SME Agro-food industry.
3.5.3. Technological turbulence
Narver and Slater (1994:51) defined technological turbulence as “the amount and unpredictability
of change in production or service technologies”. Charles et al. (2012) state that technological
turbulence can be explained as the rate of technological alteration. Technological turbulence is
the source of transformation in products or service processes. According to Scholastica and
Maurice (2013), firms that employ fast changing technology can gain competitive advantage
through technological innovation in conjunction with MO. Similarly, firms that make use of the
nascent technology which experience prompt change can gain competitive advantage by means of
technological innovation, thereby decreasing but not getting rid of MO (Kohli and Jaworski, 1990).
Kumar et al. (2011) established that in the markets experiencing high technological turbulence, the
features of the offerings are predominantly determined by innovation both internal and external in
the industry. In such situations, learning orientation and information concerning customer’s
preferences do not contribute to long term performance. Momrak (2012) argue that when
technological turbulence is high, organisations which are unable to maintain technological
alterations cannot survive, while those operating in the technological turbulence industry will
benefit from the superior performance effects by paying attention to the technological
improvement. To Kohli and Jaworski (1990), firms which employ steady technologies are not

41
well positioned to gain competitive advantage through technological innovation and thus depend
on MO to a larger degree. Abdallah and Persson (2014) found that technological turbulence have
a positive and significant influence on a SMEs novelty.
From the above, a conclusion can be reached that the external environment factors influence the
performance of business. As such, it is imperative for businesses to adjust to the changes in their
external environment to able to compete.
3.6. MARKET ORIENTATION AND SME PERFORMANCE
The impact of MO on the performance of the SMEs have been investigated extensively for more
than a decade following the work presented by Kohli and Jaworski (1990) and Narver and Slater
(1990). According to Ellis (2006) the relationship between MO and SME performance is well
documented. Suliyanto and Rahab (2012) affirm that several studies have established that MO
contributes to superior performance of a business. Thus, researchers (Narver and Slater, 1990;
Kohli and Jaworski, 1990; Han, Kim and Srivastava, 1998; Buniĉ, 2007; Opeda and Jaiyeoba,
2011) state that a higher degree of MO leads to enhanced SME performance. Similarly, other
studies (Deshpandé, Farley and Webster, 1993; Jaworski and Kohli, 1993; Slater and Narver,
1994) assert that a higher level of MO in the business leads to a short term increase in the sales
and profitability, market share, new products success, customer satisfaction and return on asset.
Scholastic and Maurine (2013) state that SME owners/managers who implement MO are very
cognisant that marketing is key and it will lead to the success of their business.
Nevertheless, empirical findings on the relationship between MO and SME performance has
produced mixed results. For example studies by (Narver and Slater, 2000; Narver and Slater, 1990;
Slater and Narver, 1994; Jaworski and Kohli, 1993; Li, Yongbin, Justin and Liu, 2008; Lings and
Greenly, 2009; Barnabas and Mekoth, 2010; Kelson, 2012; Jyoti and Sharma, 2012; Alizadeh,
Alipour and Hasanzadeh, 2013; Jaiyeoba, 2014; Protcko and Dornberger, 2014; Shehu, 2014)
found a positive relationship between MO and SME performance. Contrarily, other studies found
a negative relationship between MO and SME performance (Au and Tse, 1995; Demirbag, Lenny
Koh, Tatoglu and Zaim, 2006; Li et al., 2008; Ghani and Mahmood, 2011; Rehab, 2012; Otache
and Mahmood, 2015). Likewise, some empirical studies reported insignificant relationship
42
between MO and SME performance (Jimenez-Jimenez, Valle and Hernandez-Espallardo, 2008;
Merlo and Auh, 2009; De luca, Verona and Vicara, 201).
3.7. MEASURING MARKET ORIENTATION
MO have been measured using two scales namely: MKTOR and MARKOR. The MKTOR was
put forth by Narver and Slater (1990) while, MARKOR was proposed by Kohli et al. (1993).
As underscored by Narver and Slater (1990), MKTOR scale measurement scale composes of 15
items captured on a 7 points Likert scale. The three constructs which it measures are: inter-
functional coordination (5 items), customer orientation (6 items) and competitor orientation (4
items). Furthermore, Narver and Slater’s (1990) MKTOR scale included other additional 6 items
that were used to measure the long term perspective but putting more emphasis on profit.
Meanwhile, Kohli, Jaworski and Kumar’s (1993) MARKOR scale consists of 32 items, captured
on a 5 Likert scale. The three constructs which it measures are: intelligence generation (measured
with 10 items), dissemination of intelligence (measured with 8 items) and responsiveness
(measured with 14 items).
According to Kassie (2015), while these measurement scales are found to be theoretically valid
and consistent, there are nonetheless differences in opinions regarding which of them is a better
measure of MO. MARKOR scale accounted for the strong relationship of (r) 0.42 compared to a
weak relationship of (r) 0.28 when the scale was used, and the relationship of (r) 0.33 when mixed
scale was used (Kassie, 2015). Rojas-Madenz and Rod (2013) stress that while the two
measurements are good in terms of capturing the organisation’s MO; MKTOR is better than
MARKOR when subjective measures of performance are used to measure MO relationship. While
MARKOR is linked to the business behaviour, MKTOR is linked to employee’s behaviour.
3.8. CHAPTER SUMMARY
This chapter started with the review of the literature by discussing several definitions of MO. It
provided the theoretical background about the history of MO. The dimensions of MO from both
behavioural and cultural dimension by (Kohli and Jaworski, 1990; Narver and Slater, 1990) were
also discussed. The empirical studies conducted revealed that the three dimensions of MO have a
positive relationship with SME performance. The impact of MO on the performance of the

43
organisation was discussed in great details. Nevertheless, empirical findings on the relationship
between MO and SME performance has produced mixed results, as noted in the review of the
different literature.
Also, the chapter presented the external environmental factors that affect MO, such as market
turbulence, technological turbulence and competitive intensity. The literature studies pointed out
that these external environmental factors moderate the SME-performance relationship. The
chapter further discussed the influence of MO on the performance of the business. The last part
of the chapter talked about the measurement scales of MO. There are two dominant measurement
scales that are widely used in the literature, MKTOR and MARKOR. The next section that
follows, which is chapter four, provides a detailed discussion about the mediating effect of MO on
the leadership styles–performance relationship.
44
CHAPTER FOUR
THE MEDIATING EFFECT OF MARKET ORIENTATION ON THE
LEADERSHIP STYLES PERFORMANCE RELATIONSHIP
4.1. INTRODUCTION
The literature review in chapter two and three presented theoretical background on the study of
leadership and MO, which were instrumental in terms of establishing the influence of leadership
styles and MO on SME performance. Chapter two and three found that leadership styles and MO
enhance the performance of the business. Therefore, this chapter focuses on the mediating effect
of MO on the leadership style-performance relationship. This chapter begins with reviewing the
relationship between leadership styles and SME performance, as well as the relationship between
MO and SME performance. The chapter also establishes an integrated framework linking
leadership style and MO to SMEs performance. Additionally, the chapter formulates research
hypotheses based on the relationships established, and presents, a summary and conclusion based
on the overall chapter discussions.
4.2. MEDIATING EFFECT OF MARKET ORIENTATION ON THE LEADERSHIP
STYLES–PERFORMANCE RELATIONSHIP
Leadership has been identified as a key element in business. This entails that the ability of the top
management to plan, organise, control and execute various tasks depend on good leadership.
Despite achieving specified mission and objectives, a business owner has the responsibility to live
up to the commitments by ensuring that superior performance is achieved. Thus, it is crucial that
the business applies appropriate strategies in order to succeed in the attainment of goals, objectives
and superior performance to satisfy all the stakeholders. In the process of identifying the right
strategies, MO has emerged as one of the most widespread practices that businesses engage in their
quest to identify and meet customers need better than competitors. Consequently, effective leaders
are needed to help the business to deliver superior performance (Chiun, Mohamad and Ramayah
and Chai, 2015).

45
Lawal et al. (2014) state that leadership is one of the primary factors that enable the business to
survive, grow and adjust to environmental challenges. This is to say that the leadership styles of
SME owners/managers play an important role to the implementation of MO. Kassim and
Suluiman (2011) suggest that the leadership styles of top managers such as board of directors,
chief executives and top echelon executives have been identified as a key element for the
implementation of MO in businesses. Chiou and Chang (2009) assert that the leadership style of
a top management is vital for the establishment of market oriented workforce and the
organisational culture as whole. According to Menguc and Auh (2008), factors such as lack of
executive experience, management inability, a deficiency of functional integration, and the
prevalence of politics and power, hinders the creation of MO in businesses. Moreover, top
management is important in a business because they provide a supportive culture that allows MO
to flourish. Jaiyeoba (2013) elucidates that managers help to enhance MO by drawing attention to
market orientated attitude, behaviours, and reward systems, tolerating acceptable risk,
communicating effectively, embracing change, creating opportunities for staff empowerment but
circumvent formalisation, centralisation and interdepartmental conflict. Leadership styles of SME
owners/managers play a key role in fostering the formation and execution of MO within the
business. As such, top management leadership style influences the level of an organisation’s MO.
The more top management stresses the importance of MO, the risk aversion of managers become
less, and subsequently leads to enhanced level of MO.
Narver, Slater and Tietjie (1998) elucidate that top managers play a critical leadership role in
changing the organisational culture and also in ensuring that a business becomes market oriented.
Chiou and Chang (2009) contend that leadership is needed to reshape the organisational culture,
propose a challenging vision of the future, and set a performance improvement target.
Consequently, in order for SMEs to succeed and respond to customers’ needs, a good MO has to
be formulated. SMEs need good leaders who possess good leadership styles that will inspire their
employees to adopt and execute good marketing strategies and marketing practices that can give
the organisation the distinct competitive advantage in order to improve its performance and
generate profit.
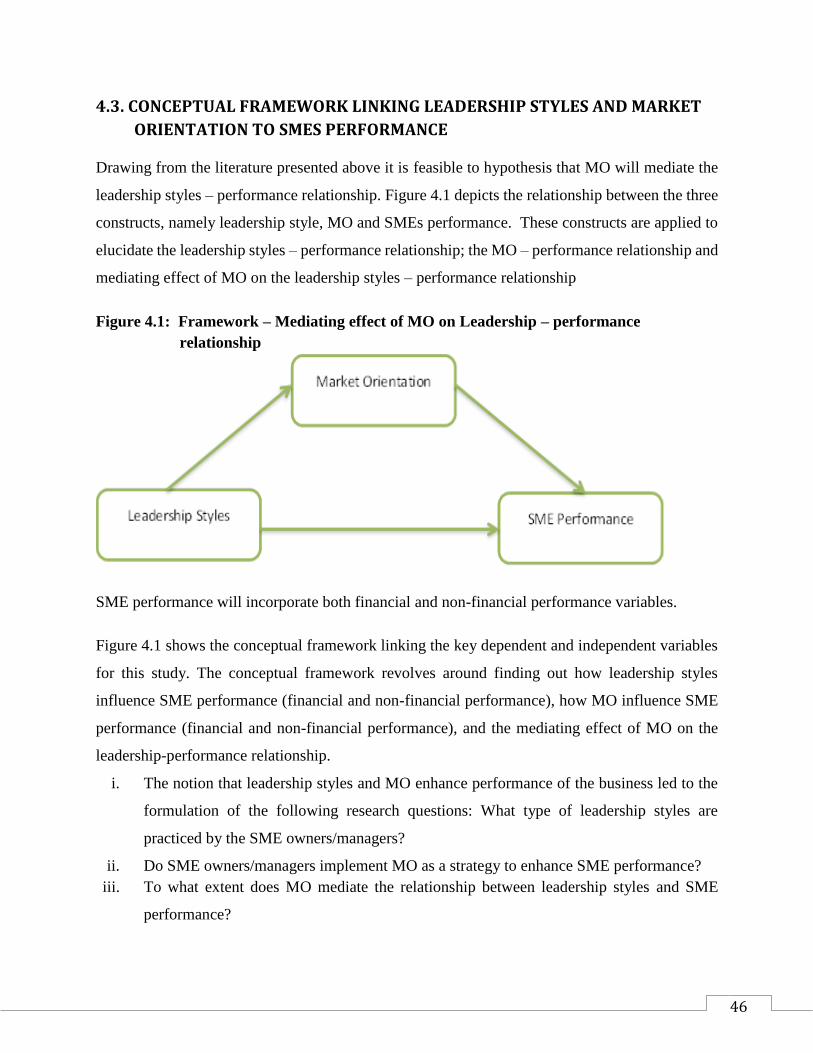
46
4.3. CONCEPTUAL FRAMEWORK LINKING LEADERSHIP STYLES AND MARKET
ORIENTATION TO SMES PERFORMANCE
Drawing from the literature presented above it is feasible to hypothesis that MO will mediate the
leadership styles – performance relationship. Figure 4.1 depicts the relationship between the three
constructs, namely leadership style, MO and SMEs performance. These constructs are applied to
elucidate the leadership styles – performance relationship; the MO – performance relationship and
mediating effect of MO on the leadership styles – performance relationship
Figure 4.1: Framework – Mediating effect of MO on Leadership – performance
relationship
SME performance will incorporate both financial and non-financial performance variables.
Figure 4.1 shows the conceptual framework linking the key dependent and independent variables
for this study. The conceptual framework revolves around finding out how leadership styles
influence SME performance (financial and non-financial performance), how MO influence SME
performance (financial and non-financial performance), and the mediating effect of MO on the
leadership-performance relationship.
i. The notion that leadership styles and MO enhance performance of the business led to the
formulation of the following research questions: What type of leadership styles are
practiced by the SME owners/managers?
ii. Do SME owners/managers implement MO as a strategy to enhance SME performance?
iii. To what extent does MO mediate the relationship between leadership styles and SME
performance?

47
4.4. RESEARCH HYPOTHESES
Based on the research questions stated above, this study formulated research hypotheses to find
out which leadership styles influence SME performance, how MO influence SME performance
and the mediating effect of MO on the leadership-performance relationship. These research
hypotheses are discussed in the table below.
Table 4.1: Research hypothesis
Leadership style and SMEs performance (financial and non-financial performance)
H1a: There is a negative relationship between
directive leadership style and financial
performance.
H1b: There is a negative relationship between
directive leadership style and non-financial
performance.
H2a: There is a significant positive relationship
between supportive leadership style and
financial performance.
H2b: There is a significant positive
relationship between supportive leadership
style and non-financial performance.
H3: There is a significant positive relationship
between participative leadership style and
financial performance.
H3b: There is a significant positive relationship
between participative leadership style and non-
financial performance.
H4a: There is a significant positive relationship
between achievement orientated leadership
style and financial performance.
H4b: There is a significant positive relationship
between achievement orientated leadership
style and non-financial performance.
H5a: There is a negative relationship between
autocratic leadership style and financial
performance.
H5b: There is a negative relationship between
autocratic leadership style and non-financial
performance.
H6a: There is a significant positive relationship
between consultative leadership style and
financial performance.
H6b: There is a significant positive
relationship between consultative leadership
style and non-financial performance.
H7a: There is a significant positive relationship
between democratic leadership style and
financial performance.
H8a: There is a significant negative
relationship between laissez-fair leadership
style and financial performance.

48
H7b: There is a significant positive
relationship between democratic leadership
style and non- financial performance.
H8b: There is a significant negative
relationship between laissez-fair leadership
style and non- financial performance
H9a: There is no significant relationship
between pace setting leadership style and
financial performance.
H9b: There is no significant relationship
between pace setting leadership style and non-
financial performance.
H10a: There is a significant positive
relationship between transformational
leadership style and financial performance.
H10b: There is a significant positive
relationship between transformational
leadership style and non-financial performance.
H11a: There is a positive relationship between transactional leadership style and financial
performance.
H11b: There is a positive relationship between transactional leadership style and non-financial
performance.
MO and SME performance
H12a: There is a significant and positive
relationship between customer orientation and
financial performance.
H12b: There is a significant and positive
relationship between customer orientation and
non-financial performance.
H13a: There is a significant positive
relationship between competitor orientation and
non-financial performance.
H13b: There is a significant positive
relationship between competitor orientation and
non-financial performance.
H14a: There is no significant relationship between inter-functional coordination and financial
performance.
H14b: There is no significant relationship between inter-functional coordination and non-
financial performance.
Leadership styles, MO and SME performance
H15: MO mediate the relationship between leadership styles and SME performance
(financial and non-financial performance)
49
From the above, it can be concluded that the influence of leadership styles and MO is vital for the
growth and survival of the SMEs. As such, in the absence of the two constructs the business cannot
prosper. Furthermore, the literature review demonstrated that leadership plays an imperative role
in directing activities of the business towards implementation of a successful MO. Consequently,
MO enhances SME performance in terms of improved sales, market share, profitability and the
delivery of products and services that add superior value to customer. Also, MO mediates the
relationship between leadership styles and SME performance. Hence, it is crucial for SME
owners/managers to understand the importance MO and leadership styles in order to sustain the
business, satisfy customers, and stay ahead of competitors in the industry.
4.5. CHAPTER SUMMARY
This chapter discussed the mediating effect of MO on leadership style-performance relationship.
The literature pointed out that leadership styles of SME owners/managers contribute significantly
to the construction of MO, while MO leads to improved SME performance. The combination of
leadership styles and MO gives the business competitive advantage over rival. However, the
relationship between leadership styles and SME performance is mediated by MO as depicted in
figure 4.1. The chapter also presented the research hypothesis, where from it concluded about
about the influence of leadership and MO on the performance of the business. That chapter that
follows presents in depth the research methodology used in this study.

50
CHAPTER FIVE
RESEARCH METHODOLOGY
5.1. INTRODUCTION
The objective of this chapter is to provide a detailed discussion of the research methodology
applied in this study. The research methodology used in this study is adopted from the business
research process, and the various perspectives of the research methodology covered in this chapter
are divided into five step. Step one presents the problem statement and objectives of the study.
Step two provides a detailed discussion of the different types of research design. Step three will
discuss sampling methods used in this research. Step four presents data collection methods used
in this study to gather information, and step five discusses the data analysis techniques used in this
study.
5.2. THE BUSINESS RESEARCH PROCESS
Sekaran and Bougie (2013:3) define business research process as an “organised, systematic, data-
based, critical, objective, inquiry or investigation into a specific problem, undertaken with the
purposed of finding answers or solution to it”. Research process can be explained as a method
used by the researchers to conduct a research (Quinlan, 2011:4). Figure 5.1 below presents the
various stages in business research process.

51
Figure 5.1: Stages in the business research process
Source: Adopted and modified from Neneh (2011)
Business Research Process
Identification of the:-
-Research Problem
-Research Objectives
-Research Hypothesis
Qualitative
Research
Quantitative
Research
Research
Design
Sample
Selection
Population
Sample Design
Sample Size
Data Collection Interviews Questionnaire
Design and
Administration
Data Analysis Software used
SPSS
Descriptive
Statistics,
Correlation,
Chi Square, t-
test, Anova,
Pearson
Mixed
Research

52
5.2.1. Problem statement and research objectives
5.2.1.1. Stage 1 Problem statement
According to Sekaran and Bougie (2009:45) problem statement identifies key issues such as
general objectives and research questions that must be addressed by the study. A problem
statement has to be unambiguous, detailed, and concise statement that pinpoints particular issues
the researcher desires to probe. Cooper and Schindler (2011:567) purport that problem statement
encompasses the need why the research has to be carried out. Also, the problem is characterised
by the research question and subsequently the objectives of the study.
The primary motive of carrying out this research arises from the fact that SMEs in the globe and
South Africa are failing at a high rate due to poor leadership and lack of understating the
importance of MO within the firms by owners/managers. According to Ntsika Enterprise
Promotion Agency (2009) South Africa requires enormous growth to be able to create enough
employment opportunities for its citizens to bring down unemployment rate and poverty.
Dubihlela (2012) is of the opinion that the South African government perceives SMEs as key
factors to drive economic development across all sectors and geographic areas in the country.
The problem statement was stated in chapter one of this study (See section 1.2)
5.2.1.2. Hypotheses
According to Cooper and Schindler (2006:43) hypotheses can be defined as a statement made
about a perceived occurrence which might be considered to be correct or incorrect. Saunders,
Lewis and Thornhill (2012:174) assert that an experiment make use of hypotheses to predict as
oppose to research questions. This happens because researchers are already predicting whether
there will be a relationship or not amongst two variables observed. As a consequence, two
hypotheses known as null hypotheses and alternative hypotheses are used to test the strength of
the relationship. This study formulated 15 hypotheses to investigate the relationship between
leadership styles and SME performance; MO and SME performance and mediating effect of MO
on the leadership styles – performance relationship

53
5.2.1.3. Research objectives
According to Cooper and Schindler (2011:96) research objectives reveal the purpose of conducting
the investigation for research project. Quinlan (2011:140) points out that research objectives refer
to a set of steps followed by a researcher to ensure that the objectives of the research are attained.
The primary objective of this study was to examine the mediating effects of MO on the leadership-
performance relationship.
This objective of was obtained by formulating secondary objectives below.
i. To assess theories and concepts on leadership styles
ii. To review theoretical studies on market orientation
iii. To find out which types of leadership is practiced by SMEs owners
iv. To determine whether SMEs owners engage in MO and which type of market orientation
they engage in.
v. To determine which type of leaderships styles are essential to enhance the performance of
the SMEs.
vi. To find out the mediating effects of MO on the leadership styles- performance relationship
vii. To establish a conceptual framework linking key leaderships styles and market orientation
that enhance SMEs’ performance.
5.2.2. Stage 2 Research design
Dubihlela (2012) explains research design as a process or plan of action used by the researcher to
implement the research project. Mitchell and Jolley (2010) state that research design gives a
detailed explanation on how the research will be carried out. Also, the option of research design is
controlled by the objectives of the research and the research structure. According to Cooper and
Schindler (2014:152) research design is the “plan and structure of investigation so conceived as to
obtain answers to research question. The plan is the overall scheme and program of the research.
It includes an outline of what the investigator will do from writing hypotheses and their operational
implications to the final analysis of data”. More so, Nsubuga (2008) refers to research design as a
process that explains in details how the planned study is going to be executed operationalising
variables so that they can be measured, decide on the sample size for the study; gather the

54
information required for testing hypothesis, and analysis of the results. There are three types of
research design, namely qualitative, quantitative, and mixed research.
Qualitative research
According to Cooper and Schindler (2006:196) qualitative research refers to the “array of
interpretive techniques which seek to describe, decode, translate, and otherwise come to terms with
the meaning, not the frequency, of certain more or less naturally occurring phenomena in the social
world”. Nsubuga (2008) posits that qualitative research can be described as a descriptive data
management predominately used to manage the information gathered through the interview and
other secondary sources which cannot be gathered using quantitative research. Tango (2012)
affirms that qualitative research gathers the information which is difficult to analyse. The
information is acquired from individual cases or small samples. Hence, the information acquired
is analysed inaccurately and the analytic methods that are used produce interpretive and biased
findings.
Quantitative research
According to Cant (2010:73) quantitative research can be defined as the construction of statistics
or significant information from a wide range survey with the objective of projecting the findings
to a broader population. Harwell (2011) notes that researchers use quantitative research mainly
because it involves the ability of the researcher to be impartial. Furthermore, Harwell (2011) states
that the important characteristics of quantitative research encompasses the use of questionnaires
for survey in order to gather information, by making use of statistical methods to test hypotheses
that are linked to the objectives of the study. Dubihlela (2012) concur that quantitative research
includes numbers and use statistical programs to analyse the information gathered, and it is linked
with positivist research view. Williams (2007) argues that quantitative research do not rely on
the researched phenomenon. Hence, it is the most used research method by researchers in the
empirical study. The difference between qualitative and quantitative research is explained in table
5.2 below.
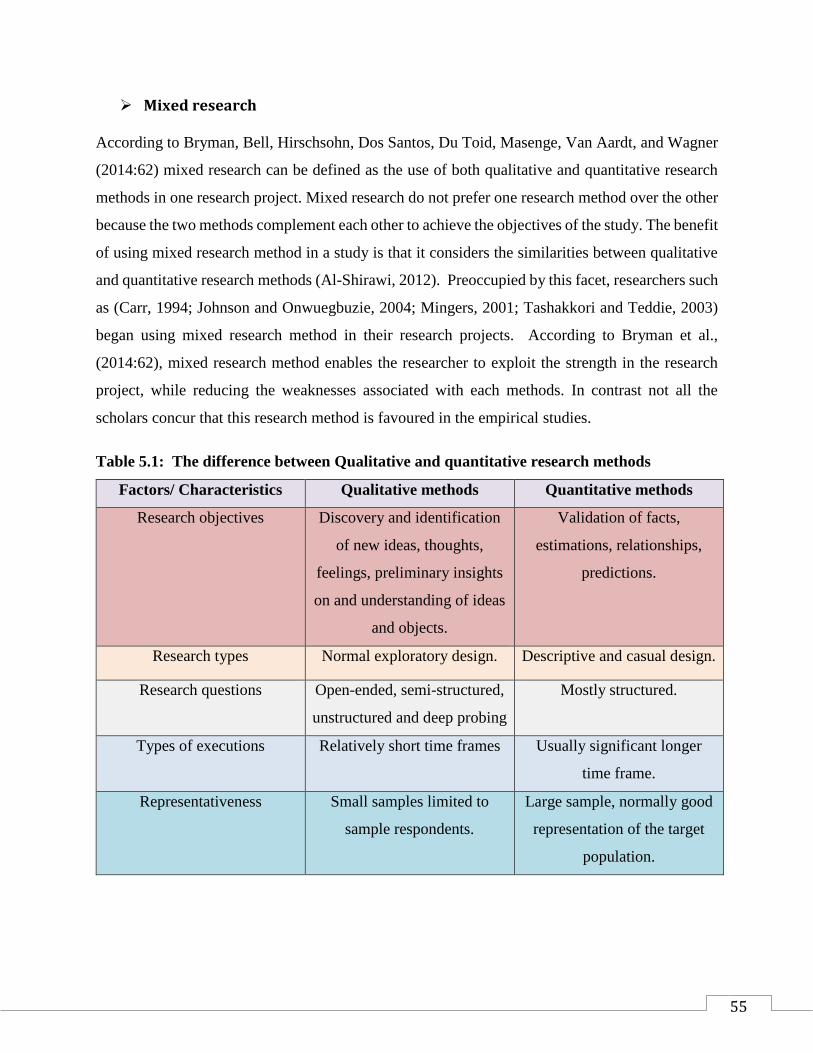
55
Mixed research
According to Bryman, Bell, Hirschsohn, Dos Santos, Du Toid, Masenge, Van Aardt, and Wagner
(2014:62) mixed research can be defined as the use of both qualitative and quantitative research
methods in one research project. Mixed research do not prefer one research method over the other
because the two methods complement each other to achieve the objectives of the study. The benefit
of using mixed research method in a study is that it considers the similarities between qualitative
and quantitative research methods (Al-Shirawi, 2012). Preoccupied by this facet, researchers such
as (Carr, 1994; Johnson and Onwuegbuzie, 2004; Mingers, 2001; Tashakkori and Teddie, 2003)
began using mixed research method in their research projects. According to Bryman et al.,
(2014:62), mixed research method enables the researcher to exploit the strength in the research
project, while reducing the weaknesses associated with each methods. In contrast not all the
scholars concur that this research method is favoured in the empirical studies.
Table 5.1: The difference between Qualitative and quantitative research methods
Factors/ Characteristics Qualitative methods Quantitative methods
Research objectives Discovery and identification
of new ideas, thoughts,
feelings, preliminary insights
on and understanding of ideas
and objects.
Validation of facts,
estimations, relationships,
predictions.
Research types Normal exploratory design. Descriptive and casual design.
Research questions Open-ended, semi-structured,
unstructured and deep probing
Mostly structured.
Types of executions Relatively short time frames Usually significant longer
time frame.
Representativeness Small samples limited to
sample respondents.
Large sample, normally good
representation of the target
population.

56
Types of analysis Debriefing, subjective,
content, interpretative,
semiotic analysis.
Statistical, descriptive, casual
predictions and relationships.
Research skills Interpersonal communication,
observations, and
interpretative skills.
Statistical, scientific
procedure translation skills;
subjective interpretive skills.
Generalisability of results Very limited only preliminary
insights and understanding.
Usually very good, inferences
about facts, estimates of
relationships.
Source: Dubihlela (2012:185)
According to Bryman and Bell (2007:154) quantitative research concerns the gathering of
numerical information and indicate existing links between theory and research as inference, and
this isa preference appropriate for natural science methods and not bias to the notion of the natural
reality. In line with Bryman and Bell (2007), this study adopted quantitative research approach
because it was conducted among 299 SMEs in the Mangaung Metropolitan Municipality.
According to Matveev (2002) quantitative research has six strengths and four weaknesses. The
strengths are:
It is specific in terms of stating research problem and set terms.
Unambiguously and specific in identifying both the independent and dependent variables
investigated.
It follows the original set of objective to make unbiased conclusion, tests hypotheses, decide
on the issues of causality.
Accomplish a high degree of reliability of information collected because of managed
observation.
Exclude or reduce the unbiased of the result.
Allows a longitudinal measure of the following research topic.
Also, the weaknesses of quantitative research are as follow:
Inability to give the researcher information on the perspective of the situation where the
researched phenomenon took place.

57
Unable to manage the environment where the participants are answering questionnaires.
The results are limited to people defined in research proposal due to the type of questions asked
and the structure of the questionnaires.
It does not promote the ongoing investigation of the research phenomenon.
Basically, quantitative research or qualitative research or both comprise of three types of research,
depending on the information required by the research problem. The three types of research are
exploratory, descriptive and casual.
Exploratory research: De Vos, Strydom, Fouche, and Delport (2011:95) state that
exploratory research can be piloted mainly to get more information about the situation,
phenomenon, community or people, or to be familiar with the situation in order to enable
the formulation of the problem and hypothesis. Sekaran and Bougie (2009:103) assert that
exploratory research can be conducted when little is known about the present situation, or
the researcher cannot find the information that was used previously to deal with the
identical problem or research issues. Zikmund, Babir, and Griffin (2010:54) state that
exploratory research is predominately used to simplify uncertain situations or bring to light
business opportunities. This is to say that exploratory research does not give definite
evidence from which a plan or action can be carried out. According to Babbie (2014:91)
exploratory research is conducted for the following reasons;
To fulfil the researcher’s interest and wish for better understanding.
To investigate the likelihood of undertaking a more extensive study.
To develop techniques to be used in the study that will be carried out later.
Descriptive research: According to Sekaran and Bougie (2009:105) descriptive study can
be explained as the study conducted to find out and define key components of the variables
that are important with a situation. Moreover, Sekeran and Bougie (2013:97) point out that
descriptive research is mainly intended to collect the information that enables the
researcher to explain the features of people, events, or situation. Essentially, descriptive
research can be either qualitative or quantitative. Basically, there are two types of
descriptive research, namely cross-sectional and longitudinal. According to Bryman and
Bell (2003:48) cross-sectional research design is a “collection of data on more than one

58
case and at a single point in time in order to collect a body of quantitative or quantifiable
data connection with two or more variable, which are then examined to detect patterns of
association”. Longitudinal research design is mostly preferred to plan change and to think
about methods which can be used to create change within the organisation (Bryman and
Bell, 2011:109). According to Cooper and Schindler (2006:141) there are two types of
longitudinal studies, namely panel and cohort groups. In Panel group, the researcher can
study the same group of people using this method. While in Cohort groups, the researcher
can use a variety of subjects per sequenced measurement. According to Quinlan
(2011:399) researchers use descriptive statistics to explain the information collected from
the respondents. This study employed cross-sectional method because the researcher
collected information from the respondents once, probably for days or weeks, if not months
to provide answers to the research questions and objectives (Sekaran and Bougie,
2016:104).
Causal research: Sekaran and Bougie (2009:110) define causal research as a study in
which the researcher wishes to explain the root cause of one or other problems. Casual
research enables researchers to make causal conclusion while investigating the cause and
effect relationship (Zikmund et al., 2010:57). According to Cooper and Schindler
(2006:141), causal study seeks to clarify the existing relationship amongst variables. This
study used causal research because it sought to ascertain the relationship between
leadership styles and SMEs performance and the mediating effect of MO
5.2.3. Stage 3 Sample selection
Cooper and Schindler (2014:338) state that the core of sampling is to choose components within
the targeted population. According to Salant and Dillman (1994:54), sample selection takes into
consideration the following: size of the population, homogeneity, and sample media, which
includes the cost of use and degree of accuracy required. People who are part of the survey are
randomly chosen because all of them stand the equal chance of being chosen (Salant and Dillman,
1994:13). Sample selection encompasses the population, sample design and sample size, as
expounded below.

59
5.2.3.1. Population
Population refers to the group of people about whom the data for the study is required. Population
can be described as a known component of interest to the researcher, and the researcher can make
conclusions about the population being investigated (Dubihlela, 2012). According Zindiye (2008)
population is defined as the total number of people or institutions which are necessary for obtaining
information. For this study the population of interest comprised of SMEs operating in the
Mangaung Metropolitan Municipality (Bloemfontein, Botshabelo, and Thaba Nchu). According
to Centlec there are about 4 400 businesses operating in the Mangaung Metropolitan Municipality.
Out of the 4 400 businesses operating in the Manguang Metropolitan Municipality, a sample size
of 354 was used for this study based on calculations obtained when using the Raosoft sample size
calculator.
Given that Bloemfontein is the Centre of the economic activities and the capital city of Free State,
190 questionnaires were distributed amongst the SMEs owners/managers operating in the city. The
remaining 164 questionnaires were distributed amongst the SMEs owners/managers in Botshabelo
and Thaba ‘Nchu because of the small number of business activities in these areas. The sample
size was selected and limited to these places due to time constraint and limited resources.
Nonetheless, the sample size was big enough to enable the researcher to produce accurate results.
5.2.3.2. Types of sampling design
Sekaran and Bougie (2009:267) and Quinlan (2011:209) identify two main categories of sampling
design, which are probability and non-probability sampling. According to Cooper and Schindler
(2014:343) probability sampling is mainly based on the chance of being selected and it uses
controlled processes that give population components the assurance that they stand a non-zero
chance of being selected. On the contrary, non-probability sampling is based on the random
selection, though the population components do not know if they stand a chance of being selected.

60
Figure 5.2: Probability and non-probability sampling design
This study made use of a combination of probability (stratified sampling) and non probability
sampling (convenience and snowball sampling design). According to Quinlan (2011:210)
stratified random sampling is the sample chosen by the researcher based on some known elements
of the population, and elements that will influence the outcome of the research. Bryman and Bell
(2007:188) suggest that stratified random sampling can only be used if the pertinent information
about the targeted population is easily reached. In addition, when the information is attainable
enables the researcher to identify members of the targeted population using stratified criteria, then
stratified sample method can be used (Bryman and Bell, 2007:188). According to Cresswell et al.
(2011:177) convenience sampling is used when the population elements are chosen because they
are easy and convenience to contact. Zikmund et al. (2010:396) explains that convenience
sampling is a sampling procedure used in the research project to acquire people or units that are
conveniently available. Convenience sampling procedure is mostly used in the exploratory
research when studies that are conducted use probability sample. Zikmund, Babin, Carr and
Graffin (2013:395) state that snowball sampling encompasses the use of probability method
whereby the first participants are chosen using probability methods and more participants are
acquired through the information supplied by the first participants.
Owing to the fact that there is no available list of SMEs operating in the Mangaung Metropolitan
Municipality, the researcher used the yellow page directory to identify and comply a list of
businesses located in the Mangaung Metropolitan Municipality complied. Stratified sampling

61
ensured that each SME owners/managers within a specific business sector had an equal chance of
being selected. Also, the researcher attended events organised by the Business School,
Entrepreneurial Developmental Program (EDP) and Network of Entrepreneurs Practitioners and
Academics in Business (NEPAB) that was hosted at the University of the Free State in 2016, where
the researcher issued questionnaires to all the SMEs owners/managers who attended the program.
Convenience sample allowed the researcher to collect data directly from SME owners/managers
that attended the EDP and NEPAB program at the University of the Free State. Snowball sampling
method was later applied from the referrals obtained from the SMEs owners/managers who
attended the Entrepreneurial Developmental Program (EDP) and Network of Entrepreneurs
Practitioners and Academics in Business (NEPAB) at the University of the Free State., as they
referred the researcher to others SMEs owners/managers operating in the Mangaung Metropolitan
Municipality.
5.2.4. Stage 4 Data collection
Quinlan (2011:4) states that data collection is the process used to collect information for the study
being conducted. Similarly, Cooper and Schindler (2011:432) affirm that data collection methods
explain the “specifics of gathering the data”. Basically, there are two types of data collection
methods namely: primary and secondary data collection. Primary data involves data gathered and
assembled for a research project at hand by the researcher. There are three types of primary data
collection methods, namely: observation, experiment, and survey methods.
5.2.4.1. Primary data
According to Sekaran and Bougie (2013:113) primary data is the information acquired for the first
time by the researcher on the variables of interest in order to achieve a particular goal for the
research. Copper and Schindler (2011:499) state that primary data is the “original search where
the data being collected are designed specifically to answer the research questions”. Other
techniques of collecting primary data comprise of questionnaires, checklists, surveys, interviews,
observations, focus groups, case studies and documentation review (Neneh, 2011). This study
made use of the primary data collection techniques discussed below.

62
Interviews
According to De Vos et al., (2011:342) interviews are the extensively used method of collecting
data in the qualitative research. The researcher acquires information by means of direct
engagement with people who have the information required for the research. Since this study
centred on leadership styles, MO and SMEs performance, the researcher employed interview
techniques to allow respondents to express their personal experiences about leadership styles, MO
and SME performance in order to get more information required for the study. According to
Shneiderman and Plaisant (2005) conducting an interview has the following advantages for data
collection:
One on one personal communication with the respondents which leads to obtaining specific
and constructive information.
They are very useful in terms of obtaining detailed information required for the research.
A detailed and more information can be gathered when few respondents are used.
Questionnaires
Questionnaires can be defined as an important document that has questions that are presented to
the respondents in order to get crucial information for data analysis (Babbie, 2007:246).
According to De Vos et al. (2011:188), self-administered questionnaires are described as
questionnaires that are given to the participants, and participants are requested to complete them
on their own. However, the researcher is present to help if participants encounter the difficulties
of understanding the questions. Fundamentally, there are two types of questionnaires, namely
structured questions and fixed unstructured questions. Structured questions refer to questions that
do not allow respondents to answer limited set of fixed questions. In contrast, unstructured
questions are described as question that are posed to the respondents and give them the opportunity
to respond whichever way they desire (Bryman et al., 2014:199). This study used structured
questions because the respondents had to answer a specific set of questions formulated by
researcher.
The researcher delivered questionnaire personally to all the SMEs that were selected for this study
and explained to respondents how to answer the questionnaires. Following the delivery of the
questionnaire, the researcher asked for the names and contact details of the respondents in order
63
to call them back, send sms’s and WhatsApp texts to remind them to complete questionnaires.
Respondents were given the time frame of three weeks to complete the questionnaires. According
to Burns and Bush (2006:300) questionnaires enables the researcher to achieve the following:
It enables the researcher to interpret research goals into specific questions.
It allowed consistent questions and response categories in order for respondents to answer to
the similar stimuli.
Based on the wording, question flow and appearance, it encourages collaboration and kept
participant motivated throughout the course of the interview.
Questionnaires are used as a permanent record of the research project.
The questionnaires are important in ensuring data analysis is conducted speedily.
The questionnaires have information about reliability assessment, which can be used in the
follow up validation of respondents’ participation in the survey.
For the purpose of this study, both structured questionnaires and interviews were used because the
researcher formulated questionnaires and delivered them to the respondents to complete.
5.2.4.2. Secondary data
According to Quinlan (2011:240) secondary data refers to the information that was already created,
which the researcher did not create. Zikmund et al. (2013:160) purport that secondary data is the
information which has been gathered beforehand for other intentions than the one at hand. For
example, secondary data sources used for this study included textbooks, published articles,
dissertations, internet sources, and other relevant secondary data sources related to this study.
5.2.4.2.1. Questionnaire design
In terms of data collection, this study used valid and reliable structured questionnaires formulated
by the researcher. The questionnaires enabled the researcher to gather information required for the
study. The questionnaires were structured in such that the respondents were be able to complete
them (Quinlan, 2011:336).

64
5.2.4.2.2. Questionnaires layout
The questionnaires composed of five section, and the layout is explained below:
Section A: The questions in this section are based on the descriptive/demographics details of the
SME owners/managers.
Section B: The questions in this section talked about the nature of the business operated by the
SME owners/managers, the type of industry in which the business competes, the number of people
employed per business, start-up capital, and the push and pull factors that encouraged the
entrepreneur to start the business. This sections also required the experience of the owner/manager
in the sector the business operate and whether participant’s family member had ever owned or
operated a business.
Section C: The questions in this section addressed the different leadership styles practiced by the
SME owners/managers and their impact on the performance of the business.
Section D: The questions in this section focused on the impact of MO on the performance of the
SMEs.
Section E: The questions in this section were based on the overall performance of the SMEs.
5.2.4.3.2.3. Pilot study (Pre-testing of the questionnaires)
According to Maholtra (2010:153) pilot study/pre-test refers to the pre-testing of the
questionnaires using a limited sample size of the targeted population in order to identify problems
they may encounter about the content and validity of the questionnaires. Quinlan (2011:273) notes
that pilot study is the method used by many researchers to enhance the validity of the research
project. This study used pre-testing method to address the problems raised by respondents about
the content and validity of the questions. Thus, fifteen questionnaire were distributed among SMEs
owners/managers in Bloemfontein to complete and express their honest opinion about the content
of the questions. Subsequently, the research used the feedback gotten from the respondents to
make sure they are unambiguous and easy to answer.

65
5.2.5. Measurements techniques
Various leadership styles, components of MO from behavioural and cultural perspectives, financial
and non-financial performance measurements were used to measure business performance. These
variables were put in the 1-to-5 Linkert scale questionnaire to measure the extent to which the
respondents perceive the influence of leadership styles, MO, financial and non-financial
performance measurements on the performance of their businesses.
Measurement Studies drawn from
Leadership styles
Directive leadership style
Supportive leadership style
Participative leadership style
Achievement oriented leadership style
Autocratic leadership style
Consultative leadership style
Democratic leadership style
Laissez-faire leadership style
Pace setting leadership style
Coaching leadership style
Visionary leadership style
Transformational leadership style
Transactional leadership style
Mugsood et al. (2013)
William (2014)
Murdoch (2013)
Negron (2008)
Jogulu and Woods (2009)
Jong and Hartog (2007)
Belias and Koustelious (2014)
Van Der Walt (2015)
Constantin and Brancusi (2013)
Spreier, Fontaine and Malloy (2006)
Mohamad and Chiun Lo (2012)
Zopiatis and Constati (2010)
Arham, Boucher and Muenjohn (2013
Market Orientation (MO)
Generation of market intelligence
Dissemination of intelligence
Organisational response
Kohli and Jaworski (1990)
Customer orientation
Competitor orientation
Inter-functional coordination
Naver and Slater (1990)
SME performance
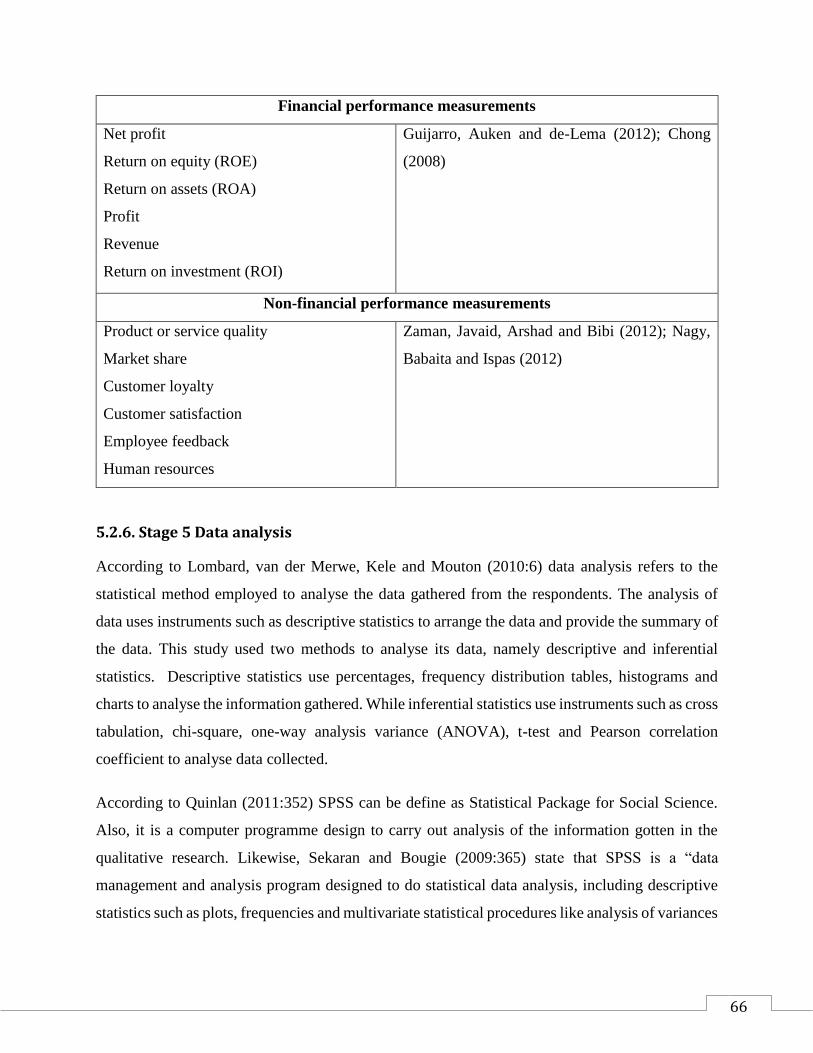
66
Financial performance measurements
Net profit
Return on equity (ROE)
Return on assets (ROA)
Profit
Revenue
Return on investment (ROI)
Guijarro, Auken and de-Lema (2012); Chong
(2008)
Non-financial performance measurements
Product or service quality
Market share
Customer loyalty
Customer satisfaction
Employee feedback
Human resources
Zaman, Javaid, Arshad and Bibi (2012); Nagy,
Babaita and Ispas (2012)
5.2.6. Stage 5 Data analysis
According to Lombard, van der Merwe, Kele and Mouton (2010:6) data analysis refers to the
statistical method employed to analyse the data gathered from the respondents. The analysis of
data uses instruments such as descriptive statistics to arrange the data and provide the summary of
the data. This study used two methods to analyse its data, namely descriptive and inferential
statistics. Descriptive statistics use percentages, frequency distribution tables, histograms and
charts to analyse the information gathered. While inferential statistics use instruments such as cross
tabulation, chi-square, one-way analysis variance (ANOVA), t-test and Pearson correlation
coefficient to analyse data collected.
According to Quinlan (2011:352) SPSS can be define as Statistical Package for Social Science.
Also, it is a computer programme design to carry out analysis of the information gotten in the
qualitative research. Likewise, Sekaran and Bougie (2009:365) state that SPSS is a “data
management and analysis program designed to do statistical data analysis, including descriptive
statistics such as plots, frequencies and multivariate statistical procedures like analysis of variances

67
(ANOVA), factor analysis, cluster analysis and categorical data analysis”. This study made use
of SPSS to analyse the data gathered from the respondents.
5.2.6.1. Descriptive statistics
Waller (2008:188) noted that descriptive statistics can be define as a “collection and the analysis
of the data set in order to characterise the sampled dataset”. Descriptive statistics plays a key role
in supporting the characteristics or appearance of the sample data. Descriptive statistical analysis
can alter raw data into a new form of data that can be analysed and interpreted without difficulties
(Dubihlela, 2012). According to Creswell et al., (2011:19) descriptive statistics sums up the
information in the following ways:
Through location or centrality (mean, mode and median).
Through dispersion (the range, the variance, and the standard deviation – the spread of data
around the average).
Through the measures of shape (skewness and kurtosis).
The descriptive statistics techniques employed in this study included frequency distributions,
proportions, measures of central tendency, and measures of dispersion.
5.2.6.2. Inferential statistics
According to Lombard et al., (2010:3) inferential statistics can be defined as the statistical method
used to acquire, organise and summarised information. Taylor (2007:6) points out that inferential
statistics refers to the data gotten from the sample size of the targeted population, which can be
used for analysis in orders to produce a sample statistic from which the values of the parent
population can be inferred. This study made use of the inferential statistics techniques such as
cross tabulation, Chi square, Analysis of variances (ANOVA), t-test, and Pearson correlation
coefficient, as explained below;
Cross tabulation : Creswell et al. (2010:185) state that cross tabulation is useful in terms
of grouping participants based on two qualitative variables. According to Zikmund et al.
(2013:486) cross tabulation is regarded as a suitable method predominately used for
dealing with research questions that concerns the relationship amongst less interval
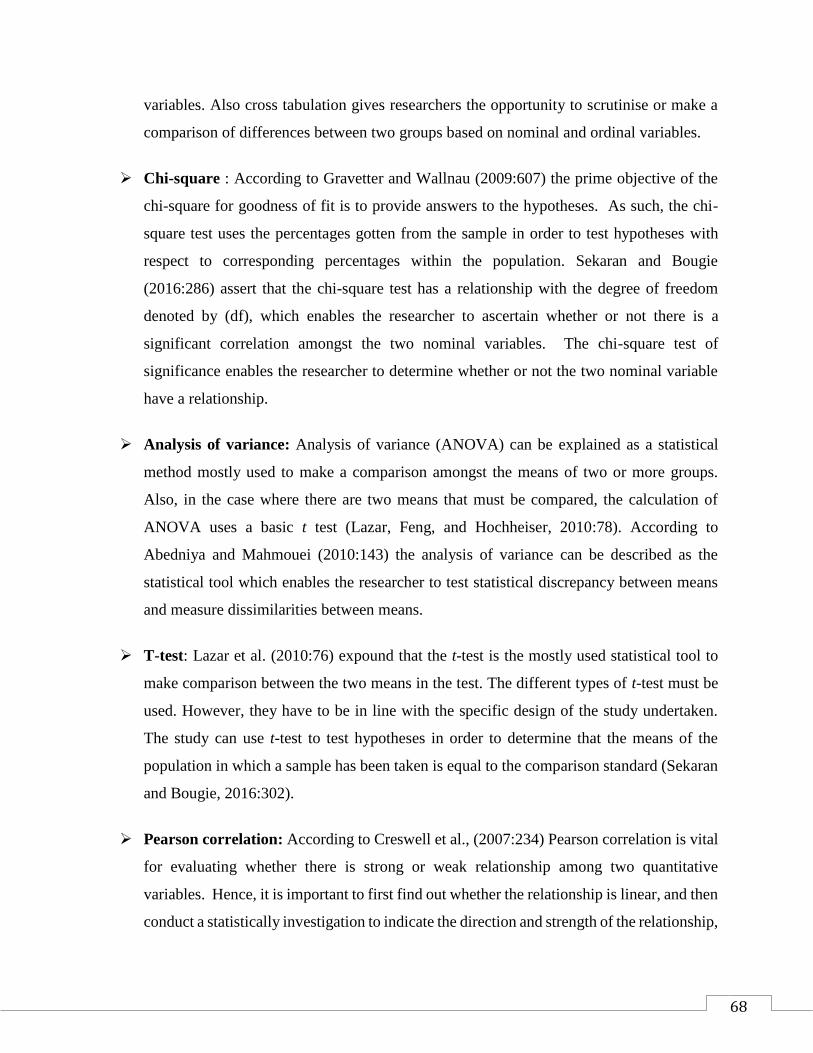
68
variables. Also cross tabulation gives researchers the opportunity to scrutinise or make a
comparison of differences between two groups based on nominal and ordinal variables.
Chi-square : According to Gravetter and Wallnau (2009:607) the prime objective of the
chi-square for goodness of fit is to provide answers to the hypotheses. As such, the chi-
square test uses the percentages gotten from the sample in order to test hypotheses with
respect to corresponding percentages within the population. Sekaran and Bougie
(2016:286) assert that the chi-square test has a relationship with the degree of freedom
denoted by (df), which enables the researcher to ascertain whether or not there is a
significant correlation amongst the two nominal variables. The chi-square test of
significance enables the researcher to determine whether or not the two nominal variable
have a relationship.
Analysis of variance: Analysis of variance (ANOVA) can be explained as a statistical
method mostly used to make a comparison amongst the means of two or more groups.
Also, in the case where there are two means that must be compared, the calculation of
ANOVA uses a basic t test (Lazar, Feng, and Hochheiser, 2010:78). According to
Abedniya and Mahmouei (2010:143) the analysis of variance can be described as the
statistical tool which enables the researcher to test statistical discrepancy between means
and measure dissimilarities between means.
T-test: Lazar et al. (2010:76) expound that the t-test is the mostly used statistical tool to
make comparison between the two means in the test. The different types of t-test must be
used. However, they have to be in line with the specific design of the study undertaken.
The study can use t-test to test hypotheses in order to determine that the means of the
population in which a sample has been taken is equal to the comparison standard (Sekaran
and Bougie, 2016:302).
Pearson correlation: According to Creswell et al., (2007:234) Pearson correlation is vital
for evaluating whether there is strong or weak relationship among two quantitative
variables. Hence, it is important to first find out whether the relationship is linear, and then
conduct a statistically investigation to indicate the direction and strength of the relationship,

69
and determine whether it is statistically significantly different from zero. Coakes (2005:18)
state that the key finding of the correlation is termed correlation coefficient, and it is
denoted by the symbol (r). Also, the correlation coefficient values ranges from -1.0 to +
1.0, which demonstrates that the two variables are closely related. On the contrary, the
closer (r) is to 0, it shows that the two variables are unrelated, which means there is no
relationship amongst the variables. The P-values measure the level of significant. In this
study, a 5% level of significance was used.
Mediation effect: When performing the mediating analysis, Barron and Kenny (1986), the Sobel
test and the bootstrapping are the methods used. All these model will be used in establishing the
mediating relationship between market orientation and leadership styles. In order to avoid
duplication, the explanation on Barron and Kenny (1986), the Sobel test and bootstrapping will
be presented in the results section.
5.3. LIMITATIONS OF THE STUDY
The main limitation for this study was the difficulty faced by the researcher to obtain a
complete list of all registered SMEs in the Mangaung Metropolitan Municipality. Thus,
the researcher had to rely on other SME owners/managers to refer him to other
entrepreneurs operating in the area whom they know.
The other major limitation encountered by the researcher was that some of the SMEs
owners/managers are foreign nationals, thus language became a barrier because some could
do not speak English. Also, they were not willing to share the business information with
the researcher and therefore decided not to participate in the study.
The researcher was unable to research all the SMEs in the Mangaung Metropolitan
Municipality because of the insufficient travelling and accommodation allowance.
5.4. CHAPTER SUMMARY
This chapter presented the research methodology adopted for this study. Quantitative research
method was used for this study and motivation for using such approach was given. The study also
70
used a research process which was divided into five stages to explain the motive for selecting some
of the research methods used in the study. Moreover, the data collection methods, instruments,
population sample, the procedure followed by the researcher, the processes involved in the
collection of the data and methods used to analyse the data were explained. The data analysis of
this study was conducted using descriptive statistics such as frequency distribution, charts,
measures of central tendency (mean). Furthermore, inferential statistics such as Pearson
correlation correlations coefficient, factor analysis, regression analysis, chi-square, analysis of
variance (ANOVA) were used to analyse the data for this study. Lastly, Barron and Kenny (1986)
mediating effect model was used to investigate the effect of MO on the relationship between
leadership styles and performance. In conclusion, this chapter discussed the limitations of the
study. The next chapter focuses on data analysis and interpretation of the empirical findings.
71
CHAPTER SIX
RESEARCH RESULTS: PPRESENTATION OF EMPIRICAL FINDINGS
6.1. INTRODUCTION
The main objective of this chapter is to present the empirical findings of this study gotten from the
questionnaires issued to 229 SME owners/managers in the Mangaung Metropolitan Municipality
(Bloemfontein; Botshabelo and Thaba’Nchu). The chapter commenced by ascertaining the
regional distribution of the response rate for the SME owners/managers in the Mangaung
Metropolitan Municipality. Thereafter, the reliability construct on leadership, market orientation
and the external environment are measured. Subsequently, factor analysis is used to verify the
validity and reliability of the measuring instruments. The chapter will also discuss the empirical
findings of the study in two parts of A and part B.
Section A comprise of the empirical findings and it is divided into five sub sections. The first sub
section focuses on the descriptive/demographic characteristics of the SME owners/managers. The
second subsection talks about the nature of the business. The third subsection focuses on the
different leadership styles employed by the SME owners/managers. The fourth subsection is
centred on market orientation. Lastly, the firth subsection explicates the results regarding the
performance of the SMEs.
Section B of the empirical finding provides answers to the hypotheses established in chapter four
of the literature review, based on the mediating effect of market orientation on the leadership
styles-SME performance relationship.
6.2. REGIONAL DISTRIBUTION
The sample size of this research was made up of the SME owners/managers operating in different
business sectors around Mangaung Metropolitan Municipality. SME owners/managers were
grouped in different categories according to their specified regions, in order to avoid a general
representation of one region. SME owners/managers who took part in this research were a

72
combination of business owners/managers coming from the different sectors of business and towns
within Mangaung Metropolitan Municipality (Bloemfontein, Botshabelo and Thaba’Nchu).
Table 6.1: The sample size; percentage of questionnaires distributed to a sample size of the
region and number of questionnaires collected in the Mangaung Metropolitan
Municipality, 2017
Bloemfontein Botshabelo Thaba’Nchu Total
Sources (www.business
tech.co.za, 2015)
(www.tiptop
globe.co.za,
2015)
(www.guandl.co
m, 2015)
Population 503 000 309 810 60 696 873 506
Sample size
354
Number of
questionnaires
issued
190
120
44
354
Number of
questionnaires
received
150
60
40
250
Number of
received
questionnaires
not fully
completed
11
6
4
21
Number of
questionnaires
received that
were fully
completed and
valid for the
use of this
study
139
54
36
229
Valid response
rate as
percentage of
the total
questionnaires
73.2%
45.0 %
81.8%
64.7%

73
Table 6.1 above shows the regional distribution of SME owners/managers in Mangaung
Metropolitan Municipality in terms of the population size, sample size, percentage of
questionnaires issued to sample within the region, as well as the number of questionnaires received
from the respondents. Bloemfontein, Botshabelo and Thaba’Nchu depict a good regional
representation of Mangaung Metropolitan Municipality.
From Table 6.1, it is established that Mangaung Metropolitan Municipality has a total population
of 873 506 with 503 000 people living in Bloemfontein; 309 810 located in Botshabelo; and 60
969 peoples in Thaba’Nchu. Roasoft sample size calculator was used to calculate the sample size.
Based on the calculations, a sample size of 354 was obtained and used in this study. A total of 354
questionnaires were distributed among SME’s owners/managers in the Mangaung Metropolitan
Municipality. Out of the 354 questionnaires that were issued, 250 were received. From the 250
received, only 229 were completed successfully by the respondents and generated a response rate
of 64.7%. The researcher made use of the pair wise deletion approach to eliminate the missing
values in the data collection and analysis, and continued with all the questionnaires that were
successfully completed by the respondents. Bloemfontein is the centre of economic activities and
provincial capital of the Free State. The city is also a commercial capital of the Free State province
and judicial capital of South Africa. Bloemfontein accounts for approximately 87% of the
economic production in Mangaung Metropolitan Municipality, while only 7% and 6% of the
economic activities happens in Botshabelo and Thaba’Nchu respectively (South African LED
Network, 2011). Given this, a large proportion of the questionnaires were distributed in
Bloemfontein than in Botshabelo and Thaba’Nchu, since a lot of economic and commercial
activities happens in Bloemfontein, as it is the capital city of the Free State province.
6.3. RELIABILITY OF THE CONSTRUCTS
Reliability is a broadly used concept to determine the internal consistency of the constructs.
Internal consistency is concerned with the degree to which each item included in the test measures
the same construct (Tavakol and Dennick, 2011). Cronbach’s alpha is used to measure reliability.
According to Cooper and Schindler (2014), Cronbach’s alpha can be defined as the average
correlation among each item included in the number of items. The values of Cronbach’s alpha
ranges between -1 to +1. Thus, the alpha value of 0.7 provides the acceptable degree of internal

74
consistency. Table 6.2 below depicts the scores and Cronbach’s alpha’s of leadership styles,
market orientation and external environment.
Table 6.2: Cronbach’s alpha test on the reliability of leadership styles, market orientation
and external environment
N of Items Alpha Reliable Items Reliability
Leadership styles
Directive 3 0.787 78.70% high internal
consistency
Supportive 5 0.789 78.90% high internal
consistency
Participative 5 0.818 81.80% high internal
consistency
Achievement 4 0.799 79.90% high internal
consistency
Autocratic 5 0.858 85.80% high internal
consistency
Consultative 4 0.796 79.60% high internal
consistency
Democratic 5 0.729 72.90% high internal
consistency
Laissez-fair 5 0.856 85.60% high internal
consistency
Pace Setting 5 0.712 71.20% high internal
consistency
Transformational 4 0.737 73.70% high internal
consistency
Transactional 4 0.714 71.40 high internal
consistency
Market
orientation
Customer
Orientation
3 0.791 79.10% high internal
consistency
Competitor
Orientation
3 0.813 81.30% high internal
consistency
Inter-functional
Coordination
3 0.845 84.50% high internal
consistency
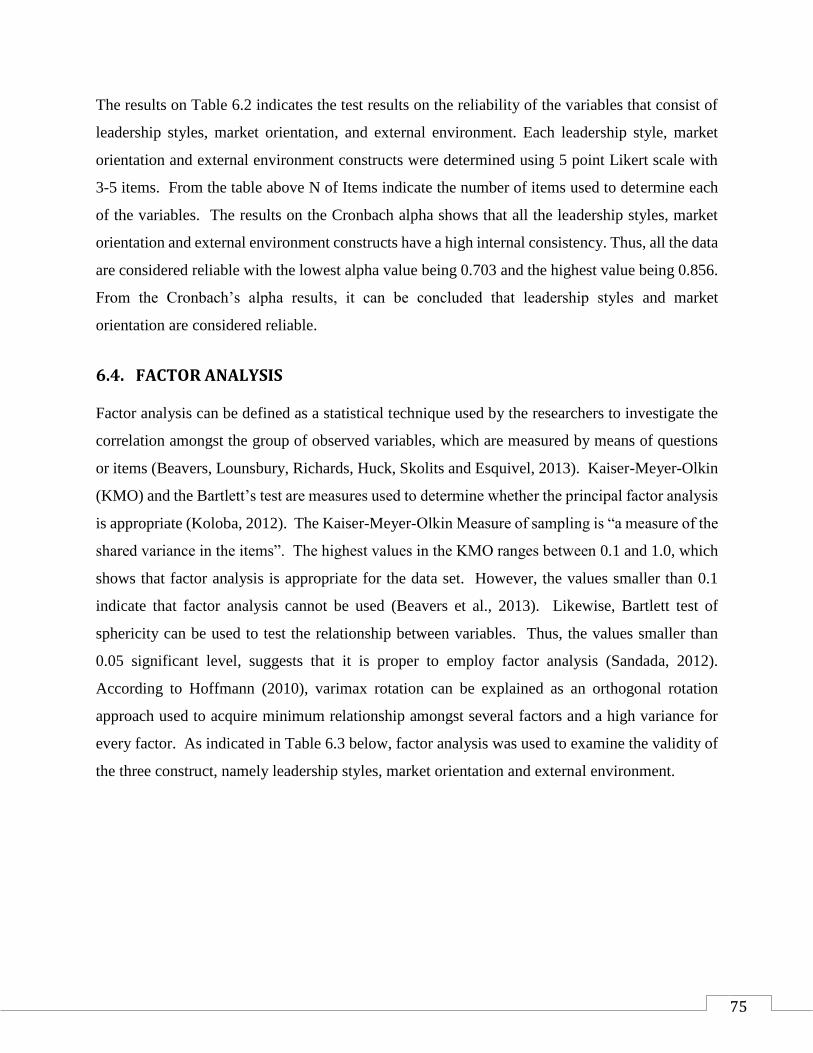
75
The results on Table 6.2 indicates the test results on the reliability of the variables that consist of
leadership styles, market orientation, and external environment. Each leadership style, market
orientation and external environment constructs were determined using 5 point Likert scale with
3-5 items. From the table above N of Items indicate the number of items used to determine each
of the variables. The results on the Cronbach alpha shows that all the leadership styles, market
orientation and external environment constructs have a high internal consistency. Thus, all the data
are considered reliable with the lowest alpha value being 0.703 and the highest value being 0.856.
From the Cronbach’s alpha results, it can be concluded that leadership styles and market
orientation are considered reliable.
6.4. FACTOR ANALYSIS
Factor analysis can be defined as a statistical technique used by the researchers to investigate the
correlation amongst the group of observed variables, which are measured by means of questions
or items (Beavers, Lounsbury, Richards, Huck, Skolits and Esquivel, 2013). Kaiser-Meyer-Olkin
(KMO) and the Bartlett’s test are measures used to determine whether the principal factor analysis
is appropriate (Koloba, 2012). The Kaiser-Meyer-Olkin Measure of sampling is “a measure of the
shared variance in the items”. The highest values in the KMO ranges between 0.1 and 1.0, which
shows that factor analysis is appropriate for the data set. However, the values smaller than 0.1
indicate that factor analysis cannot be used (Beavers et al., 2013). Likewise, Bartlett test of
sphericity can be used to test the relationship between variables. Thus, the values smaller than
0.05 significant level, suggests that it is proper to employ factor analysis (Sandada, 2012).
According to Hoffmann (2010), varimax rotation can be explained as an orthogonal rotation
approach used to acquire minimum relationship amongst several factors and a high variance for
every factor. As indicated in Table 6.3 below, factor analysis was used to examine the validity of
the three construct, namely leadership styles, market orientation and external environment.

76
Table 6.3: Component matrix for the Leadership styles and Market orientation construct
Leadership styles Component
Loading
Eigen
values
% of
Variance
KMO Barlett’s Test
Directive leadership
Give Instructions and subordinates are
expected to follow them
0.846
2.110
70.318
0.697
201.54* Talks more than listening to the views
of the subordinates
0.861
Aggressive, controlling and dictates
which activities should be carried out
0.808
Supportive leadership Style
Sets up a conducive and friendly
atmosphere at work.
0.756
2.726
54.517
0.809
300.79* Shows concern for the well-being of
the subordinates.
0.736
Acknowledges the achievements of
the subordinates and reward them.
0.797
Give subordinates emotional,
informational, and instrumental
support to overcome their challenges.
0.709
Plays the role of a mentor to enhance
the performance of the subordinates.
0.689
Participative leadership style
Give subordinates space to raise their
opinions before making a final
decision
0.740
2.912
58.246
0.838
362.16*
Involve subordinates in the planning,
and implementation process.
0.802
Motivates subordinates to brainstorm
the idea that will enhance the
performance of the organisation.
0.801
Promotes discussion and motivate
collective decision making than
instructing subordinates.
0.680
Shares responsibility with
subordinates and encourage teams’
effort in accomplishing goals.
.0785
Achievement orientated leadership style

77
Driven by the high desire to achieve
the goals of the organisation.
0.725
2.513
62.832
0.763
285.80* Sets high goals for subordinates and
expect them to perform at their best
level.
0.815
Continuously request subordinates to
improve performance to achieve
organisational goals.
0.834
Shows conviction that subordinates
will accept responsibility to achieve
challenging goals.
0.792
Autocratic leadership style
Rules in a very stem manner. 0.712
3.200
64.000
0.831
515.16* Dictates how the work should be done. 0.770
Make decisions on his/her own and
subordinates do not have a say.
0.813
Compels subordinates to accept
his/her ideas.
0.844
Puts too much emphasis on
performance rather than people.
0.852
Consultative leadership style
Leader takes into account the views
and ideas of the subordinates when
setting the goals.
0.799
2.502
62.538
0.777
281.452* Leader utilise the skills and knowledge
of the subordinates but retains a final
decision.
0.721
Involve subordinates in problem
solving.
0.863
Subordinates are encouraged to put
forward their idea in the decision
making process.
0.773
Democratic leadership style
Puts too much emphasis on
performance and people.
0.530
2.485
49.691
0.771
239.713* Allow subordinates to participate in
the decision making.
0.758
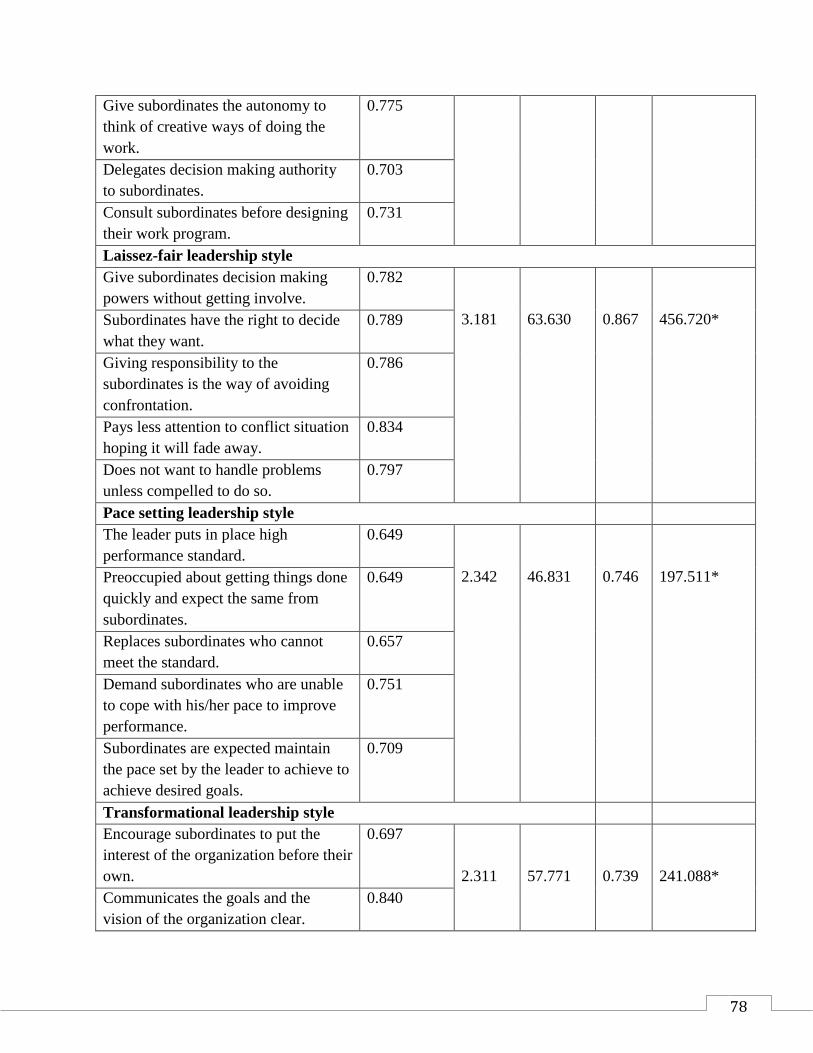
78
Give subordinates the autonomy to
think of creative ways of doing the
work.
0.775
Delegates decision making authority
to subordinates.
0.703
Consult subordinates before designing
their work program.
0.731
Laissez-fair leadership style
Give subordinates decision making
powers without getting involve.
0.782
3.181
63.630
0.867
456.720* Subordinates have the right to decide
what they want.
0.789
Giving responsibility to the
subordinates is the way of avoiding
confrontation.
0.786
Pays less attention to conflict situation
hoping it will fade away.
0.834
Does not want to handle problems
unless compelled to do so.
0.797
Pace setting leadership style
The leader puts in place high
performance standard.
0.649
2.342
46.831
0.746
197.511* Preoccupied about getting things done
quickly and expect the same from
subordinates.
0.649
Replaces subordinates who cannot
meet the standard.
0.657
Demand subordinates who are unable
to cope with his/her pace to improve
performance.
0.751
Subordinates are expected maintain
the pace set by the leader to achieve to
achieve desired goals.
0.709
Transformational leadership style
Encourage subordinates to put the
interest of the organization before their
own.
0.697
2.311
57.771
0.739
241.088*
Communicates the goals and the
vision of the organization clear.
0.840

79
Creates a conducive atmosphere and
inspire subordinates to work hard and
perform well.
0.817
Shows confidence and believe that
goals will be attained.
0.831
Transactional leadership style
Uses reward system to motivate
subordinates to achieve goals.
0.606
1.705
42.631
0.626
73.327* Institutes punishment for failure to
achieve goals.
0.690
Spend time guiding and motivating
subordinates to achieve desired goals.
0.689
Subordinates are rewarded based on
contractual agreement for achieving
the goals.
0.790
Market Orientation
Customer Orientation
Customer satisfaction is our major
objective.
0.873
2.122
70.749
0.683
216.315* We create products/services that offer
value to our customers.
0.865
We measure customer satisfaction and
provide up service.
0.782
Inter-functional Coordination
Every department works together to
meet customers’ needs.
0.853
2.290
76.335
0.721
286.120* Business strategies are shared and
integrated between different
departments.
0.873
Each department share business
information with each other.
0.894
Competitor Orientation
We discuss competitors’ 0.834
2.189
72.959
0.712
233.878*
We respond rapidly to competitors’
actions
0.872
We target opportunities for
competitive advantage.
0.856

80
Table 6.3 depicts the results of the descriptive statistics and rotated factor matrix for leadership
styles (directive, supportive, participative, achievement, pace setting, laissez faire, consultative,
democratic, transformational, and transactional) and market orientation constructs (customer
orientation, competitor orientation, and inter-functional coordination). The factors were loaded
into one component each for all the different leadership styles and market orientation constructs.
Factor one, which is directive leadership style, loaded in to one factor with an Eigen-value of 2.110
and accounting for a total variance of 70.318. Factor two, which is supportive leadership style
loaded with an Eigen-value of 2.726 and accounting for a total variance of 54.517. Factor three
which is participative leadership style loaded with an Eigen-value of 2.2.912 and accounting for a
total variance of 54.58.246. Factor four, which is achievement leadership style loaded with an
Eigen-value of 2.513 and accounting for a total variance of 62.832. Factor five, which is autocratic
leadership style loaded with an Eigen-value of 3.200 and accounting for a total variance of 64.000.
Factor six, which is consultative leadership style loaded with an Eigen-value of 2.502 and
accounting for a total variance of 62.538. Factor seven, which is democratic leadership style loaded
with an Eigen-value of 2.485 and accounting for a total variance of 49.691. Factor eight, which is
Laissez faire leadership style loaded with an Eigen-value of 3.181 and accounting for a total
variance of 63.630. Factor nine, which is pace setting leadership style loaded with an Eigen-value
of 2.342 and accounting for a total variance of 46.831. Factor ten, which is transformational
leadership style loaded with an Eigen-value of 2.311 and accounting for a total variance of 57.771.
Factor eleven, which is transactional leadership style loaded with an Eigen-value of 1.705 and
accounting for a total variance of 42.631.
With respect to the construct of market orientation and customer orientation loaded into one factor
with an Eigen-value of 2.122 and accounting for a total variance of 70.749. Competitor orientation
loaded into one factor with an Eigen-value of 2.189 and accounting for a total variance of 72.959,
and inter-functional coordination also loaded into one factor, with an Eigen-value of 2.290 and
accounting for a total variance of 76.335.
Furthermore, in determining the appropriateness of factor analysis, Kaiser-Meyer-Olkin (KMO)
and the Bartlett's Test of Sphericity are used. Using the Kaiser Meyer Olkin (KMO), high values
between 0.5 and 1.0 indicate appropriateness; and for the barlette test, a p-value of less than 0.05
indicates that the factor analysis is considered appropriate. From Table 6.3 the value for KMO is
81
0.697, 0.809, 0.838, 0.763, 0.831, 0.777, 0.771, 0.867, 0.746, 0.739, 0.626, 0.683, 0.712, 0.721 for
directive, supportive, participative, achievement, autocratic, consultative, democratic, laissez faire,
pace setting, transformational, transactional, customer orientation, competitor orientation and
inter-functional coordination respectively, indicating the appropriateness of the constructs. In
addition, Table 6.3 shows that the value for Barlett test of Sphericity is 201.54, 300.79, 362.16,
285.80, 515.16, 281.452, 239.713, 456.720, 197.511, 241.088, 73.327, 216.315, 286.120, 233.878
for directive, supportive, participative, achievement, autocratic, consultative, democratic, laissez
faire, pace setting, transformational, transactional, customer orientation, competitor orientation
and inter-functional coordination respectively, indicating the appropriateness of the constructs.
6.5. SECTION A: EMPIRICAL FINDINGS
The results of the empirical findings is divided into two section, A and B. Section A is sub-divided
into seven subsections. While section B of the empirical study provides answers to the hypothesis
stated in chapter four of the literature review, which is based on the mediating effect of market
orientation on the leadership styles-SME performance relationship.
6.5.1. Descriptive/Demographic Information of the Respondents
In section A of this presentation, the descriptive variables for which data was gathered composed
of gender; age, race; business age; the stages of the business life cycle; educational qualification;
types of degree program completed and different kinds of business management related short
courses. Descriptive statistics, which consist of frequency distribution table, bar charts and pie
charts, were employed to analyse and interpret the data gathered. More details of the descriptive
variables are explained below.
6.5.2. Gender of the respondents
A study conducted by Radipere and Dhliwayo (2014) found that there is gender disparity amongst
male and female entrepreneurs, as the percentage of men entrepreneurs is more than of female
entrepreneurs.
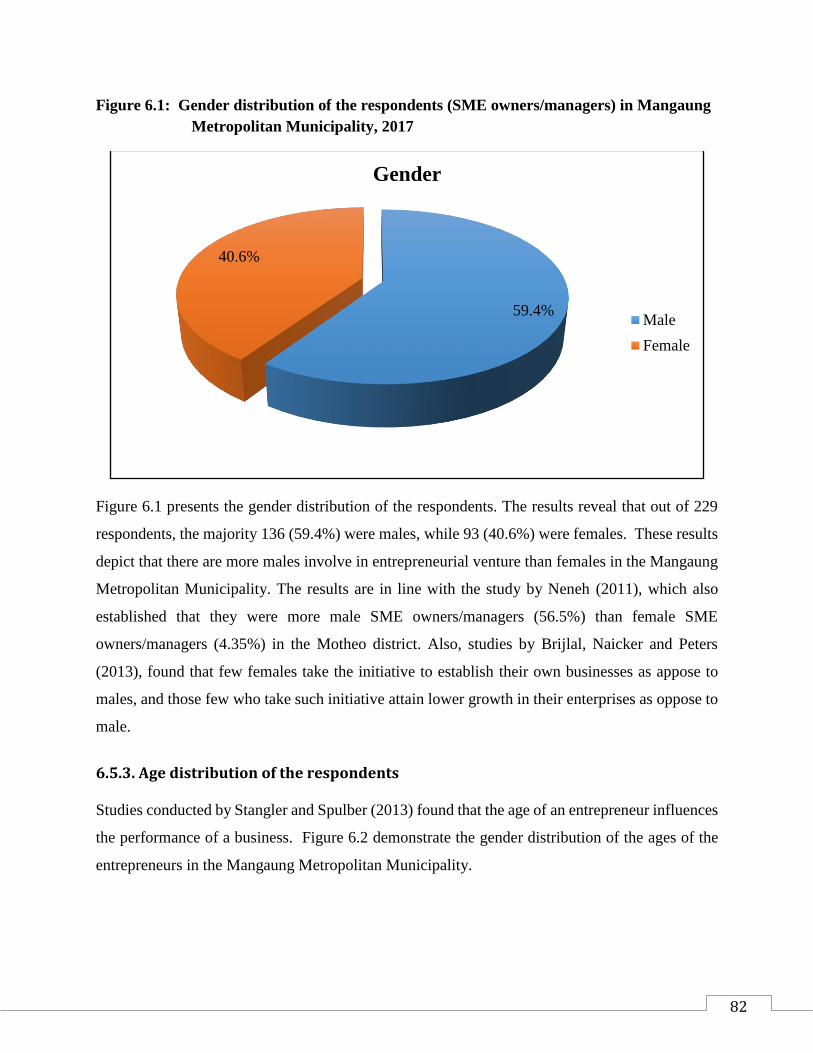
82
Figure 6.1: Gender distribution of the respondents (SME owners/managers) in Mangaung
Metropolitan Municipality, 2017
Figure 6.1 presents the gender distribution of the respondents. The results reveal that out of 229
respondents, the majority 136 (59.4%) were males, while 93 (40.6%) were females. These results
depict that there are more males involve in entrepreneurial venture than females in the Mangaung
Metropolitan Municipality. The results are in line with the study by Neneh (2011), which also
established that they were more male SME owners/managers (56.5%) than female SME
owners/managers (4.35%) in the Motheo district. Also, studies by Brijlal, Naicker and Peters
(2013), found that few females take the initiative to establish their own businesses as appose to
males, and those few who take such initiative attain lower growth in their enterprises as oppose to
male.
6.5.3. Age distribution of the respondents
Studies conducted by Stangler and Spulber (2013) found that the age of an entrepreneur influences
the performance of a business. Figure 6.2 demonstrate the gender distribution of the ages of the
entrepreneurs in the Mangaung Metropolitan Municipality.
59.4%
40.6%
Gender
Male
Female

83
Figure 6.2: Age distribution of the respondents
Figure 6.2 presents the age distribution of the respondents grouped into five categories: less than
20 years; 21-30 years; 30-39 years; 40-49 years, and greater than 50 years. From the results, it is
observed that out 229 SME owner’s/managers, the majority 91 (39.7%) were between the ages of
21-30. This was followed by 62 (27.1%) and 49 (21.4%) who are between the ages of 30-39 and
40-49 respectively. The least is 23 (10%) and 4 (1.7%) respectively. The results are in line with
the previous studies by Ganyaupfu (2013), which found that the majority of the successful
entrepreneurs were between the ages of 25-40.
6.5.4. Race distribution of the respondents
South Africa’s policy of Black Economic Empowerment is the vital tool of rational growth strategy
that has an objective to realise the full economic potential of the country, while bringing the
marginalised black majority into the country’s economic mainstream (Department of Trade and
Industry, 2014). Race has a big influence on the economic activities of South Africa. Initiatives
such as Broad Black Economic Act (BEE) of 2003 have been introduced by the government to
increase economic ventures among black South Africans.
1.7%
39.7%
27.1%
21.4%
10%
0
5
10
15
20
25
30
35
40
45
<20 yrs 21-30 yrs 30-39 yrs 40-49 yrs 50+ yrs
Age category
<20 yrs
21-30 yrs
30-39 yrs
40-49 yrs
50+ yrs

84
Figure 6.3: Race distribution of the respondents
Figure 6.3 indicates the race distribution of the SME owners/managers in the Mangaung
Metropolitan Municipality. The results depict that out of the 229 SME owners/managers, Africans
were the majority with 133 (58.1%), followed by 55 (24%) whites, and 22 (9.6%) coloured
respectively. The least is Indians 12 (5.2%), Asians 4 (1.7%) and Other 3 (1.3%).
6.5.5. Business age
There has been a debate on the relationship between business age and performance (Coad, Segarra
and Teruel, 2013). Research carried out by Vijayakumar (2011) found that business age has a
positive influence on the profitability of the firm.
Table 6.4: Business age
Descriptive Statistics
N Minimum Maximum Mean
Std.
Deviation Skewness
Statistic Statistic Statistic Statistic Statistic Statistic
Std.
Error
Business age 229 0 44 5.81 5.717 2.438 .161
Valid N
(listwise) 229
58.1%24%
9.6%5.2% 1.7%
1.3%
Race
African
White
Coloured
Indian
Asian
Other
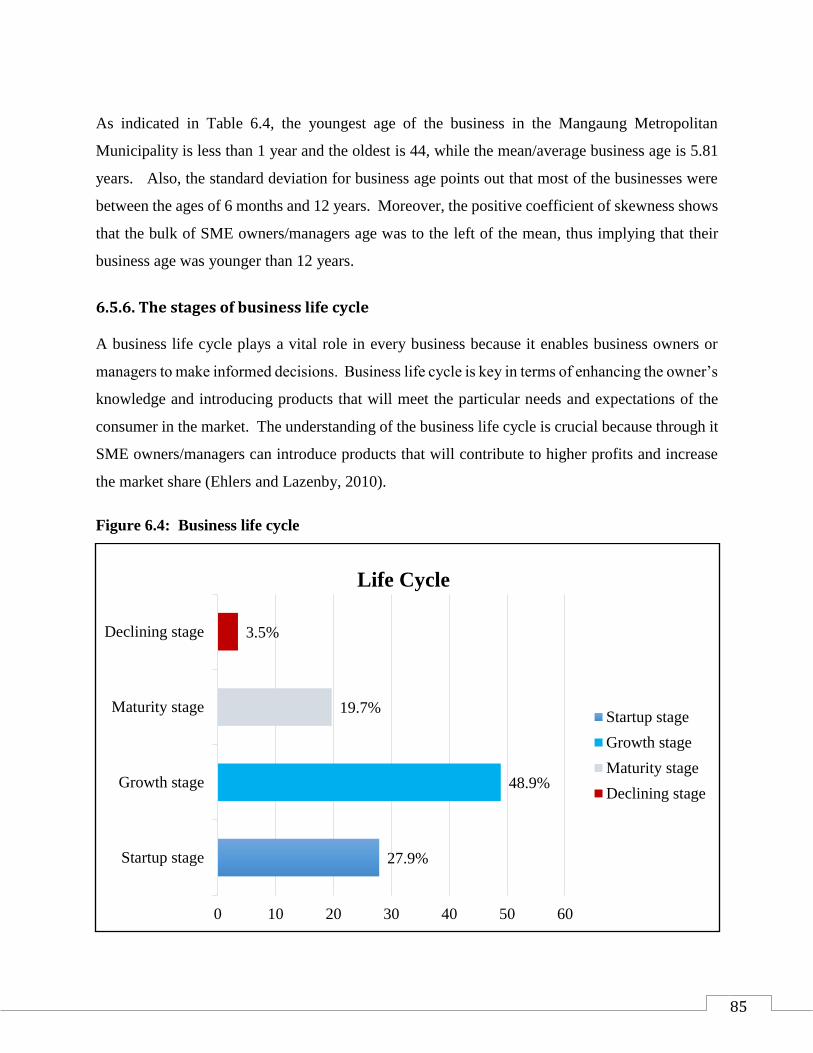
85
As indicated in Table 6.4, the youngest age of the business in the Mangaung Metropolitan
Municipality is less than 1 year and the oldest is 44, while the mean/average business age is 5.81
years. Also, the standard deviation for business age points out that most of the businesses were
between the ages of 6 months and 12 years. Moreover, the positive coefficient of skewness shows
that the bulk of SME owners/managers age was to the left of the mean, thus implying that their
business age was younger than 12 years.
6.5.6. The stages of business life cycle
A business life cycle plays a vital role in every business because it enables business owners or
managers to make informed decisions. Business life cycle is key in terms of enhancing the owner’s
knowledge and introducing products that will meet the particular needs and expectations of the
consumer in the market. The understanding of the business life cycle is crucial because through it
SME owners/managers can introduce products that will contribute to higher profits and increase
the market share (Ehlers and Lazenby, 2010).
Figure 6.4: Business life cycle
27.9%
48.9%
19.7%
3.5%
Startup stage
Growth stage
Maturity stage
Declining stage
0 10 20 30 40 50 60
Life Cycle
Startup stage
Growth stage
Maturity stage
Declining stage
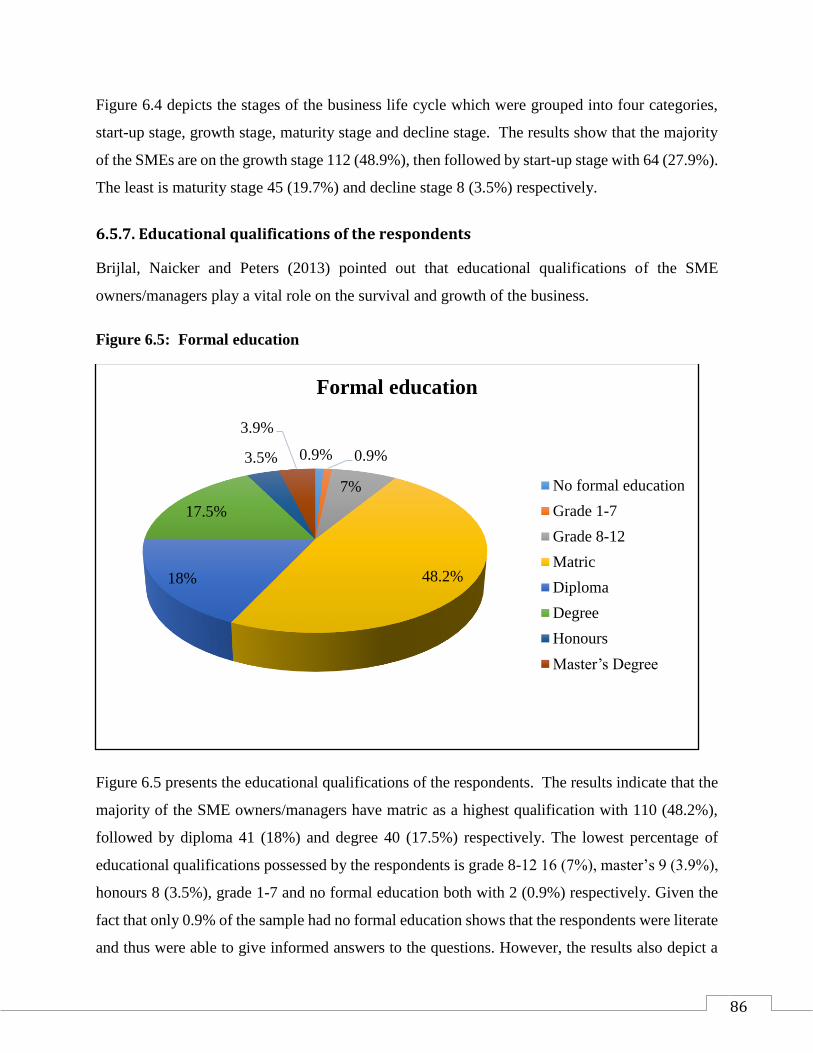
86
Figure 6.4 depicts the stages of the business life cycle which were grouped into four categories,
start-up stage, growth stage, maturity stage and decline stage. The results show that the majority
of the SMEs are on the growth stage 112 (48.9%), then followed by start-up stage with 64 (27.9%).
The least is maturity stage 45 (19.7%) and decline stage 8 (3.5%) respectively.
6.5.7. Educational qualifications of the respondents
Brijlal, Naicker and Peters (2013) pointed out that educational qualifications of the SME
owners/managers play a vital role on the survival and growth of the business.
Figure 6.5: Formal education
Figure 6.5 presents the educational qualifications of the respondents. The results indicate that the
majority of the SME owners/managers have matric as a highest qualification with 110 (48.2%),
followed by diploma 41 (18%) and degree 40 (17.5%) respectively. The lowest percentage of
educational qualifications possessed by the respondents is grade 8-12 16 (7%), master’s 9 (3.9%),
honours 8 (3.5%), grade 1-7 and no formal education both with 2 (0.9%) respectively. Given the
fact that only 0.9% of the sample had no formal education shows that the respondents were literate
and thus were able to give informed answers to the questions. However, the results also depict a
0.9% 0.9%
7%
48.2%18%
17.5%
3.5%
3.9%
Formal education
No formal education
Grade 1-7
Grade 8-12
Matric
Diploma
Degree
Honours
Master’s Degree

87
low level of education amongst the SME owners/managers, which raises an urgent need for the
level of education to be enhanced. Education plays a key role to the success of the business, and
as such, it is imperative for SME owners/managers to improve their educational level.
6.5.8. Types of degree program completed
Figure 6.6: Degree program
The results on Figure 6.6 indicate the degree programs completed by the respondents. The results
show that out of 229 SME owners/managers, more than half did not complete any degree program,
accounting for 165 (72.1%). 16 (7%) completed degrees in business management and 9 (3.9%) in
economics respectively, 8 (3.5%) human resources management, accounting, finance and other 7
(3.1%) respectively. The least degree program completed by the respondents is engineering and
marketing both with 4 (1.7%), and IT/computer 2 (0.9%). With the overwhelming majority of the
respondents who do not have degree, it is vital for government institutions such as Free State
Development Corporation (FDC), Small Enterprise Development Agency (SEDA) and National
72.1%
3.1%
1.7%
7%
3.1%
3.5%
3.9%
1.7
0.9%
3.1%
None
Accounting
Marketing
Business management
Finance
Human Resource
Management
Economics
Engineering
IT/Computer
Others
0 20 40 60 80
Degree program
None
Accounting
Marketing
Business management
Finance
Human Resource
Management
Economics
Engineering
IT/Computer
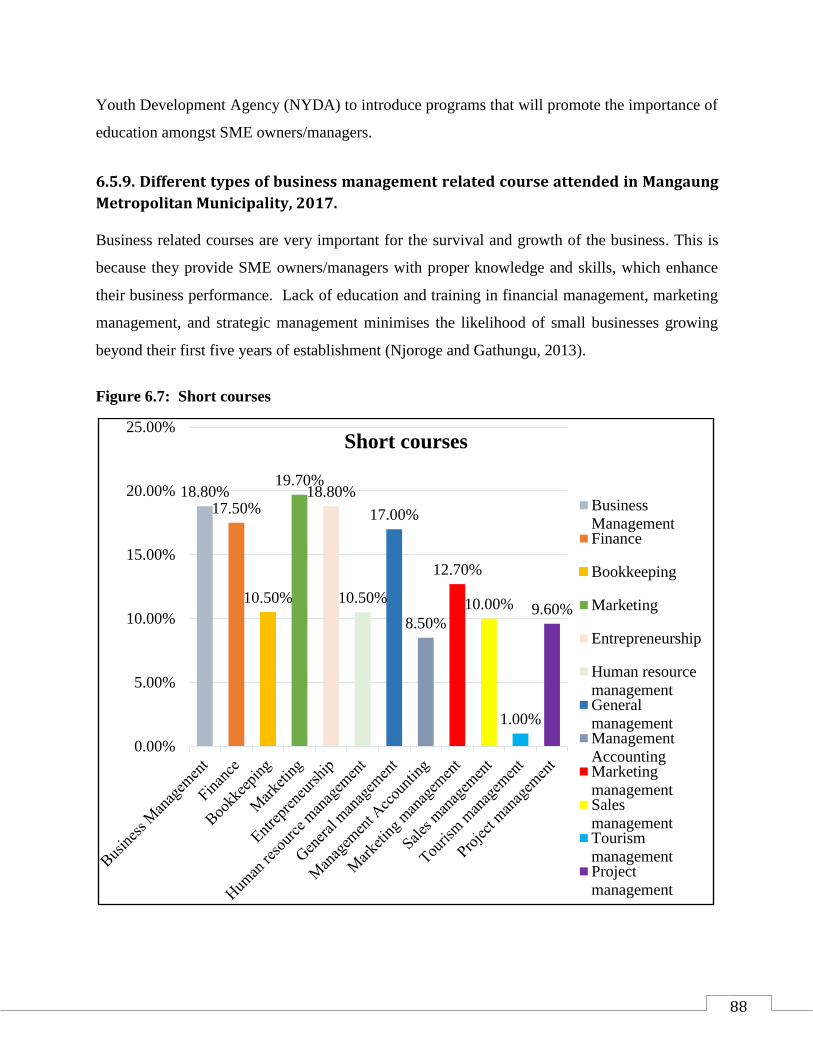
88
Youth Development Agency (NYDA) to introduce programs that will promote the importance of
education amongst SME owners/managers.
6.5.9. Different types of business management related course attended in Mangaung
Metropolitan Municipality, 2017.
Business related courses are very important for the survival and growth of the business. This is
because they provide SME owners/managers with proper knowledge and skills, which enhance
their business performance. Lack of education and training in financial management, marketing
management, and strategic management minimises the likelihood of small businesses growing
beyond their first five years of establishment (Njoroge and Gathungu, 2013).
Figure 6.7: Short courses
18.80%17.50%
10.50%
19.70%18.80%
10.50%
17.00%
8.50%
12.70%
10.00%
1.00%
9.60%
0.00%
5.00%
10.00%
15.00%
20.00%
25.00%Short courses
Business
ManagementFinance
Bookkeeping
Marketing
Entrepreneurship
Human resource
managementGeneral
managementManagement
AccountingMarketing
managementSales
managementTourism
managementProject
management

89
Figure 6.7 presents different types of business management related short courses attended by the
SME owner’s/managers in the Mangaung Metropolitan Municipality in the Free State. The results
indicate that less than 50% of the respondents had undertaken short courses in business
management. Taking into consideration that more that 50% of the SME owners/managers neither
have degrees nor undertook any business management related courses, raises an urgent need for
the level of education and business management related courses to be increased amongst SMEs
owners/managers in the Mangaung Metropolitan Municipality.
6.5.10. Conclusion on the descriptive/demographic information of the SME
owner/manager
The descriptive/demographic variables for which the information about the SME
owners/managers in the Mangaung Metropolitan was gathered consist of age, race, business
life cycle, educational qualification, degree program completed and different types of business
management related short courses. The results revealed that the substantial proportion of the
SME owners/managers were males than females, with 136 (59.4%) and 93 (40.6%)
respectively. In terms of age, the results indicate that SME owners/managers are between the
ages of 21-30, 30-39 and 40-49 respectively.
In terms of race, it is observed from the results that Africans made up majority of the SME
owners/managers, with 133 (58.1%). Then followed by whites, coloured and Indians, with 55
(24%), 22 (9.6%) and 12 (5.2%) respectively. Also, the substantial proportion of the SME
owners/managers were in the growth stage of their business life cycle, with 112 (48.9%); start-
up stage 64 (27.9%); 45 (19.7%) maturity and 8 (3.5%) respectively. With respect to the
educational qualification, the results show that more than 50% of the SME owners/managers
had matric as qualification. Consequently, government has to put in place initiatives that will
encourage SME owners/managers to enhance their level of education.
6.6. THE NATURE OF THE BUSINESS
The nature of the business comprised of the descriptive variables such as the number of employees
hired in the business, sources of start-up capital, reasons that motivated SME owners/managers to
start the business, previous experience in the area in which the business operate, and whether either

90
of respondent’s family member had ever owned or managed a business. More details are explained
below.
6.6.1. The industry in which the business operates in the Mangaung Metropolitan
Municipality, 2017
This study focused on the businesses operating in the Mangaung Metropolitan Municipality
(Bloemfontein, Botshabelo and Thaba’Nchu). These businesses are crucial to the economic
prosperity of the region because of the role they play in creating employment, poverty reduction,
and improved standard of leaving amongst the people of Mangaung Metropolitan Municipality.
Figure 6.8: Industry sector
Figure 6.8 presents the industry sector in which the business operates. The results indicate that the
majority of the SMEs owners/managers operate in the fast food industry with 47 (20.5%), followed
by retail and consumer services, entertainment and clothing industry with 29 (12.7%), 22 (9.6%)
and 17 (7.4%) respectively. Moreover, it can be observed that businesses operating in the hair
dressing sector accounts for 14 (6.1%); health care, education, social services 13 (5.7%);
5.7%
20.5%
12.7%
4.8
5.7%
2.2%
3.1%
4.8%5.2%
4.4%
3.5%
6.1%
7.4%
9.6%
4.4%
Manufacturing
Fast food
Retail & Consumer Service
Motor vehicle & Repairs
Health care, Education, Social service
Property & Real Estate
Other
Transportation
Wholesaler
Constraction
Finance
Hair dressing
Clothing
Entertainment
Technology/IT
0 5 10 15 20 25
Industry

91
manufacturing 13 (5.7%); and wholesaler 12 (5.2%) respectively. The rest of the results are less
than 5%. This is consistent with the study conducted by Mohutsiwa (2012), which established that
23% of the businesses operate in the service sector.
6.6.2. The number of people the business employed
One of the predominant ways to classify the SME is to observe the number of people employed
per business, gross assets, level of investment, and turnover (Dubihlela, 2012). It is vital to take
into consideration the number of people employed by the business in order to determine its size,
and the extent of its contribution to a country’s employment creation and economic growth.
Figure 6.9: Business employ
The results on Figure 6.9 show the number of people employed by the SME sector. The results
demonstrate that the majority of the people are employed by micro enterprises with 103 (45%),
then followed by very small enterprise and small enterprise, with 60 (26.2%) and 44 (19.2%)
respectively. The least is large enterprise and medium enterprise, with 13 (5.7%) and 9 (3.9%)
respectively. The results are in line with the study carried out by Mutyenyoka and Madzivhandila
45%
26.2%
19.2%
3.9%
5.7%
Number of employees
Micro enterprise (0-5
people)
Very small (5-10 people)
Small enterprise (10-50
people)
Medium enterprise (50-120
people)
Large enterprise (>120
people)

92
(2014) which found that Small Micro and Medium Enterprises (SMMEs) account for about 72%
of all the jobs and also contribute to 35% of the South Africa’s Growth Domestic Product (GDP).
6.6.3. Start-up capital
Access to capital is a fundamental factor that can enhance the establishment and sustainability of
a business.
Figure 6.10: Start-up capital
Figure 6.10 shows the different sources of finances that entrepreneurs use to raise capital when
starting their businesses. From figure 6.10, it is observed that the majority of the SME
owners/managers used their personal savings to start-up their businesses, acconting for 96 (41.9%),
then followed by 49 (21.4%) who used banks and other financial institutions to raise start-up
capital. The least is family and friends, inheritance and SEDA, FDC, IDC, acconting for 32 (14%)
and 26 (11.4%) respectively. The results concur with a study by Gathogo and Ragui (2014), which
established that 47.5% of the SME owners/managers used personal savings as a start-up capital,
41.9%
14%11.4%
21.4%
11.4%
0
5
10
15
20
25
30
35
40
45Capital Personal
Savings
Family &
friends
Inheritance
Banks and
other financial
institutions
SEDA,FDC,ID
C

93
followed by capital from family and friends and capital from commercial banks, with 46.5% and
15% respectively.
6.6.4. Reasons/motives for starting the business in the Mangaung Metropolitan
Municipality region, 2017
There are various reasons that motivate an entrepreneur to start a business. These reasons are
grouped into pull and push factors.
Table 6.5: Pull and push factors
Mean Std.
Deviation
Skewness
Pull Factors
Being my own boss 4.01 1.088 -1.151
Need for autonomy 3.54 1.070 -0.639
A Need For Power 3.02 1.286 -0.128
Independence and flexibility 4.16 0.942 -1.304
Wealth creation 3.86 1.012 -0.715
Opportunities in the market 3.97 0.826 -0.499
To provide job security 4.00 0.937 -0.743
To Realise My Dream 4.22 0.954 -1.437
I enjoy taking risk 3.52 1.191 -0.606
Earn a reasonable living enjoying a quality life 4.11 0.901 -1.061
Overall Pull factors 3.8406 0.51569 -0.649
Unemployment 3.74 1.289 -0.263
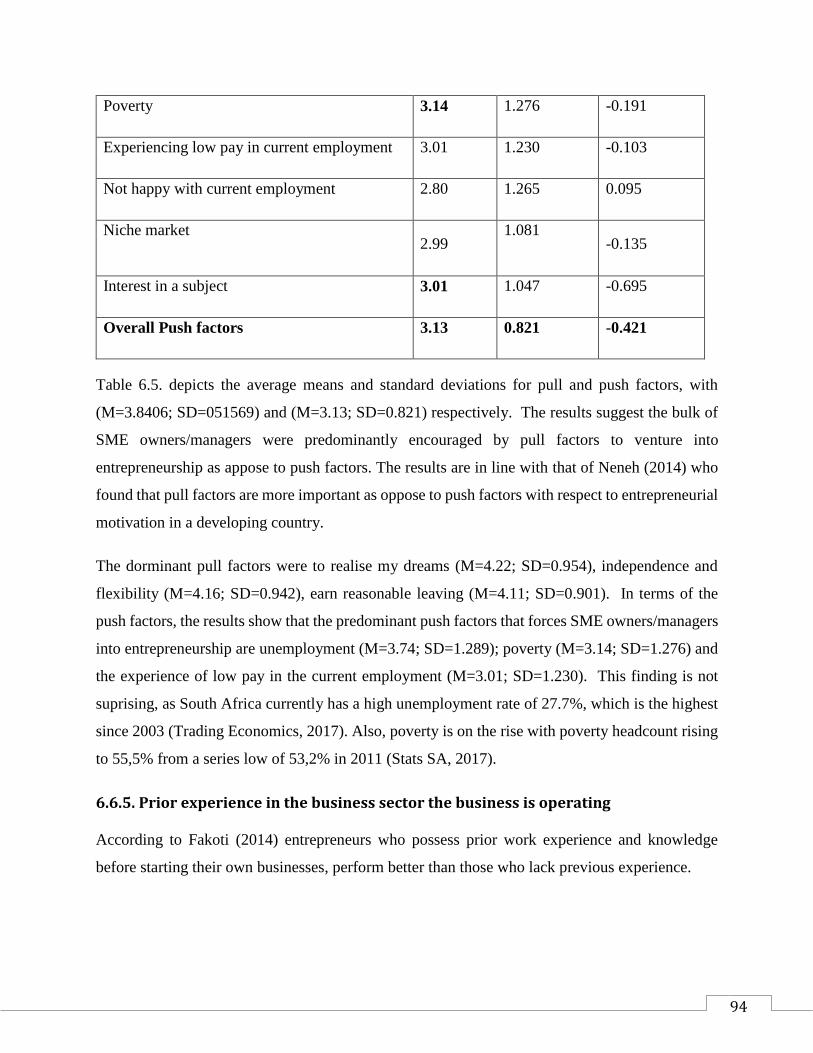
94
Poverty 3.14 1.276 -0.191
Experiencing low pay in current employment 3.01 1.230 -0.103
Not happy with current employment 2.80 1.265 0.095
Niche market 2.99
1.081
-0.135
Interest in a subject 3.01 1.047 -0.695
Overall Push factors 3.13 0.821 -0.421
Table 6.5. depicts the average means and standard deviations for pull and push factors, with
(M=3.8406; SD=051569) and (M=3.13; SD=0.821) respectively. The results suggest the bulk of
SME owners/managers were predominantly encouraged by pull factors to venture into
entrepreneurship as appose to push factors. The results are in line with that of Neneh (2014) who
found that pull factors are more important as oppose to push factors with respect to entrepreneurial
motivation in a developing country.
The dorminant pull factors were to realise my dreams (M=4.22; SD=0.954), independence and
flexibility (M=4.16; SD=0.942), earn reasonable leaving (M=4.11; SD=0.901). In terms of the
push factors, the results show that the predominant push factors that forces SME owners/managers
into entrepreneurship are unemployment (M=3.74; SD=1.289); poverty (M=3.14; SD=1.276) and
the experience of low pay in the current employment (M=3.01; SD=1.230). This finding is not
suprising, as South Africa currently has a high unemployment rate of 27.7%, which is the highest
since 2003 (Trading Economics, 2017). Also, poverty is on the rise with poverty headcount rising
to 55,5% from a series low of 53,2% in 2011 (Stats SA, 2017).
6.6.5. Prior experience in the business sector the business is operating
According to Fakoti (2014) entrepreneurs who possess prior work experience and knowledge
before starting their own businesses, perform better than those who lack previous experience.
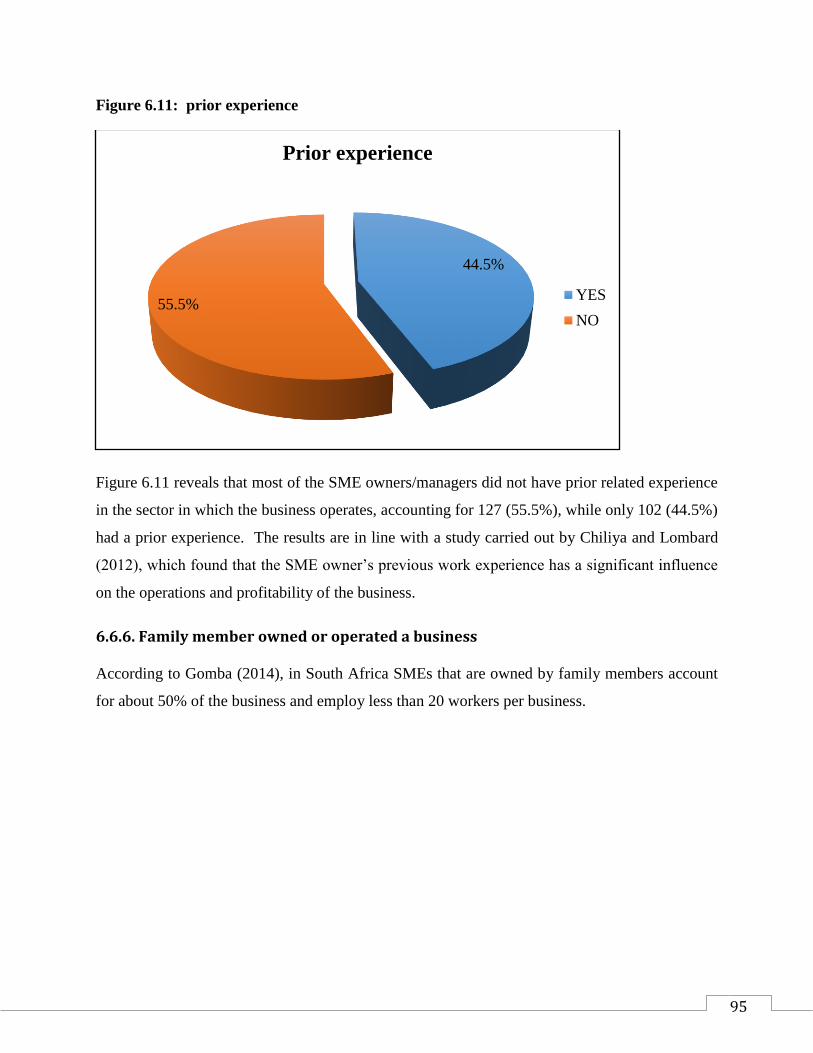
95
Figure 6.11: prior experience
Figure 6.11 reveals that most of the SME owners/managers did not have prior related experience
in the sector in which the business operates, accounting for 127 (55.5%), while only 102 (44.5%)
had a prior experience. The results are in line with a study carried out by Chiliya and Lombard
(2012), which found that the SME owner’s previous work experience has a significant influence
on the operations and profitability of the business.
6.6.6. Family member owned or operated a business
According to Gomba (2014), in South Africa SMEs that are owned by family members account
for about 50% of the business and employ less than 20 workers per business.
44.5%
55.5%
Prior experience
YES
NO
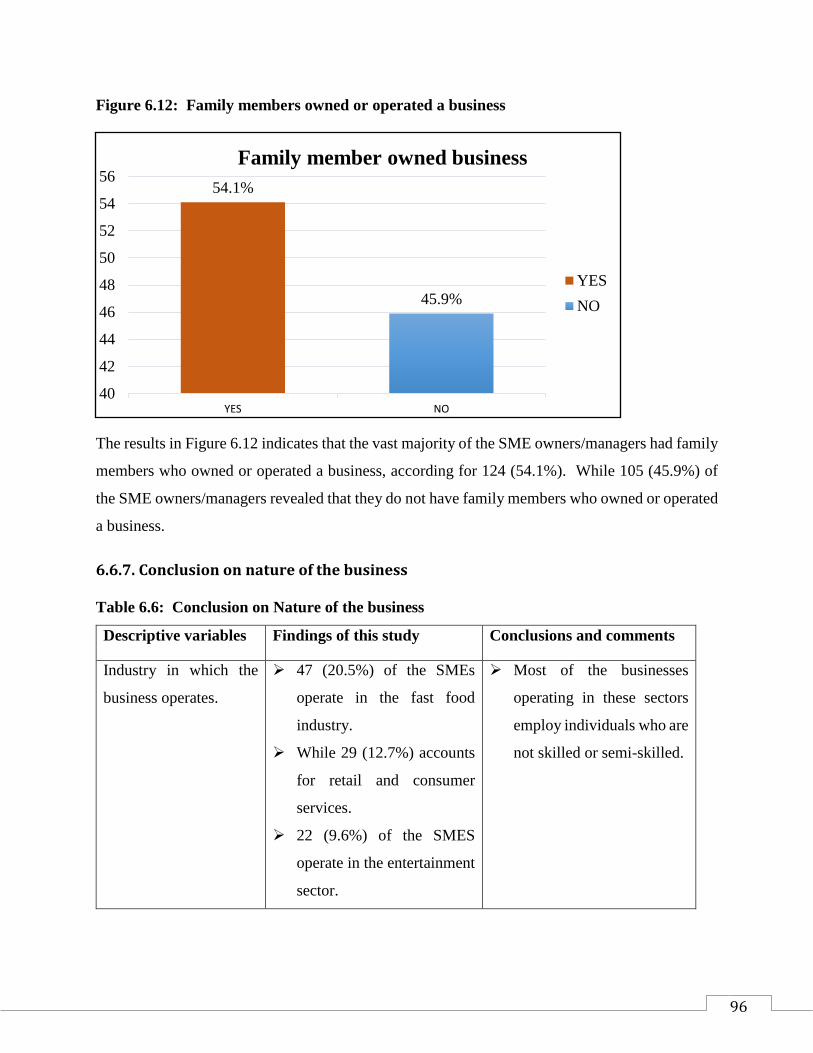
96
Figure 6.12: Family members owned or operated a business
The results in Figure 6.12 indicates that the vast majority of the SME owners/managers had family
members who owned or operated a business, according for 124 (54.1%). While 105 (45.9%) of
the SME owners/managers revealed that they do not have family members who owned or operated
a business.
6.6.7. Conclusion on nature of the business
Table 6.6: Conclusion on Nature of the business
Descriptive variables Findings of this study Conclusions and comments
Industry in which the
business operates.
47 (20.5%) of the SMEs
operate in the fast food
industry.
While 29 (12.7%) accounts
for retail and consumer
services.
22 (9.6%) of the SMES
operate in the entertainment
sector.
Most of the businesses
operating in these sectors
employ individuals who are
not skilled or semi-skilled.
54.1%
45.9%
40
42
44
46
48
50
52
54
56
YES NO
Family member owned business
YES
NO

97
Number of employees
the business employed.
The largest employer is
micro enterprises with 103
(45%).
Followed by very small
enterprises with 60 (26.2%)
people.
Laslty, small enterprises
that employs 44 (19.2%)
people.
Mutyenyoka and
Madzivhandila (2014)
found that Small Micro and
Medium Enterprises
account for about 72% of
all the jobs and contribute
to 35% of the South
Africa’s Growth Domestic
Product (GDP).
Start-up capital 41.9% of the SME
owners/managers used
personal saving as a start-up
capital.
21.4% of the SME
owners/managers sourced
start-up capital from banks
and other financial
institutions; and 14% of the
SME owners/managers
sourced start-up capital
from family members and
friends. Lastly, 11.4% of
the entrepreneurs raised
start-up capital from
inheritance and SEDA,
FDC, IDC.
Studies by Gathogo and
Ragui (2014), established
that 47.5% of the SME
owners/managers used
personal savings as a start-
up capital, followed by
capital from family and
friends and capital from
commercial banks, with
46.5% and 15%
respectively
Reasons/motives for
starting the business
SMEs owners are mainly
motivated by the pull factor
to venture into business
with the overall scale mean
(M=3.8406)
The results concur with
Neneh (2014) who found
that pull factors are more
important as oppose to
push factors with respect to
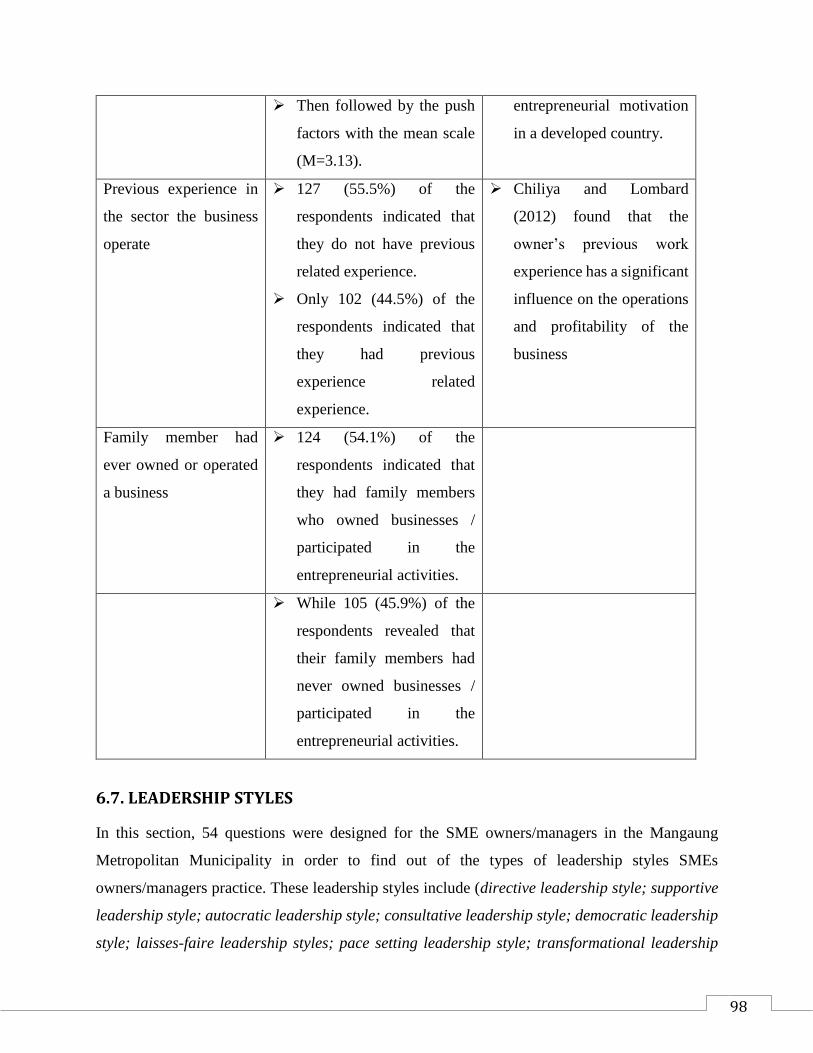
98
Then followed by the push
factors with the mean scale
(M=3.13).
entrepreneurial motivation
in a developed country.
Previous experience in
the sector the business
operate
127 (55.5%) of the
respondents indicated that
they do not have previous
related experience.
Only 102 (44.5%) of the
respondents indicated that
they had previous
experience related
experience.
Chiliya and Lombard
(2012) found that the
owner’s previous work
experience has a significant
influence on the operations
and profitability of the
business
Family member had
ever owned or operated
a business
124 (54.1%) of the
respondents indicated that
they had family members
who owned businesses /
participated in the
entrepreneurial activities.
While 105 (45.9%) of the
respondents revealed that
their family members had
never owned businesses /
participated in the
entrepreneurial activities.
6.7. LEADERSHIP STYLES
In this section, 54 questions were designed for the SME owners/managers in the Mangaung
Metropolitan Municipality in order to find out of the types of leadership styles SMEs
owners/managers practice. These leadership styles include (directive leadership style; supportive
leadership style; autocratic leadership style; consultative leadership style; democratic leadership
style; laisses-faire leadership styles; pace setting leadership style; transformational leadership
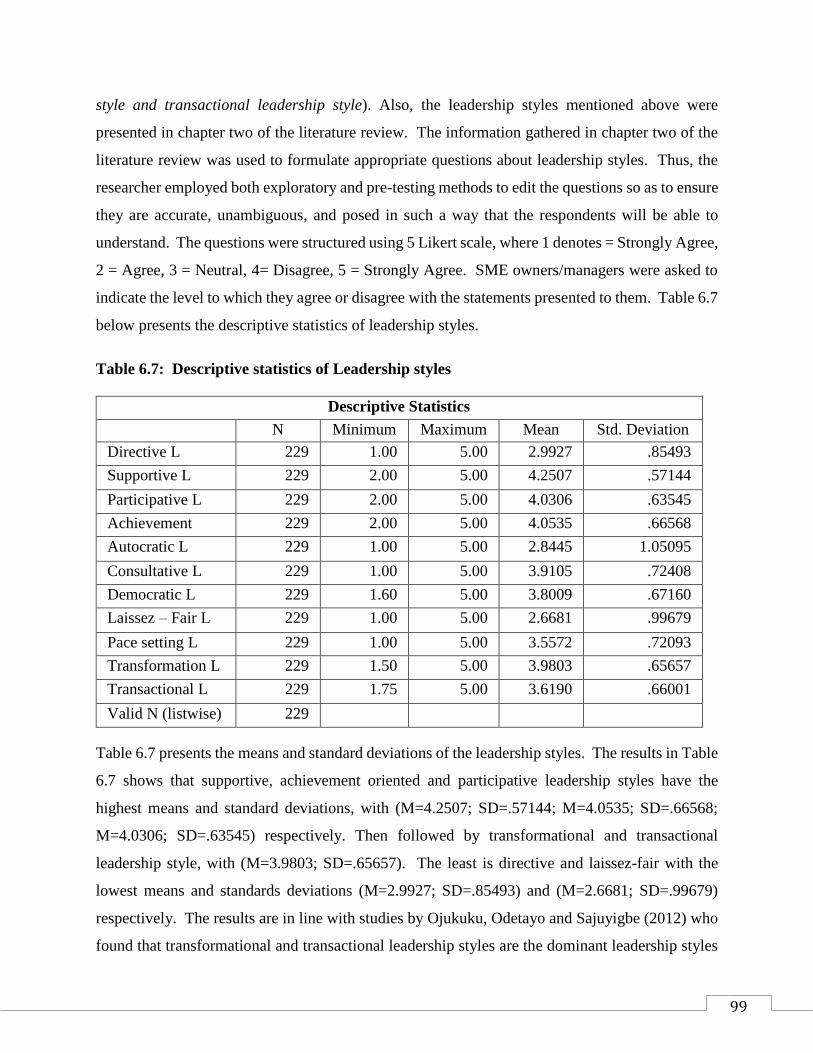
99
style and transactional leadership style). Also, the leadership styles mentioned above were
presented in chapter two of the literature review. The information gathered in chapter two of the
literature review was used to formulate appropriate questions about leadership styles. Thus, the
researcher employed both exploratory and pre-testing methods to edit the questions so as to ensure
they are accurate, unambiguous, and posed in such a way that the respondents will be able to
understand. The questions were structured using 5 Likert scale, where 1 denotes = Strongly Agree,
2 = Agree, 3 = Neutral, 4= Disagree, 5 = Strongly Agree. SME owners/managers were asked to
indicate the level to which they agree or disagree with the statements presented to them. Table 6.7
below presents the descriptive statistics of leadership styles.
Table 6.7: Descriptive statistics of Leadership styles
Descriptive Statistics
N Minimum Maximum Mean Std. Deviation
Directive L 229 1.00 5.00 2.9927 .85493
Supportive L 229 2.00 5.00 4.2507 .57144
Participative L 229 2.00 5.00 4.0306 .63545
Achievement 229 2.00 5.00 4.0535 .66568
Autocratic L 229 1.00 5.00 2.8445 1.05095
Consultative L 229 1.00 5.00 3.9105 .72408
Democratic L 229 1.60 5.00 3.8009 .67160
Laissez – Fair L 229 1.00 5.00 2.6681 .99679
Pace setting L 229 1.00 5.00 3.5572 .72093
Transformation L 229 1.50 5.00 3.9803 .65657
Transactional L 229 1.75 5.00 3.6190 .66001
Valid N (listwise) 229
Table 6.7 presents the means and standard deviations of the leadership styles. The results in Table
6.7 shows that supportive, achievement oriented and participative leadership styles have the
highest means and standard deviations, with (M=4.2507; SD=.57144; M=4.0535; SD=.66568;
M=4.0306; SD=.63545) respectively. Then followed by transformational and transactional
leadership style, with (M=3.9803; SD=.65657). The least is directive and laissez-fair with the
lowest means and standards deviations (M=2.9927; SD=.85493) and (M=2.6681; SD=.99679)
respectively. The results are in line with studies by Ojukuku, Odetayo and Sajuyigbe (2012) who
found that transformational and transactional leadership styles are the dominant leadership styles

100
used by SMEs, with (M=4.7667; SD=0.4265) and (M=3.0833; SD=1.0623) respectively.
Similarly, McLagan, Bezuidenhout and Botha (2013) found that transformation and transactional
leadership styles are the most used leadership styles among SMEs, with (M=2.55; SD=0.89) and
(M=2.07; SD=0.91) respectively. The results concur with that of Samad and Abdullah (2012) who
found that participative leadership style is the dominant leadership style used by the respondents.
Laissez-fair leadership styles being the least used leadership style could be attributed to the fact
that laissez-fair leadership style can lead to distraction in and of the workplace when the employees
need or want constant feedback, or when employees are junior workers and are inexperienced to
do the work on their own (Essien, Olesugun and Makaila, 2013).
6.7.1. Correlation analysis
According to Sandada (2012), correlation coefficient examines the relationship amongst variables.
Also, it is concerned with the degree to which the changes that occur in one variable effects change
in another variable. Table 6.8 below depicts correlation matrix of leadership styles.
Table 6.8 Correlation matrix of leadership styles
(1) (2) (3) (4) (5) (6) (7) (8) (9) (10) (11)
(1) Directive 1
(2) Supportive -0.15* 1
(3) Participative -0.13* 0.62
**
1
(4) Achievement 0.06 0.41
**
0.51
**
1
(5) Autocratic 0.49** -
0.17
*
-
0.15
*
-0.02 1
(6) Consultative -0.01 0.48
**
0.50
**
0.39
**
-0.12 1
(7) Democratic 0.09 0.35
**
0.37
**
0.35
**
-0.05 0.45
**
1
(8) Laissez-fair 0.38** -
0.19
**
-
0.23
**
-
0.13
*
0.58
**
-0.13 0.06 1
(9) Pace Setting 0.18** 0.02 0.11 0.24
**
0.32
**
0.19
**
0.22
**
0.27
**
1
(10) Transformational
0.04 0.43
**
0.46
**
0.37
**
-0.12 0.47
**
0.44
**
-
0.17
**
0.21
**
1
(11) Transactional
0.11 0.26
**
0.34
**
0.32
**
0.06 0.36
**
0.38
**
0.18
**
0.30
**
0.39 1
101
The results in Table 6.8 show the bivariate correlation matrix of the leadership styles. The results
indicate that the correlation coefficient values among the different leadership styles are below the
threshold of ±.70. Also, the correlation coefficients amongst the variables were values fairly
moderate as the values ranged between 0.04 to 0.51 . Also, collinearity statistics was performed to
test for the existence of multicollinearity and the maximum VIF score observed was less than 4,
which is lower than the threshold of 10, adopted by scholarly research as a rule of thumb (O’Brien,
2007).
The results depict the existence of a significant correlation amongst all the different leadership
styles, with directive leadership styles having a significant positive correlation with autocratic,
laissez fair, and pace setting leadership styles and a significant negative correlation with supportive
and participative leadership styles. Supportive leadership style has a significant positive
correlation with participative, achievement, consultative, democratic, transformational and
transactional leadership styles; and a negative correlation with autocratic and laissez fair leadership
styles. Also, participative leadership style has a significant positive correlation with achievement,
consultative, democratic, transformational and transactional leadership styles; and a negative
correlation with autocratic and laissez fair leadership styles. Achievement oriented leadership style
has a significant positive correlation with consultative, democratic, pace setting, transformational
and transactional leadership styles; and a negative correlation with laissez faire leadership style.
Furthermore, consultative leadership style has a positive significant correlation with democratic,
pace setting, transformational and transactional leadership styles. Democratic leadership style has
a significant positive correlation with pace setting, transformational and transactional leadership
styles. Laissez fair has a significant positive correlation with pace setting and transactional
leadership styles and a negative correlation with transformational leadership style. Lastly, pace
setting has a significant positive correlation with transformational and transactional leadership
styles. Kassim and Sulaiman (2011) found a positive correlation between achievement leadership
style and supportive leadership style.
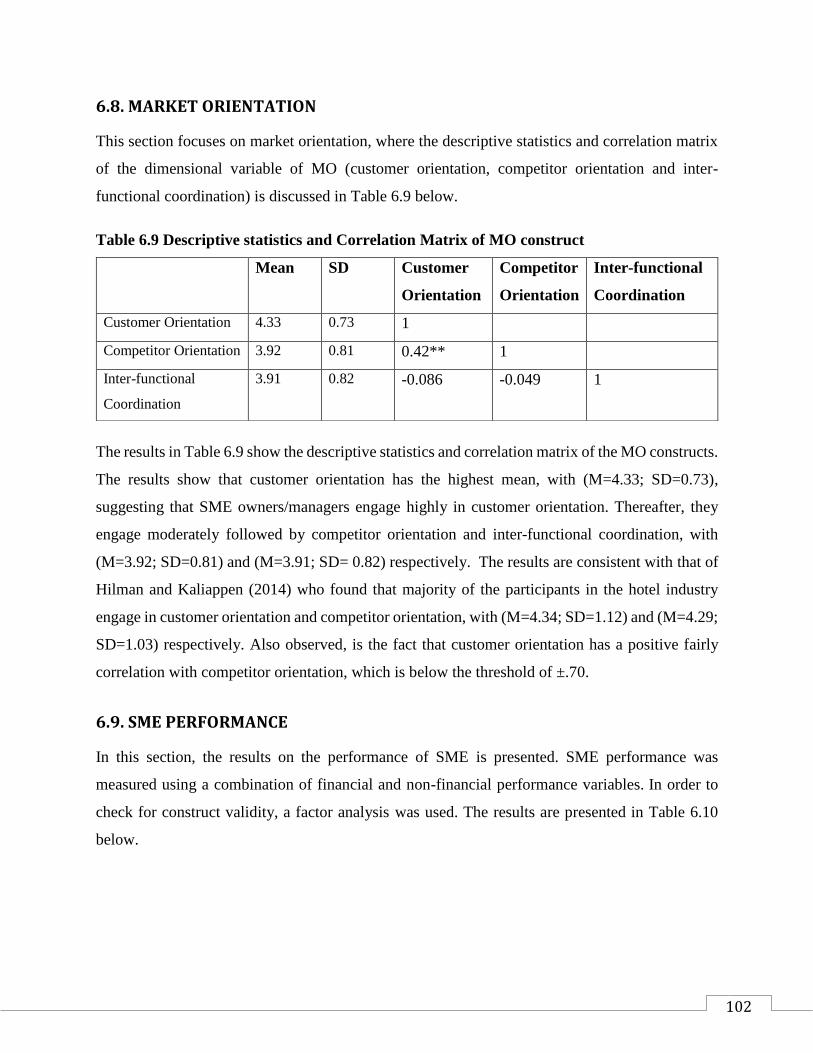
102
6.8. MARKET ORIENTATION
This section focuses on market orientation, where the descriptive statistics and correlation matrix
of the dimensional variable of MO (customer orientation, competitor orientation and inter-
functional coordination) is discussed in Table 6.9 below.
Table 6.9 Descriptive statistics and Correlation Matrix of MO construct
The results in Table 6.9 show the descriptive statistics and correlation matrix of the MO constructs.
The results show that customer orientation has the highest mean, with (M=4.33; SD=0.73),
suggesting that SME owners/managers engage highly in customer orientation. Thereafter, they
engage moderately followed by competitor orientation and inter-functional coordination, with
(M=3.92; SD=0.81) and (M=3.91; SD= 0.82) respectively. The results are consistent with that of
Hilman and Kaliappen (2014) who found that majority of the participants in the hotel industry
engage in customer orientation and competitor orientation, with (M=4.34; SD=1.12) and (M=4.29;
SD=1.03) respectively. Also observed, is the fact that customer orientation has a positive fairly
correlation with competitor orientation, which is below the threshold of ±.70.
6.9. SME PERFORMANCE
In this section, the results on the performance of SME is presented. SME performance was
measured using a combination of financial and non-financial performance variables. In order to
check for construct validity, a factor analysis was used. The results are presented in Table 6.10
below.
Mean SD Customer
Orientation
Competitor
Orientation
Inter-functional
Coordination
Customer Orientation 4.33 0.73 1
Competitor Orientation 3.92 0.81 0.42** 1
Inter-functional
Coordination
3.91 0.82 -0.086 -0.049 1

103
Table 6.10: The descriptive statistics and Factor Analysis for SMEs performance
Table 6.10 depict the results of the descriptive statistics and factor analysis for SMEs performance.
The factors were loaded into two components. Factor 1 was classified as non-financial
performance, while factor 2 was financial performance. These classifications followed extant
studies (Inmyxai and Takahashi, 2010; Neneh and Van Zyl, 2012; Fakoti, 2014; Maduekwe and
Kamala, 2016) that have also classified performance using these groupings. Factor one loaded with
an Eigen-value of 3.916 and accounting for a total variance of 43.514. Factor two loaded with an
Eigen-value of 1.163 and accounting for a total variance of 12.918. Also, the value for KMO is
0.847, which is greater than 0.5 and the value for barlette test is .000, which is less than 0.05, thus
Factors Mean St. Dev Factor one Factor two
Customer Satisfaction 4.19 0.775 0.705
Attracting new customers 4.14 0.767 0.837
Retaining old customers 4.20 0.784 0.705
Product/service quality 4.14 0.754 0.650
Overall Factor one 4.167 0.588
Market Share 3.68 0.882 0.647
Sales Growth 3.99 0.824 0.554
Net Profit 3.76 0.879 0.739
Cost efficiency 3.83 0.922 0.711
Return on Investment 3.76 0.888 0.847
Overall Factor two 3.804 0.639
Eigen Value 3.916 1.163
Variance 43.514 12.918
Cumulative variance 43.514 54.432
Cronbach Alpha 0.761 0.777
KMO 0.847
Bartlett’s test of sphericity (Chi-square) 632.612
Sig. 0.000***
N.B. PCA conducted using Varimax rotation
104
illustrating that the factor analysis is considered suitable. The Cronbach’s alpha of 0.761 and 0.777
were obtained for non-financial performance and financial performance respectively, which is
greater than the (alpha > 0.7) thus indicating the reliability of the measures, which validates the
use of these measure further analysis in section B.
Also, the results showed that non-financial performance (M=4.167; SD=0.588) had the highest
mean than financial performance (M=3.804; SD=0.639), suggesting that SME owners/managers
perform better in terms of non-financial performance measure (customer satisfaction, attracting
new customers, retaining old customers and product/service quality) but only have a moderate
performance in terms of financial performance measure (market share, sales growth, net profit,
cost efficiency, return on investment).
6.10. SECTION B: HYPOTHESES TESTING
In this section B, the empirical finding focuses on providing answers to the 15 hypotheses
established in chapter four of the literature review. The findings presented, are based on the impact
of leadership styles and SME performance (financial and non-financial performance), the impact
of market oreintation on SME performance (financial and non-financial performance), and the
mediating effect of market orientation on the leadership styles-SME performance (financial and
non-financial performance), relationship.
6.10.1. Leadership styles and SME performance
Eleven questions were asked in the hypothesis regarding the impact of leadership styles on SME
performance.
H1a: There is a negative relationship between directive leadership style and financial performance
H1b: There is a negative relationship between directive leadership style and non-financial
performance
H2a: There is a significant positive relationship between supportive leadership style and financial
performance
H2b: There is a significant positive relationship between supportive leadership style and non-
financial performance

105
H3a: There is a significant positive relationship between participative leadership style and
financial performance.
H3b: There is a significant positive relationship between participative leadership style and non-
financial performance.
H4a: There is a significant positive relationship between achievement orientated leadership style
and financial performance
H4b: There is a significant positive relationship between achievement orientated leadership style
and non-financial performance
H5a: There is a negative relationship between autocratic leadership style and financial
performance
H5b: There is a negative relationship between autocratic leadership style and non-financial
performance
H6a: There is a significant positive relationship between consultative leadership style and
financial performance
H6b There is a significant positive relationship between consultative leadership style and non-
financial performance
H7a: There is a significant positive relationship between democratic leadership style and financial
performance.
H7b: There is a significant positive relationship between democratic leadership style and non-
financial performance.
H8a: There is a significant negative relationship between laissez-fair leadership style and financial
performance.
H8b: There is a significant negative relationship between laissez-fair leadership style and non-
financial performance.

106
H9a: There is no significant relationship between pace setting leadership style and financial
performance.
H9b: There is no significant relationship between pace setting leadership style and non- financial
performance.
H10a: There is a significant positive relationship between transformational leadership style and
financial performance
H10b: There is a significant positive relationship between transformational leadership style and
non- financial performance
H11a: There is a positive relationship between transactional leadership style and financial
performance
H11b: There is a positive relationship between transactional leadership style and non-financial
performance. The results on these relationships are presented in Table 6.11 below;
Table 6.11: Regression analysis on leadership styles and SME performance (Financial and
non-financial performance).
Leadership Styles Non-financial performance Financial performance
R2 Beta T-value P-value R2 Beta T-value P-value
Directive 0.01 -0.04 -0.62 0.53 0.02 0.09 1.49 0.14
Supportive 0.06 0.22 3.34 0.001** 0.03 0.12 1.89 0.08
Participative 0.05 0.21 3.11 0.002** 0.02 0.09 1.40 0.16
Achievement 0.05 0.21 3.16 0.002** 0.02 0.05 0.69 0.49
Autocratic 0.01 -0.05 -0.73 0.47 0.03 0.11 1.61 0.11
Consultative 0.03 0.15 2.23 0.03* 0.02 0.08 1.12 0.27
Democratic 0.06 0.22 3.44 0.001** 0.04 0.16 2.41 0.02*
Laissez-fair 0.04 -0.18 -2.68 0.008** 0.02 0.03 0.35 0.72
Pace Setting 0.01 0.06 0.93 0.35 0.02 0.03 0.41 0.69
Transformational 0.05 0.20 2.99 0.003** 0.02 0.09 1.32 0.19
Transactional 0.02 0.10 1.56 0.12 0.05 0.19 2.86 0.005**
Regression results for the effect of each leadership style on firm performance controlling for the effect
of firm size and age.
** Sig at 1% level; * Sig at the 5% level

107
Table 6.11 shows the results of the regression analysis on the leadership styles and SME
performance (non-financial performance and financial performance after controlling for the effect
of firm size and age). The results show that directive, autocratic, and laissez-fair leadership styles
are the three leadership styles that do not have any significant relationship with both non-financial
performance and financial performance.
With regards to non-financial performance, the result indicates that supportive, participative,
achievement, consultative, democratic, and transformational leadership styles have a positive
relationship with non-financial performance, while laissez-fair has a negative relationship with
non-financial performance. With respect to financial performance, the results show that only
democratic and transactional leadership styles have a positive relationship with financial
performance and these results are significant at the 5% level. The results are consistent with
studies by Patiar and Mia (2009) who found that there is a positive relationship between
transformational leadership and financial performance. The results contradict studies by Zadeh
(2016) who found a significant positive relationship between supportive, participative, and
transactional leadership styles and financial performance.
6.10.2. Market orientation and SME performance
Three questions were asked in the hypothesis regarding the impact of market orientation on SME
performance.
H12a: There is a significant and positive relationship between customer orientation and financial
performance
H12b: There is a significant and positive relationship between customer orientation and non-
financial performance
H13a: There is a significant positive relationship between competitor orientation and financial
performance
H13b: There is a significant positive relationship between competitor orientation and non-
financial performance

108
H14a: There is no significant relationship between inter-functional coordination and financial
performance
H14b: There is no significant relationship between inter-functional coordination and non-
financial performance.
The results of these relationships are presented on Table 6.12 below;
Table 6.12: Regression analysis on MO and SME performance Financial and non-financial
performance).
Customer
orientation construct
Non – financial performance Financial performance
R2 Beta T-value P-value R2 Beta T-value P-value
Customer orientation 0.09 0.29 4.50 0.000** 0.03 0.34 2.00 0.046*
Competitive
Orientation
0.07 0.24 3.66 0.000** 0.07 0.23 3.51 0.001**
Inter-functional
Coordination
0.02 -0.06 -0.85 0.398 0.02 -0.14 -2.05 0.041*
Regression results for the effect of each MO construct on firm performance controlling for the
effect of firm size and age.
** Sig at 1% level; * Sig at the 5% level
Table 6.12 shows the results of the regression analysis on the market orientation construct
(customer orientation, competitor orientation and inter-functional coordination) and SME
performance (non-financial performance and financial performance) after controlling for the effect
of firm size and age. With regards to non-financial performance, the result indicates that inter-
functional coordination did not have any relationship with non-financial performance, while
customer orientation and competitive orientation have a significant positive relationship with non-
financial performance and the results are significant at the 5% level. The results are consistent with
the findings of Al-mawali, Zainuddin and Ali (2010) that there is a positive association between
customer orientation and firm performance.
Furthermore, with respect to financial performance, the result show that all three construct of MO
(customer orientation, competitive orientation and inter-functional coordination) have a positive
relationship with financial performance and the results are significant at the 1% level for
competitive orientation and 5% level for customer orientation and inter-functional coordination
109
respectively. The results are congruent with prior studies (Asikhia, 2010; Neneh, 2016; Asomaning
and Abdulai, 2015) who also established a positive association between customer orientation,
competitive orientation and inter-functional coordination and firm performance (growth of market
share, return on investment, sales growth, and net profit).
Following the above, hypothesis H12a, H12b, H13a, H13b, and H14b were accepted, while H14a
was rejected. Hence, it can be concluded that
H12a: There is a significant and positive relationship between customer orientation and
financial performance
H12b: There is a significant and positive relationship between customer orientation and
non- financial performance
H13a: There is a significant positive relationship between competitor orientation and
financial performance
H13b: There is a significant positive relationship between competitor orientation and
non-financial performance
H14b: There is no significant relationship between inter-functional coordination and
non-financial performance.
6.11. THE MEDIATING RELATIONSHIP BETWEEN MARKET ORIENTATION AND LEADERSHIP STYLES
When performing the mediating analysis, Baron and Kenny (1986), the Sobel test and the
bootstrapping are the methods used. All these model will be used in establishing the mediating
relationship between market orientation and leadership styles.
6.11.1. Mediating effect using Baron and Kenny
Baron and Kenny (1986) put forward four-step framework that helps to ascertain if the proposed
mediation occurs. These four steps are:
Step 1- the significant effect of the independent variable on the dependent variable,
Step 2 - the significant relationship of the independent variable with the mediator,
Step 3-The significant effect of the mediator on the dependent variable, and

110
Step 4- The significant relationship between the independent and the dependent variable when
controlling for the mediating effect.
If all the four steps mentioned above occurred, consequently the data are in line with the hypothesis
that suggest variable M completely mediates the relationship between variable X-Y. However, if
the first three steps occurred with the exception of step four, the results demonstrate a partial
mediation.
Step 1: focuses on the significant effect of the independent variable (Leadership styles) on
the dependent variable (SME performance). This results were already established in Table 6.12
above, where it was established that directive, autocratic and pace setting leadership styles are the
three leadership styles that do not have any significant relationship with non-financial performance
and financial performance. These three leadership styles are eliminated from the mediation
analysis.
Step 2: focuses on the significant effect of the independent variable (Leadership styles) on
the mediator (Market orientation).
The results of this relationship is presented in Table 6.13 below.

111
Table 6.13: Regression analysis on leadership styles and Market orientation construct
Leadership
Styles
Market Orientation
Customer Orientation Competitor Orientation Inter-functional
Coordination
Beta T-
value
P-value Beta T-
value
P-value Beta T-
value
P-value
Supportive 0.33 5.33 0.000** 0.19 2.92 0.004** 0.12 1.76 0.80
Participative 0.31 4.86 0.000** 0.25 3.94 0.000** -0.02 -0.33 0.74
Achievement 0.38 6.22 0.000** 0.31 4.90 0.000** 0.14 2.09 0.04*
Consultative 0.25 3.92 0.000** 0.22 3.38 0.001** 0.02 0.28 0.78
Democratic 0.15 2.35 0.020* 0.30 4.80 0.000** 0.03 0.49 0.62
Laissez-fair -0.36 -5.76 0.000** -0.06 -0.92 0.36 0.01 0.14 0.89
Transformational 0.38 6.20 0.000** 0.32 5.02 0.000** 0.04 0.58 0.57
Transactional 0.16 2.43 0.016* 0.25 3.90 0.000** -0.04 -0.63 0.53
Regression results for the effect of each leadership style on firm performance controlling for the
effect of firm size and age.
The results in Table 6.13 shows the regression analysis on the effect of leadership styles on market
orientation construct (customer orientation, competitive orientation, and inter-functional
coordination). The result reveals that only achievement leadership style has a significant positive
relationship with all the three constructs on market orientation and the results are statistically
significant at the 1% level for customer and competitive orientation and 5% level for inter-
functional coordination. The results are consistent with that of Kassim and Sulaiman (2011) who
established that there is a positive and significant relationship between supportive leadership style
and market orientation. Also established, is the fact that supportive, participative, achievement,
consultative, democratic, transformational and transactional leadership styles have a significant
positive relationship with the customer, and competitive orientation and the results are statistically
significant at the 1% level. The results confirm the findings by Widiana (2017) that
transformational leadership has a significant influence on market orientation.

112
Step 3: focuses on the significant effect of the mediator (Market oriention) on the dependent
variable (SME performance)
This result was already established in Table 6.13 above, where it was established that customer
orientation and competitive orientation has a significant positive relationship with non-financial
performance, while three construct of MO (customer orientation, competitive orientation and inter-
functional coordination) have a positive relationship with financial performance.
Step 4: The significant relationship between the independent (Leasdership styles) and the
dependent variable (SME performance) when controlling for the mediating effect (Market
orientation)
The results of this relationship is presented in Table 6.14 below;
Table 6.14: The significant relationship between the independent and the dependent variable
when controlling for the mediating effect
Leadership Style Performance Dimension Mediator factors (MO)
Non-financial
Performance
Financial
performance
Customer
orientation
Competitor
orientation
Inter-
functional
Coordination
Supportive X - X X -
Participative X - X X -
Achievement X - X X X
Consultative X - X X -
Democratic X X X X -
Laissez-fair X - X - -
Transformational X - X X -
Transactional - X X X -
Based on Table 6.14 above, the following relationships is mediated by market orientation
1. Mediating effect of customer orientation on the relationship between supportive leadership
style and non-financial performance
2. Mediating effect of competitor orientation on the relationship between supportive leadership
style and non-financial performance
113
3. Mediating effect of competitor orientation on the relationship between participative leadership
style and non-financial performance
4. Mediating effect of customer orientation on the relationship between participative leadership
style and non-financial performance
5. Mediating effect of customer orientation on the relationship between achievement leadership
style and non-financial performance
6. Mediating effect of competitor orientation on the relationship between achievement leadership
style and non-financial performance
7. Mediating effect of competitor orientation on the relationship between consultative leadership
style and non-financial performance
8. Mediating effect of competitor orientation on the relationship between democratic leadership
style and non-financial performance
9. Mediating effect of customer orientation on the relationship between laissez-fair leadership
style and non-financial performance
10. Mediating effect of customer orientation on the relationship between transformational
leadership style and non-financial performance
11. Mediating effect of competitor orientation on the relationship between transformational
leadership style and non-financial performance
12. Mediating effect of competitor orientation on the relationship between transactional leadership
style and financial performance
13. Mediating effect of competitor orientation on the relationship between democratic leadership
style and financial performance
6.11.2. Mediating effect using Sobel’s Test and Bootstrapping
The results on the mediating effect using the Sobel’s test and Bootstrapping is presented based on
the thirteen (13) relationships established in step 4 above (Table 6.14) based on the Baron and
Kenny four step.
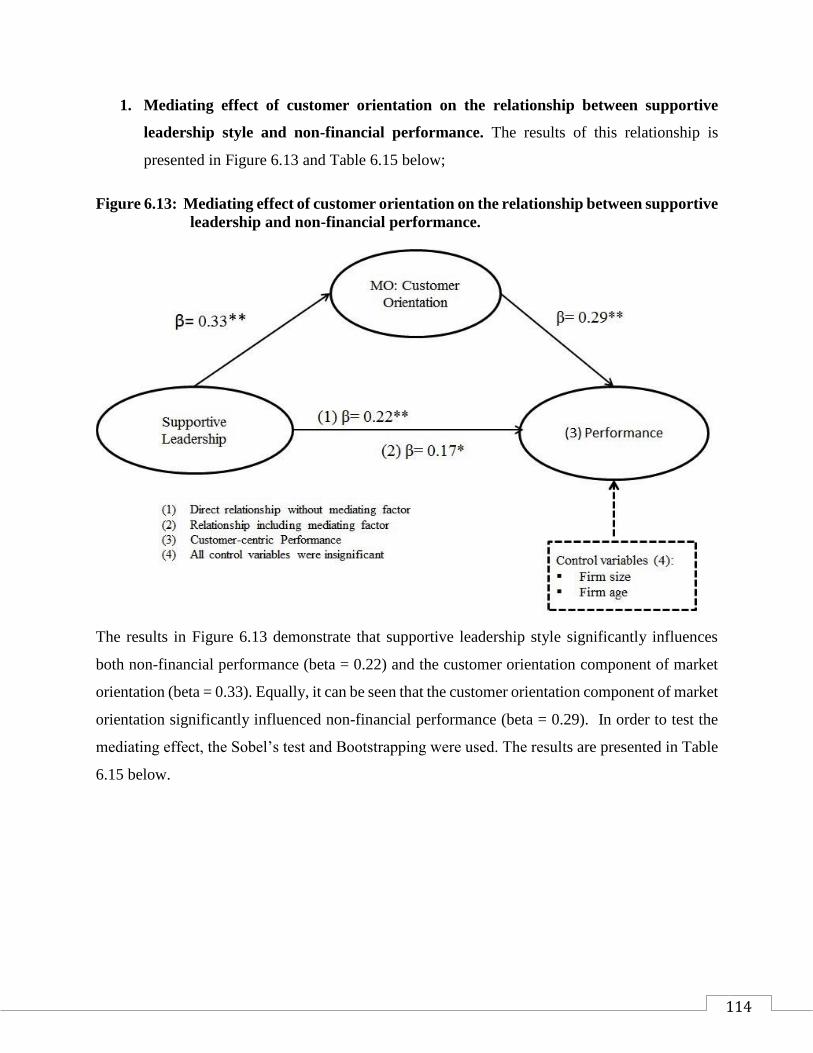
114
1. Mediating effect of customer orientation on the relationship between supportive
leadership style and non-financial performance. The results of this relationship is
presented in Figure 6.13 and Table 6.15 below;
Figure 6.13: Mediating effect of customer orientation on the relationship between supportive
leadership and non-financial performance.
The results in Figure 6.13 demonstrate that supportive leadership style significantly influences
both non-financial performance (beta = 0.22) and the customer orientation component of market
orientation (beta = 0.33). Equally, it can be seen that the customer orientation component of market
orientation significantly influenced non-financial performance (beta = 0.29). In order to test the
mediating effect, the Sobel’s test and Bootstrapping were used. The results are presented in Table
6.15 below.

115
Table 6.15: Mediating effect of customer orientation on the relationship between supportive
leadership style and non-financial performance using Sobel’s Test and
Bootstrapping.
Sobels Test Bootstrapping
Indirect Effect 0.051 Indirect Effect 0.051
Sobel’s standard error 0.0250 Bootstrapping
standard error
0.0253
Z – statistic 2.037 95% LCI 0.0083
P-Value 0.042* 95% UCI 0.1112
Portion of relationship between
supportive leadership and non-
financial performance
mediated by customer orientation
22.7% Decision Partial
mediation
*Sig at 5%
From table 6.15, it is seen that the z-statistics for the Sobel’s test is significant at the 5% level (Z
= 2.037, p <0.05) and the bootstrapping confidence interval does not include zero (LCI = 0.0083,
UCI = 0.1112). As such, using both the Sobel’s test and Bootstrapping, it is confirmed that the
customer orientation component of market orientation partially mediates the relationship between
supportive leadership style and non-financial performance.

116
2. Mediating effect of competitor orientation on the relationship between supportive
leadership and non-financial performance. The results of this relationship is presented
in Figure 6.14 and Table 6.16 below
Figure 6.14: Mediating effect of competitor orientation on the relationship between
supportive leadership and non-financial performance.
The results in Figure 6.14 show that supportive leadership style significantly influences both non-
financial performance (beta = 0.22) and the competitor orientation component of market
orientation (beta = 0.19). Equally, it can be seen that the competitor orientation component of
market orientation significantly influenced non-financial performance (beta = 0.24). This clearly
suggests the existence of a mediation effect. In order to test the mediating effect, the Sobel’s test
and Bootstrapping were used. The results are presented in Table 6.16 below.

117
Table 6.16: Mediating effect of MO: competitor orientation using on the relationship
between supportive leadership and performance using Sobel’s Test and
Bootstrapping.
Sobels Test Bootstrapping
Indirect Effect 0.0617 Indirect Effect 0.0617
Sobel’s Standard error 0.0190 Bootstrapping
standard error
0.0195
Z - statistic 2.192 95% LCI 0.0124
P-Value 0.028* 95% UCI 0.0932
Portion of relationship between
supportive leadership and non-
financial performance
mediated by competitor orientation
27.3% Decision Partial
mediation
*Sig at 5%
From Table 6.16, it is seen that the z-statistics for the Sobel’s test is significant at the 5% level (Z
= 2.192, p <0.05) and the bootstrapping confidence interval does not include zero (LCI = 0.0124,
UCI = 0.0932). As such, using both the Sobel’s test and Bootstrapping, it is confirmed that the
competitor orientation component of market orientation partially mediates the relationship
between supportive leadership style and non-financial performance.
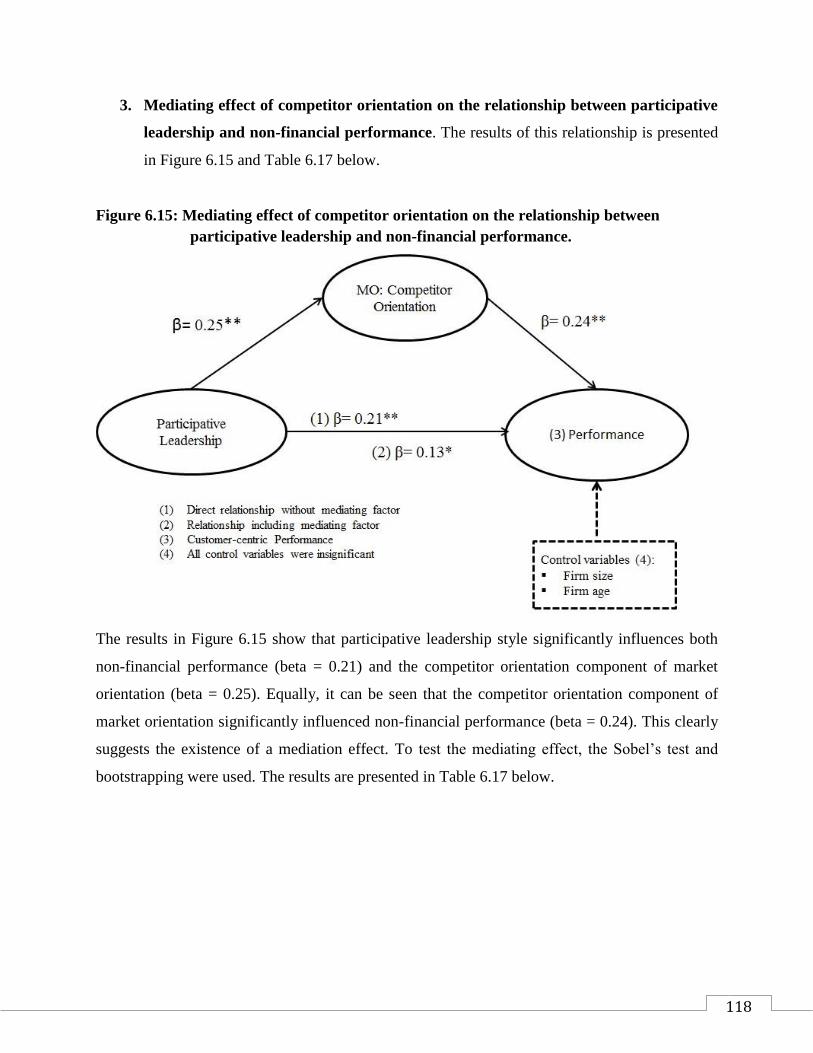
118
3. Mediating effect of competitor orientation on the relationship between participative
leadership and non-financial performance. The results of this relationship is presented
in Figure 6.15 and Table 6.17 below.
Figure 6.15: Mediating effect of competitor orientation on the relationship between
participative leadership and non-financial performance.
The results in Figure 6.15 show that participative leadership style significantly influences both
non-financial performance (beta = 0.21) and the competitor orientation component of market
orientation (beta = 0.25). Equally, it can be seen that the competitor orientation component of
market orientation significantly influenced non-financial performance (beta = 0.24). This clearly
suggests the existence of a mediation effect. To test the mediating effect, the Sobel’s test and
bootstrapping were used. The results are presented in Table 6.17 below.

119
Table 6.17: Mediating effect of competitor orientation on the relationship between
participative leadership and non-financial performance using Sobel’s Test and
Bootstrapping.
Sobels Test Bootstrapping
Indirect Effect 0.0795 Indirect Effect 0.0795
Sobel’s Standard error 0.0195 Bootstrapping
standard error
0.0198
Z - statistic 2.233 95% LCI 0.0185
P-Value 0.011* 95% UCI 0.1005
Portion of relationship between
participative leadership and non-
financial performance
mediated by competitor orientation
38.1% Decision Partial
mediation
*Sig at 5%
From table 6.17, it is seen that the z-statistics for the Sobel’s test is significant at the 5% level (Z
= 2.233, p <0.05) and the bootstrapping confidence interval does not include zero (LCI = 0.0185,
UCI = 0.1005). As such, using both the Sobel’s test and Bootstrapping, it is confirmed that the
competitor orientation component of market orientation partially mediates the relationship
between participative leadership style and non-financial performance.

120
4. Mediating effect of customer orientation on the relationship between participative
leadership and non-financial performance. The results of this relationship is presented
in Figure 6.16 and Table 6.18 below;
Figure 6.16: Mediating effect of customer orientation on the relationship between
participative leadership and non-financial performance.
The results in Figure 6.16 show that participative leadership style significantly influences both
non-financial performance (beta = 0.21) and the customer orientation component of market
orientation (beta = 0.31). Equally, it can be seen that the customer orientation component of market
orientation significantly influenced non-financial performance (beta = 0.29). This clearly suggests
the existence of a mediation effect. In order to test the mediating effect, the Sobel’s test and
bootstrapping were used. The results are presented in Table 6.18 below;
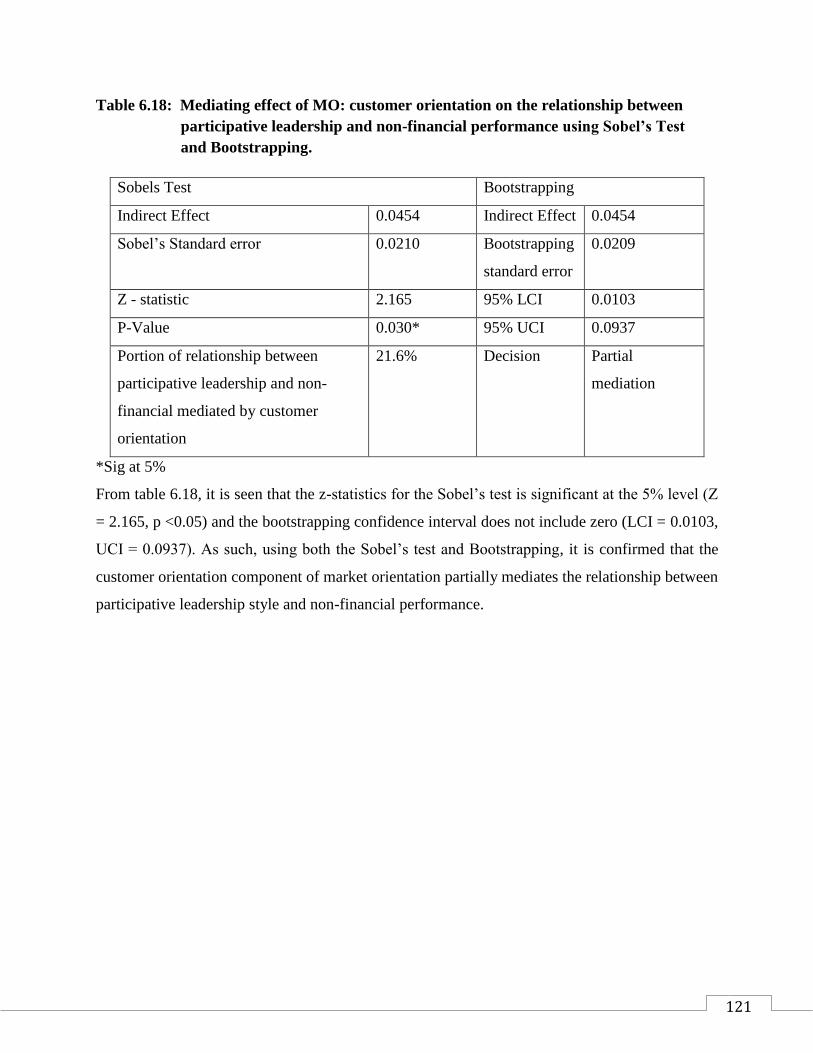
121
Table 6.18: Mediating effect of MO: customer orientation on the relationship between
participative leadership and non-financial performance using Sobel’s Test
and Bootstrapping.
Sobels Test Bootstrapping
Indirect Effect 0.0454 Indirect Effect 0.0454
Sobel’s Standard error 0.0210 Bootstrapping
standard error
0.0209
Z - statistic 2.165 95% LCI 0.0103
P-Value 0.030* 95% UCI 0.0937
Portion of relationship between
participative leadership and non-
financial mediated by customer
orientation
21.6% Decision Partial
mediation
*Sig at 5%
From table 6.18, it is seen that the z-statistics for the Sobel’s test is significant at the 5% level (Z
= 2.165, p <0.05) and the bootstrapping confidence interval does not include zero (LCI = 0.0103,
UCI = 0.0937). As such, using both the Sobel’s test and Bootstrapping, it is confirmed that the
customer orientation component of market orientation partially mediates the relationship between
participative leadership style and non-financial performance.

122
5. Mediating effect of customer orientation on the relationship between achievement
leadership and non-financial performance. The results of this relationship is presented
in Figure 6.17 and Table 6.19 below;
Figure 6.17: Mediating effect of customer orientation on the relationship between
achievement leadership and non-financial performance.
The results in Figure 6.17 show that achievement leadership style significantly influences both
non-financial performance (beta = 0.21) and the customer orientation component of market
orientation (beta = 0.31). Equally, it can be seen that the customer orientation component of market
orientation positively and significantly influenced non-financial performance (beta = 0.24). This
clearly suggests the existence of a mediation effect. In order to test the mediating effect, the Sobel’s
test and bootstrapping were used. The results are presented in Table 6.19 below;
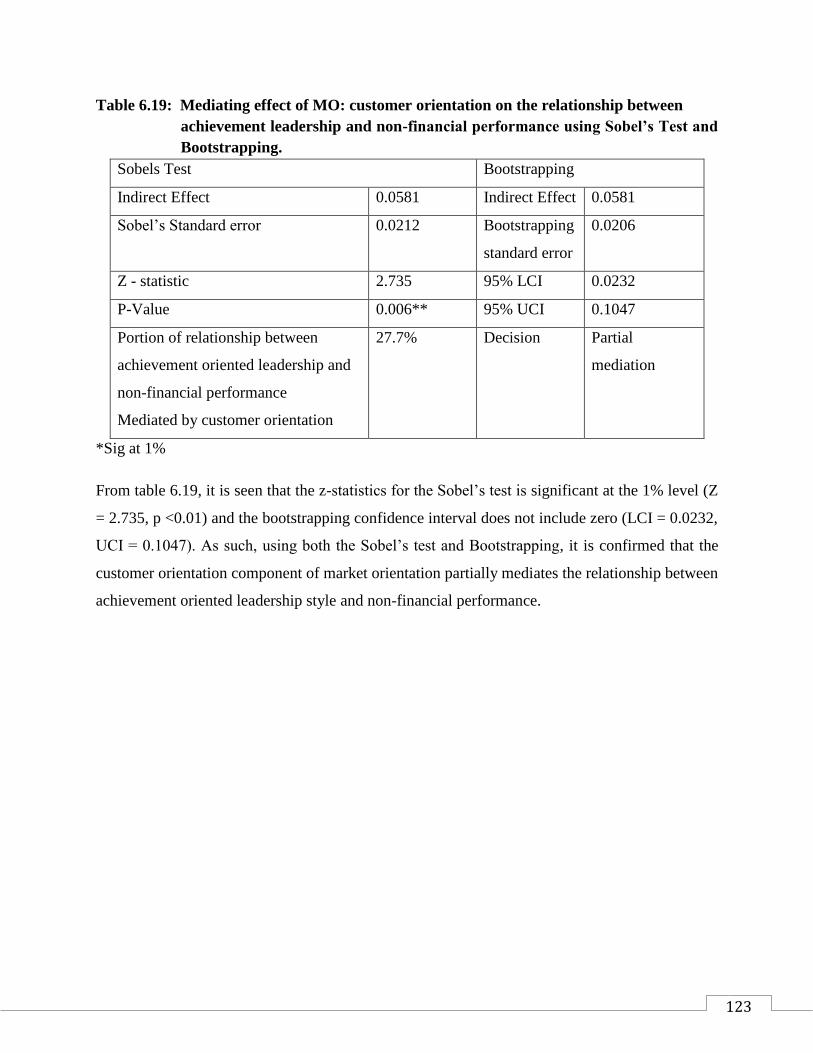
123
Table 6.19: Mediating effect of MO: customer orientation on the relationship between
achievement leadership and non-financial performance using Sobel’s Test and
Bootstrapping.
Sobels Test Bootstrapping
Indirect Effect 0.0581 Indirect Effect 0.0581
Sobel’s Standard error 0.0212 Bootstrapping
standard error
0.0206
Z - statistic 2.735 95% LCI 0.0232
P-Value 0.006** 95% UCI 0.1047
Portion of relationship between
achievement oriented leadership and
non-financial performance
Mediated by customer orientation
27.7% Decision Partial
mediation
*Sig at 1%
From table 6.19, it is seen that the z-statistics for the Sobel’s test is significant at the 1% level (Z
= 2.735, p <0.01) and the bootstrapping confidence interval does not include zero (LCI = 0.0232,
UCI = 0.1047). As such, using both the Sobel’s test and Bootstrapping, it is confirmed that the
customer orientation component of market orientation partially mediates the relationship between
achievement oriented leadership style and non-financial performance.

124
6. Mediating effect of competitor orientation on the relationship between achievement
leadership and non-financial performance. The results of this relationship is presented
in Figure 6.18 and Table 6.20 below;
Figure 6.18: Mediating effect of competitor orientation on the relationship between
achievement leadership and non-financial performance.
The results in Figure 6.18 show that achievement oriented leadership style significantly influences
both non-financial performance (beta = 0.21) and the competitor orientation component of market
orientation (beta = 0.31). Equally, it can be seen that the competitor orientation component of
market orientation significantly influenced non-financial performance (beta = 0.24). This clearly
suggests the existence of a mediation effect. In order to test the mediating effect, the Sobel’s test
and bootstrapping were used. The results are presented in Table 6.20 below.

125
Table 6.20: Mediating effect of competitor orientation on the relationship between
achievement leadership and non-financial performance using Sobel’s Test and
Bootstrapping.
Sobels Test Bootstrapping
Indirect Effect 0.0581 Indirect Effect 0.0581
Sobel’s Standard error 0.0212 Bootstrapping
standard error
0.0206
Z - statistic 2.735 95% LCI 0.0232
P-Value 0.006** 95% UCI 0.1047
Portion of relationship between
achievement leadership and non-
financial performance
Mediated by customer orientation
27.7% Decision Partial
mediation
*Sig at 1%
From Table 6.20 it is seen that the z-statistics for the Sobel’s test is significant at the 1% level (Z
= 2.735, p <0.01) and the bootstrapping confidence interval does not include zero (LCI = 0.0232,
UCI = 0.1047). As such, using both the Sobel’s test and Bootstrapping, it is confirmed that the
competitor orientation component of market orientation partially mediates the relationship
between achievement oriented leadership style and non-financial performance.
7. Mediating effect of competitor orientation on the relationship between consultative
leadership and non-financial performace. The results of this relationship is presented in
Figure 6.19 and Table 6.21 below.

126
Figure 6.19: Mediating effect of competitor orientation on the relationship between
consultative leadership and non-financial performance.
The results in Figure 6.19 show that consultative leadership style significantly influences both non-
financial performance (beta = 0.15) and the competitor orientation component of market
orientation (beta = 0.22). Equally, it can be seen that the competitor orientation component of
market orientation significantly influences non-financial performance (beta = 0.24). This clearly
suggests the existence of a mediation effect. In order to test the mediating effect, the Sobel’s test
and bootstrapping were used. The results are presented in Table 6.21 below;

127
Table 6.21: Mediating effect of competitor orientation on the relationship between
consultative leadership and non-financial performance using Sobel’s Test and
Bootstrapping.
Sobels Test Bootstrapping
Indirect Effect 0.0863 Indirect Effect 0.0863
Sobel’s Standard error 0.0185 Bootstrapping
standard error
0.0191
Z - statistic 2.506 95% LCI 0.0162
P-Value 0.012* 95% UCI 0.0920
Portion of relationship between
consultative leadership and non-
financial performance
Mediated by customer orientation
57.5% Decision Full mediation
*Sig at 5%
From Table 6.21, it is seen that the z-statistics for the Sobel’s test is significant at the 5% level (Z
= 2.506, p <0.05) and the bootstrapping confidence interval does not include zero (LCI = 0.0162,
UCI = 0.0920). As such, using both the Sobel’s test and Bootstrapping it is confirmed that the
competitor orientation component of market orientation fully mediates the relationship between
consultative leadership style and non-financial performance.
8. Mediating effect of competitor orientation on the relationship between democratic
leadership and non-financial performance. The results of this relationship is presented
in Figure 6.20 and Table 6.22 below;
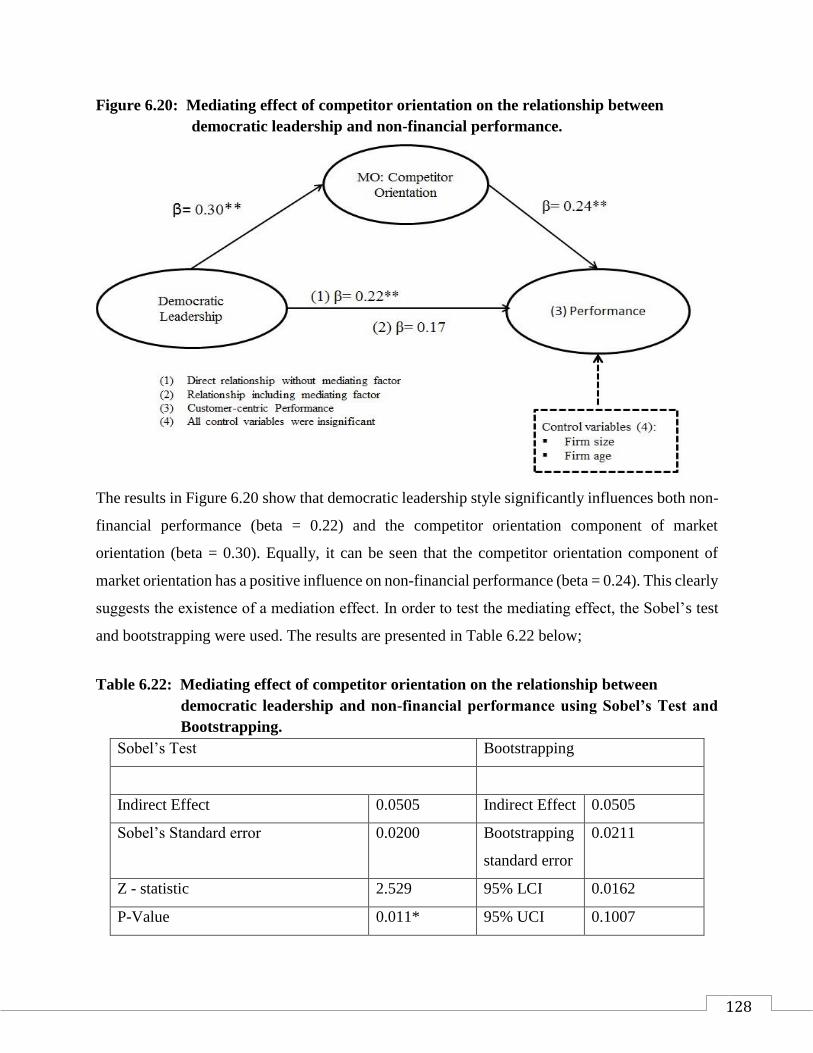
128
Figure 6.20: Mediating effect of competitor orientation on the relationship between
democratic leadership and non-financial performance.
The results in Figure 6.20 show that democratic leadership style significantly influences both non-
financial performance (beta = 0.22) and the competitor orientation component of market
orientation (beta = 0.30). Equally, it can be seen that the competitor orientation component of
market orientation has a positive influence on non-financial performance (beta = 0.24). This clearly
suggests the existence of a mediation effect. In order to test the mediating effect, the Sobel’s test
and bootstrapping were used. The results are presented in Table 6.22 below;
Table 6.22: Mediating effect of competitor orientation on the relationship between
democratic leadership and non-financial performance using Sobel’s Test and
Bootstrapping.
Sobel’s Test Bootstrapping
Indirect Effect 0.0505 Indirect Effect 0.0505
Sobel’s Standard error 0.0200 Bootstrapping
standard error
0.0211
Z - statistic 2.529 95% LCI 0.0162
P-Value 0.011* 95% UCI 0.1007
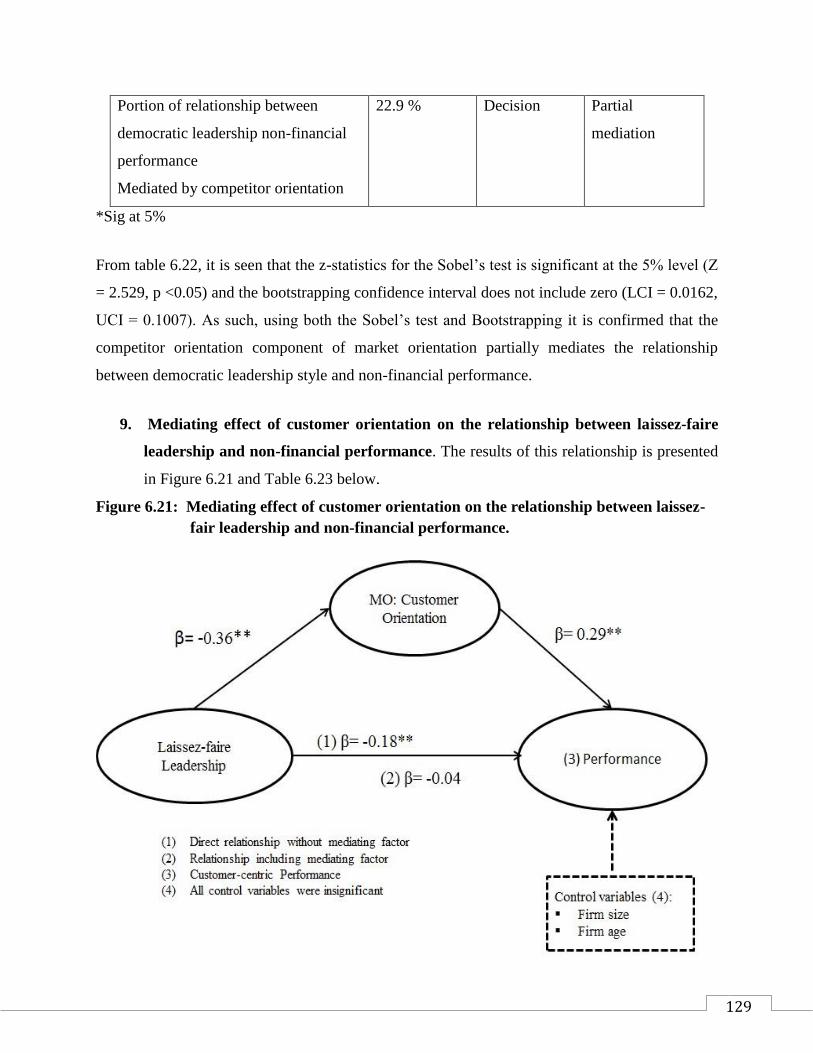
129
Portion of relationship between
democratic leadership non-financial
performance
Mediated by competitor orientation
22.9 % Decision Partial
mediation
*Sig at 5%
From table 6.22, it is seen that the z-statistics for the Sobel’s test is significant at the 5% level (Z
= 2.529, p <0.05) and the bootstrapping confidence interval does not include zero (LCI = 0.0162,
UCI = 0.1007). As such, using both the Sobel’s test and Bootstrapping it is confirmed that the
competitor orientation component of market orientation partially mediates the relationship
between democratic leadership style and non-financial performance.
9. Mediating effect of customer orientation on the relationship between laissez-faire
leadership and non-financial performance. The results of this relationship is presented
in Figure 6.21 and Table 6.23 below.
Figure 6.21: Mediating effect of customer orientation on the relationship between laissez-
fair leadership and non-financial performance.
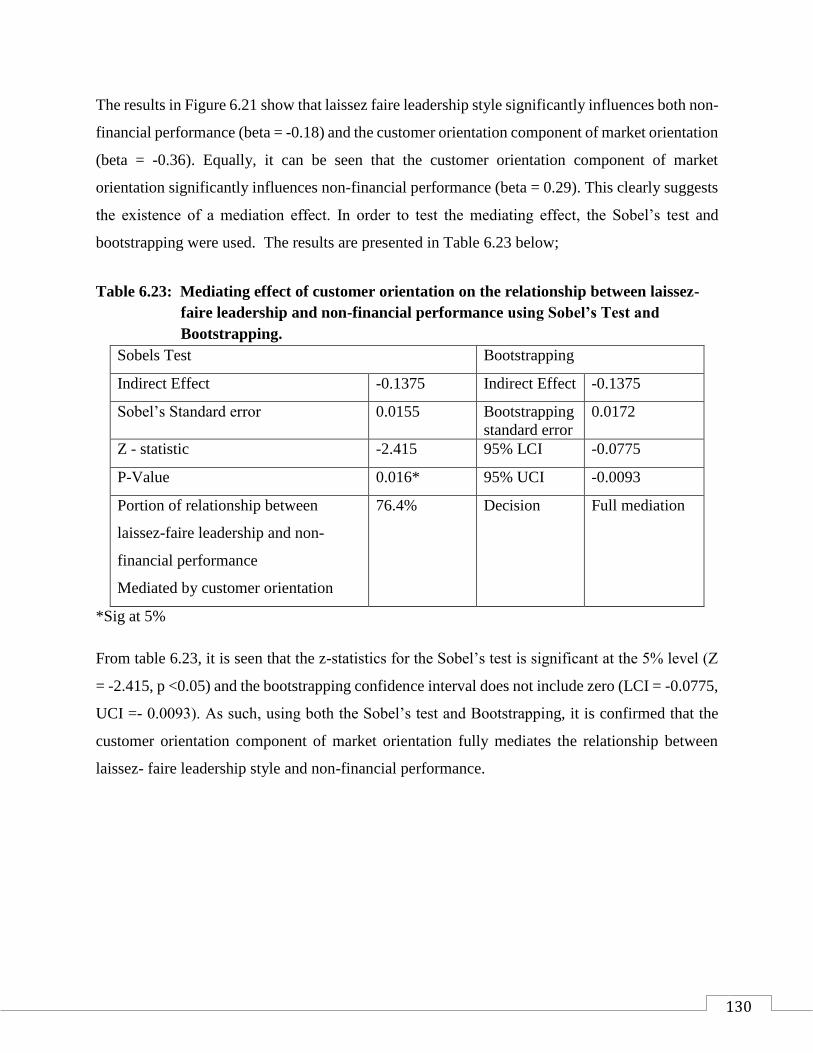
130
The results in Figure 6.21 show that laissez faire leadership style significantly influences both non-
financial performance (beta = -0.18) and the customer orientation component of market orientation
(beta = -0.36). Equally, it can be seen that the customer orientation component of market
orientation significantly influences non-financial performance (beta = 0.29). This clearly suggests
the existence of a mediation effect. In order to test the mediating effect, the Sobel’s test and
bootstrapping were used. The results are presented in Table 6.23 below;
Table 6.23: Mediating effect of customer orientation on the relationship between laissez-
faire leadership and non-financial performance using Sobel’s Test and
Bootstrapping.
Sobels Test Bootstrapping
Indirect Effect -0.1375 Indirect Effect -0.1375
Sobel’s Standard error 0.0155 Bootstrapping
standard error
0.0172
Z - statistic -2.415 95% LCI -0.0775
P-Value 0.016* 95% UCI -0.0093
Portion of relationship between
laissez-faire leadership and non-
financial performance
Mediated by customer orientation
76.4% Decision Full mediation
*Sig at 5%
From table 6.23, it is seen that the z-statistics for the Sobel’s test is significant at the 5% level (Z
= -2.415, p <0.05) and the bootstrapping confidence interval does not include zero (LCI = -0.0775,
UCI =- 0.0093). As such, using both the Sobel’s test and Bootstrapping, it is confirmed that the
customer orientation component of market orientation fully mediates the relationship between
laissez- faire leadership style and non-financial performance.

131
10. Mediating effect of customer orientation on the relationship between
transformational leadership and non-financial performance. The results of this
relationship is presented in Figure 6.22 and Table 6.24 below;
Figure 6.22: Mediating effect of customer orientation on the relationship between laissez-fair
leadership and non-financial performance.
The results in Figure 6.22 show that democratic leadership style significantly influences both non-
financial performance (beta = 0.22) and the competitor orientation component of market
orientation (beta = 0.30). Equally, it can be seen that the competitor orientation component of
market orientation has a positive influence on non-financial performance (beta = 0.24). This clearly
suggests the existence of a mediation effect. In order to test the mediating effect, the Sobel’s test
and bootstrapping were used. The results are presented in Table 6.24 below;

132
Table 6.24: Mediating effect of competitor orientation on the relationship between
democratic leadership and non-financial performance using Sobel’s Test and
Bootstrapping.
Sobel’s Test Bootstrapping
Indirect Effect 0.0505 Indirect Effect 0.0505
Sobel’s Standard error 0.0200 Bootstrapping
standard error
0.0211
Z - statistic 2.529 95% LCI 0.0162
P-Value 0.011* 95% UCI 0.1007
Portion of relationship between
democratic leadership non-financial
performance
Mediated by competitor orientation
22.9 % Decision Partial
mediation
*Sig at 5%
From table 6.24, it is seen that the z-statistics for the Sobel’s test is significant at the 5% level (Z
= 2.529, p <0.05) and the bootstrapping confidence interval does not include zero (LCI = 0.0162,
UCI = 0.1007). As such, using both the Sobel’s test and Bootstrapping, it is confirmed that the
competitor orientation component of market orientation partially mediates the relationship
between transformational leadership style and non-financial performance.

133
11. Mediating effect of customer orientation on the relationship between laissez-faire
leadership and non-financial performance. The results of this relationship is presented
in Figure 6.23 and Table 6.25 below.
Figure 6.23: Mediating effect of customer orientation on the relationship between laissez-
fair leadership and non-financial performance.
The results in Figure 6.23 show that laissez faire leadership style significantly influences both non-
financial performance (beta = -0.18) and the customer orientation component of market orientation
(beta = -0.36). Equally, it can be seen that the customer orientation component of market
orientation positively significantly influenced non-financial performance (beta = 0.29). This
clearly suggests the existence of a mediation effect. In order to test the mediating effect, the Sobel’s
test and bootstrapping were used. The results are presented in Table 6.25 below;

134
Table 6.25: Mediating effect of customer orientation on the relationship between laissez-
faire leadership and non-financial performance using Sobel’s Test and
Bootstrapping.
Sobels Test Bootstrapping
Indirect Effect -0.1375 Indirect Effect -0.1375
Sobel’s Standard error 0.0155 Bootstrapping
standard error
0.0172
Z - statistic -2.415 95% LCI -0.0775
P-Value 0.016* 95% UCI -0.0093
Portion of relationship between
laissez-faire leadership and non-
financial performance
Mediated by customer orientation
76.4% Decision Full mediation
*Sig at 5%
From Table 6.25, it is seen that the z-statistics for the Sobel’s test is significant at the 5% level (Z
= -2.415, p <0.05) and the bootstrapping confidence interval does not include zero (LCI = -0.0775,
UCI =- 0.0093). As such, in using both the Sobel’s test and Bootstrapping, it is confirmed that the
customer orientation component of market orientation fully mediates the relationship between
laissez- faire leadership style and non-financial performance.

135
12. Mediating effect of customer orientation on the relationship between
transformational leadership and non-financial performance. The results of this
relationship is presented in Figure 6.24 and Table 6.26 below;
Figure 6.24: Mediating effect of customer orientation on the relationship between
transformational leadership and non-financial performance.
The results in Figure 6.24 show that transformational leadership style significantly influences both
non-financial performance (beta = 0.20) and the competitor orientation component of market
orientation (beta = 0.38). Equally, it can be seen that the competitor orientation component of
market orientation positively and significantly influenced non-financial performance (beta = 0.29).
This clearly suggests the existence of a mediation effect. In order to test the mediating effect, the
Sobel’s test and bootstrapping were used. The results are presented in Table 6.26 below.

136
Table 6.26: Mediating effect of MO: customer orientation on the relationship between
transformational leadership and non-financial performance using Sobel’s Test
and Bootstrapping.
Sobels Test Bootstrapping
Indirect Effect 0.0503 Indirect Effect 0.0503
Sobel’s Standard error 0.0245 Bootstrapping
standard error
0.0253
Z - statistic 2.056 95% LCI 0.0069
P-Value 0.039* 95% UCI 0.1064
Portion of relationship between
transformational leadership and non-
financial performance
Mediated by customer orientation
25.2% Decision Partial
mediation
*Sig at 5%
From Table 6.26, it is seen that the z-statistics for the Sobel’s test is significant at the 5% level (Z
= 2.056, p <0.05) and the bootstrapping confidence interval does not include zero (LCI = 0.0069,
UCI =- 0.1064). Using both the Sobel’s test and Bootstrapping, it is confirmed that the competitor
orientation component of market orientation partially mediates the relationship between
transformational leadership style and non-financial performance.
13. Mediating effect of competitor orientation on the relationship between
transformational leadership and non-financial performance. The results of this
relationship is presented in Figure 6.25 and Table 6.27 below;
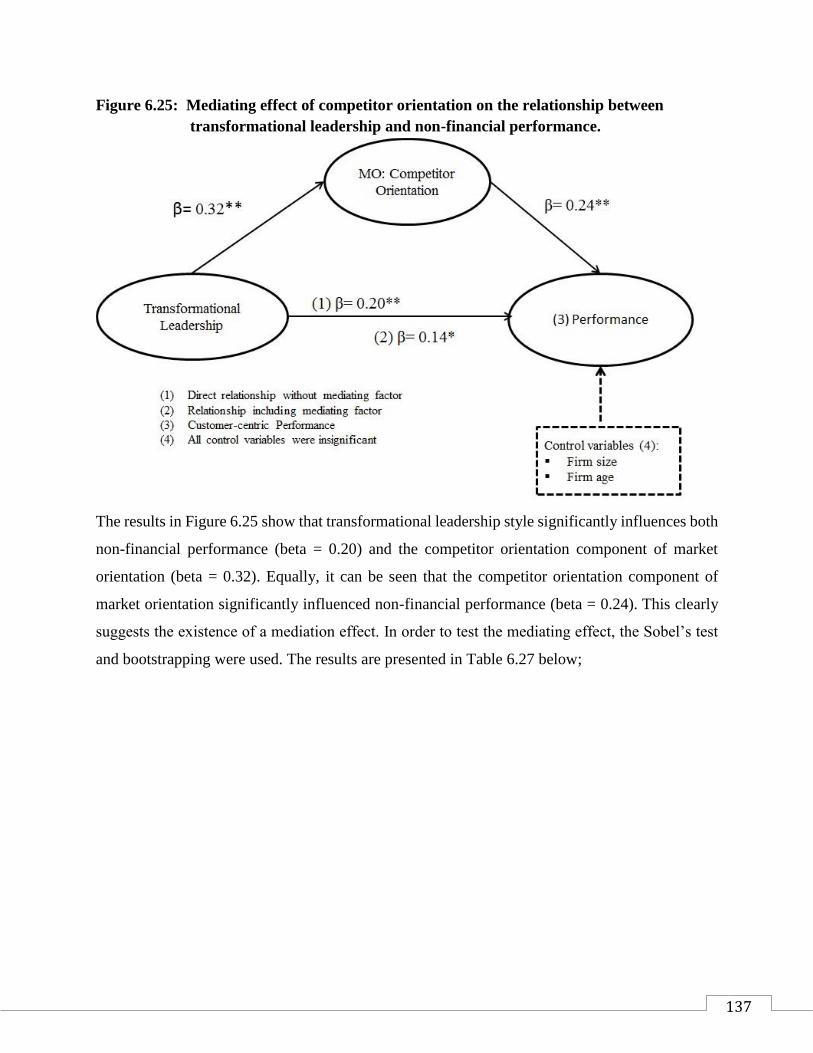
137
Figure 6.25: Mediating effect of competitor orientation on the relationship between
transformational leadership and non-financial performance.
The results in Figure 6.25 show that transformational leadership style significantly influences both
non-financial performance (beta = 0.20) and the competitor orientation component of market
orientation (beta = 0.32). Equally, it can be seen that the competitor orientation component of
market orientation significantly influenced non-financial performance (beta = 0.24). This clearly
suggests the existence of a mediation effect. In order to test the mediating effect, the Sobel’s test
and bootstrapping were used. The results are presented in Table 6.27 below;

138
Table 6.27: Mediating effect of MO: Competitor orientation on the relationship between
transformational leadership and non-financial performance using Sobel’s Test
and Bootstrapping.
Sobels Test Bootstrapping
Indirect Effect 0.0565 Indirect Effect 0.0565
Sobel’s Standard error 0.0214 Bootstrapping
standard error
0.0211
Z - statistic 2.638 95% LCI 0.0226
P-Value 0.008** 95% UCI 0.1077
Portion of relationship between
transformational leadership and
customer-centric performance
Mediated by customer orientation
25.2% Decision Partial
mediation
**Sig at 1%
From table 6.27, it is seen that the z-statistics for the Sobel’s test is significant at the 1% level (Z
= 2.638, p <0.01) and the bootstrapping confidence interval does not include zero (LCI = 0.0226,
UCI =- 0.1077). Using both the Sobel’s test and Bootstrapping it is confirmed that the competitor
orientation component of market orientation partially mediates the relationship between
transformational leadership style and non-financial performance.

139
14. Mediating effect of competitor orientation on the relationship between transactional
leadership and financial performance. The results of this relationship is presented in
Figure 6.26 and Table 6.28 below;
Figure 6.26: Mediating effect of competitor orientation on the relationship between
transactional leadership and financial performance.
The results in Figure 6.26 show that transactional leadership style significantly influences both
financial performance (beta = 0.19) and the competitor orientation component of market
orientation (beta = 0.25). Equally, it can be seen that the competitor orientation component of
market orientation significantly influenced financial performance (beta = 0.24). This clearly
suggests the existence of a mediation effect. In order to test the mediating effect, the Sobel’s test
and bootstrapping were used. The results are presented in Table 6.28 below;

140
Table 6.28: Mediating effect of MO: Competitor orientation on the relationship between
transactional leadership and financial performance using Sobel’s Test and
Bootstrapping.
Sobels Test Bootstrapping
Indirect Effect 0.0467 Indirect Effect 0.0467
Sobel’s Standard error 0.0205 Bootstrapping
standard error
0.0209
Z - statistic 1.978 95% LCI 0.0014
P-Value 0.048* 95% UCI 0.0847
Portion of relationship between
transactional leadership and
customer-centric performance
Mediated by customer orientation
24.6% Decision Partial
mediation
*Sig at 5%
From table 6.28, it is seen that the z-statistics for the Sobel’s test is significant at the 5% level (Z
= 1.978, p <0.05) and the bootstrapping confidence interval does not include zero (LCI = 0.0014,
UCI =- 0.0847). So, in using both the Sobel’s test and Bootstrapping it is confirmed that the
competitor orientation component of market orientation partially mediates the relationship
between transactional leadership style and financial performance.

141
15. Mediating effect of competitor orientation on the relationship between democratic
leadership and financial performance. The results of this relationship is presented in
Figure 6.27 and Table 6.29 below.
Figure 6.27: Mediating effect of competitor orientation on the relationship between
democratic leadership and financial performance.
The results in Figure 6.27 show that democratic leadership style significantly influences both
financial performance (beta = 0.19) and the competitor orientation component of market
orientation (beta = 0.30). Equally, it can be seen that the competitor orientation component of
market orientation positively and significantly influenced non-financial performance (beta = 0.24).
This clearly suggests the existence of a mediation effect. In order to test the mediating effect, the
Sobel’s test and bootstrapping were used. The results are presented in Table 6.29 below;

142
Table 6.29: Mediating effect of MO: Competitor orientation on the relationship between
democratic leadership and financial performance using Sobel’s Test and
Bootstrapping.
Sobels Test Bootstrapping
Indirect Effect 0.0832 Indirect Effect 0.0432
Sobel’s Standard error 0.0236 Bootstrapping
standard error
0.0244
Z - statistic 2.029 95% LCI 0.0028
P-Value 0.042* 95% UCI 0.1018
Portion of relationship between
democratic leadership and customer-
centric performance
Mediated by customer orientation
43.8% Decision Full mediation
*Sig at 5%
From table 6.29, it is seen that the z-statistics for the Sobel’s test is significant at the 5% level (Z
= 2.029, p <0.05) and the bootstrapping confidence interval does not include zero (LCI = 0.0028,
UCI =- 0.1018). In using both the Sobel’s test and Bootstrapping, it is confirmed that the
competitor orientation component of market orientation fully mediates the relationship between
democratic leadership style and financial performance.
Hence based on hypothesis H15, it can be concluded that in terms of full and partial mediation
Table 6.30: Full and partial mediation relationships showing the mediating effects of MO on
the leadership styles- performance relationship.
Full mediation Partial mediation
Competitor orientation fully mediates the
relationship between consultative leadership
style and non-financial performance
Customer orientation partially mediates the
relationship between supportive leadership
style and non-financial performance

143
Customer orientation fully mediates the
relationship between laissez-faire leadership
style and non-financial performance
Competitor orientation partially mediates
relationship between supportive leadership
style and non-financial performance
Competitor orientation fully mediates the
relationship between democratic leadership
style and financial performance
Competitor orientation partially mediates the
relationship between participative leadership
style and non-financial performance
Customer orientation partially mediates the
relationship between participative leadership
style and non-financial performance
Customer orientation partially mediates the
relationship between achievement leadership
style and non-financial performance
Competitor orientation partially mediates the
relationship between achievement leadership
style and non-financial performance
Competitor orientation partially mediates the
relationship between democratic leadership
style and non-financial performance
Customer orientation partially mediates the
relationship between transformational
leadership style and non-financial
performance
Competitor orientation partially mediates the
relationship between transformational
leadership style and non-financial
performance
144
Competitor orientation partially mediates the
relationship between transactional leadership
style and financial performance
6.12. CHAPTER SUMMARY
The objective of this chapter was to discuss the empirical findings of this study. The study was
conducted amongst SME owners/managers in the Mangaung Metropolitan Municipality
(Bloemfonteing, Botshabelo and Thaba’Nchu). 354 questionnaires were issued to the
respondents. Out of 354 that were distributed, only 229 fully completed questionnaires by the
respondents were received. Using regional distribution, it was established that the questionnaires
generated a response rate of 64.7% for the study. Furthermore, the study used Alpha reliability
analysis to examine the internal consistence and reliability of the construct of leadership styles,
MO and external environment. So, the results were accepted and considered to be valid and reliable
for analysis. In addition, a factor analysis was performed where it appropriateness was established
because all the factor under the investigation met the requirements.
The results on the empirical findings established that more than 50% of the SMEs are owned by
male, while 93 (40.6%) are owned by females. With regards to the age of the business the results
revealed that the businesses were between the ages 6 months to 12 years. Also, it was found that
majority of the businesses were operating in the fast food industry, then followed by retail and
consumer service, with 47 (20.5%0 and 29 (12.7%) respectively. Furthermore, majority of the
people were employed by micro enterprise with 103 (45%), and very small enterprise with 60
(26.2%). Lastly, about 96 (41.9%) of the SME owners/managers used their personal savings to
start-up a business, while only 49 (21.4%) acquired funding from banks and other financial
institutions. Moreover, the results revealed that most SME owners/managers practice supportive,
achievement oriented leadership styles, with (M=4.2507; SD=.57144) and (M=4.0535;
SD=.66568) respectively. From the correlation matrix on leadership style it was found that there
is significant and positive correlation between participative, achievement, consultative,
democratic, transformational, and transactional leadership styles.

145
Regarding the relationship between leadership and SME performance, it was established that
supportive, participative, achievement, consultative, democratic and transformational leadership
styles have a positive relationship with non-financial performance, while laissez-fair has a negative
relationship with non-financial performance, and democratic and transactional leadership styles
have a positive relationship with financial performance. With regards to the relationship between
market orientation and SME performance, the results showed that customer orientation and
competitive orientation has a significant positive relationship with non-financial performance;
while customer orientation, competitive orientation, and inter-functional coordination have a
positive relationship with financial performance.
With respect to the mediating relationship between Market orientation and leadership styles, this
study established a partial and full mediation. In terms of the full mediation, this study established
that competitor orientation fully mediates the relationship between consultative leadership style
and non-financial performance; customer orientation fully mediates the relationship between
laissez-faire leadership style and non-financial performance; and competitor orientation fully
mediates the relationship between democratic leadership style and financial performance. In terms
of a partial mediation, this study showed that customer orientation partially mediates the
relationship between supportive leadership style and non-financial performance; competitor
orientation partially mediates relationship between supportive leadership style and non-financial
performance; competitor orientation partially mediates the relationship between participative
leadership style and non-financial performance; customer orientation partially mediates the
relationship between participative leadership style and non-financial performance; customer
orientation partially mediates the relationship between achievement leadership style and non-
financial performance; competitor orientation partially mediates the relationship between
achievement leadership style and non-financial performance; competitor orientation partially
mediates the relationship between democratic leadership style and non-financial performance;
customer orientation partially mediates the relationship between transformational leadership style
and non-financial performance; competitor orientation partially mediates the relationship between
transformational leadership style and non-financial performance; and competitor orientation
partially mediates the relationship between transactional leadership style and financial
performance.

146
The next chapter is the general conclusion of this study. It recaps the empirical findings and suggest
some recommendations moving forward.
147
CHAPTER SEVEN
DISCUSSION, CONCLUSION AND RECOMMENDATIONS
7.1. INTRODUCTION
This study examined the influence of leadership styles and market orientation on the performance
of the SMEs in the Mangaung Metropolitan Municipality (Bloemfontein, Botshabelo and
Thaba’Nchu), and the mediating effect of MO on the leadership-performance relationship. The
empirical findings of this study were presented in chapter six, where answers to the research
questions as well as the research hypothesis were established.
This chapter is an overall summary of the theory and empirical findings presented in the previous
chapters. The empirical findings in chapter six provided answers to the primary and secondary
objectives of this study, the research questions, and the hypothesis. Concluding on the findings,
this chapter aslo puts forward some recommendations for this study and creates a platform for
further discussions. This conclusion chapter is divided into six parts. Part A focuses on discussing
the conclusions of the theoretical chapters. Part B makes summary conclusion of the empirical
findings established in chapter five. Part C discusses the achievement of the objectives of this
study, and Part D provides possible recommendations for the study moving forward. Part E will
provide the limitations to the study and Part F, will provide avenues for future research.
7.2. PART A: CONCLUSION ON THE THEORETICAL CHAPTERS
The literature review of this study comprised of the three chapters, as discussed below.
7.2.1. Chapter one - Introduction to the study
Chapter one provided a background to the study and the rationale for the study. The concept of
leadership styles, leadership theories, different theories of market orientation and their importance
in the SMEs in South Africa was also succinctly discussed in this chapter. Likewise, the chapter
delineated the research problem, the primary and secondary objectives of the study, as well as
contributions it will make to the study. The chapter further presented the research methodology
employed for the study and outline of the research chapters.
148
7.2.2. Chapter two - Leadership styles and SME performance
This chapter discussed the theoretical background of leadership by looking at several theories of
leadership, the different leadership styles (directive, supportive, participative, achievement
oriented, autocratic, consultative, democratic, laissez-fair, pace setting and coaching, visionary,
transformational and transactional), and its impact on SME performance. The chapter also
highlighted the definition of SME in South Africa. SME performance and its measurements were
also discussed, where it was revealed that performance can be measured using a combination of
both financial and non-financial measures. Financial and non-financial performance were found
to be adequate measures of performance and can be used parallel to enhance SME performance
(Zuriekat, Salameh and Alrawashdeh, 2011), and thus both were used as measures of performance
in this study.
7.2. 3. Chapter three: Market orientation and SME performance
This chapter started with the review of the literature by discussing several definitions of MO. It
provided the theoretical background of the history of MO. The dimensions of MO from both
behavioural (generation of market intelligence, dissemination of intelligence and organisational
response) and cultural perspectives (customer orientation, competitor orientation and inter-
functional coordination) by (Kohli and Jaworski, 1990; Narver and Slater, 1990) were also
discussed. The empirical studies conducted revealed that the three dimensions of MO have a
positive relationship with SME performance. This study adopted the cultural dimension.
7.2. 4. Chapter four: Mediating effect of MO on leadership style performance
relationship
This chapter focused on the mediating effect of MO on the leadership style-performance
relationship. This chapter began with reviewing the relationship between leadership styles and
SME performance, the relationship between MO and SME performance, as well as the role of MO
as a mediator on the leadership style-performance relationship. The chapter also established an
integrated framework linking leadership style and MO to SMEs performance. Additionally, the
chapter formulated 15 research hypotheses which was later tested in the empirical findings.

149
7.2. 5. Chapter five: Research Methodology
Chapter five discussed research methodology employed in collecting and analysing data to provide
answers to the research objectives stated in this study. This chapter presented research
methodology taken from the research process and it was divided into five steps. Step one focused
on the research problem and research objectives; step two focused on the research design; step
three focused on the sampling methods; step four focused on the data collection methods; step five
focused on the data analysis techniques. This study made use of a quantitative research design. A
combination of probability (stratified random sampling) and non-probability (convenience and
snowball sampling) to identify the respondents who participated in this research. With regards to
data gathering, self-administered questionnaires were used by the researcher to administer
questionnaires to the respondents. Furthermore, data was analysed using SPSS and interpretations
were done using a combination of descriptive statistics and inferential statistics.
7.3. PART B: CONCLUSION ON THE EMPIRICAL FINDINGS
The empirical findings were presented in chapter six. As such, this section will explain the
conclusions of the empirical findings based on the descriptive information of SME
owners/managers, nature of the business, leadership styles, market orientation, SMEs
performance, leadership styles and SME performance, MO and SME performance and the
mediating relationship between Market orientation and leadership styles
7.3.1. Descriptive information of the SME owner/manager
The findings obtained in chapter six pointed out that they were predominantly more males 136
(59.4%), than 93 (40.6%) females SMEs owners/managers. As such, the results revealed that more
males than females are involved in entrepreneurial activities in the Mangaung Metropolitan
Municipality. Also, in terms of formal education the results depicted that the majority of the SME
owners/managers had matric as a highest qualification, thereafter diploma and degree, with 110
(48.2%), 41 (18%) and 40 (17.5%) respectively. This shows that the respondents were literate and
thus were able to give informed answers to the questions. However, the results also depicted a low
level of education amongst the SME owners/managers. Education plays a crucial role towards
building a successful organisation and enabling entrepreneurs to assess risks and benefits, as well

150
as to identify opportunities to grow the organisation. Concerning other degree programs completed
by the SME owners/managers, the results indicated that more 50% did not complete any degree
program. Lastly, less than 50% of the SME owners/managers have done short courses in business
management. Thus, South African government has to ensure the design of programs that will
promote education amongst the entrepreneurs. This will help entrepreneurs to grow and manage
the business successfully and subsequently create employment, grow the economy, reduce high
levels of poverty and equality, since skills and knowledge are essential to the success of the
business. With respect to age, the findings of the research revealed that more entrepreneurs were
between the ages of 21-30, 30-39 and 40-49, with 39.7%, 27.1% and 21.4% respectively. The
results are consistent with a study carried out by Ganyaupfu (2013) which found that majority of
the successful entrepreneurs were between the ages of 25-40. Older people are unlikely to take
financial risks as oppose to young people because they have families and other responsibilities, as
such financial stability is their first priority.
7.3.2. The nature of the business
Looking at the nature of the business, the results revealed that micro enterprises contribute to 103
(45%) of job creation. This is the indication that SMEs are vital to the economic development of
South Africa because they create employment for majority of the people whether in the formal or
informal sector. Thus, it is crucial that the government safeguards the SME sector as it contributes
to the economic prosperity of South Africa. Moreover, it was observed from the results that
majority/most of the SME owners/manager used their own capital to start- up their business, while
others used the banks and other financial institutions, with 96 (41.6%) and 49 (21.4%) respectively.
This explains why SMEs in South African fail because banks and other financial institutions are
reluctant to provide financial support to the owners of small businesses. In the absence of adequate
financial support, SMEs are more likely to fail because starting-up a business and operating it
successfully requires finances. Also, the study noted that the bulk of entrepreneurs were motivated
by pull factors to start the business, with (M=3.8406;SD=0.51569). This is consistent with the
study by Neneh (2014), which found that pull factors are important than push factors with regards
to entrepreneurial motivation in a developing country.

151
Moreover, it was found that more than 50% of the SME owners/managers had no related prior
experience in the sectors in which they operated their businesses. This confirmed the results in
table 6.6 that majority of the entrepreneurs were motivated by pull factors such as being my own
boss, independence, and flexibility to start-up a business. Lack of adequate experience in the
sector in which the businesses operate point to the reasons why so many SMEs fail in South Africa.
This SME failure can be traced back to lack of business knowledge and the industry with which
the business competes, coupled with the owners/managers inexperience.
7.3.3. Leadership styles
From the results on leadership styles, it was established that supportive, achievement oriented,
transformational and transactional leadership styles (M=4.2507; SD=.57144) and (M=4.0535;
SD=0.66568; M=2.9927; SD=.85493) and (M=2.6681; SD=.99679) are the leadership styles SME
most practiced by owners/managers. The results are consistent with McLagan, Bezuidenhout and
Botha (2013) who found that transformational and transactional leadership styles are the most used
leadership styles amongst the SMEs. Laissez-fair leadership style was the least used leadership
style amongst SME owners/managers. This could be attributed to the fact that laissez-fair
leadership style can lead to distraction in and of the workplace when the employees need or want
constant feedback, or when employees are junior workers and are inexperienced to do the work on
their own (Essien, Olesugun and Makaila, 2013).
7.3.4. Market orientation
The results on market orientation showed that customer orientation had the highest mean, with
(M=4.33; SD=0.73), strictly followed by competitor orientation and inter-functional coordination
(M=3.92; SD=0.81) and (M=3.91; SD= 0.82) respectively. The results suggested that SME
owners/managers engage highly in customer orientation but only moderately in competitor
orientation and inter-functional coordination. Given that competitor orientation helps in the
evaluation of present and prospective rivals and include the whole set of technologies suitable for
meeting present and future desires of the supplier’s target customers. Furthermore, inter-
functional coordination encompasses communication and distribution of information and
resources, integration and cooperation of different department within the organisation with the
goal of providing products of superior value to customers, and subsequently outperform rivals.
152
As such, it becomes important that SME owners/managers in the Mangaung Metropolitan
Municipality enhance these dimensions seeing that they engage in them moderately. The results
are consistent with Hilman and Kaliappen (2014) who found that majority of the participants in
the hotel industry engage in customer orientation and competitor orientation.
7.3.5. SME performance
SME performance was measured using a combination of financial and non-financial performance
variables. After performing a factor analysis, the factors were loaded into two components. Factor
1 was classified as non-financial performance, while factor 2 was financial performance, and this
classification was in line with extant studies (Inmyxai and Takahashi, 2010; Neneh and Van Zyl,
2012; Fakoti, 2014; Maduekwe and Kamala, 2016) that have also classified performance using
these groupings. Furthermore, the results showed that non-financial performance had the highest
mean than financial performance, thus suggesting that SME owners/managers perform better in
terms of non- financial performance but only have a moderate performance in terms of financial
performance. While non- financial performance measures are also crucial to the success of every
business, financial performance is also important because of its ability to enhance the profitability
a business, which could in turn enhance the growth of the business. The growth of a business has
vital policy implications in terms of wealth creation, economic growth and development, and job
creation for addressing the high unemployment rate in South Africa.
7.3.6. Leadership styles and SME performance
In examining leadership styles and SME performance, 11 leadership styles (directive, supportive,
participative, achievement oriented, autocratic, consultative, democratic, laissez-fair, pace setting
and coaching, visionary, transformational and transactional) were examined to determine their
impact on SME performance (financial and non-financial performance). From the results, it was
established that supportive, participative, achievement, consultative, democratic and
transformational leadership styles have a positive relationship with non- financial performance,
while laissez-fair has a negative relationship with non-financial performance. With respect to
financial performance, the results showed that only democratic and transactional leadership styles
have a positive relationship with financial performance and this result is significant at the 5% level.
The study also established that SME owners/managers in the Mangaung Metropolitan

153
Municipality only engage in supportive, achievement oriented, transformational and transactional
leadership styles; but do not engage in participative, consultative, and democratic leadership styles.
Seeing that participative, consultative, and democratic leadership styles have a positive
relationship with SME performance, it becomes important to enhance these leadership styles
amongst SME owners/managers in the Mangaung Metropolitan Municipality.
7.3.7 MO and SME performance
The three dimensions of market orientation (customer orientation, competitor orientation and inter-
functional coordination) were examined to determine their impact on SME performance and
financial and non-financial performance). The result revealed customer orientation and
competitive orientation have a significant positive relationship with non-financial performance,
while all three construct of MO (customer orientation, competitive orientation and inter-functional
coordination) have a positive relationship with financial performance. Given that SME
owners/managers in the Mangaung Metropolitan Municipality engage highly in customer
orientation but only moderately in competitor orientation and inter-functional coordination, it
becomes important to enhance their level of competitor orientation and inter-functional
coordination, if they want to improve the performance of their businesses.
7.3.8 The mediating relationship between market orientation and leadership styles
The last part of the empirical findings focused on the determining the mediating relationship
between market orientation and leadership styles. The results established a partial and full
mediation. In terms of the full mediation, this study established that competitor orientation fully
mediates the relationship between consultative leadership style and non-financial performance;
customer orientation fully mediates the relationship between laissez-faire leadership style and non-
financial performance; and competitor orientation fully mediates the relationship between
democratic leadership style and financial performance. In terms of a partial mediation, this study
showed that customer orientation partially mediates the relationship between supportive leadership
style and non-financial performance; competitor orientation partially mediates relationship
between supportive leadership style and non-financial performance; competitor orientation
partially mediates the relationship between participative leadership style and non-financial
performance; customer orientation partially mediates the relationship between participative

154
leadership style and non-financial performance; customer orientation partially mediates the
relationship between achievement leadership style and non-financial performance; competitor
orientation partially mediates the relationship between achievement leadership style and non-
financial performance; competitor orientation partially mediates the relationship between
democratic leadership style and non-financial performance; customer orientation partially
mediates the relationship between transformational leadership style and non-financial
performance; competitor orientation partially mediates the relationship between transformational
leadership style and non-financial performance; and competitor orientation partially mediates the
relationship between transactional leadership and financial performance. These results showed the
individual dimensions of market orientation partially and fully mediate the leadership style SME
performance (financial and non- financial) relationship. Thus in order to provide more insights
into the role market orientation plays, researchers should focus on the individual dimensions of
market orientation as businesses can have diverse combinations of these three, especially given
that MO dimensions vary independently from each other. Also, these results reiterated the need
for SME owners/managers to engage in participative, consultative, and democratic leadership
styles and customer orientation as they act as mediators in enhancing the performance of a
business.
7.4. PART C: ACHIEVEMENT OF THE OBJECTIVE OF THE STUDY
This section focusses on determining whether the objectives formulated in chapter one (subsection
1.3) were achieved.
7.4.1. Primary objective
The primary objective of this study is to examine the mediating effects of MO on the leadership-
performance relationship. While the secondary objectives of the study were;
i. To assess theories and concepts on leadership styles
ii. To review theoretical studies on market orientation
iii. To find out which types of leadership is practiced by SMEs owners
iv. To determine whether SMEs owners engage in MO and which type of market orientation
they engage in.

155
v. To determine which type of leaderships styles are essential to enhance the performance of
the SMEs.
vi. To find out the impact of MO on the performance of SMEs
vii. To find out the mediating effects of MO on the leadership styles- performance relationship
viii. To provide possible recommendations on how leaderships styles, market orientation SMEs
performance can be enhanced.
The first objective was to assess theories and concepts on leadership styles to establish which of
the leadership styles influence the performance of the SMEs. The second objective was to review
theoretical studies on MO. This objective was achieved in chapter three of the study.
The third objective was to find out which type of leadership is practiced by SME owners/managers.
This objective was achieved in chapter six (sub-section 6.7- Table 6.7) of the empirical findings.
The forth objective was to determine whether SMEs owners engage in MO, and which type of
market orientation they engage in. This objective was achieved in chapter six (sub-section 6.8
and Table 6.9).
The fifth objective was to determine which type of leadership styles are essential to enhance the
performance of the SMEs. This objective was accomplished in chapter six (sub-section 6.10 and
table 6.11) of the empirical findings.
The sixth objective was to find out the impact of MO on the performance of SMEs. This objective
was accomplished in chapter six (sub-section 6.10.2 and table 6.12) of the empirical findings.
The seventh objective was to find out the mediating effects of MO on the leadership styles-
performance relationship. This objective was achieved in chapter four and chapter six (sub-
section 6.11.1. and Table 6.13, Table 6.14).
The eighth objective was to establish and provide possible recommendations on how leadership
styles, market orientation, and SMEs performance can be enhanced. This relationship is achieved
in Part D below (recommendations to the study).

156
Following the realisation of all the secondary objectives, it can be concluded that both the primary
and secondary objectives of the study were met.
7.5. PART D: RECOMMENDATIONS TO THE STUDY
Based on the results obtained from chapter six, this section will provide possible recommendations
on how the critical issues identified from the findings can be addressed. The proposed
recommendations emerged from the theoretical and empirical findings presented in the previous
chapters of the study. Thus, specific recommendations are centered on the descriptive information
of the SME owners/mangers, the nature of the business, leadership styles, MO, SME performance,
leadership styles and SME performance, MO and SME performance and the mediating relationship
between Market orientation and leadership styles. These recommendations are explained below;
With respect to gender, the findings revealed that fewer women participate in
entrepreneurial activities as appose to their male counterpart. In the past gender was used
to exclude women from participating in the activities that were perceived to be dominated
by males. Furthermore, women still find it difficult to make a breakthrough in business,
consequently, it is imperative that South African government formulate new policies or
enhance existing policies to empower women to become more active in entrepreneurial
activities and also create an enabling environment for women to be competitive and
succeed in their business venture.
Also, with regards to the low level of education established amongst the SME
owners/manager, it is recommended that organisations such as FDC, SEDA and NYDA to
collaborate with Free State Department of Education to provide workshop and training
programs aiming at equipping entrepreneurs with necessary knowledge and skills required
to run the business effective and efficient. Education is central to the success of the
business, as such SME owners/managers must acquire the basic knowledge in financial
management, marketing management, general management and sales management to
enhance their business knowledge and skill to manage effectively. This will help
entrepreneurs to perform basic business functions such as planning, organizing, leading
and control to operate the business successfully.
157
In order to enhance access to finance amongst SMEs owners/manager, it is imperative that
South African government put into effect rules and regulation or policies that will compel
banks and other financial institution to get rid of stringent requirements that prevent
entrepreneurs from acquiring finance. Also, banks and financial institutions should learn
to understand entrepreneurs financing model, invest in training programmes and banking
seminars to help entrepreneurs become more financeable and become bankable, increase
their loans and lines of credit as this intend will result in numerous new financing
opportunities that can increase the banks’ loan portfolios.
SME owners/managers can develop participative leadership style by encouraging career
development and also allow their employees to use their own professional development
plan and skills to close the performance gaps identified in the business. Democratic
leadership styles be developed by communicating important information to employees in
a timely manner and also using employee’s opinions to arrive at a final decision. By
developing these leadership styles, SME owners/manage will facilitate the efficient
exchange of information amongst employees and also give them a feeling of empowerment
when given the task to perform.
SME owners/managers can enhance their financial performance must ensure it consistently
monitor all the business function within the business to ensure they are operating mutually
to produce an output in excess of the input, ensures that product/service meet quality
expectations, product/services are delivered in a timely manner and/or within the allocated
cost and continuous improvement and research and development so as to boast the revenues
and profitability of the business.
SME owners/managers can enhance their level of competitor orientation by positioning
themselves more competitively over their competitors, by ensuring that they provide a
value added product/services to their customers which differentiate themselves from their
competitor instead of competing head-to-head. Also, SME owners/managers can make use
of the SWOT analysis to ensure that they constantly scan and monitor the environment for
opportunities which they can use to secure a competitive advantage.
158
7.6. PART E: LIMITATIONS TO THE STUDY
This study was conducted amongst the SME owners/managers in the Mangaung
Metropolitan Munipality (Bloemfontein, Botshabelo and Thaba’Nchu). As
such the findings cannot be generalise across all SMEs in South Africa.
The researcher could not reach all the SME owners/managers operating in the
Mangaung Metropolitan Municipality because of time and financial constraints.
7.7. PART F: FUTURE RESEARCH
Future studies should be extended to other geographic areas in South African in order to
obtain more insight/information on the mediating effects of MO on the leadership styles-
performance relationship in other provinces in South Africa.
Given that this study only focused on the cultural dimension (customer orientation,
competitor orientation and inter-functional coordination) of market orientation, future
studies can also look at the dimensions of MO from the behavioural (generation of market
intelligence, dissemination of intelligence and organisational response) perspective to find
out which of these behavioural dimensions of MO mediate the leadership styles-
performance relationship.
Future research should focus on factors such as job satisfaction, motivation and
commitment to ascertain to what extend the leadership styles of the SME owners/managers
affect employee job satisfaction, motivation, and commitment.
Lastly, the study focused on SME owners/managers only. Future research should focus on
the employees because they can provide comprehensive information on the leadership
styles of their owners/managers on the performance of the organisation.
7.8. CHAPTER SUMMARY
This chapter concluded the entire study and proferred some recommendations. The chapter was
divided into six parts. Part A provided a brief discussion on conclusion and theoretical chapters.
Part B presented the conclusion on the empirical findings discussed in chapter six. Part C
summarised the achieved objectives of the study, Part D discussed specific recommendations

159
based on the important issues that emerged from the study, and Part E presented the limitations of
the study. The last section, Part F elaborated on the areas that are critical for the future research.

160
BIBLIOGRAPHY
Abdallah, L., and Persson, M. 2014. The effect of environmental uncertainity condition on
organization innovativeness and performance of SMEs. Master’s dissertation, Blekinge
Institute of Technology, School of Management.
Abdul Razak, M.N. 2010. Keynote address by the Honorary Prime Minister at Invest Malaysia,
Kuala Lumpur.
Abedniya, A., and Mahmouei, S.S. 2010. The Impact of social networking websites to
facilitate the effectiveness of viral marketing. International Journal of Advance Computer
Science and Applied, 42(4), 93-102.
Abouzeedan, A. 2011. SME performance and its relationship to innovation. Dissertation.
Linköping University, Linköping, Sweden. Online. Retrieved from:
http://www.smmeresearch.co.za/SMME%20Research%20General/Case%20Studies/SME%2
0performance%20and%20Its%20to%20Innovation.pdf. [Accessed: 17th August 2017].
Ahmad, K., and Zabri, S.M. 2015. The application of non-financial performance measurement
in Malaysia manufacturing firms. Procedia Economic and Finance, 35, 477-484.
Alizadeh, A., Alipour, H., and, Hasanzadeh, M. 2013. Market orientation and business
performance among SMEs based in Ardabil industrial city-Iran. Kuwait Chapter of Arabian
Journal of Business and Management Review, 2(7), 38-47.
Alkahtani, A.H, Abu-Jarad, Sulaiman, M., and Nikbin, D. 2011. The Impact Personality and
Leadership Styles on Leading Change Capacity on Malaysian Managers. Australian Journal
of Business and Management Research, 1(2), 70-99.
Al-mawali, H.H, Zainuddin, Y., and Ali, N.N. 2010. Balanced scorecard (BSC) usage and
financial performance of branches in Jordanian banking industry. World Academy of Science,
Engineering and Technology, 42, 1174-1181. Online. Retrieved from:
http://www.citeseerx.ist.psu.edu/viewdoc/download?doi=10.1.1.294.2040&rep=rep1&type=
pdf. [Accessed: 12th May 2017].
Al-Shirawi, A.M. 2012. Measuring the level of market orientation among financial service
provider in a resource- based economy: organisational and customer perspectives. Doctorate
dissertation, Brunel University of London, London.

161
Anggadwita, G., and and Mustafid, Q.Y. 2014. Identification of factors affecting the
performance of small medium enterprise. Procedia-Social and Behavioural Science, 115, 415-
423. Online. Retrieved from: http://www.ac.els-cdn.com/S187704281401996X/1-s2.0-
S187704281401996X-main.pdf?_tid=b3f923d0-95e0-11e6-b6e4-00000aab0f6candac
dnat=1476870480_62b33a. [Accessed: 19th October 2016].
Arham, A.F. 2014. Leadership and Performances: The Case of Malaysian SMEs in the
Serevice Sector. International Journal of Asian Science, 4(3), 343-355.
Arham, A.F., Boucher, C. and Muenjohn, N. 2013. Leadership and Entrepreneurial Success:
A Study of SMEs in Malaysia. World Journal of Social Sciences, 3(5): 117 – 130.
Arslan, A. and Staub, S. 2013. Theory X and Theory Y type leadership behaviour and its
impact on organisation performance: Small business Owners in the Sishane Lighting and
Chandelier District. Prodeua – Social and Behavioural Science, 75,102-111.
Asikhia, A. 2010. Customer orientation and firm performance among Nigerian small and
medium scale businesses. International Journal of Marketing Studies, 2(1), 197-212.
Asomaning, R., and Abdulai, a. 2015. An empirical evidence of the market orientation –
market performance relationship in Ghana small business. Education Research International,
4(2), 69-86.
Au, A.K.M., and Tse, A.C.B. 1995. The effect of market orientation on company performance
in the Service Sector: A comparative study in Hong Kong and New Zealand. Journal of
International Consumer Marketing, 8(2), 77-87.
Awwad, M.S., and Agti, D.A.M. 2011. The impact of international marketing on commercial
banks’ market orientation. International Journal of Bank Marketing, 29, 308-332.
Aziz, N.A., and Yassin, N.M. 2010. How will market orientation and external environment
influence the performance among SMEs in the agro-food sector in Malaysia?. International
Business Research, 3(3), 154-164.
Aziz, R.A., Mohamood, R. and Abdullah, M.H. 2013. Effects of leadership styles and
entreprenerial orientation on the business performance of SMEs in Malaysia. IBEA,
International Conference on Business, Economics, and Accounting, Bangkok-Thailand.
Babbie, E. 2007. The Practice of Social Research. 11th edition. Thomson Wadsworth: USA.
Babbie, E. 2014. The Practice of Social Research. 10th edition. Cengage Learning. Boston:
USA.

162
Barnabas, N., and Mekoth, N. 2010. Autonomy, market orientation performance in Indian
retail banking. Asia Pacific Journal of Marketing and Logistics, 22, 330-350.
Barron, R.M., and Kenny, D.A. 1986. The moderator variable distinction in social
psychological research: Conceptual, strategic, and statistical considerations. Journal of
Personality and Social Psychology, 51, 1173-1182.
Beavers, A.S., Lounsbury, J.W., Richards, J.K., Huck, S.W., Skolits, G.J., and Esquivel, S.L.
2013. Practical consideration for using exploratory factor analysis in educational research.
Practical Assessment, Research and Evaluation, 18(6), 1-13.
Belias, D., and Koustelious, A. 2014. Transformational leadership and job satisfaction in the
banking sector: A review. International Review of Management and Marketing, 2(3), 187-
200.
Bengesi, K.M. and Roux, I.L. 2014. Strategic entrepreneurial response of small and medium
enterprises in developing economies. International Journal of Business and Management,
9(2), 153-165.
Bisp, S. 1999. Barriers to increase market-orientated activity: What the literature suggest.
Journal of Market-Focused Management, 4(1), 77-92.
Brijlal, P., Naicker, V., and Peters, R. 2013. Educational and small, medium and micro
enterprise (SMME) business growth: A gender perspective from South Africa. International
Business and Economic Research Journal, 12(8), 855-866.
Bryant, T.A. 2004. Entrepreneurship. In: Goethals GR, Sorenson GJ and Burns JM (eds.)
Encyclopaedia of Leadership, 1. Sage. Thousand Oaks. CA, 442-448.
Bryman, A., and Bell, E. 2003. Business Research Methods. 1st edition. Oxford University
Press: New York.
Bryman, A., and Bell, E. 2007. Business Research Methods. 2nd edition. Oxford University
Press: New York.
Bryman, A., and Bell, E. 2011. Business Research Methods. 3rd edition. OUP Oxford.
Bryman, Bell, Hirschsohn, Do Santos, Du Toit, Masenge, Van Aardt, and Wenger. 2014.
Research Methodology: Business Management Context. (ed). Oxford University Press: South
Africa.
Buniĉ, Z. 2007. Influence of market orientation on business performance, case: Croatian
manufacturing companies. 16th EDAMBA Summer Academy-Sorezr, France-July.

163
Burns, A.C., and Bush, R.F. 2006. Marketing Research.
Burns, N. and Grove, S.K. 2003. Understanding nursing research. 3rd edition. Philadelphia:
Saunders Company.
Businesstech.co.za. 2015. Population of Bloemfontein, South Africa. Online. Retrieved from
http://businesstech.co.za/news/general/97211/south-africa fastest growing-cities. [Accessed:
17th August 2016].
Cant, M.C. 2010. Marketing Research. Claremont: New Africa Education.
Carr, J., and Lopez, T.B. 2007. Examining market orientation as both culture and conduct:
Modeling the relationship between market orientation and employee responses. Journal of
Marketing Theory and Practice, 15(2), 113-123.
Carr, L.T. 1994. The strengths and weaknesses of quantitative and qualitative research: What
method for nursing?. Journal of Advanced Nursing, 20(4), 716-721.
Centlec. Online. Retrived from: http://www.centlec.co.za/home. [Accessed: 26th September
2016].
Chandrakumara, A., De Zoysa, A. and Manawaduge, A. S. 2009. Leadership styles and
company performance: the experience of owner-managers of SMEs. 4th international Asian
academy of applied business conference. Makati City, The Philippines: Asian Academy of
Applied Business.
Chang, D.T. 2012. Market Orientation and Innovativeness: The Role of Management
Leadership. International Conference on Economics, Business and Marketing Management,
IPEDR, 29, IACSIT Press, Singapore.
Changanti, R., Cook, R. G. and Smeltz, W. J. 2002. Effect of leadership styles, strategies and
systems on the growth of small businesses. Journal of Developmental Entrepreneurship, 7(2),
175-194.
Charles, L., Joel, C., and Samwel, K.C. 2012. Market orientation and firm performance in the
manufacturing Sector in Kenya. European Journal of Business and Management, 4(10), 20-
27.
Chaundhry, A.Q., and Javed, H. 2012. Impact of transactional and laissez faire leadership style
on motivation. International Journal of Business and Social Science, 3(7), 258-264.

164
Chen, C. 2009. A study of civil servants’ cognition of core value and incorruption government:
A case of Tainan country government. Taiwan: New Public Management Trend and
Challenges under the Development of Globalization. The Annual Conference of TASPAA.
Cheng, K. 2011. Exploration of the onstruct Model Linking Leadership Style, Organizational
Culture, Employee Performances and Leadership Effectiveness, Doctorate dissertation,
Taiwan: Graduate School of Business and Management, Lunghwa.
Chiliya, N., and Lombard, M.R. 2012. Impact of level of education and experience on the
profitability of the small grocery shops in South Africa. International Journal of Business
Management and Economic Research, 3(1), 462-470. Online. Retrieved from:
http://www.ijmber.com/docs/volume3issue1/ijmber2012030110pdf. [Accessed: 06 October
2016].
Chima, G.U.K. 2007. Organisational leadership strategies in indigenous companies in
developing economies, St Clement University, Lagos, Nigeria.
Chiou, J.S. and Chang, T.Z. 2009. The effect of management leadership style on marketing
orientation, service quality, and financial results: A cross-cultural study. Journal of Global
Marketing, 22:95–107.
Chiun, L.M., Mohamad, A.A., Ramayah, T., and Chai, W.Y. 2015. Examining effects of
leadership styles, market orientation and leaders member exchange (LMX) on organisational
performance. Engineering Economics, 26(4), 409-429.
Chong, H.G. 2008. Measuring performance of small and medium enterprises: The grounded
theory approach. The Journal of Business and Public Affairs, 2(1), 1-10.
Coad, AJ-L., Segarra, A. and Teruel, M. 2013. Like milk or wine: Does firm performance
improve with age? Structural Change and Economic Dynamics, 24, (1), 173-189.
Coakes, S.J. 2005. SPSS Version 12.0 for windows Analysis without Anguish. Sidney: John
Wiley and Son Ltd, Australia Limited.
Cogliser, C.C. and Brigham, K.H. 2004. The intersection of leadership and entrepreneurship:
Mutual lessons to be learned. The Leadership Quarterly, 15(6): 771-799.
Constantic, E., and Brancusi, C. 2013. Different styles of leadership in organisations touristic
and their benefits and disadvantages. Journal of Knowledge Management, Economics and
Information Technology, 97-111.

165
Cooper, D.R. and Schindler, P.S. 2003. Business Research Methods. New York: McGraw
Hill.
Cooper, D.R. and Schindler, P.S. 2011. Business Research Methods. 11th edition. America:
New York.
Cooper, D.R., and Schindler, P.S. 2014. Business Research Methods. 4th edition. McGraw-
Hill Higher Education.
Cooper, D.R., and Schindler, P.S. 2011. Business Research Methods. 3rd edition. McGraw-Hill
Higher Education.
Cooper, D.R., and Schindler, S.S. 2006. Business Research Methods. 9th edition. McGraw-
Hill/Irwin, New York.
Cresswell, J.W., Ebersohn, L., Eloff, I., Ferreira, R., Ivankova, N.V., Jansen, J.D.,
Nieuwenhuis, J., Pietersen, J., Plano Clark, V.L., and van de Westhuizen, C. 2010. First Step
in Research. 5th edition. Van Schaik: Pretoria.
Daft, R., and Marcic, D. 2013. Management: The new workplace. 8th edition. South-West:
Cengage learning.
Darabi, Y., Caruana, A. and Zegordi, S.H. 2007. The impact of market orientation on business
performance and Website Adoption: A study among Iranian SMEs. IAIA International
Journal, 5(2): 26-39.
Dauda, Y.D. and Akingbade, W.A. 2010. Emloyee’s market orientation and business
performance in Nigeria: Analysis of small business entreprises in Lagos state. International
Journal of marketing studies, 2(2):134-143.
Day, G. S., and Wensley, R. (1988). Assessing advantage: A framework for diagnosing
competitive superiority. Journal of Marketing, 52, 1–20.
Day, G.S. 1994. The capabilities of market-driven organization. Journal of Marketing, 5, 37-
52.
De luca, L.M., Verona, G., and Vicara, S. 2010. Market orientation and research and
development effectiveness in the biotechnology industry. Journal of Production Innovation
Management, 27, 299-320.
De Vos, A.S.D., Strydom, H., Fouche, C.B., and Delport, C.S.L. 2011. Grassroots Research.
4th edition, Van Schaik Publisher.
166
Demirbag, M., Lenny Koh, S.C., Tatoglu, E., and Zaim, S. 2006. Total quality management
and market orientation’s impact on SMEs performance. Industrial Management and Data
Systems, 106(6), 1206-1228.
Denton, E. M. 2009. Teachers’ Perception of How Leadership Style and Practices of Principal
Influence Their Job Satisfaction and Retention. Doctorate dissertation, Liberty University.
Department of Agriculture, Forestry and Fisheries. 2014. National policy framework on the
support and development of small and medium agro processing enterprises in the Republic of
South Africa. Online. Retrieved from: http//www.nda.agricza/daoDev/sideMenu/
AgroProcessingSupport/docs/policy%20on%20small%20and%20medium%20enterprises%w
eb.pdf. [Accessed: 16th October 2016].
Department of Trade & Industry. (2014). Black economic empowerment. Online. Retrieved
from: http://www.southafrica.info/business/trends/empowerment/bee.htm#.VDp_kfmSxI4.
[Accessed: 12th October 2016].
Deshpandé, R. and Farley, J. U. 2004. Organizational culture, market orientation,
innovativeness, and firm performance: an international research odyssey. International
Journal of Research in Marketing, 21, 3-22.
Deshpandé, R., Farley, J.U., and Webster, F.E., Jr. 1993. Corporate culture, customer
orientation, and innovativeness in Japanese firms: A quadrate analysis. Journal of Marketing,
57, 23-27.
Dubihlela, J. 2012. Barriers to and determinants and enablers of market orientation: Impact
on business performance form small and medium enterprises in South Africa. Doctorate
dissertation, North-West University, Vaal Triangle Campus, South Africa.
Dursun-Kilic, T. 2006. An empirical investigation of the link between market orientation and
new product performance: The mediating effects of organizational capabilities. Doctorate
dissertation, Norfolk, Virginia: Old Dominion University.
Ehlers, T., and Lazenby, K. 2010. Strategic Management: Southern African concepts and
cases. 3rd edition, Van Schaik Publisher.
Ellis, P.D. 2006. Market orientation and performance: A Meta-analysis and cross-national
comparisons. Journal of Management Studies, 45(5), 1089-1107.
Eltinay, N.B., and Masri, R. 2014. Understanding the impact of financial and non-financial
measurement in Sudanese banks performance. International of Journal of Humanities and
167
Management Science, 2(3), 98-104. Online. Retrieved from:
http://www.isaet.org/images/extraimages/914033.pdf. [Accessed: 30th June 2016].
Essien, K.A., Olusegun, A.A., and Mukaila, O.B. 2013. Manegerial styles and staff turnover
in Nigerian Banks: A Comparative Analysis. American Journal of Social Science, 2(6), 79-93.
Fakoti, O.O. 2014. The entrepreneurial orientation of micro enterprises in the retail sector in
South Africa. Journal of Sociology and Social Anthropology, 5(2), 125-129.
Gainer, A., and Pandanyi, B. 2005. The relationship between market-orientated activities and
market-orientated culture: Implication for the development of market orientation in non-profit
service organisations. Journal of Business Research, 58, 854-864.
Ganyaupfu, E.M. 2013. Entrepreneur and firm characteristics affecting the success of Small
and Medium Enterprises (SMEs) in Gauteng Province. International of Innovative Research
in Management, 2(9), 1-8.
Garcia-Morales, V.J., Jimenez-Barrionouvo, M.M., and Guttierrez-Guttierrez, L. 2011.
Transformational leadership influence on organisational performance through organisational
learning and innovation. Journal of Business Research, 65, 1040-1050.
Garstka, C, H. 2011. The role of the principal’s leadership style in the implementation of ICT
policy. British Journal of Education and Technology, 42(2), 311-326.
Gathogo, G., and Ragui, M. 2014. Effects of capital and technology on the performance of the
SMEs in the manufacturing sector in Kenya – Case of selected firms in Thika Municipality.
European Journal of Business Management, 6(7), 308-311. Online. Retrieved from:
http://www.ku.ac.ke/school/business/images/stories/research/dr-ragui/effects-of-capital-
technology.pdf. [Accessed: 14th September 2016].
Gatignon, H., and Xuereb, J.M. 1997. Strategic orientation of the firm new product
performance. Journal of Marketing Research, 34(1), 77-90.
Ghani, U., and Mahmood, Z. 2011. Factors influencing performance of microfinance firms in
Pakistan: Focus on market orientation. International Journal of Academy Research, 3(5), 125-
132.
Gomba, M. 2014. Understanding the factors that influence the management succession process
in black family owned business, MBA mini dissertation, University of Pretoria, South Africa.
Online. Retrived from: https://repository.up.ac.za/handle/2263/43974?show=full. [Accessed:
20th March 2016].

168
Government Gazette of the Republic of South African (2003) National Small Business
Amendment Act, In Industry, D. o. T. a. (ed.), Vol. 102 OF 1996, Cape Town.
Gravetter, F.J., and Wallnau, L.B. 2009. Statistics for the Behavioural Sciences. 8th edition,
Wadsworth Cengage Learning.
Greenley, G.E. 1995. Market orientation and company performance: Empirical evidence
from UK companies. British Journal of Management, 6, 1-13.
Grewal, R., and Tansuhaj, P. 2001. Building organizational capabilities for managing
economic crisis: The role of market orientation and strategic flexibility. Journal of Marketing,
65(2), 67-80.
Grönroos, C. 1991. The marketing strategy continuum: Towards a marketing concept for
the 1990s. Management Decision, 29(1), 7-23.
Grönroos, C. 2006. Adopting service logic for marketing. Marketing Theory, 6(3), 317-333.
Guardia, A.B. 2007. Leadership, group effectiveness, and group performance: An assessment
of a theoretical systems model and an observed structural equation, Proquest Information and
Learning Company.
Gudlaugsson, T and Schalk, A. P. 2009. Effect of market Orientation on Business
Performance: Empirical evidence from Iceland. The European Institute of Retailing and
Services Studies, 6, 1-17.
Guijarro, A.M., Van Auken, H.., and de-Lema, G.P. 2012. An analysis of factors impacting
performance of Spanish manufacturing firms. Journal of Small Business and
Entrepreneurship, 20(4), 369-386.
Halloway, J.B. 2012. Leadership behaviour and organisational climate: An empirical study
in a non-profit organisation. Emerging Leadership Journey, 5(1), 9-35.
Han, J.K., Kim, N., and Srivastava, R.K. 1998. Market orientation and organizational
performance: Is innovation a missing link?. Journal of Marketing, 62(4), 30-45.
Harif, M.A.A.M., Hoe, C.H., and Ahmad, I. 2013. The financial and non-financial
performance indicators of paddy farmer’s organisation in Kedah. World Review of Business
Research, 3(1), 80-102.
Hariri, H. 2011. Leadership style, decision making style and teacher’s job satisfaction: An
Indonesia school context, Doctorate dissertation, James Cook University.

169
Harwell, M. 2011. Research design in qualitative/quantitative/mixed methods in C.F., Clifton
and R.C., Serlin (eds), The Sage handbook for research in education: Pursuing ideas as the
keystone of exemplary inquiry. 2nd edition. 147-182.
Hashim, F., and Abu Bakar, A.D. 2011. Antecedents and consequences of market orientation
in non-profit organisations: Evidence from Malaysia. International Journal of Management
and Marketing Research, 4(3), 95-105.
Hassim, A.A, Abdul-TAlib, A.N., and Bakar, A.R. 2011. The effects of entrepreneurial
orientation on firm organisational innovation and market orientation towards firm business
performance. International Conference on Scociality and Economic Development, IACSIT
Press, Singapore.
Hellriegel, D., Jackson, S., Solcum, J., Staude, G., Amos, T., Klopper, H.B., Louw, L., and
Oosthuizen, T. 2010. Management. 3rd edition. Oxford University Express: South Africa.
Herath, H.M.A, and Mahmood, R. 2013. Strategic orientation based research model of SME
performance for developing countries. Review of Integrative Business and Economic Research,
2(1), 430-438.
Hernez-Broome, G. and Hughes, L.R. 2004. Leadership development: Past, present, and
future. Human Resources Planning, 27(1): 24-33.
Herrington, M., Kew, J. and Kew, P. 2010. Global Entrepreneurship Monitor (GEM). South
Africa Report. Cape Town: UCT Graduate School of Business.
Hilman, H. and Kaliappen, N. 2014. Market orientation practices and effects on organisational
performance: Empirical insight from Malaysian hotel industry. Article, 1-8. Online. Retrieved
from: http://www.journals.sagepub.com/doi/pdf/10.1177/2158244014553590. [Accessed: 1st
May 2017].
Hoffmann, A. 2010. Perception of whole body vibration. Master’s dissertation. Chalmers
University of Technology, Goteborg, Sweden.
Hunt, S.D., and Morgan, R.M. 1995. The comparative advantage theory of competition.
Journal of Marketing, 59, 1-15.
Inmyxai, S., and Takahashi, 2010. Performance contrast and its determinants between male
and females headed firms in Lao MSMEs. International Journal of Business and Management,
5(4), 37-52.

170
Ireland, R.D. and Hitt, M.A. 2005. Achieving and maintaining strategic competitiveness in
the 21st century: The role of strategic leadership. Academy of Management Executive, 19(4):
63-77.
Jaakkola, M., Frösén, J., Santala, M., and Vassinen. 2009. Market orientation and business
performance: The mediating effect of core business processes. 9th International Marketing
Trends Congress. Paris, France.
Jago, A.G. 1988. The new leadership: Managing participation in organisations. Englewood
Cliffs, NJ: Prentice-Hall.
Jaiyeoba, O.O. 2013. Effect of management behavior and environmental dynamics on market
orientation behaviors among Botswana’s small service firms. Business Management and
Strategy, 4(2), 91-110.
Jan Khan, M.W., Khalique, M., and Nor, R.M. 2014. Exploring the measurements of
organisational performance: Small and medium enterprises perspective. Market Force College
of Management Science, 9(2), 31-38.
Jayasingam, S., and Chen, N.Y. 2009. Leadership Styles and Perception of Effectiveness.
Enlightening Malaysian Managers. Asian Social Science Journal, 5(2), 54-65.
Jeremy, M., Melinde, C., and Ciller, V. 2011. Perceived leadership styles and employees
participation in a manufacturing company in the Democratic Republic of Congo. African
Journal of Business Management, 6(15), 5389-5398.
Jimenez-Jimenez, D., Valle, R.S., and Hernandez-Espallardo, M. 2008. Fostering innovation:
the role of market orientation and organizational learning. European Journal of Innovation
Management, 11(3), 389-412.
Jogulu, U, D., and Woods, G.J. 2006. The role of leadership theory in raising the profile of
women in management. Equal Opportunities International, 25(4), 236-250.
Johnson, R.B., and Onwuegbuzie, A.J. 2004. Mixed research: A research paradigm whose
time has come. Educational Researcher, 33(7), 14-26.
Jones, G.R, and George, J.M. 2009. Contemporary Management. 6th edition, MacGraw-
Hill/Irvin.
Jones, M.V., Wheeler, C., and Dimitratos, P. 2011. Internationalisation, Innovation and
Entrepreneurship: New Ventures on Life Sciences’. Cheltenham, UK, 1-19.

171
Jong. P.J., Deanne N., and Hartog, D. 2007. How leaders influence employees’ innovative
behaviour. European Journal of Innovation Management, 10, 41-64.
Jyoti, J., and Sharma, J. 2012. Impact of market orientation business performance: Role of
employee satisfaction and customer satisfaction. Vision, 16(4), 297-313.
Kassie, M.G.M. 2015. Market orientation and business performance: An empirical study of
the banking sector in Ethiopia. Doctorate dissertation, University of South Africa.
Kassim, Z.A. and Sulaiman, M. 2011. Market orientation and leadership styles of managers in
Malaysia. International Journal of Leadership Studies, 6 (2): 231- 245.
Kazemian, S., Rahman, R.A., Ibrahim, Z., and Adeymi, A.A. 2014. AIM’s accountability in
financial sustainability: The role of market orientation. International Journal of Trade,
Economic and Finance, 5(2), 191-194.
Kelson, A.K. 2012. A quantitative study of market orientation and organisatinal performance
of listed companies: Evidence from Ghana. International Journal of Management and
Marketing Research, 5(3), 101-114.
Kennedy, K.N., Goolsby, J.R. and Arnould, E. J. 2003. “Implementing a customer
Orientation”: Extension of theory and application. Journal of Marketing, 67(4): 67-87.
Kohli, A.K. and Jaworski, B.J. 1990. Market orientation: The construct, research proposition
and managerial implication. Journal of Marketing, 54: 1-18.
Kohli, A.K., Jaworski, B.J., and Kumar, A. 1993. A measure of market orientation. Marketing
Journal of Marketing Research, 30(4), 467-477.
Koloba, H.A. 2012. Entrepreneurial orientation of ceneration Y students in the Vaal Triangle
area. Master’s dissertation, University of North-West, South Africa.
Kongolo, M. 2010. Job creation versus job shedding and the role of SMEs in economic
development. African Journal of Business Management, 4(11), 2288-2295.
Kumar, V., Jones, E., Venkantesan, R., and Leone, R.P. 2011. Is market orientation a source
of competitive advantage or simply the cost of competing?. Journal of Marketing, 75, 16-30.
Lam, T.K.P. 2007. Antecedents and consequences of market orientation: An examination in
the joint ventures’ relational context. Doctorate dissertation, Aston University.
Langwerden, E.F. 2015. Performance measurements system development in SMEs: Testing
and refining the circular methodology. 5th IBA Bachelor Thesis Conference. Enschede,
Netherlands.

172
Lawal, A.A., Ajonbadi, H.A., and Otokiti, B.O. 2014. Leadership and organisational
performance in the Nigeria small and medium enterprises (SMEs). American Journal of
Business, Economics and Management, 2(5), 121-127.
Lawal, O.Y., and Chukwuebuka, C.K. 2007. Evaluation of Leadership and Organisational
Performance in Small Scale industries in Nigeria: A case of Selected Small Industries in Aba,
Abia State, Nigeria. Master’s dissertation, Blekinge Institute of Technology, Sweden.
Lazar, J., Feng, J.H., and Hochheiser, H. 2010. Research Methods In Human-Computer
Interaction. 1st edition. John Willey and Sons: United Kingdom.
Levitt, T. 1960. Marketing Myopia. Harvard Business Review. 38, 24-47.
Li, Y., Yongbin, Z., Justin, T., and Liu, Y. 2008. Moderating effect of market – oriented
culture and marketing strategy on firm performance. Journal of Strategic Marketing, 14, 245-
261.
Lings, I.N, and Greenley, G.E. 2009. The impact of internal and external market orientation
on firm performance. Journal of Strategic Marketing, 17(1), 41-53.
Loannou, L. 2008. Building competitive advantage through market orientation: A strategic
solution for LCBS in the new European Union banking. Doctorate dissertation, Middlesex
University, London.
Lombard, C., van der Merwe, L., Kele, T., and Mouton, S. 2010. Elementary Statistics for
Business and Economics. Heinemann.
Lorsch, J. 2008. Contengency Theory of Leadership, Harvard University.
Lucy, A., Ayodele, A.O., Babatunde, B., and Timothy, A.O. 2014. Leadership style as
determinants of small medium scale enterprises in Ogun State, Nigeria. Implication to
counselling and management. Global Advanced Research Journal of Management and
Business Studies, 3(8), 388-393.
Machirori, T. L. 2012. The impact of networking on access to finance and performance of
SMES in the Buffalo City Municipality, Eastern Cape, South Africa. Master’s dissertation.
South Africa. University of Fort Hare.
Maduekwe, C.C., and Kamala, P. 2013. Performance measurement by small and medium
enterprises in Cape Metropolis, South Africa. Problems and Perspective in Management,
14(2), 46-55.

173
Mahmoodean, A.R., Ashraf, Y.A.P. and Hassani, S.R. 2014. An Examination of the status of
competitor orientation and customer orientation of SMEs and their relationship with
customer’s performance. A case study: Industrie(s in Iiam Province. International Research
Journal of Applied and Basic Science, 8(2), 231-240.
Maholtra, N.K. 2010. Marketing research: An applied orientation. 6th edition, Eaglewood
Cliff: Prentice-Hall.
Maladzhi, W.R. 2012. Analysis of innovative leadership and sustainability of SMEs in the
Western Cape Province, South Africa. Doctorate dissertation. Cape Peninsula University of
Technology, South Africa.
Marturano, A. and Golsig, J. 2008. Leadership, the Key Concepts. London: Routledge, 42-45.
Mat, J. 2008. The influence of leadership style on internal marketing in retail. Doctorate
dissertation, University of Stirling.
Matveev, A.V. 2002. The advantages of employing quantitative and qualitative methods
intercultural research: Practical implications from the study of perceptions of intercultural.
Institute of Management and Law Publishing, 168, 59-67.
McClaure, R.E. 2010. The influence of organizational culture and conflict on market
orientation. Journal of Business and Industrial Marketing, 22(4), 348-407.
McLaurine, J.R. 2006. The role of situation in the leadership approach: A review and
application. Academy of Strategic Management Journal, 5, 97-114.
Menguc, B., and Auh, S. 2008. Conflict, leadership and market orientation. International
Journal of Research in Marketing, 25, 34-45.
Merlo, O., and Auh, S. 2009. The effects of entrepreneurial orientation, market orientation,
and marketing subunit influence on firm performance. Marketing Letters, 20, 295-311.
Mgeni, T.O. 2015. Impact of entrepreneurial leadership styles on business performance of
SMEs in Tanzania. Entrepreneurship and organisational management, 4(2), 1-9.
Mingers, J. 2001. Combining IS research methods: Towards a pluralist methodology.
Information Systems Research, 12(3), 240-259.
Mitchell, M.L., and Jolley, J.M. 2010. Research design explained. 7th edition, Australia
Cengage Learning.

174
Mohamad, A.A, and Chiun Lo, M. 2012. Investigating the impact of leadership styles and
market orientation on organisational performance. 2nd Annual Summit on Business and
Entrepreneur Studies (ASBES), Hilton Hotel, Kuchin, Sarawa, Malaysia.
Mohd Sam, F.A., Tahir, H.M., Abu Bakar, K. 2012. Owner-managers of SMEs in it sector:
leadership and company performance. International Journal of Business and Social Science, 3
(14): 195- 205.
Mohutsiwa, M. 2012. Strategic entrepreneurship and performance of small and medium
enterprises in South Africa. Master’s dissertation, University of Witwatersrand, South Africa.
Mokthar, S.S.M., Yusoff, R.Z., and Ahmad, A. 2014. Key elements of market orientation on
Malaysian SMEs performance. International Journal of Business and Society, 15(1), 49-64.
Momrak, A.M. 2012. Effects of market orientation on business performance: Environmental
moderators, effectiveness and efficiency mediators and the role of firm capabilities. Master’s
dissertation, Buskeru University College.
Morgan, N.A., Slotegraaf, R.J., and Vorhies, D.W. 2009. Linking marketing capabilities
with profit growth. International Journal of Research in Marketing, 26(4), 284-293.
Mugsood, S., Bilal, H., Nazir, S., and Baig, R. 2013. Manager’s leadership styles and
employees job satisfaction. Human and Social Science Research Journal, 1(2), 139-144.
Murray, J.Y., Gao, G.Y., and Kotabe, M. 2010. Market orientation and performance of export
ventures: The process through marketing capabilities and competitive advantages. Journal of
the Academy of Marketing Science, 39(2), 252-269.
Mutyenyoka, E.M. and Madzivhandila, T. 2014. Employment created through small, medium
and micro enterprises (SMMEs) in South Africa: Challenges, progress and sustainability.
Mediterranean Journal of Social Sciences, 5(25), 65-72.
Nagy. A., Babaita, C., and Ispas, A. 2012. Non-financial performance measurement of the
hotel activity. Recent researcher in tourism and economic development, 225-228, Romania.
Online. Retrieved from: http://www.wseas.us/e-library/conference/2011/ Drobeta/TED/TED-
37.pdf. [Accessed: 21st October 2016].
Nakola, J.O., Tarus, B. K., Buigut, K., and Kipchirchir, K.E. 2015. Effect of strategic
orientation on the performance of Small and Medium Enterprises: Evidence from Kenya.
International Journal of Economics, Commerce and Management, 3(11), 337-351.

175
Narver, J. C., Slater, S. F. and Tietje, B. 1998. Creating a market orientation. Journal of Market
Focused Management, 2: 241−255.
Narver, J.C, and Slater, S.F. 1990. The effect of a market orientation on business profitability.
Journal of Marketing, 54(4), 20-36.
Nasiripour, A.A., Raeissi, P., and Hoosseini-Fahraji, H. 2012. Environmental dimension and
features affecting organizational entrepreneurship development in Iranian public hospotals.
Journal of Hospital Administration, 2, 88-102.
Nave, J.W. 2006. Leadership styles of entrepreneurs in small and surveying business. Proquest
information and learning company. UI Number 3195328.
Negron, D. 2008. A case study examining the relationship of the path-goal theory leadership
styles to profit in El Paso, Texas, Rent-A-Center stores. Doctorate dissertation, Capella
University.
Neneh, B. 2011. The Impact of Entrepreneurial Characteristics and Business Practice on the
Long Term Survival of Small and Medium Enterprises (SMEs). Master’s dissertation,
University of the Free State, South Africa.
Neneh, B.N. 2014. An Assessment of Entrepreneurial intention among university students in
Cameroon. Mediterranean Journal of Social Sciences, 5(20), 542-552.
Neneh, B.N. 2016. Market orientation and performance: The contingency role of external
environment. Environmental Economics, 7(2), 1-14.
Neneh, N.B. and Van Zyl, J. 2012, Achieving optimal business performance through business
practices: Evidence from SMEs in selected area in South Africa. Southern African Business
Review, 16(3).
Ngambi, H.C, Cant M.C, and Van Heerden C. H. 2010. Marketing management: A South
African perspective, Juta, Cape Town.
Ngasantil, W. 2001. Market orientation and business performance: Empirical evidence from
Thailand. Unpublished dissertation: University of Melbourne.
Ngodo, O.E. 2008. Procedural justice and trust: The link in the transformational leadership-
organisational outcomes relationship. International Journal of Leadership Studies, 4, 82-100.
Njoroge, C. W. and Gatungu, J. M. 2013. The effect of entrepreneurial education and training
on developement of Small and Medium Size Entreprises in Githunguri District - Kenya,
International Journal of Education and Research, 1(8), 1 – 22.
176
Noble, C.H., Sinha, K.R. and Kumar, A. 2002. Market orientation and alternative strategic
orientations: A Longitudinal assessment of performance implications. Journal of Marketing,
66: 25-39.
Northouse, P.G. 2007. Leadership: Theory and Practice. 4th edition. Thousand Oaks. CA.
USA: Sage Publication. Inc.
Northouse, P.G. 2010. Leadership: The Theory and Practice. 5th edition. Thousand Oarks.
CA: SAGE.
Nsubuga, Y.K.K. 2008. Analysis of Leadership Styles and School Performance of Secondary
School in Uganda. Doctorate dissertation, Nelson Mandela Metropolitan University, South
Africa.
Ntsika Enterprise Promotion Agency. 2009. State and Small Business Development in South
Africa Annual Review. Online. Retrieved from: www.ntsika.org.za. [Accesse: 30th June 2015].
O’Brien, R.M. 2007. A caution regarding rules of thumb for variance inflation factors. Quality
and Quantity, 41, 673–690.
Obiwuru, T.C., Okwu, A.T., Akpa, V.O., and Nwankwe, I.A. 2011. Effects of leadership style
on organisational performance: A survey of selected small scale enterprises in Kosi-Ketu
council development are of Lagos State, Nigeria. Australia Journal of Business Management
Research, 1(7), 100-111.
Ogbanna, E. and Harris, L.C. 2000. Leadership style, organizational culture and performance:
empirical evidence from UK companies. The International Journal of Human Resource
Management, 11 (4) 766-788.
Ojukuku, R.M., Odetayo, T.A., and Sajuyigbe, A.C. 2012. The impact of leadership styles on
organisational Performance: A case ttudy of Nigerian banks. American Journal of Business
and Management, 1(4), 202-207.
Okeyo, W.O., Gathungu, J., and K’obonyo, P. 2014. The effects of business development
services on performance of small and medium manufacturing enterprises in Kenya.
International Journal of Business and Social Research (IJBSR), 4(6), 12-26.
Olawale, F. and Garwe, D. 2010. Obstacles to the growth of new SMEs in South Africa: A
principal component analysis approach. African Journal of Business Management, 4(5): 729-
738.
177
Oluwatoyin, O.C. 2006. The relationship between leadership styles and school climate in
Botswana Secondary School, Botswana, Doctorate dissertation, University of South Africa,
South Africa.
Opeda, F. and Jaiyeoba, O. 2011. Market orientation: Journey from antecedents to business
performance in a developing economy: A case-study of Botswana‘s Small and medium size
manufacturing firms. International Journal of Business Administration, 2(4), 61-68.
Papalexandris, N. and Galanaki, E. 2009. Leadership’s impact on employee engagement.
Leadership and Organizational Development Journal, 30(4): 365-385.
Patiar, A. and Wang, Y. 2016. The effects of “transformational leadership and organisational
commitment on hotel department performance”. International Journal of Contemporary
Hospitality Management, 28(3), 586-608. Online. Retrieved from:
http://www.emraldinsight.com/doi/abs/10.1108/IJCHM-01-2014-0050. [Accessed: 12th
September 2017].
Pedraja-Rejas, L., Rodríquez, E., and Rodríquez-Pounce, Y.J. 2006. Leadership styles and
effectiveness: A study of small firms in Chile. Network of Scientific Journals from Latin
America, 31(7), 500-504.
Pervez, S. 2005. Leadership in Organizations: A Comparative study of Profit and Non –Profit.
Pinho, J.C., Rodriques, A.P., and Dibb, S. 2014. The role of corporate culture, market
orientation and organizational commitment in organizational performance. Journal of
Management Development, 33(4), 347-398.
Polston-Murdoch, L. 2013. An investigation of Path-Goal Theory, relationship of leadership
style, supervisor-related commitment, and gender. Emerging Leadership Journeys, 6 (1):13-
44.
Protcko, E., and Dornberger, U. 2014. The impact of market orientation on business
performance-the case of Tatarstan knowledge-intensive companies (Russia). Problems and
Perspectives in Management, 12(4), 225-231.
Quandl.com. 2015. Population of Thaba’Nchu, South Africa. Online. Retrieved from:
http://quandl.com/data/citypop/city-Thaba’Nchu of South Africa. [Accessed: 17th August
2016].
Quinlan, C. 2011. Business Research Methods. South Western: Cengage Learning.

178
Radipere, S., and Dhliwayo, S. 2014. The role of gender and education on small business
performance in the South African small enterprise sector. Mediterranean Journal of Social
Science, 5(9), 104-110.
Ratyan, A.R., and Mohd, R.A. 2013. Overview of Path-Goal leadership theory.
Comprehensive Research Journal of Education and General Studies, 1(1), 001-005.
Reijonen, H., Laukkanen, T., Komppula, R. and Tuominen, S. 2012. ‘Are growing SMEs more
market oriented and brand – oriented? Journal of Small Business Management, 50, 699-716.
Rodrigues, A.P., and Pinho, J.C. 2012. The impact of internal and external market orientation
of performance in local public organisations. Marketing Intelligence and Planning, 30(3), 284-
306.
Rodriguez, V., Ricardo, A, Berrio, R., and Sandra, P. 2011. The impact of market orientation
on the financial performance of MSMES (micro, small and medium enterprises) in Bogotá.
Caudernos de Administración, 27(46), 131-140.
Rojas-Mendez, J.I., and Rod, M. 2013. Chilean wine producer market orientation: Comparing
MKTOR versus MARKOR. International Journal Wine Business Research, 25, 27-49.
Romero, J.E. 2005. Leadership, Culture and Competitive Advantage. Online. Retrieved from:
http://competeoutsidethebox.com/wp-content/uploads/articles/Leadership,%20Culture%
20and%20Competitive%20Advantage.pdf. [Accessed: 23rd October 2014].
Rowold, J. 2011. Relationship between leadership behaviour and performance: Moderating
role of a team’s level of age, gender, and cultural heterogeneity. Leadership and
OrganisationDevelopment Journal, 32(6), 628-647.
Saasongu, N. 2015. Effect of leadership style on organisational performance in small and
medium scale enterprises (SMEs) in Nigeria. International Journal of Research in
Management and Business Studies, 2(2), 23-30.
Salant, P., and Dillman, D.A. 1994. How to conduct your own survey. New York: John Wiley
and Sons.
Samad, S., and Abdullah, Z. 2012. The influence of leadership style on organisational
performance of logistic companies. International Business Management, 6(3), 374-383.
Online. Retrieved from: http://www.docsdrive.com/pdfs/medwelljournals/ibn/2012/374-
383.pdf. [Accessed: 28th April 2017].

179
Sandada, M. 2012. Strategic planning and its real relationship with the performance of small
and medium-sized enterprises in Gauteng. Doctorate dissertation, Vaal University of
Technology, South Africa.
Saunders, M., Lewis, P., and Thornhill, A. 2012. Research Methods for business Students. 6th
edition. Pearson education Limited: England.
Schalk, A.P. 2008. The Effects of Market orientation on business performance: Empirical
evidence from Iceland. The European institute of retail and service studies. Online. Retrieved
from: https://notedndur.hi.is/th/efni/EIRASS09.pdf. [Accessed: 25th April 2015].
Scholastica, E.E., and Maurice, U.I. 2013. The relationship between market orientation firm,
innovativeness and business performance of companies in Nigeria. International Journal of
Asian Social Science, 3(11), 2350-2362.
Sekaran, U., and Bougie, R. 2009. Research Methods for Business. 5th edition. John Winley
and Sons: United Kingdom.
Sekaran, U., and Bougie, R. 2013. Research Methods for Business: A skilled- Building
Approach. 6th edition. Wiley: New York.
Sekaran, U., Bougie, R. 2016. Research Methods for Business: A Skilled-Building
Appoarch.7th edition. Wiley: New York.
Seleetse, S. M. 2012. Common causes of small businesses failure in the townships of West
Rand district municipality in the Gauteng Province of South Africa. African Journal of
Business Management, 6 (44):10994-11002.
Shehu, A.M. 2014. The relationship between market orientation and firm performance: A
look at Nigerian SMEs. Developing Country Studies, 4(12), 87-93.
Shneiderman, B., and Plaisant, C. 2005. Designing the User Interface: Strategies for Effective
Human Computer Interaction. 4th edition. College Park. MD: Addison – Wesley.
Slater, S.F., and Narver, J.C. 1994. Does competitive environment moderate the market
orientation-performance relationship?. Journal of Marketing, 58, 46-55.
Slater, S.F., and Narver, J.C. 2000. Market orientation is more than being customer-led.
Strategic Management Journal, 20, 1165-8.
South African LED Network. 2011. Mangaung Metropolitan Municipality sector profile,
South Africa. Online. Retrieved from: http://www.led.co.za/municipalities/free-state.
[Accessed: 20th June 2016].
180
Spreier, S.W., Fontaine, M.H, and Malloy, R.L. 2006. Leadership run amok: The destructive
potential of the overachiever. Harvard Business Review, 1-11.
Stahl, M.J. 2007. The influential leader. Leader to leader, 46-49.
Stangler, D., and Spulber, D. 2013. The age of the entrepreneur: Demographics and
entrepreneurship. Paper presented at the Summit March, Menlo Park, USA.
Statistics South Africa. 2017. Poverty on the rise in South Africa. Online. Retrived from:
www.statssa.gove.za/?p=10334. [Accessed: 15th March 2017].
Suliyanto and Rahab. 2012. The role of market orientation and learning orientation in
improving innovativeness and performance of small and medium enterprises. Asian Social
Sciences, 8(1), 134-145.
Tango, A.F. 2012. The impact of motivations, personal values, management skills of managers
on the performance of SMEs in selected town (Port Elizabeth and Port Alfred) in the Eastern
Cape Province. Master’s dissertation, University of Fort Hare, South Africa.
Tarabisy, A., Solomon, G., Fernald, Jr., L.W. and Sashkin, M. 2005. The entrepreneurial
Leader’s impact on the organization’s performance in daynamic markets. Journal of Private
Equity, 8(4): 20-29.
Tavakol, M., and Dennick, R. 2011. Making sense of Cronbach’s alpha. International Journal
of Medical Education, 2, 53-55.
Taylor, S. 2007. Business Statistics for Non-Mathematicians. 2nd edition. Palgrave Mac
Millan: New York.
The banking association South Africa. 2016. Online. Retrieved from:
www.banking.org.za/what-we-do/sme/sme-definition. [Accessed: 20th September 2016].
Tiptopglobe.com. 2015. Population of Botshabelo, South Africa. Online. Retrieved from:
http://www.tiptopglobe.com/city?n=Botshabelo. [Accessed: 17th August 2016].
Trading Economics. 2017. South African unemployment rate. Online. Retrieved from:
www.tradingeconomics.com/south-africa/unemployment-rate. [Accessed: 20th April 2017].
Tzokas, N., Carter, S. and Kyriazopoulos, P. 2001. Marketing and entrepreneurial orientation
in small firms. Enterprise and Innovation Management Studies, 2(1): 19-33.
Ullah, A. 2013. Impact of leadership on organizational performance. Master dissertation,
Applied University of Science, Germany.

181
Valdiserri, G.A. and Wilson, J.L. 2010. The study of leadership in small business
organizations: Impact on profitability and organizational success. The Entrepreneurial
Executive, 15: 47-71.
Van Der Walt, M. 2015. General Management. 1st edition. Van Schaik Publishers: Pretoria.
Vijayakumar, A. 2011. An empirical study of firm structure and profitability relationship: The
case of Indian automobile firms. International Journal of Research in Commerce and
Management, 1(2), 100-108.
Voola, R., Casimir, G. and Haugen, H. 2003. Leadership styles, internal marketing, and market
orientation: conceptualising the relationships. Online. Retrieved from: http://www.anzmac.
org/conference_archive/2003/papers/MO27_voolar.pdf. [Accessed: 26th October 2014].
Voos, G., and Voos, Z. G. 2000. Strategic orientation and firm performance in an
Environment. Journal of Marketing, 64(1), 67-83.
Vroom, V.H., and Yetton, P.W. 1973. Leadership and decision-making. Pittsburgh, University
of Pittsburgh Press.
Wales, W.J., Monsen, E. and McKelvie, A. 2011. The organizational pervasiveness of
entrepreneurial orientation. Entrepreneurship Theory and Practice, 35(5), 895–923.
Waller, D.L. 2008. Statistics for business. 1st edition. London: Butterworth-Heinenmann.
Weerawardena, J. and O’Cass, A. 2004. Exploring the characteristics of the market driven and
antecedents to sustained competitive advantage, 33(5), 419-428.
Widiana, E.M. 2017. Transformational leadership effect on the marketing performance
through MO. Advances in Social Sciences Research Journal, 4(9), 118-132.
Willemse, J. 2010. The Forum SA. SME failure statistics. Online. Retrieved from:
http://www.theforumsa.co.za/forums/showthread.php?t=7808. [Accessed: 15th September
2014].
William, C. 2013. Management. 5th edition. South-West: Cengage Learning.
William, C. 2014. Approach to Learning Principles of Management. 6th edition. South-West:
Cengage Learnig.
Williams, C. 2007. Research Methods. Journal of Business and Economic Research, 5(3), 65-
72.
World Wide Worx. 2012. Internet matter: The quiet engine of the South African Economy.
Online. Retrieved from:
182
https://assets.publishing.service.gov.uk/media/57a0899b40f0b652dd0002f4/The-impact-of-
internet-connectivity-on-economic-development-in-Sub-Saharan-Africa.pdf. [Accessed: 30th
March 2015].
Yang, C.W. 2008. The relationships among leadership styles, entrepreneurial orientation, and
business performance. Managing Global Transitions, 6:257-275.
Zadeh, S.S.M. 2016. The study of role leadership styles and organisational culture on the
financial performance (Case study: Mellat bank’s branches in the Bushehr Province).
International Journal of Humanities and Cultural Studies, 2356-5926.
Zaman, K., Javaid, N., Arshad, A., and Bibi, S. 2012. Impact of internal market orientation
and business performance. International Journal of Business and Social Science, 3(12), 77-87.
Zikmund, W.G. 2003. Business Research Methods. 7th edition, Thompson: South-West.
Zikmund, W.G., Babin, B.J., Carr, J.C., and Griffin, M. 2010. Business Research Methods. 8th
edition. South Western Cengage Learning.
Zikmund, W.G., Babin, B.J., Carr, J.C., and Griffin, M. 2013. Business research Methods. 9th
edition. South-West Cengage Learning.
Zindiye, S. 2008. An Empirical Investigation into the factors affecting the performance of
Small and Medium Enterprises in the Manufacturing Sector of Harare, Zimbabwe, Master’s
dissertation, University of Fort Hare.
Zopiatis, A., and Constanti, P. 2010. Leadership and burnout: is the any association?
International Journal of Contemporary Hospitality Management, 22(3), 300-320.
Zumitzavan, V. 2010. The impact of Managers’ learning and leadership styles and the
effectiveness of the organisations: A case study from small retail tyre companies in Thailand,
Doctorate dissertation, University of Birmingham.
Zumitzavan, V., and Udchachone, S. 2014. The influence of leadership styles on
organisational performance mediated by organisational innovation: A case study of the
hospitality industry in Thailand. International conference on economics, management and
development. Thailand, 45-52. Online. Retrieved from: http://www.europment.org/library/
2014/interlaken/bypaper/ECON/ECON-05.pdf. [Accessed: 15th July 2016].
Zuniga-Vicente, J.; De la Fuente, Manuel; Sabate, J., and Suarez-Gonzalez, I. 2004. Dynamics
of the strategic group membership-environment. Journal of Business Research, 57, 1378-1390.

183
Zuriekat, M., Salameh, R., and Alrawashdeh, S. 2011. Participation in performance
measurement systems and level of satisfaction. International Journal of Business and Social
Science, 2(8), 160-168.
184
APPENDICES
Appendix 1: Information letter to the participants in the study
LEADERSHIP STYLES AND SME PERFORMANCE: THE MEDIATING
EFFECT OF MARKET ORIENTATION QUESTIONNAIRES
Dear Sir/Madam
I am a Master’s’ student at the Department of Business Management, University of the Free State.
I am conducting a research titled “Leadership styles and SMEs performance: the mediating effect
of market orientation” and your organisation has been chosen to participate in this research. The
information gathered will be used by the researcher for the purpose of the study. It will be treated
the strict confidentiality. Please be accurate and honest as possible in answering all the questions.
Your cooperation is highly appreciated.
Yours Sincerely
Nkopane W. Miya Dr. Neneh Brownhilder
Researcher Supervisor
Contact number: 078 5298 732 Contact number: 051 401 2156

185
Appendix 2: Questionnaire
SECTION A: DESCRIPTIVE/DEMOGRAPHIC DETAILS OF THE SME
OWNER/MANAGER
In this section, the researcher is interested in finding out more information about the SME
owner/manager. Please indicate with (X) in the suitable box below.
1. Gender
Male 1 Female 2
2. Age category
<20 yrs 1 21-30 yrs 2 30-39 yrs 3 40-49 yrs 4 50+ yrs 5
3. Race
African 1 Coloured 3 Asians 5
White 2 Indian 4 Others 6
4. How old is your business? _____________ years.
5. In which stage of the business life cycle phase is your business currently in? Please
indicate with (X).
Startup stage 1 Growth stage 2 Maturity stage 3 Declining
stage
4
6. Highest formal educational qualification?
No formal
education 1
Grade
1-7
2 Grade 8-
12
3 Matric 4 Diploma 5
Degree 6 Honours 7 Master’s
Degree
8 PHD 9
If others, please specify _____________________________________________
7. What type of degree program did you complete? Please indicate with (X).
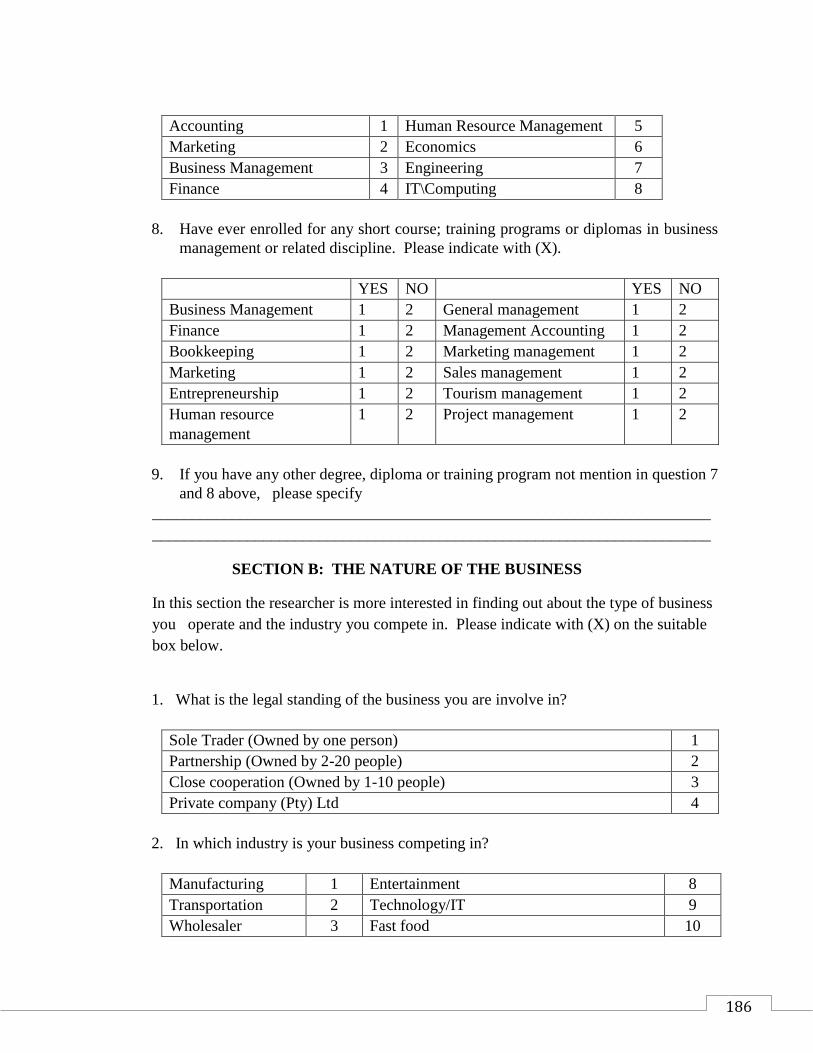
186
Accounting 1 Human Resource Management 5
Marketing 2 Economics 6
Business Management 3 Engineering 7
Finance 4 IT\Computing 8
8. Have ever enrolled for any short course; training programs or diplomas in business
management or related discipline. Please indicate with (X).
YES NO YES NO
Business Management 1 2 General management 1 2
Finance 1 2 Management Accounting 1 2
Bookkeeping 1 2 Marketing management 1 2
Marketing 1 2 Sales management 1 2
Entrepreneurship 1 2 Tourism management 1 2
Human resource
management
1 2 Project management 1 2
9. If you have any other degree, diploma or training program not mention in question 7
and 8 above, please specify
______________________________________________________________________
______________________________________________________________________
SECTION B: THE NATURE OF THE BUSINESS
In this section the researcher is more interested in finding out about the type of business
you operate and the industry you compete in. Please indicate with (X) on the suitable
box below.
1. What is the legal standing of the business you are involve in?
Sole Trader (Owned by one person) 1
Partnership (Owned by 2-20 people) 2
Close cooperation (Owned by 1-10 people) 3
Private company (Pty) Ltd 4
2. In which industry is your business competing in?
Manufacturing 1 Entertainment 8
Transportation 2 Technology/IT 9
Wholesaler 3 Fast food 10

187
Construction 4 Retail and Consumer Services 11
Finance 5 Motor vehicle and Repairs 12
Hair dressing 6 Health care, Education, Social service 13
Clothing 7 Property and Real Estate 14
If you have any other business not mentioned in question 2 above, please specify
______________________________________________________________________
3. How many people does your business employ?
A micro enterprise (0-5 people) 1
Very small (5-10 people) 2
A small enterprise (10-50) 3
A medium enterprise (50-120 people) 4
Large enterprise (>120 people) 5
4. How did you raise up your startup capital?
Personal Savings 1
Family and friends 2
Inheritance 3
Banks and other financial institution 4
Government support services (SEDA, FDC, IDC 5
5. What where your reasons/motives for starting the business? Please indicate with (X).
1 = strongly disagree, 2 = Disagree, 3 = Neutral, 4 = Agree, 5 = strongly agree
Pull and push factors Strongly
Disagree
Disagree Neutral Agree Strongly
agree
Being my own boss 1 2 3 4 5
Need for autonomy 1 2 3 4 5
A need for power 1 2 3 4 5
Independence and flexibility 1 2 3 4 5
Wealth creation 1 2 3 4 5
Opportunities in the market 1 2 3 4 5
To provide job security 1 2 3 4 5
To realise my dreams 1 2 3 4 5
I enjoy taking risk 1 2 3 4 5
Earn a reasonable living and enjoy
a quality of life
1 2 3 4 5
Unemployment 1 2 3 4 5

188
Poverty 1 2 3 4 5
Experiencing low pay in current
employment
1 2 3 4 5
Not happy with current
employment
1 2 3 4 5
Niche market 1 2 3 4 5
Interested in a subject 1 2 3 4 5
6. Did you have a prior experience in the sector your business is operating in?
Yes 1 No 2
If yes, Please indicate in details
___________________________________________________________________
___________________________________________________________________
7. Have any of your family members ever owned or operated a business?
Yes 1 No 2
SECTION C: LEADERSHIP STYLES AND SMEs PERFORMANCE
In this section the researcher is interested to find out more about the impact of leadership
styles on the performance of the SMEs. Please indicate the extent to which you agree and
disagree with the statements below. Mark with (X) on the suitable box.
1 = strongly disagree, 2 = disagree, 3 = Neutral, 4 = agree, 5 = strongly agree
Statements – Directive leadership style
Issue directed to the subordinates on what to do, how to do
and when to do.
1 2 3 4 5
Give instructions and subordinates are expected to follow
them.
1 2 3 4 5
Does not show confidence in the judgement of his/her
subordinates.
1 2 3 4 5
Talks more than listening to the views of the subordinates. 1 2 3 4 5
Aggressive, controlling, and dictates which activities should
be carried out.
1 2 3 4 5

189
Statements - Supportive leadership style
Sets up a conducive and friendly atmosphere at work. 1 2 3 4 5
Shows concern for the well-being of the subordinates. 1 2 3 4 5
Acknowledges the achievements of the subordinates and reward
them.
1 2 3 4 5
Give subordinates emotional, informational, and instrumental
support to overcome their challenges.
1 2 3 4 5
Plays the role of a mentor to enhance the performance of the
subordinates.
1 2 3 4 5
Statements - Participative leadership style
Give subordinates space to raise their opinions before making a
final decision
1 2 3 4 5
Involve subordinates in the planning, and implementation
process.
1 2 3 4 5
Motivates subordinates to brainstorm the idea that will enhance
the performance of the organisation.
1 2 3 4 5
Promotes discussion and motivate collective decision making
than instructing subordinates.
1 2 3 4 5
Shares responsibility with subordinates and encourage teams’
effort in accomplishing goals.
1 2 3 4 5
Statements - Achievement orientated leadership style
Driven by the high desire to achieve the goals of the organisation. 1 2 3 4 5
Sets high goals for subordinates and expect them to perform at
their best level.
1 2 3 4 5
Continuously request subordinates to improve performance to
achieve organisational goals.
1 2 3 4 5
Shows conviction that subordinates will accept responsibility to
achieve challenging goals.
1 2 3 4 5
Statements – Autocratic leadership style
Rules in a very stem manner. 1 2 3 4 5
Dictates how the work should be done. 1 2 3 4 5
Make decisions on his/her own and subordinates do not have a
say.
1 2 3 4 5
Compels subordinates to accept his/her ideas. 1 2 3 4 5
Puts too much emphasis on performance rather than people. 1 2 3 4 5
Statements – Consultative leadership style
Leader takes into account the views and ideas of the subordinates
when setting the goals.
1 2 3 4 5

190
Leader utilise the skills and knowledge of the subordinates but
retains a final decision.
1 2 3 4 5
Involve subordinates in problem solving. 1 2 3 4 5
Leader do not completely trust on his/her subordinates. 1 2 3 4 5
Subordinates are encouraged to put forward their idea in the
decision making process.
1 2 3 4 5
Statements - Democratic leadership style
Puts too much emphasis on performance and people. 1 2 3 4 5
Allow subordinates to participate in the decision making. 1 2 3 4 5
Give subordinates the autonomy to think of creative ways of
doing the work.
1 2 3 4 5
Delegates decision making authority to subordinates. 1 2 3 4 5
Consult subordinates before designing their work program. 1 2 3 4 5
Statements - Laissez-fair leadership style
Give subordinates decision making powers without getting
involve.
1 2 3 4 5
Subordinates have the right to decide what they want. 1 2 3 4 5
Giving responsibility to the subordinates is the way of avoiding
confrontation.
1 2 3 4 5
Pays less attention to conflict situation hoping it will fade away. 1 2 3 4 5
Does not want to handle problems unless compelled to do so. 1 2 3 4 5
Statements - Pace setting leadership style
The leader puts in place high performance standard. 1 2 3 4 5
Preoccupied about getting things done quickly and expect the
same from subordinates.
1 2 3 4 5
Replaces subordinates who cannot meet the standard. 1 2 3 4 5
Demand subordinates who are unable to cope with his/her pace to
improve performance.
1 2 3 4 5
Subordinates are expected maintain the pace set by the leader to
achieve to achieve desired goals.
1 2 3 4 5
Statements - Coaching leadership style
Spent time one on one with the subordinates to develop their
knowledge and skills.
1 2 3 4 5
Help subordinates to be aware of their strengths and improve
weaknesses.
1 2 3 4 5
Indicate to subordinates how to enhance their performance. 1 2 3 4 5
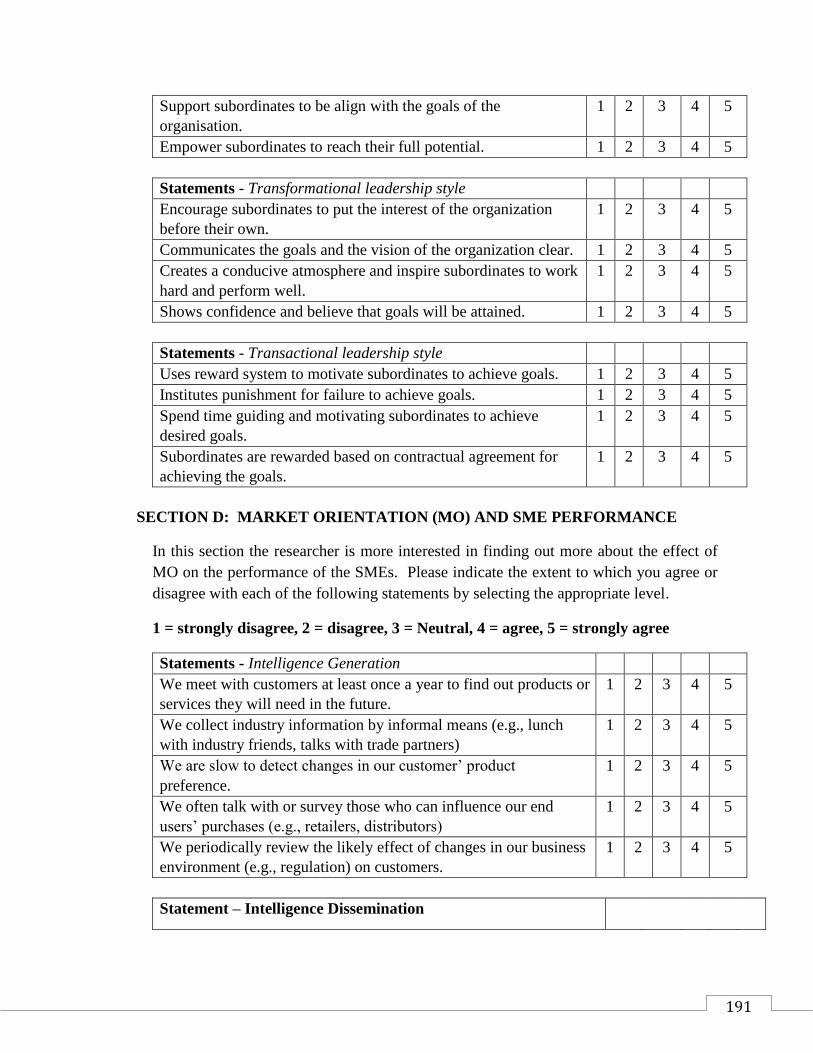
191
Support subordinates to be align with the goals of the
organisation.
1 2 3 4 5
Empower subordinates to reach their full potential. 1 2 3 4 5
Statements - Transformational leadership style
Encourage subordinates to put the interest of the organization
before their own.
1 2 3 4 5
Communicates the goals and the vision of the organization clear. 1 2 3 4 5
Creates a conducive atmosphere and inspire subordinates to work
hard and perform well.
1 2 3 4 5
Shows confidence and believe that goals will be attained. 1 2 3 4 5
Statements - Transactional leadership style
Uses reward system to motivate subordinates to achieve goals. 1 2 3 4 5
Institutes punishment for failure to achieve goals. 1 2 3 4 5
Spend time guiding and motivating subordinates to achieve
desired goals.
1 2 3 4 5
Subordinates are rewarded based on contractual agreement for
achieving the goals.
1 2 3 4 5
SECTION D: MARKET ORIENTATION (MO) AND SME PERFORMANCE
In this section the researcher is more interested in finding out more about the effect of
MO on the performance of the SMEs. Please indicate the extent to which you agree or
disagree with each of the following statements by selecting the appropriate level.
1 = strongly disagree, 2 = disagree, 3 = Neutral, 4 = agree, 5 = strongly agree
Statements - Intelligence Generation
We meet with customers at least once a year to find out products or
services they will need in the future.
1 2 3 4 5
We collect industry information by informal means (e.g., lunch
with industry friends, talks with trade partners)
1 2 3 4 5
We are slow to detect changes in our customer’ product
preference.
1 2 3 4 5
We often talk with or survey those who can influence our end
users’ purchases (e.g., retailers, distributors)
1 2 3 4 5
We periodically review the likely effect of changes in our business
environment (e.g., regulation) on customers.
1 2 3 4 5
Statement – Intelligence Dissemination
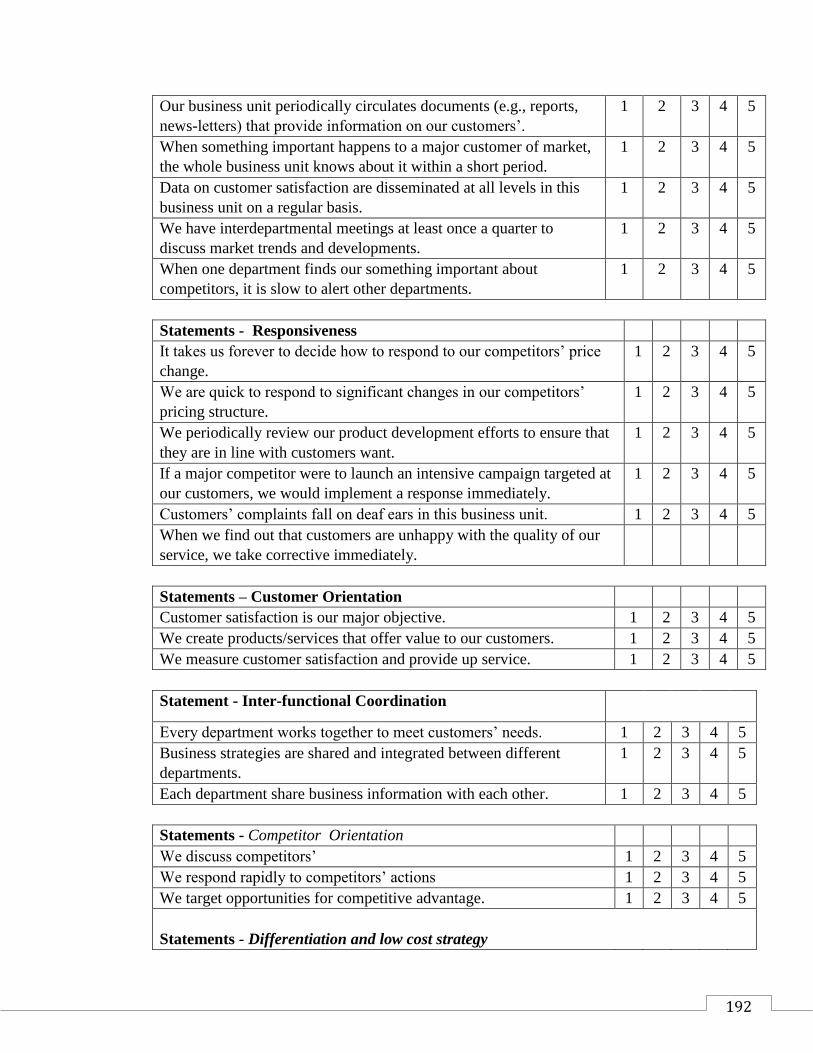
192
Our business unit periodically circulates documents (e.g., reports,
news-letters) that provide information on our customers’.
1 2 3 4 5
When something important happens to a major customer of market,
the whole business unit knows about it within a short period.
1 2 3 4 5
Data on customer satisfaction are disseminated at all levels in this
business unit on a regular basis.
1 2 3 4 5
We have interdepartmental meetings at least once a quarter to
discuss market trends and developments.
1 2 3 4 5
When one department finds our something important about
competitors, it is slow to alert other departments.
1 2 3 4 5
Statements - Responsiveness
It takes us forever to decide how to respond to our competitors’ price
change.
1 2 3 4 5
We are quick to respond to significant changes in our competitors’
pricing structure.
1 2 3 4 5
We periodically review our product development efforts to ensure that
they are in line with customers want.
1 2 3 4 5
If a major competitor were to launch an intensive campaign targeted at
our customers, we would implement a response immediately.
1 2 3 4 5
Customers’ complaints fall on deaf ears in this business unit. 1 2 3 4 5
When we find out that customers are unhappy with the quality of our
service, we take corrective immediately.
Statements – Customer Orientation
Customer satisfaction is our major objective. 1 2 3 4 5
We create products/services that offer value to our customers. 1 2 3 4 5
We measure customer satisfaction and provide up service. 1 2 3 4 5
Statement - Inter-functional Coordination
Every department works together to meet customers’ needs. 1 2 3 4 5
Business strategies are shared and integrated between different
departments.
1 2 3 4 5
Each department share business information with each other. 1 2 3 4 5
Statements - Competitor Orientation
We discuss competitors’ 1 2 3 4 5
We respond rapidly to competitors’ actions 1 2 3 4 5
We target opportunities for competitive advantage. 1 2 3 4 5
Statements - Differentiation and low cost strategy

193
Introducing new services/procedures 1 2 3 4 5
We differentiate services from competitors. 1 2 3 4 5
We utilize market research to identify new services. 1 2 3 4 5
Achieving lower cost of service that competitors 1 2 3 4 5
Offering broader range of services 1 2 3 4 5
Statements - Market turbulence
We experience changes in the taste and preference of customers’
often.
1 2 3 4 5
Customers are constantly looking for new products and services. 1 2 3 4 5
Our customers’ are price conscious. 1 2 3 4 5
We serve more customers’ than we did in the past. 1 2 3 4 5
New customers are demanding our products or service than current
customers.
1 2 3 4 5
Statements – Competitive intensity
New companies enter the market to compete with new offerings. 1 2 3 4 5
Our organisation faces the threat of substitute products from
competitors.
1 2 3 4 5
We compete with many organisations offering similar products or
service in the market.
1 2 3 4 5
We offer products or services that are different from that of our
competitors.
1 2 3 4 5
We offer quality products or services at the lower costs than our
competitors.
1 2 3 4 5
Statements - Technological turbulence
Our industry does not experience a high technological change. 1 2 3 4 5
Technology enables us to serve a large target market. 1 2 3 4 5
Technology enables us to respond quickly to the changing needs of
our customers’.
1 2 3 4 5
Technology boosts our competitive advantage in the market. 1 2 3 4 5
Technology is the major game changer in our industry. 1 2 3 4 5
SECTION E: PERFORMANCE OF THE SMEs
In this section the researcher is more interested in finding out about the performance of
the business. Please indicate with (X) on the statements below.
For the following indicators, compare the results of your company to other competitors (1
= much worse than competitors, 5 = much better than competitors)
Growth in Sales 1 2 3 4 5
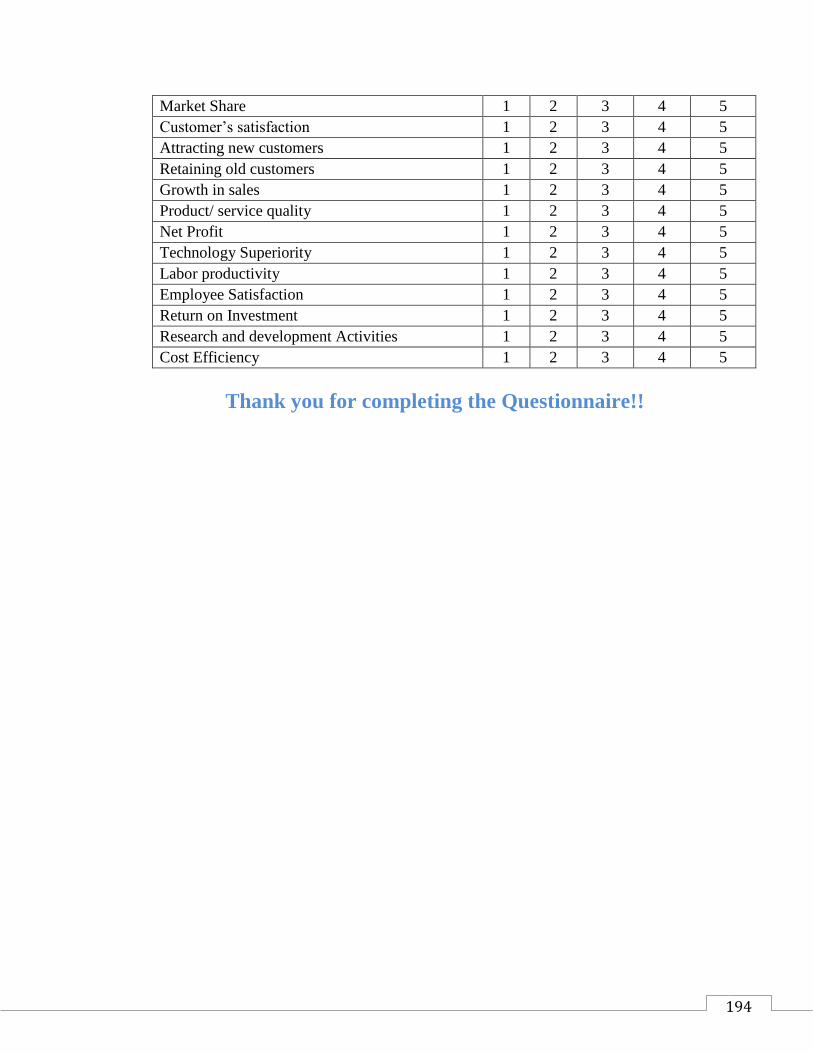
194
Market Share 1 2 3 4 5
Customer’s satisfaction 1 2 3 4 5
Attracting new customers 1 2 3 4 5
Retaining old customers 1 2 3 4 5
Growth in sales 1 2 3 4 5
Product/ service quality 1 2 3 4 5
Net Profit 1 2 3 4 5
Technology Superiority 1 2 3 4 5
Labor productivity 1 2 3 4 5
Employee Satisfaction 1 2 3 4 5
Return on Investment 1 2 3 4 5
Research and development Activities 1 2 3 4 5
Cost Efficiency 1 2 3 4 5
Thank you for completing the Questionnaire!!
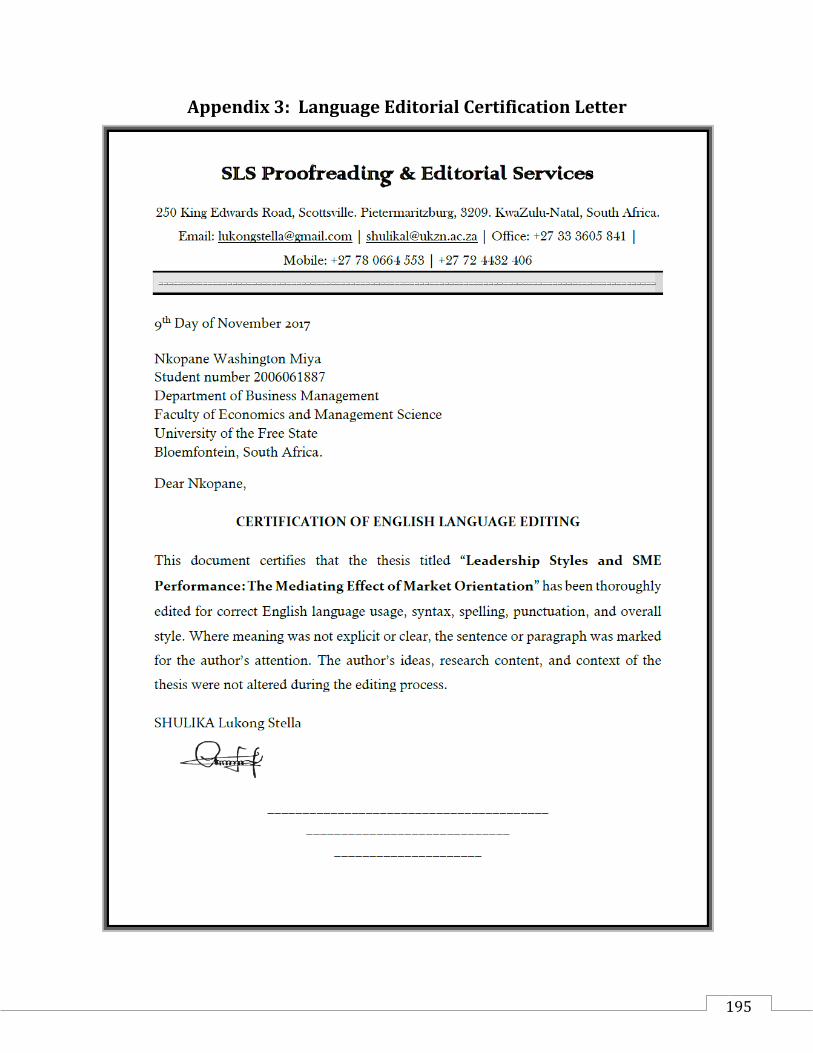
195
Appendix 3: Language Editorial Certification Letter

196
Appendix 4: Mangaung Metropolitan Municipality Map