leadership stability in army reserve component units - rand
TRANSCRIPT

For More InformationVisit RAND at www.rand.org
Explore the RAND National Security Research Division
View document details
Support RANDPurchase this document
Browse Reports & Bookstore
Make a charitable contribution
Limited Electronic Distribution RightsThis document and trademark(s) contained herein are protected by law as indicated in a notice appearing later in this work. This electronic representation of RAND intellectual property is provided for non-commercial use only. Unauthorized posting of RAND electronic documents to a non-RAND website is prohibited. RAND electronic documents are protected under copyright law. Permission is required from RAND to reproduce, or reuse in another form, any of our research documents for commercial use. For information on reprint and linking permissions, please see RAND Permissions.
Skip all front matter: Jump to Page 16
The RAND Corporation is a nonprofit institution that helps improve policy and decisionmaking through research and analysis.
This electronic document was made available from www.rand.org as a public service of the RAND Corporation.
CHILDREN AND FAMILIES
EDUCATION AND THE ARTS
ENERGY AND ENVIRONMENT
HEALTH AND HEALTH CARE
INFRASTRUCTURE AND TRANSPORTATION
INTERNATIONAL AFFAIRS
LAW AND BUSINESS
NATIONAL SECURITY
POPULATION AND AGING
PUBLIC SAFETY
SCIENCE AND TECHNOLOGY
TERRORISM AND HOMELAND SECURITY

This product is part of the RAND Corporation monograph series. RAND mono-graphs present major research findings that address the challenges facing the public and private sectors. All RAND monographs undergo rigorous peer review to ensure high standards for research quality and objectivity.

Leadership Stability in Army Reserve Component Units
Thomas F. Lippiatt, J. Michael Polich
NATIONAL SECURITY RESEARCH DIVISION
Leadership Stability in Army Reserve Component Units
Thomas F. Lippiatt, J. Michael Polich
Prepared for the Office of the Secretary of Defense
Approved for public release; distribution unlimited
NATIONAL SECURITY RESEARCH DIVISION

The RAND Corporation is a nonprofit institution that helps improve policy and decisionmaking through research and analysis. RAND’s publications do not necessarily reflect the opinions of its research clients and sponsors.
R® is a registered trademark.
© Copyright 2013 RAND Corporation
Permission is given to duplicate this document for personal use only, as long as it is unaltered and complete. Copies may not be duplicated for commercial purposes. Unauthorized posting of RAND documents to a non-RAND website is prohibited. RAND documents are protected under copyright law. For information on reprint and linking permissions, please visit the RAND permissions page (http://www.rand.org/publications/permissions.html).
Published 2013 by the RAND Corporation1776 Main Street, P.O. Box 2138, Santa Monica, CA 90407-2138
1200 South Hayes Street, Arlington, VA 22202-50504570 Fifth Avenue, Suite 600, Pittsburgh, PA 15213-2665
RAND URL: http://www.rand.orgTo order RAND documents or to obtain additional information, contact
Distribution Services: Telephone: (310) 451-7002; Fax: (310) 451-6915; Email: [email protected]
Library of Congress Cataloging-in-Publication Data
Lippiatt, Thomas F., 1940- Leadership stability in Army Reserve component units / Thomas F. Lippiatt, J. Michael Polich. pages cm. Includes bibliographical references. ISBN 978-0-8330-7994-7 (pbk. : alk. paper)1. United States. Army Reserve—Officers. 2. United States. Army Reserve—Unit cohesion. 3. United States. Army Reserve—Personnel management. 4. United States. Army Reserve—Operational readiness. 5. Command of troops. 6. Leadership—United States. I. Polich, J. Michael. II. Title.
UB413.L57 2013 355.3'3041—dc23 2013009891
The research described in this report was prepared for the U.S. Department ofDefense. The research was conducted within the Forces and Resources PolicyCenter of the RAND National Defense Research Institute, a federally fundedresearch and development center sponsored by the Office of the Secretary ofDefense, the Joint Staff, the Unified Combatant Commands, the Navy, the MarineCorps, the defense agencies , and the defense Intel l igence Community.
iii
Preface
This monograph reports results of a research project on personnel stability and turbulence among unit leaders in the Reserve Components (RCs) of the U.S. Army. Stability of personnel is highly valued in all military forces, especially in units that are preparing for deployment. Nevertheless, previous RAND research (Lippiatt and Polich, 2010) documented a considerable amount of personnel turbulence—soldiers leaving the unit and being replaced by others—during preparation for deployment.
A particular concern is turbulence among the unit leadership. Even if the service must live with turbulence among the bulk of unit members, the Army would prefer to have unit offi-cers and noncommissioned officers (NCOs) in place to plan and oversee training of the troops with whom they will deploy. Therefore, senior U.S. Department of Defense (DoD) officials asked the RAND Corporation to conduct a study to determine the level of turbulence among unit leadership and to address several related questions: What causes leader turbulence? What effects might it have on training and preparation for future missions that may require RC units? What steps, if any, could be taken to mitigate it?
This document is the final report of the research project titled “Options to Enhance Leadership Stability in RC Units,” sponsored by the Assistant Secretary of Defense for Reserve Affairs. The research was conducted within the Forces and Resources Policy Center of the RAND National Defense Research Institute, a federally funded research and development center sponsored by the Office of the Secretary of Defense, the Joint Staff, the Unified Com-batant Commands, the Navy, the Marine Corps, the defense agencies, and the defense Intel-ligence Community.
For more information on the RAND Forces and Resources Policy Center, see http://www.rand.org/nsrd/ndri/centers/frp.html or contact the director (contact information is provided on the web page).

v
Contents
Preface . . . . . . . . . . . . . . . . . . . . . . . . . . . . . . . . . . . . . . . . . . . . . . . . . . . . . . . . . . . . . . . . . . . . . . . . . . . . . . . . . . . . . . . . . . . . . . . . . . . . . . . . . . . iiiFigures . . . . . . . . . . . . . . . . . . . . . . . . . . . . . . . . . . . . . . . . . . . . . . . . . . . . . . . . . . . . . . . . . . . . . . . . . . . . . . . . . . . . . . . . . . . . . . . . . . . . . . . . . . . viiTables . . . . . . . . . . . . . . . . . . . . . . . . . . . . . . . . . . . . . . . . . . . . . . . . . . . . . . . . . . . . . . . . . . . . . . . . . . . . . . . . . . . . . . . . . . . . . . . . . . . . . . . . . . . . ixSummary . . . . . . . . . . . . . . . . . . . . . . . . . . . . . . . . . . . . . . . . . . . . . . . . . . . . . . . . . . . . . . . . . . . . . . . . . . . . . . . . . . . . . . . . . . . . . . . . . . . . . . . . xiAbbreviations . . . . . . . . . . . . . . . . . . . . . . . . . . . . . . . . . . . . . . . . . . . . . . . . . . . . . . . . . . . . . . . . . . . . . . . . . . . . . . . . . . . . . . . . . . . . . . . . . . xix
CHAPTER ONE
Introduction . . . . . . . . . . . . . . . . . . . . . . . . . . . . . . . . . . . . . . . . . . . . . . . . . . . . . . . . . . . . . . . . . . . . . . . . . . . . . . . . . . . . . . . . . . . . . . . . . . . . . 1A Widespread Pattern: Personnel Instability in Deploying Units . . . . . . . . . . . . . . . . . . . . . . . . . . . . . . . . . . . . . . . . . . 1Coping with Personnel Instability: Contiguous Training . . . . . . . . . . . . . . . . . . . . . . . . . . . . . . . . . . . . . . . . . . . . . . . . . . . 3Issues and Context for This Report . . . . . . . . . . . . . . . . . . . . . . . . . . . . . . . . . . . . . . . . . . . . . . . . . . . . . . . . . . . . . . . . . . . . . . . . . . . . 4
DoD Concern: Leadership Stability . . . . . . . . . . . . . . . . . . . . . . . . . . . . . . . . . . . . . . . . . . . . . . . . . . . . . . . . . . . . . . . . . . . . . . . . . 4Data for Stability Analyses . . . . . . . . . . . . . . . . . . . . . . . . . . . . . . . . . . . . . . . . . . . . . . . . . . . . . . . . . . . . . . . . . . . . . . . . . . . . . . . . . . . . 5Preparing for Deployments in an Uncertain Future . . . . . . . . . . . . . . . . . . . . . . . . . . . . . . . . . . . . . . . . . . . . . . . . . . . . . . . 7
CHAPTER TWO
Stability of Unit Leadership . . . . . . . . . . . . . . . . . . . . . . . . . . . . . . . . . . . . . . . . . . . . . . . . . . . . . . . . . . . . . . . . . . . . . . . . . . . . . . . . . . 9Stability Rates . . . . . . . . . . . . . . . . . . . . . . . . . . . . . . . . . . . . . . . . . . . . . . . . . . . . . . . . . . . . . . . . . . . . . . . . . . . . . . . . . . . . . . . . . . . . . . . . . . . . 9Factors Underlying Instability . . . . . . . . . . . . . . . . . . . . . . . . . . . . . . . . . . . . . . . . . . . . . . . . . . . . . . . . . . . . . . . . . . . . . . . . . . . . . . . . . 11
Initial Cohort: Fill Rates and Vacancies . . . . . . . . . . . . . . . . . . . . . . . . . . . . . . . . . . . . . . . . . . . . . . . . . . . . . . . . . . . . . . . . . . . 11Losses and Gains . . . . . . . . . . . . . . . . . . . . . . . . . . . . . . . . . . . . . . . . . . . . . . . . . . . . . . . . . . . . . . . . . . . . . . . . . . . . . . . . . . . . . . . . . . . . . . 11Nondeployers . . . . . . . . . . . . . . . . . . . . . . . . . . . . . . . . . . . . . . . . . . . . . . . . . . . . . . . . . . . . . . . . . . . . . . . . . . . . . . . . . . . . . . . . . . . . . . . . . . 13
Fill Rates and Vacancies . . . . . . . . . . . . . . . . . . . . . . . . . . . . . . . . . . . . . . . . . . . . . . . . . . . . . . . . . . . . . . . . . . . . . . . . . . . . . . . . . . . . . . . . 15Losses from the Unit . . . . . . . . . . . . . . . . . . . . . . . . . . . . . . . . . . . . . . . . . . . . . . . . . . . . . . . . . . . . . . . . . . . . . . . . . . . . . . . . . . . . . . . . . . . . 15
Loss Rates Are Substantial . . . . . . . . . . . . . . . . . . . . . . . . . . . . . . . . . . . . . . . . . . . . . . . . . . . . . . . . . . . . . . . . . . . . . . . . . . . . . . . . . . . 15Prospects for Reducing Losses . . . . . . . . . . . . . . . . . . . . . . . . . . . . . . . . . . . . . . . . . . . . . . . . . . . . . . . . . . . . . . . . . . . . . . . . . . . . . . . 19
Nondeployers . . . . . . . . . . . . . . . . . . . . . . . . . . . . . . . . . . . . . . . . . . . . . . . . . . . . . . . . . . . . . . . . . . . . . . . . . . . . . . . . . . . . . . . . . . . . . . . . . . . 20Prevalence of Nondeployers . . . . . . . . . . . . . . . . . . . . . . . . . . . . . . . . . . . . . . . . . . . . . . . . . . . . . . . . . . . . . . . . . . . . . . . . . . . . . . . . . 20Reasons for Nondeployment . . . . . . . . . . . . . . . . . . . . . . . . . . . . . . . . . . . . . . . . . . . . . . . . . . . . . . . . . . . . . . . . . . . . . . . . . . . . . . . . 22Potential Changes in Nondeployment Rates . . . . . . . . . . . . . . . . . . . . . . . . . . . . . . . . . . . . . . . . . . . . . . . . . . . . . . . . . . . . . 24
The Personnel Buildup Process for Unit Leaders Before Mobilization . . . . . . . . . . . . . . . . . . . . . . . . . . . . . . . . . . 26Summary: The Overall Picture . . . . . . . . . . . . . . . . . . . . . . . . . . . . . . . . . . . . . . . . . . . . . . . . . . . . . . . . . . . . . . . . . . . . . . . . . . . . . 28
Policy Options Are Limited . . . . . . . . . . . . . . . . . . . . . . . . . . . . . . . . . . . . . . . . . . . . . . . . . . . . . . . . . . . . . . . . . . . . . . . . . . . . . . . . . . . 28Persistence of Instability Over Time . . . . . . . . . . . . . . . . . . . . . . . . . . . . . . . . . . . . . . . . . . . . . . . . . . . . . . . . . . . . . . . . . . . . . . . 28Limited Prospects for Reducing Instability . . . . . . . . . . . . . . . . . . . . . . . . . . . . . . . . . . . . . . . . . . . . . . . . . . . . . . . . . . . . . . . . 29

vi Leadership Stability in Army Reserve Component Units
Uncertain Costs: Limitations on Existing Data . . . . . . . . . . . . . . . . . . . . . . . . . . . . . . . . . . . . . . . . . . . . . . . . . . . . . . . . . . . 29How Could DoD Collect Data to Evaluate Policy Options? . . . . . . . . . . . . . . . . . . . . . . . . . . . . . . . . . . . . . . . . . . . . 31
CHAPTER THREE
Preparing Reserve Component Personnel and Units for Deployment . . . . . . . . . . . . . . . . . . . . . . . . . . . . . . . 33Premobilization Preparation and Training Requirements . . . . . . . . . . . . . . . . . . . . . . . . . . . . . . . . . . . . . . . . . . . . . . . . . . 33Premobilization Training Accomplishment . . . . . . . . . . . . . . . . . . . . . . . . . . . . . . . . . . . . . . . . . . . . . . . . . . . . . . . . . . . . . . . . . 36Premobilization Training Time Investment . . . . . . . . . . . . . . . . . . . . . . . . . . . . . . . . . . . . . . . . . . . . . . . . . . . . . . . . . . . . . . . . . 37Postmobilization Training Time . . . . . . . . . . . . . . . . . . . . . . . . . . . . . . . . . . . . . . . . . . . . . . . . . . . . . . . . . . . . . . . . . . . . . . . . . . . . . 38
Assessing Duration of the Postmobilization Training Period . . . . . . . . . . . . . . . . . . . . . . . . . . . . . . . . . . . . . . . . . . 38Change Over Time in the Duration of Postmobilization Training Period . . . . . . . . . . . . . . . . . . . . . . . . . . . . 39
Summary: What It Takes to Prepare for Deployment . . . . . . . . . . . . . . . . . . . . . . . . . . . . . . . . . . . . . . . . . . . . . . . . . . . . . . 41
CHAPTER FOUR
Readiness for Future Missions . . . . . . . . . . . . . . . . . . . . . . . . . . . . . . . . . . . . . . . . . . . . . . . . . . . . . . . . . . . . . . . . . . . . . . . . . . . . . . 45Allocated to Upcoming Missions . . . . . . . . . . . . . . . . . . . . . . . . . . . . . . . . . . . . . . . . . . . . . . . . . . . . . . . . . . . . . . . . . . . . . . . . . . . . . 45Regionally Aligned Forces . . . . . . . . . . . . . . . . . . . . . . . . . . . . . . . . . . . . . . . . . . . . . . . . . . . . . . . . . . . . . . . . . . . . . . . . . . . . . . . . . . . . 46Homeland Defense and Civil Support . . . . . . . . . . . . . . . . . . . . . . . . . . . . . . . . . . . . . . . . . . . . . . . . . . . . . . . . . . . . . . . . . . . . . . . 47Operational Surge and War Plans . . . . . . . . . . . . . . . . . . . . . . . . . . . . . . . . . . . . . . . . . . . . . . . . . . . . . . . . . . . . . . . . . . . . . . . . . . . . 48
Factors Affecting the Amount of Time Available . . . . . . . . . . . . . . . . . . . . . . . . . . . . . . . . . . . . . . . . . . . . . . . . . . . . . . . . . 49Possible Actions to Mitigate Time Pressure . . . . . . . . . . . . . . . . . . . . . . . . . . . . . . . . . . . . . . . . . . . . . . . . . . . . . . . . . . . . . . . . 51Actions to Mitigate Risk . . . . . . . . . . . . . . . . . . . . . . . . . . . . . . . . . . . . . . . . . . . . . . . . . . . . . . . . . . . . . . . . . . . . . . . . . . . . . . . . . . . . 54
CHAPTER FIVE
Conclusions . . . . . . . . . . . . . . . . . . . . . . . . . . . . . . . . . . . . . . . . . . . . . . . . . . . . . . . . . . . . . . . . . . . . . . . . . . . . . . . . . . . . . . . . . . . . . . . . . . . . . 55Personnel Turbulence: Widespread and Persistent . . . . . . . . . . . . . . . . . . . . . . . . . . . . . . . . . . . . . . . . . . . . . . . . . . . . . . . . . . 55Effects of Turbulence on Preparation and Training . . . . . . . . . . . . . . . . . . . . . . . . . . . . . . . . . . . . . . . . . . . . . . . . . . . . . . . . 56Preparation Time . . . . . . . . . . . . . . . . . . . . . . . . . . . . . . . . . . . . . . . . . . . . . . . . . . . . . . . . . . . . . . . . . . . . . . . . . . . . . . . . . . . . . . . . . . . . . . . . 57
Meeting Future Mission Timelines . . . . . . . . . . . . . . . . . . . . . . . . . . . . . . . . . . . . . . . . . . . . . . . . . . . . . . . . . . . . . . . . . . . . . . . . . 57Mitigating Risk for Short-Notice Missions . . . . . . . . . . . . . . . . . . . . . . . . . . . . . . . . . . . . . . . . . . . . . . . . . . . . . . . . . . . . . . . . 58
APPENDIX
Supplemental Data . . . . . . . . . . . . . . . . . . . . . . . . . . . . . . . . . . . . . . . . . . . . . . . . . . . . . . . . . . . . . . . . . . . . . . . . . . . . . . . . . . . . . . . . . . . . 61
Bibliography . . . . . . . . . . . . . . . . . . . . . . . . . . . . . . . . . . . . . . . . . . . . . . . . . . . . . . . . . . . . . . . . . . . . . . . . . . . . . . . . . . . . . . . . . . . . . . . . . . . . 69

vii
Figures
1.1. Example Buildup of Deploying Personnel in a Unit: Infantry Battalion . . . . . . . . . . . . . . . . . . . . 2 2.1. Stability Rates Among Leaders Who Deployed with the Unit: Officers . . . . . . . . . . . . . . . . . . . . 10 2.2. Stability Rates Among Leaders Who Deployed with the Unit: Noncommissioned
Officers . . . . . . . . . . . . . . . . . . . . . . . . . . . . . . . . . . . . . . . . . . . . . . . . . . . . . . . . . . . . . . . . . . . . . . . . . . . . . . . . . . . . . . . . . . . . . . 10 2.3. Factors Creating Instability: Vacancies, Losses, and Nondeployers, Officers in
USAR MP Companies . . . . . . . . . . . . . . . . . . . . . . . . . . . . . . . . . . . . . . . . . . . . . . . . . . . . . . . . . . . . . . . . . . . . . . . . . . . . 12 2.4. Factors Creating Instability: Vacancies, Losses, and Nondeployers,
Noncommissioned Officers in USAR MP Companies . . . . . . . . . . . . . . . . . . . . . . . . . . . . . . . . . . . . . . . . 12 2.5. Fill Rates at Two Time Points: Officers . . . . . . . . . . . . . . . . . . . . . . . . . . . . . . . . . . . . . . . . . . . . . . . . . . . . . . . . . 14 2.6. Fill Rates at Two Time Points: Noncommissioned Officers . . . . . . . . . . . . . . . . . . . . . . . . . . . . . . . . . . 14 2.7. Personnel Losses During Two Years Before Mobilization: Officers . . . . . . . . . . . . . . . . . . . . . . . . . . 16 2.8. Personnel Losses During Two Years Before Mobilization: Noncommissioned Officers. . . 16 2.9. What Happened to Army National Guard Infantry Battalion Noncommissioned
Officers Who Were in the Unit 12 Months Before Mobilization? . . . . . . . . . . . . . . . . . . . . . . . . . . . 17 2.10. Deployers and Nondeployers in the Unit at Deployment: Officers . . . . . . . . . . . . . . . . . . . . . . . . . . 21 2.11. Deployers and Nondeployers in the Unit at Deployment: Noncommissioned Officers . . . 21 2.12. What Happened to Soldiers Who Did Not Deploy? Noncommissioned Officers in
Army National Guard Infantry Battalions . . . . . . . . . . . . . . . . . . . . . . . . . . . . . . . . . . . . . . . . . . . . . . . . . . . . 23 2.13. Nondeployers as Percentage of Assigned Personnel: Noncommissioned Officers in
Army National Guard Infantry Battalions . . . . . . . . . . . . . . . . . . . . . . . . . . . . . . . . . . . . . . . . . . . . . . . . . . . . . 25 2.14. Personnel Buildup Before Mobilization and Deployment: U.S. Army Reserve
Military Police Company Officers . . . . . . . . . . . . . . . . . . . . . . . . . . . . . . . . . . . . . . . . . . . . . . . . . . . . . . . . . . . . . . 26 2.15. Personnel Buildup Before Mobilization and Deployment: U.S. Army Reserve
Military Police Company Noncommissioned Officers . . . . . . . . . . . . . . . . . . . . . . . . . . . . . . . . . . . . . . . 27 3.1. Typical Company Preparation Plan Example: Military Police Company . . . . . . . . . . . . . . . . . . 35 3.2. Duration of the Postmobilization Period Initially Declined but Held Steady
Thereafter . . . . . . . . . . . . . . . . . . . . . . . . . . . . . . . . . . . . . . . . . . . . . . . . . . . . . . . . . . . . . . . . . . . . . . . . . . . . . . . . . . . . . . . . . . 40 4.1. Key Events in Reserve Component Preparation for a Short-Notice Deployment . . . . . . . . . 50


ix
Tables
1.1. Percentage of Premobilization Training Days in Final Phase . . . . . . . . . . . . . . . . . . . . . . . . . . . . . . . . . 4 1.2. Number of Unit Deployments and Authorizations . . . . . . . . . . . . . . . . . . . . . . . . . . . . . . . . . . . . . . . . . . . . . 6 3.1. Individual Training Accomplishment Before Mobilization . . . . . . . . . . . . . . . . . . . . . . . . . . . . . . . . . 36 3.2. Annual Training Days Spent in the 12-Month Period Before Mobilization . . . . . . . . . . . . . . . 39 3.3. Duration of the Postmobilization Period Before Deployment . . . . . . . . . . . . . . . . . . . . . . . . . . . . . . . 39 3.4. Change Over Time in Duration of Postmobilization Period . . . . . . . . . . . . . . . . . . . . . . . . . . . . . . . . 40 3.5. Observed Times Required for Pre- and Postmobilization Training: Recent
Experience . . . . . . . . . . . . . . . . . . . . . . . . . . . . . . . . . . . . . . . . . . . . . . . . . . . . . . . . . . . . . . . . . . . . . . . . . . . . . . . . . . . . . . . . . . 41 4.1. Potential Missions for Regionally Aligned Brigades . . . . . . . . . . . . . . . . . . . . . . . . . . . . . . . . . . . . . . . . . . 46 A.1. Factors Creating Instability for Army National Guard Infantry Battalions . . . . . . . . . . . . . . . . 61 A.2. Factors Creating Instability for Military Police Companies . . . . . . . . . . . . . . . . . . . . . . . . . . . . . . . . . . 62 A.3. Factors Creating Instability for Transportation Corps Companies . . . . . . . . . . . . . . . . . . . . . . . . . . 63 A.4. Predeployment Buildup of Officers in Unit: Percentage of Authorized . . . . . . . . . . . . . . . . . . . . 64 A.5. Predeployment Buildup of Noncommissioned Officers in Unit: Percentage of
Authorized . . . . . . . . . . . . . . . . . . . . . . . . . . . . . . . . . . . . . . . . . . . . . . . . . . . . . . . . . . . . . . . . . . . . . . . . . . . . . . . . . . . . . . . . . . 65 A.6. End-State Distribution of Unit Losses, 12 Months to Mobilization Day: Officers . . . . . . . 66 A.7. End-State Distribution of Unit Losses, 12 Months to Mobilization Day:
Noncommissioned Officers . . . . . . . . . . . . . . . . . . . . . . . . . . . . . . . . . . . . . . . . . . . . . . . . . . . . . . . . . . . . . . . . . . . . . . . 67 A.8. End-State Distribution of Nondeployers: Officers . . . . . . . . . . . . . . . . . . . . . . . . . . . . . . . . . . . . . . . . . . . . 68 A.9. End-State Distribution of Nondeployers: Noncommissioned Officers . . . . . . . . . . . . . . . . . . . . . 68


xi
Summary
The Issue: Leader Instability in Deploying Units
Personnel stability is highly valued by all military forces, especially in units that are preparing to deploy to a theater of operations. Yet deploying units typically experience personnel instabil-ity (often described as “turbulence”): the departure of some unit members and their replace-ment by others who enter the unit to reach its target for deploying strength. This inflow of personnel undercuts the effectiveness of training, consumes resources and time, and impedes training of higher echelons or more-difficult tasks that require simpler skills as a foundation.
Previous RAND research (Lippiatt and Polich, 2010) documented this personnel insta-bility and showed that it was widespread in many types of units—Active Component (AC) and Reserve Component (RC)—as they prepared for deployment. It also suggested that insta-bility would be difficult to control because it arose from numerous discrete causes and that the U.S. Department of Defense (DoD) would have to live with considerable personnel turbulence in the future.
That result posed a series of issues for DoD. An important concern was the ability of unit leadership to cope with personnel turbulence. Commanders would prefer to have the leaders (officers and noncommissioned officers [NCOs]) in place before the point at which new arriv-als enter the unit in large numbers. However, preliminary analysis suggested substantial per-sonnel turbulence even among the leadership.
Given this uncertainty and its potential implications, senior DoD officials asked RAND to conduct a study to nail down the actual level of turbulence among unit leadership and, if the rates were high, to address several follow-on questions: What causes leader turbulence? What effects might it have on unit training and preparation? And what steps, if any, could be taken to mitigate it?
A further issue concerns the implications of personnel turbulence for future defense plan-ning. Official planning assumptions envision a shift away from rotational deployments involv-ing large-scale stability and counterinsurgency operations. That would mean a less predictable environment with a smaller demand for RC units and a different set of missions for those that are in demand. However, with uncertainty also comes the possibility that some RC units might be needed on short notice. That prospect raises two questions: How much time may future scenarios allow for RC units to prepare? And how would personnel turbulence affect the preparation process if the timelines are pressing?
xii Leadership Stability in Army Reserve Component Units
Data Sources
To address these issues, we expanded a database that had previously been accumulated through collaboration of RAND and the Defense Manpower Data Center. The database included monthly individual records for all personnel who were in any Army component during the period from 2003 through 2011. It represented soldiers’ military characteristics and history, dates of activation and deployment, and monthly pay records for each individual. The file permitted longitudinal analysis of individuals and units, during “normal operations” and the run-up to mobilization and deployment.
The analysis included deployments of units in the Army National Guard (ARNG) and U.S. Army Reserve (USAR), provided they had deployed essentially as “full units” during the period from 2007 through 2010. It focused on three types of units:
• Infantry battalions within separate brigades (ARNG) • Military Police companies, “combat support” type (ARNG and USAR) • Truck companies, “medium cargo” type (ARNG and USAR).
Key Findings: High Rates of Personnel Instability
The data show that RC units approaching mobilization experienced high levels of personnel instability among both the unit leadership and the more junior members. As a broad measure of instability, we calculated the fraction of leaders in the deploying unit who were “new arriv-als” (those who had less than 12 months in the unit at the time of mobilization). By that mea-sure, on average,
• approximately 50 percent of officers were new arrivals• approximately 40 percent of NCOs were new arrivals.1
These results are in parallel with previous analyses of the entire membership (Lippiatt and Polich, 2010). The same patterns are evident in active units, but they have their members avail-able full time and can therefore recover more quickly than part-time RC soldiers. Nevertheless, RC forces proved resilient; their units achieved a stable cohort of personnel by the mobilization point, and no units missed their planned arrival dates in theater.
Factors Generating Instability
Personnel instability arises from several different factors: vacancies, personnel losses, and per-sonnel who remain in the unit but do not deploy.
Vacancies
Many units were filled to less than 100 percent, leaving some vacancies to be filled before deployment. However, vacancies were not the primary driver of instability. At 12 months
1 The averages listed here include four of the five unit types studied. In this calculation, we exclude USAR truck compa-nies, which had especially high rates of instability.

Summary xiii
before mobilization, NCO fill in most units was above 90 percent, and officer fill was above 80 percent. Those vacancies were filled by new personnel who were “cross-leveled” into the unit, creating some turbulence. However, for most types of units, the effect of vacancies was far less than the effect of personnel losses and nondeployers.
Personnel Losses
The typical unit lost 30 to 50 percent of its officers and 25 percent of its NCOs during the 12-month period before mobilization.2 These loss rates are not unusual; they are similar to loss rates in preceding years. So it did not appear that unit leaders were leaving the units in anticipation of the approaching mobilization. Nor were those losses necessarily bad for the service. Many of the losses were departures from the unit but not from the Army. In fact, a majority of leaders who left a unit transferred to another unit within the same component, and many of those deployed with their new units.
Nondeployers
The third factor was the presence of personnel who remained in the unit but did not deploy. In the typical unit, about 30 percent of officers and 20 percent of NCOs who were in the unit at deployment (D-day) did not deploy. We traced the disposition of these nondeployers and found that many different conditions contributed to their status. Some deployed later to join the unit in theater. Some were activated but remained behind at home; we inferred that they may have been part of a rear detachment. Among those who were not activated, a sizable number had previously been activated and were probably exempted from reactivation under rules in effect at the time. Finally, some who were not activated moved to a new unit (about half of whom later deployed), and some left the service altogether.
The overall picture for nondeployers—and for losses—reveals a multiplicity of causes and conditions. Moreover, each condition accounts for only a small part of the overall insta-bility rate. Some conditions are probably not things the Army would want to prevent (such as moving to a new unit and deploying with that unit). Some cases probably represent an Army accommodation to a soldier’s preferences or personal hardship; the Army may have preferred to defer a member’s deployment or permit movement to another unit rather than risk losing the person altogether.
Effects of Instability
The immediate effect of the above phenomena was to create a large influx of new leaders enter-ing the unit. Indeed, we observed a steep buildup curve of eventual deployers entering the unit, beginning about six months before mobilization. For example, about 40 percent of infantry officers and 35 percent of infantry NCOs who deployed had arrived during the six months before mobilization.
The arrival of these newcomers had two ramifications. First, many of the new leaders had missed training events that had been executed before they joined the unit. As a result, they had to undergo that training if it had not already been done in their previously assigned units.
2 The range represents variation in median loss rates across different types of units.
xiv Leadership Stability in Army Reserve Component Units
Furthermore, they had not been able to supervise or train with their subordinates during much of the premobilization (premob) year, causing a lack of continuity in the units’ leadership.3
Second, to counter the effects of personnel turnover, most units scheduled “contiguous” training just before mobilization. For example, in earlier research (Reserve Affairs, 2010), we saw that the typical unit conducted half of its Annual Training (AT) days during the mobiliza-tion month or the month immediately preceding mobilization. Units thereby avoided deleteri-ous effects of personnel turnover and learning decay, and they ensured that unit members had met prescribed standards for some key training events (e.g., weapons qualification within six months of deployment).
What are the prospects for DoD actions to counter leader instability? We conclude that DoD has limited options to adapt and that it may, in fact, need to live with instability. For one thing, instability is persistent, not only in the RCs but also in the active forces. Loss rates, for example, were virtually the same in previous years as in the premob year. Furthermore, many different conditions contribute to the picture, and most would be difficult to affect by policy. Even if policy interventions were successful, they would reduce turbulence by only a few per-centage points.
Finally, there is little information to assess the potential effectiveness and cost of pos-sible policy initiatives. The customary approach would be to offer bonuses to keep people in the unit. Past evaluations have shown that bonuses have been effective in other circumstances for other purposes—for example, for retaining active personnel in the service. But we found no evidence on how much bonuses would increase retention of RC leaders in the unit or how much it would cost to achieve a desired effect.
Implications for Future Missions
Do these findings suggest potential difficulties in mobilizing and deploying RC units in the future, in light of the changing security environment and defense strategy? The answer depends on the amount of time it takes units to prepare for deployment, compared with the amount of time that would be available under potential scenarios that could demand RC forces.
What It Takes to Prepare Units for Deployment
We estimated the amount of time required to prepare units for deployment based on recent experience—the most extensive body of empirical data on RC mobilizations in the past 50 years. That experience shows, first, that units approaching mobilization face many detailed training requirements, articulated by the Army and the combatant commanders who supervise operations in overseas theaters.
Almost all of units’ available premob time was focused on completing individual train-ing and soldier readiness tasks. The list of tasks was extensive. In addition to personnel readi-ness actions (e.g., family plans, financial arrangements, wills, schooling, medical and dental exams), individuals had to receive some 30 briefings, training on 32 Army Warrior Training tasks, 12 battle drills, and other things. To perform those tasks, typical units used their week-
3 However, that did not mean that the unit was short of leaders to oversee premob training. A mitigating factor was the presence of many nondeploying leaders who had long tenure in the unit. Those leaders were available to plan and manage training even though they did not deploy.
Summary xv
end drill time plus about 35 AT days during the premob year. Those 35 AT days represent an increment of 20 days beyond the normal 15-day AT conducted by a unit that is not preparing for deployment.
During the premob period, units accomplished quite a lot of individual training and preparation: Seventy to 80 percent of soldiers in the typical unit had completed all of the pre-scribed tasks.4 However, that left 20 to 30 percent of personnel who still needed some individ-ual training after mobilization. In addition, units needed to accomplish their collective train-ing and much of their theater-specific training during the postmobilization (postmob) period. As a result, the postmob training period for a typical brigade combat team (BCT) included 74 elapsed days, from mobilization until arrival in theater. For companies, the postmob period typically took 50 to 60 days.
What does this say about the amount of time that a typical unit would need, if alerted for an operation in the future? We calculated the potential time required, assuming that a unit were called during its one-year period in the Army Force Generation (ARFORGEN) avail-ability window. Under ARFORGEN, the unit would already have executed its normal 15-day AT within approximately the past year. So if the unit required the same amount of prepara-tion as observed in recent operations, it would still need the equivalent of the additional 20 AT days plus postmob time. That would imply these amounts of time from alert to availability in theater:
• 94 days for a BCT• 70 to 80 days for a company.
These estimates are derived from a particular era and set of circumstances, so it could be argued that they might not apply to future mobilizations. Nevertheless, they are based on real experience and, in our view, offer the best empirically based information on what has actually been possible in the past. Therefore, we used them as a guide to judge whether various potential future situations would allow sufficient time to prepare RC units for deployment.
Time Urgency of Future Missions
How much time will foreseeable future missions allow for RC units to prepare? We reviewed four types of missions considered in current defense planning and made these observations about them.
Allocated for Definite Missions
If a unit is designated for a definite upcoming operation (usually an ongoing rotation, such as Kosovo or Multinational Force and Observers), it will be notified well in advance. The normal planning process allows one year. So units could prepare along the same lines as recent prac-tice, and they would have ample time.
4 It is not surprising that units were unable to complete 100 percent of their training, given the limitations often present in the premob environment. For example, units may not have access to specialized personal equipment, weapons, or vehicles in use in the theater. Not all personnel are able to attend AT, where much field training is done. And personnel turnover brings new soldiers into the unit with attendant training demands.

xvi Leadership Stability in Army Reserve Component Units
Regionally Aligned Forces
Some units will be oriented to specific regions, typically for security cooperation and engage-ment missions, such as training and advising, security force assistance, or exercises. Those relatively benign missions will be planned well in advance, and RC units would have time to prepare. In the event that unplanned missions arise, particularly if they involve the potential for confronting organized opposition, active units or special forces would go first, and RC units would probably go only as follow-on or rotational forces—allowing enough time for preparation.
Homeland Defense and Civil Support
Some units will be designated for specialized activities in the United States, such as response after a disaster or attack or to support civil authorities in an emergency. Many ongoing civil support missions, such as border security or counterdrug operations, are planned in advance and allow time for preparation. Even many unplanned missions, such as response to natural disasters, require functions that are already well within a unit’s normal mission essential task list (such as transportation or traffic control) or do not require specialized skills. The primary exception is in response to chemical, biological, radiological, or nuclear (CBRN) incidents, for which various specialized elements are being organized. CBRN-oriented units are likely to receive specialized training and be dedicated to those missions for a designated period of time; therefore, they could be ready to perform those functions on short notice.
Apportioned to War Plans and Contingency Plans
These units are designated to support detailed plans that call for rapid deployment of forces in a crisis or conflict. Because of the potential for short notice, such missions could pose the greatest challenge for timely RC mobilization and deployment.
Many factors would affect whether or not RC units would need to deploy quickly in a crisis. For example, the situation might or might not afford advance warning. If advance warn-ing is available, DoD might take steps to notify RC units of a potential deployment and to marshal resources, such as equipment, ranges, supplies, and trainers. Even if early warning is not received or recognized, RC units could have more time because they may appear late in the force flow, particularly if AC units go earlier or the flow is limited by transportation con-straints. For units that were apportioned to a war plan, previous AT should have focused train-ing on the theater mission, giving them a “leg up” on satisfying specific requirements.
These conditions could plausibly allow an RC unit two to three months to prepare before it must deploy. However, what if some of those conditions are absent—and therefore the unit has less time? What could DoD do to mitigate the potential risk to the deployment timeline? The conventional response would be to increase the amount of premob training to shorten the postmob period. Under the Army’s ARFORGEN program, that would mean conducting more premob training (beyond Inactive Duty Training and a normal 15-day AT) during the avail-able year and the year preceding it.
Such a plan, however, has some disadvantages. DoD would be investing in additional training time and resources as a hedge against a possible requirement that cannot be predicted. The investment would involve not only unit members’ AT time but also full-time support, trainers, supplies, and other resources. The payoff would also be limited to a fraction of the unit’s membership because of the problems of AT attendance, personnel turnover, and nonde-ployers. We estimated that the combination of those three factors would mean that only about

Summary xvii
50 percent of deployers in the unit would actually benefit from additional premob AT.5 The longer the lag between the AT and mobilization, the smaller that number would be.
Therefore, we conclude that routinely adding AT time in preparation for availability would not be a full solution. All of the new unit members would need to get the training that had been done during the preceding AT. The need to repeat that training could slow the prepa-ration process and dilute any advantages that the additional AT had conferred. More gener-ally, these considerations cast doubt on the feasibility of stretching out premob training and attempting to build unit readiness sequentially over several years. Capabilities that are built up in earlier years are likely to be eroded over time by AT absences, turnover, and nondeployment.
We recognize that this situation may pose a risk that DoD would find unacceptable, at least for some units that may be needed early in an operation. Therefore, we recommend three steps to measure and mitigate any such risk, if DoD decides to consider investing in additional premob training. First, analysis should determine which types of units would be seriously affected by short notice—those whose timelines could be at risk. There may be few such units, and they may be small, which would minimize the needed investment.
Second, if the risks appear significant, DoD could supplement the number of AT days in selected units during the availability year and the preavailability year of the ARFORGEN cycle.6 Those AT days would provide enhanced training experience to some unit members, although they may be a minority of the deploying unit.
Third, DoD should consider offering leaders and key members bonuses to attend AT and remain in the unit during the preavailability and availability years. As part of any bonus program, DoD should undertake a controlled experiment, offering varying bonus programs to matched, like-type units that are assigned to varying bonus levels (including no bonus, as a control group). Such experimentation would provide valuable data to reveal the true cost and benefits of a bonus program and thereby help assess the utility of premob training.
5 The estimate assumes that 80 percent of the unit’s membership attends AT, 75 percent remain in the unit after one year, and 75 percent of members deploy with the unit. Those assumptions are consistent with the foregoing analysis and historical data.6 If the risks appear severe, DoD could alternatively move some early-deploying units from the RC to AC, but that would involve force structure changes that we have not attempted to analyze in this monograph.


xix
Abbreviations
AC Active Component
ARFORGEN Army Force Generation
ARNG Army National Guard
AT Annual Training
BCT brigade combat team
CBRN chemical, biological, radiological, or nuclear
CLS combat lifesaver
COCOM Combatant Command
CSWQ crew-served weapons qualification
D-day deployment
DMDC Defense Manpower Data Center
DMOSQ duty military occupational specialty qualification
DoD U.S. Department of Defense
FORSCOM U.S. Army Forces Command
IDT Inactive Duty Training
IED improvised explosive device
IN2 Army National Guard infantry battalion
IWQ individual weapons qualification
LAD latest arrival date
M-day mobilization day
MFO Multinational Force and Observers
MP Military Police
MP2 Army National Guard Military Police company

xx Leadership Stability in Army Reserve Component Units
MP3 U.S. Army Reserve Military Police company
MUTA Multiple Unit Training Assembly
NCO noncommissioned officer
NCOES Noncommissioned Officer Education System
OCIE Organizational Clothing and Individual Equipment
OEF Operation Enduring Freedom
OES Officer Education System
OIF Operation Iraqi Freedom
OSD Office of the Secretary of Defense
postmob postmobilization
premob premobilization
RAF regionally aligned force
RC Reserve Component
RTC Reserve Training Center
SRP Soldier Readiness Program
TC Transportation Corps
TC2 Army National Guard Transportation Corps company
TC3 U.S. Army Reserve Transportation Corps company
TDA Table of Distribution and Allowances
TOE Table of Organization and Equipment
TPFDD time-phased force and deployment data
TSIT theater-specific individual training
TSLT theater-specific leader training
UIC unit identification code
USAR U.S. Army Reserve
WMD weapons of mass destruction

1
CHAPTER ONE
Introduction
A Widespread Pattern: Personnel Instability in Deploying Units
Personnel stability is highly valued by all military forces, especially in combat units and other formations that deploy to a theater of operations. The Army in particular aims to maximize unit personnel stability—the degree to which a unit’s membership remains constant over time (White, 2002). Stability is viewed as particularly important as a unit prepares to go to war.
Yet deploying Reserve Component (RC) units typically experience a surge of person-nel instability (often described as “turbulence”)—the departure of some unit members and their replacement by others who are cross-leveled into the unit to reach its target for deploying strength.1 This inflow of personnel undercuts the effectiveness of training because new arriv-als miss training events that have occurred before they join. Training thus consumes more resources and time. In addition, the resulting inefficiency may impede training of successively higher echelons (even teams or crews), or it may prevent training on more-difficult tasks that require simpler skills as a foundation.2 Because the unit is under considerable time pressure, leaders have to scramble with a high workload and adopt “work-around” strategies to complete all the training and soldier preparation for deployment. Moreover, the need to borrow person-nel from other units disrupts their training, degrades their readiness, and generates “churn” that affects the donor units later, when they must mobilize. This potential for personnel turbu-lence to interfere with training—especially when a unit is preparing to go to war—is widely perceived as a problem, particularly among commanders and defense officials.
Previous RAND research (Lippiatt and Polich, 2010) documented levels of personnel instability and showed that it was widespread in many types of units—Active Component (AC) and RC—as they prepared for deployment. Considering the aggregate of all personnel in the unit, that research found that 30 to 50 percent of deploying personnel had been in the unit less than one year before the unit deployed to theater. The turbulence arose from many causes, which were grouped into three major categories: personnel losses from the unit before mobilization, personnel who remained in the unit but did not deploy, and vacancies that had to be filled by new soldiers to bring the unit up to its desired strength.
1 Several different synonyms are commonly used to refer to this phenomenon: instability, turbulence, and turnover. For our purposes, we use the terms interchangeably. Each refers to the degree to which a unit’s membership remains the same over time. In a stable unit, turnover rates will be low, and many members will have long tenures in the unit. In less stable units, turnover will be higher and members’ tenures will be shorter.2 Some authors assume that stability also contributes to unit cohesion and performance, but the relationships among these factors are uncertain, and the evidence is ambiguous at best (Winkler, 2008). Our interest here focuses on unit training rather than cohesion.

2 Leadership Stability in Army Reserve Component Units
The result of action to compensate for turbulence is portrayed in Figure 1.1. It displays a steep buildup curve of deployers during last few months before mobilization. The buildup began in earnest about eight months before deployment, which was about 5.5 months before mobilization. After that point (D – 8, or deployment minus eight months), many new arrivals flowed into the unit, including many who would eventually deploy with the unit. Almost all of the deploying personnel were in the unit by the mobilization point (M-day).
However, the rapid influx of new personnel came with a drawback for premob training. Brigade plans for this period included many key training events that were spaced out over the year before deployment. For example, as listed in the lower left corner of the figure, most units scheduled weapons qualification and training in combat lifesaver (CLS) procedures, urban warfare methods, countering improvised explosive devices (IEDs), ambush prevention, and force protection. Soldiers who entered the unit just before mobilization missed some of these events. How widespread was this? The blue arrows at the upper left illustrate it. For example, at D – 10, 42 percent of the eventual deployers had not yet joined the unit. Even at D – 7, 30 percent had not yet joined.
This situation naturally posed challenges for unit preparation and imposed some inef-ficiencies on training. It meant that units had to reexecute some training events for the later-arriving new personnel and to defer some elements of training until after mobilization, when almost all unit members were present and available full time. However, despite these problems, it is important to note that the system proved resilient. Units were generally quite stable after mobilization, all of the required training was accomplished, and all units met the deadline for their latest arrival date (LAD) in theater.
Figure 1.1Example Buildup of Deploying Personnel in a Unit: Infantry Battalion
NOTE: Premob = premobilization. This result is adapted from Lippiatt and Polich (2010, p. 40). The personnelbuildup curve represents average values for infantry units that deployed over a period of several years before2010. The training events depicted in blue were derived from infantry brigade training programs as briefed topredeployment planning conferences during that same period.RAND MG1251-1.1
Months before deployment
Perc
enta
ge
of
dep
loye
rs in
un
it
100
90
80
70
60
50
40
30
20
10
056789101112 4 3 2 1 0
Premob period includes many key training events:• weapons qualification• CLS• urban warfare methods• IEDs• ambush prevention and force protection
but new arrivals miss some of these
M-d
ay
42% of deployers missing
30% of deployers missing
Introduction 3
Figure 1.1 also reflects the planning time horizon for mobilizing units. In the very ear-liest phase of the Iraq operation, some units had only a few months advance notice about their upcoming mobilization. However, during the period from 2003 through 2012, the Army strove to identify units for deployment about one year in advance. Even before that one-year period, unit commanders were likely to be advised that their units were under consideration for the mission. After it was formally notified, First Army organized a joint assessment confer-ence involving the unit’s leadership, higher headquarters, First Army experts, and others who would need to coordinate and supply resources to support the unit’s preparation and mobiliza-tion. Those conferences generally were scheduled 270 to 360 days before the mobilization day (M-day). So units had considerable advance warning and time to prepare, a fact that is reflected in the buildup of personnel that typically began about eight months before deployment.
Coping with Personnel Instability: Contiguous Training
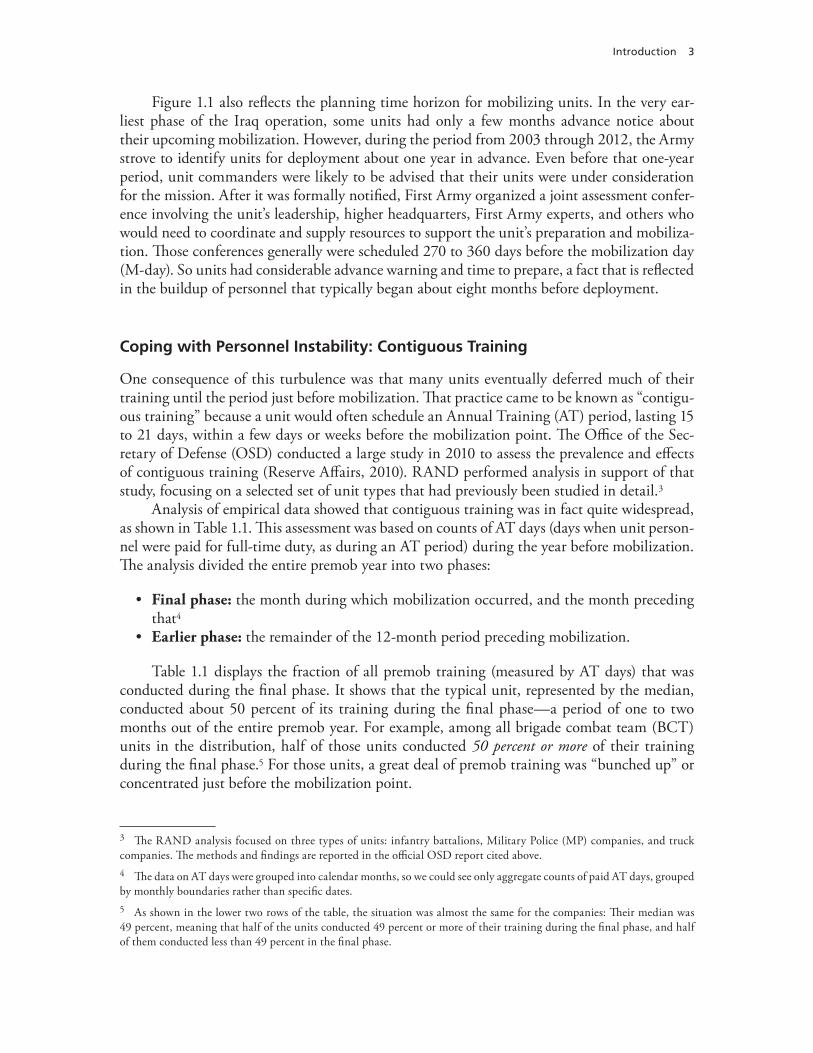
One consequence of this turbulence was that many units eventually deferred much of their training until the period just before mobilization. That practice came to be known as “contigu-ous training” because a unit would often schedule an Annual Training (AT) period, lasting 15 to 21 days, within a few days or weeks before the mobilization point. The Office of the Sec-retary of Defense (OSD) conducted a large study in 2010 to assess the prevalence and effects of contiguous training (Reserve Affairs, 2010). RAND performed analysis in support of that study, focusing on a selected set of unit types that had previously been studied in detail.3
Analysis of empirical data showed that contiguous training was in fact quite widespread, as shown in Table 1.1. This assessment was based on counts of AT days (days when unit person-nel were paid for full-time duty, as during an AT period) during the year before mobilization. The analysis divided the entire premob year into two phases:
• Final phase: the month during which mobilization occurred, and the month preceding that4
• Earlier phase: the remainder of the 12-month period preceding mobilization.
Table 1.1 displays the fraction of all premob training (measured by AT days) that was conducted during the final phase. It shows that the typical unit, represented by the median, conducted about 50 percent of its training during the final phase—a period of one to two months out of the entire premob year. For example, among all brigade combat team (BCT) units in the distribution, half of those units conducted 50 percent or more of their training during the final phase.5 For those units, a great deal of premob training was “bunched up” or concentrated just before the mobilization point.
3 The RAND analysis focused on three types of units: infantry battalions, Military Police (MP) companies, and truck companies. The methods and findings are reported in the official OSD report cited above.4 The data on AT days were grouped into calendar months, so we could see only aggregate counts of paid AT days, grouped by monthly boundaries rather than specific dates.5 As shown in the lower two rows of the table, the situation was almost the same for the companies: Their median was 49 percent, meaning that half of the units conducted 49 percent or more of their training during the final phase, and half of them conducted less than 49 percent in the final phase.

4 Leadership Stability in Army Reserve Component Units
Even the units at the lower end of the distribution conducted a large portion of their training in the period just before mobilization. For example, among BCT units, the first quartile (25th percentile) fell at 32 percent. That means that one-fourth of all units con-ducted 32 percent of their training in the final phase; the remaining units conducted more than 32 percent in the final phase.
So even those units with less training near the mobilization point still performed about one-third of their training in the final phase. From these data and discussions with unit offi-cials and mobilizing authorities, we concluded that unit commanders deliberately pushed their training programs toward late in the premob period because they knew that personnel turbu-lence would undercut any training done earlier.
Issues and Context for This Report
DoD Concern: Leadership Stability
One conclusion of RAND’s previous research on stability was that it would be very difficult to make large reductions in RC personnel turbulence. In effect, the Army will have to live with turbulence and in particular with the influx of large numbers of new personnel who are cross-leveled into the unit during the last few months before mobilization.
That result posed a series of issues for the U.S. Department of Defense (DoD). An impor-tant concern was the ability of unit leadership to cope with personnel turbulence. Command-ers would prefer to have the leaders (officers and noncommissioned officers [NCOs]) in place before the point when new arrivals enter the unit in large numbers. In fact, some might expect that the unit leadership might be more stable than the total unit membership. For example, the leaders have longer tenure in the service and might be more attached to a particular unit.
However, preliminary analysis suggested that personnel turbulence might be substantial even among the leadership. Given this uncertainty and its potential implications, senior DoD officials asked RAND to conduct a study to nail down the actual level of turbulence among unit leadership and, if the rates were high, to address several follow-on questions: What factors drive leader turbulence? What effects might it have on unit training and preparation? And, what steps, if any, could be taken to mitigate it?
Table 1.1Percentage of Premobilization Training Days in Final Phase
Unit Type Median 25th Percentile 75th Percentile
BCT unit 50 32 62
ARNG company 49 39 65
USAR company 49 41 65
NOTE: ARNG = Army National Guard. USAR = U.S. Army Reserve. Entries represent the percentage of all premob training (paid days during the 12 months before mobilization) that was conducted during the final phase. Final phase includes the month of mobilization and the preceding month. For example, if a unit mobilized on December 15, the final phase would include November 1–30 and December 1–15.

Introduction 5
Data for Stability Analyses
To address these issues, we expanded a database that had previously been accumulated through collaboration of RAND and the Defense Manpower Data Center (DMDC). The database included monthly individual records for all personnel who were in any Army component during the period from 2003 through 2011. As described in our previous report (Lippiatt and Polich, 2010), this database drew on four sources:
• Individual personnel history: grade, occupational specialty, entry date, initial military training, unit assignment, and other characteristics from DMDC’s Work Experience File
• Activation and deployment: month of activation and return from active duty and month of deployment to theater and redeployment to the United States, from DMDC’s Defense Mobilization and Deployment database
• Pay: records of actual pay, allowances, bonuses, and other monetary compensation (including hostile-fire pay), from the defense Reserve and Active Duty Pay Files
• Authorizations: Army Master Force files describing unit organization and structure.
The resulting merged file permitted longitudinal analysis of individuals and units, during “normal operations” and the run-up to mobilization and deployment. It revealed important time-phased events, such as reservists going on active duty and deployment of individuals, whole units, or large parts of units. It also allowed us to see initial deployments of small num-bers, followed by deployments of larger groups of troops and eventual redeployment of indi-viduals back to the United States. Finally, it permitted us to examine cohorts of individuals, such as people who were assigned to the unit one year before mobilization, and to track them over time to determine whether they remained in the unit until deployment and whether each particular individual actually deployed with the unit (or, in some instances, with another unit).
The analysis included data from ARNG and the USAR for these three classes of units:6
• Infantry battalions within separate brigades (ARNG) • MP companies, “combat support” type (ARNG and USAR) • Truck companies, “medium cargo” type (ARNG and USAR).
Within these types of units, we obtained data on all deploying units, provided they met the following criteria:
• deployed between January 2003 and December 20107 • deployed essentially as a “full unit”: for companies, the criterion was that deployed
strength represented at least 75 percent of the unit’s authorized positions (on average, they deployed at 85 percent). For infantry battalions, the criterion was that the requested element called for more than 90 percent of the battalion’s authorized strength. The latter condition was imposed to ensure that we focused on battalions that actually deployed as such, rather than including various partial units whose character would be different.
6 Each class of units is defined by one or more specific Standard Requirements Codes, which can be linked to the unit’s required personnel, equipment, and other assets. 7 Our period of observation continued until the latter part of 2011, but we used an earlier cutoff date that allowed us to track the behavior of individuals for at least six months after deployment.

6 Leadership Stability in Army Reserve Component Units
Table 1.2 shows the designations and authorizations for leadership positions in these units, from the Army’s Master Force files. The three classes of units span various types of Army units, including the three main categories of operational units: combat, combat sup-port, and combat service support. They cover many of the units that deployed frequently and essentially as whole units. In addition, they cover a large number of people: Together, this set of units included more than 10,000 officers and NCOs.
Table 1.2 also shows abbreviations we occasionally use as shorthand for the five types of reserve units. In Army data systems, ARNG is designated as component 2 and the USAR as component 3. Accordingly, we designate ARNG infantry battalions as IN2, ARNG MP companies as MP2, USAR MP companies as MP3, and so forth as shown in the table. Each of these units was defined by a four-character unit identification code that refers to a specific battalion or company. Chapter Two reports detailed analysis of personnel turbulence and its antecedents in these units.
This focus on specific kinds of units may raise a question: Is this subset of unit types rep-resentative of a larger “universe” of Army units that deployed? Here the relevant universe is the set of units that were called to deploy essentially as “whole units.” In previous analysis (Lippiatt and Polich, 2010, p. 11), we found that the three branches considered here (infantry, MP, and truck) accounted for a large proportion of all units that deployed at 75 percent of authorized level or higher. Only a small number of other unit types had an appreciable number of quali-fying units, and their unit counts were much smaller. So we concluded that the infantry, MP, and truck units account for the bulk of units in the universe to which we wish to generalize.8
Beyond the systematic data just discussed, we also gained insights into mobilization and deployment processes through contacts with numerous defense officials during this study and previous studies. For example, we discussed mobilization practices with officials in OSD, the Department of the Army, ARNG, the USAR, and First Army. We also attended several joint assessment conferences arranged by First Army, during which unit commanders and mobiliza-tion officials developed plans for predeployment training and preparation of mobilizing units. At these conferences, we were able to discuss mobilization challenges and processes directly
8 In addition, these three types of units cover the three major categories of units that the Army recognizes: combat (in this case, infantry); combat support (MP); and combat service support (trucks).
Table 1.2Number of Unit Deployments and Authorizations
Unit Type Abbreviation Unit DeploymentsNumber of NCOs and Officers (authorized)
ARNG MP company MP2 59 1,833
USAR MP company MP3 23 711
ARNG TC company TC2 52 1,741
USAR TC company TC3 51 1,649
ARNG infantry battaliona IN2 35 4,945
Total 220 10,879
NOTE: TC = Transportation Corps.a Infantry battalions with deployment requirement more than 90% of authorized.

Introduction 7
with unit personnel. Information from these discussions provided perspectives that helped to interpret results derived from the systematic data (for example, reasons for unit personnel losses despite the unit’s impending mobilization).
Preparing for Deployments in an Uncertain Future
All of our empirical data are drawn from the period of operations in Afghanistan and Iraq, when RC units were being frequently mobilized and deployed.9 This was a unique period in history, providing an opportunity to observe actual mobilization experience and to collect empirical data on the mobilization process. It is the richest set of observations that it has been possible to collect on reserve force utilization over the past 50 years.
However, when we reflect on the implications of these data for future defense planning, we will also need to consider how the environment for military operations is likely to change. Chapters Three and Four of this monograph apply our empirical data on RC deployment pro-cesses to the range of potential missions that may call for reserve forces in the future.
Official planning assumptions indicate that the recent era of rotational deployments, with its predictable and well-defined operational requirements, is coming to an end (DoD, 2012). In particular, current planning envisions a shift away from sustained, large-scale stability and counterinsurgency operations. This is likely to mean a much smaller demand for RC units and a different set of missions for those that are in demand.10
Some missions that are likely to continue may call for rotating a modest number of RC units, such as deployments to long-standing operations, such as Multinational Force and Observers (MFO), Kosovo, and Kuwait. Other units will be apportioned to a potential opera-tional or wartime surge, others will have a regional focus, and still others may have less clarity about the locale or operational environment with which they would deal. In many cases, it may be difficult to forecast the time they may have available to prepare.
We will see later in this monograph that a key issue is the time available to prepare. Chap-ter Three reports our empirically derived observations on the time that was required to prepare units for recent missions—both premob training and postmobilization (postmob) preparation before deployment. Chapter Four then employs those observations to draw inferences about the speed with which RC units can be made available for future missions. We outline some missions for which it seems likely that RC units would have ample advance notice. For other missions, however, advance warning could be short, and we show how personnel turbulence may complicate prompt preparation of units in such a scenario.
9 We frequently refer to this period using the abbreviations for the two operations’ names: Operation Enduring Freedom (OEF) and Operation Iraqi Freedom (OIF).10 As of this writing, Army and defense officials were planning a nearly complete withdrawal from Afghanistan by the end of 2014 (Garamone, 2012).


9
CHAPTER TWO
Stability of Unit Leadership
We now turn to analysis of our empirical data on stability and turbulence among RC unit lead-ership. In this chapter, we review overall rates of stability, the factors that generate instability, how those factors operate, and the prospects for policy actions to affect them.
Stability Rates
Personnel stability means having a set of soldiers who have been assigned to the unit for a considerable period of time. Particularly when a unit is preparing for an expected deploy-ment, it would be advantageous to have stability among the unit leadership over the period when crucial training occurs. Our review of premob training plans showed that training and preparation events are often scheduled over a period of ten to 12 months before mobilization. Therefore, we examined the extent to which deploying units had a stable leadership in place during that 12-month period.
The data show substantial rates of instability among the leadership, similar to rates among the aggregate of all unit members. To measure stability versus instability, we calculated leaders’ length of tenure in the unit. Figures 2.1 and 2.2 summarize the results across all five classes of units that we examined. In these figures, all unit leaders are classified as either “short tenure” or “long tenure”:
• “Short tenure” (shown in gray) indicates leadership instability. It means the leader had been assigned to the unit for less than 12 months at the time of mobilization.
• “Long tenure” (shown in blue) indicates stability. It means the leader had been assigned to the unit for 12 months or more at the time of mobilization.
Quite a large number of officers had short tenure according to this definition. For exam-ple, 47 percent of all officers who deployed with ARNG MP companies and infantry battal-ions had been in the unit less than 12 months. In effect, those officers—nearly half of all those who deployed—were “new arrivals” during the past year. That reflects considerable instability among the unit leadership.
Moreover, as Figures 2.1 and 2.2 show, that was the lowest rate of instability among the five classes of units. Among the other unit types, the fraction of officers who had short tenure ranged from 62 to 79 percent. The 79-percent figure for USAR truck companies is an outlier, representing special conditions within those companies. However, instability rates are high

10 Leadership Stability in Army Reserve Component Units
Figure 2.1Stability Rates Among Leaders Who Deployed with the Unit: Officers
NOTE: Officers assigned to a unit for less than 12 months at M-day are considered short tenure. Others are considered long tenure. RAND MG1251-2.1
USAR TCcompanies
ARNG TCcompanies
USAR MPcompanies
ARNG MPcompanies
ARNG infantrybattalions
100
80
60
40
20
0
Perc
enta
ge
of
dep
loye
rs
Unit type
47
53
65
35
62
38
79
21
47
53
Short tenure Long tenure
Figure 2.2Stability Rates Among Leaders Who Deployed with the Unit: Noncommissioned Officers
RAND MG1251-2.2
USAR TCcompanies
ARNG TCcompanies
USAR MPcompanies
ARNG MPcompanies
ARNG infantrybattalions
100
80
60
40
20
0
Perc
enta
ge
of
dep
loye
rs
Unit type
35
65
41
59
37
63
67
33
43
57
Short tenure Long tenure
Stability of Unit Leadership 11
even among the four other types of units. On average, across the four other unit types, about 50 percent of officers had short tenure.1
NCOs tended to stay longer in the unit, but, even so, on average, about 40 percent of NCOs had short tenure. In sum, instability among unit leadership was very common in these units.
Factors Underlying Instability
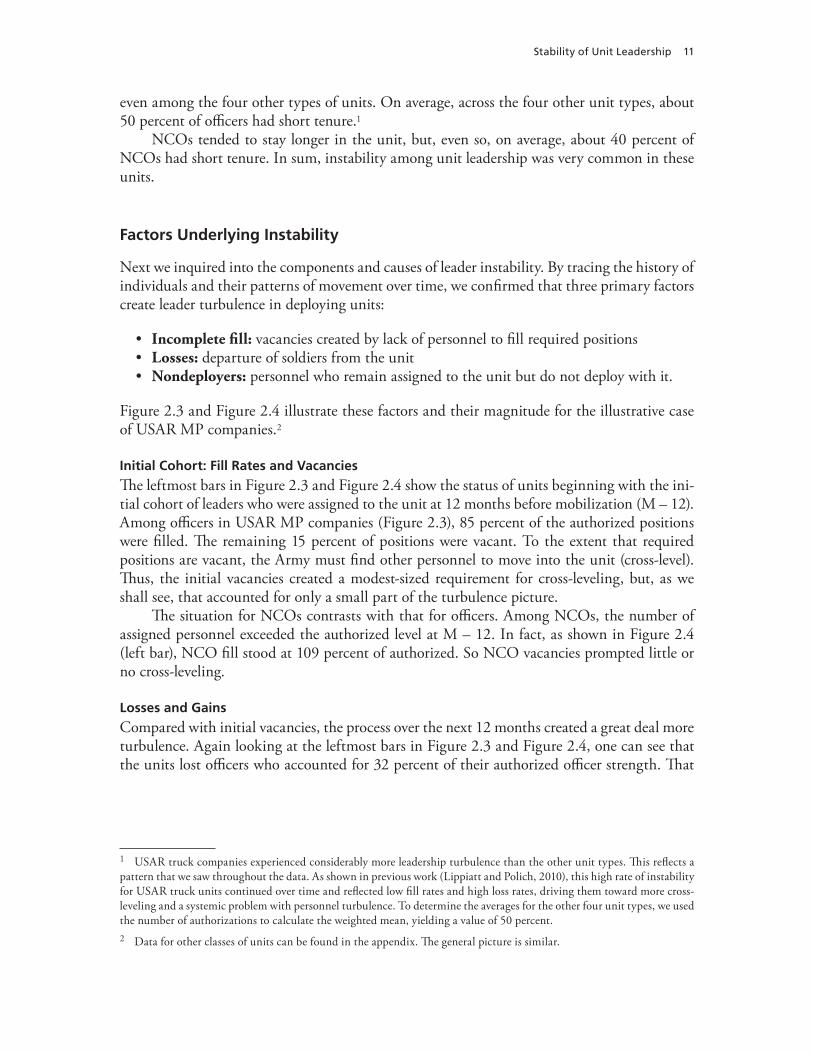
Next we inquired into the components and causes of leader instability. By tracing the history of individuals and their patterns of movement over time, we confirmed that three primary factors create leader turbulence in deploying units:
• Incomplete fill: vacancies created by lack of personnel to fill required positions• Losses: departure of soldiers from the unit• Nondeployers: personnel who remain assigned to the unit but do not deploy with it.
Figure 2.3 and Figure 2.4 illustrate these factors and their magnitude for the illustrative case of USAR MP companies.2
Initial Cohort: Fill Rates and Vacancies
The leftmost bars in Figure 2.3 and Figure 2.4 show the status of units beginning with the ini-tial cohort of leaders who were assigned to the unit at 12 months before mobilization (M – 12). Among officers in USAR MP companies (Figure 2.3), 85 percent of the authorized positions were filled. The remaining 15 percent of positions were vacant. To the extent that required positions are vacant, the Army must find other personnel to move into the unit (cross-level). Thus, the initial vacancies created a modest-sized requirement for cross-leveling, but, as we shall see, that accounted for only a small part of the turbulence picture.
The situation for NCOs contrasts with that for officers. Among NCOs, the number of assigned personnel exceeded the authorized level at M – 12. In fact, as shown in Figure 2.4 (left bar), NCO fill stood at 109 percent of authorized. So NCO vacancies prompted little or no cross-leveling.
Losses and Gains
Compared with initial vacancies, the process over the next 12 months created a great deal more turbulence. Again looking at the leftmost bars in Figure 2.3 and Figure 2.4, one can see that the units lost officers who accounted for 32 percent of their authorized officer strength. That
1 USAR truck companies experienced considerably more leadership turbulence than the other unit types. This reflects a pattern that we saw throughout the data. As shown in previous work (Lippiatt and Polich, 2010), this high rate of instability for USAR truck units continued over time and reflected low fill rates and high loss rates, driving them toward more cross-leveling and a systemic problem with personnel turbulence. To determine the averages for the other four unit types, we used the number of authorizations to calculate the weighted mean, yielding a value of 50 percent.2 Data for other classes of units can be found in the appendix. The general picture is similar.

12 Leadership Stability in Army Reserve Component Units
Figure 2.3Factors Creating Instability: Vacancies, Losses, and Nondeployers, Officers in USAR MP Companies
NOTE: D-day = deployment.a Present at M – 12 but no longer in the unit by M-day.RAND MG1251-2.3
Unit members 1 year later (M-day)
Starting cohortM – 12
Deployment status (D-day)
140
120
100
80
60
40
20
0
Perc
enta
ge
of
auth
ori
zed
100%
Vacancies15%
Lossesa
32%
124%
Gains71%
132%
Nondeployers50%
Deployers in unit more than
1 year29%
Stayed in unit53%
Fill85%
Deploy 82% of
authorized
Stayed in unit53%
Deployers in unit less than
1 year53%
Figure 2.4Factors Creating Instability: Vacancies, Losses, and Nondeployers, Noncommissioned Officers in USAR MP Companies
a Present at M – 12 but no longer in the unit by M-day.RAND MG1251-2.4
Unit members 1 year later (M-day)
Starting cohortM – 12
Deployment status (D-day)
140
120
100
80
60
40
20
0
Perc
enta
ge
of
auth
ori
zed
109%
Losses24%
134%
Gains49%
Nondeployers28%
Deployers in unit more than
1 year65%
Stayed in unit85%
Fill109%
Deploy 110% of
authorized
Stayed in unit85%
Deployers in unit less than
1 year45%
138%

Stability of Unit Leadership 13
left a group of “stable” officers who represented only 53 percent of authorized. Therefore, when it came time to deploy the unit, many more “new” officers had to be added.3
Among NCOs, losses were proportionately smaller but still significant: The units lost NCOs who accounted for 24 percent of authorized. Because the average unit had been filled to 109 percent of authorized, that left a group of stable NCOs who represented 85 percent of authorized.
Together, the losses and vacancies left the unit with appreciable shortfalls of personnel. Those shortfalls induced a large influx of new arrivals over the year before mobilization. They are the “gains” shown in the upper portion of the center bars in Figure 2.3 and in Figure 2.4. For officers, those new arrivals were equal to 71 percent of the authorized strength. These were added to the 53 percent who had already been in the unit for more than one year. In total, then, by M-day, the average USAR MP company was manned at an officer level above its nominal authorized strength: 124 percent of authorized.
The unit also received a large set of new NCOs: Gains between M – 12 and M-day rep-resented 49 percent of authorized NCO strength. Therefore, by M-day, the typical unit’s NCO manning stood at 134 percent of authorized.
Nondeployers
The third primary factor producing turbulence was the presence of nondeployers, illustrated by the rightmost bars in Figure 2.3 and in Figure 2.4. Even though the units were temporar-ily overmanned at M-day, a substantial fraction of the personnel assigned to the unit did not deploy with the unit.
The rightmost bars in Figure 2.3 and Figure 2.4 show the distribution of unit leaders at the time when the unit deployed (D-day). By D-day, the unit was manned at 132 percent of its authorized officer level. However, a group amounting to 50 percent of authorized did not deploy even though they were assigned to the unit. That left a deploying element that repre-sented 82 percent of authorized officer strength.4
Moreover, only a minority of those deployers were long-standing members of the unit. The “stable” officers in the unit (those who had been in the unit for 12 months or more) are shown in the lowest segment of the bars: 29 percent of authorized. Newly arrived officers rep-resented a much larger group, 53 percent of authorized.
NCOs were somewhat more stable: Deployers who had 12 months tenure in the unit rep-resented 65 percent of authorized, and, in total, NCOs deployed at 110 percent of authorized levels.
The workings of these three factors (fill, losses, and nondeployers) were generally similar across the other types of units studied.5 To quantify their prevalence and understand better how they operate, we now examine each of the three factors more closely.
3 Remember, though, that these losses represent people who are departing from the unit but not necessarily from the Army. Some of the personnel who left the unit were simply transferring to other Army units, so their “loss” would affect the source unit but not the Army’s overall officer manning level.4 Stated in percentages, this may seem to present quite a problem. However, the typical company has only five officers, so an 80-percent deployment rate means that the company is missing only one officer.5 See the appendix for similar data on all five classes of units.

14 Leadership Stability in Army Reserve Component Units
Figure 2.5Fill Rates at Two Time Points: Officers
NOTE: The two points are M – 12 (for mobilizing units) and June 2011 for all units.a Personnel assigned as a percentage of authorized.RAND MG1251-2.5
USAR TCcompanies
ARNG TCcompanies
USAR MPcompanies
ARNG MPcompanies
ARNG infantrybattalions
140
120
100
80
60
40
20
0
Fill
rate
(%
)a
Unit type
5343
8277
129
85
114106
8680
M – 12 months June 2011
Figure 2.6Fill Rates at Two Time Points: Noncommissioned Officers
NOTE: The two points are M – 12 (for mobilizing units) and June 2011 for all units.a Personnel assigned as a percentage of authorized.RAND MG1251-2.6
USAR TCcompanies
ARNG TCcompanies
USAR MPcompanies
ARNG MPcompanies
ARNG infantrybattalions
120
100
80
60
40
20
0
Fill
rate
(%
)a
Unit type
7981
10510596
10992100
93100
M – 12 months June 2011

Stability of Unit Leadership 15
Fill Rates and Vacancies
Figure 2.5 and Figure 2.6 exhibit the fill rates for each of the five classes of units, for two points in time. The left bar in each figure represents the fill rate at M – 12 (12 months before mobilization). The right bar represents the fill rate in June 2011 (near the end of our period of observation).
It is immediately apparent that officer fill rates were a problem for most unit types as they approached mobilization. In four of the five classes of units (all except ARNG MP companies), officer fill rates were well below 100 percent at M – 12 (blue shaded bars). NCO fill rates were generally quite a bit higher: They were generally near 100 percent except in the case of USAR truck companies, which had a chronic problem that we see throughout the data.
To see whether the situation had improved much in later years, we calculated the corre-sponding fill rates for June 2011 (gray shaded bars). The comparison shows that, in fact, offi-cer fill rates did improve, particularly in USAR MP companies. Nevertheless, some shortfalls persist. In particular, the truck companies and infantry battalions remained short of officers in 2011.
On the other hand, NCO fill rates were stable or declined a little. As a result, by 2011, NCO fill rates ranged around 90 to 95 percent in MP and infantry units, and they remained much lower (about 80 percent) in USAR truck companies. Only ARNG truck companies maintained NCO fill at or above 100 percent.
Thus, the main conclusion that we can draw is that leader fill rates remain a problem in some areas and that therefore vacancies may well contribute to personnel turbulence if RC units are called up in the future. However, vacancies are not the primary driver of instability. As we will see shortly, by the time of deployment, the service had managed to fill these units—in fact, to overfill them to a point well above 100 percent—but doing so required adding quite a large number of leaders to the units.
Losses from the Unit
Loss Rates Are Substantial
RC units lose a substantial fraction of their leaders each year. Figure 2.7 and Figure 2.8 show annual loss rates for the five classes of units. Consider first the left bar in each figure, shaded in blue. That bar represents the loss rate during the 12 months before mobilization. It is calculated as the number of leaders who left the unit between M – 12 and M-day, as a fraction of those who were assigned to the unit at M – 12.
As shown in Figure 2.7, officer loss rates ranged from about 30 percent to almost 50 per-cent, depending on the unit type. Even among infantry battalions, which were least affected by losses, 29 percent of officers who had been in the unit at M – 12 had left by M-day. In the truck companies, loss rates were much higher: 45 to 47 percent.
NCO losses during the premob year were not as high but still appreciable. As shown in Figure 2.8, they ranged from 22 to 29 percent for varying classes of units.
Are these loss rates “normal” or atypical? Some might anticipate that loss rates would be higher as the unit is preparing for mobilization, if some leaders cannot deploy, prefer not to deploy, or are replaced because of physical problems, performance, or other reasons that become apparent in the premob process.

16 Leadership Stability in Army Reserve Component Units
To address that issue, we calculated loss rates during an earlier period, the period between M – 24 and M – 12. During that period, most units had not been notified of sourcing for an
Figure 2.7Personnel Losses During Two Years Before Mobilization: Officers
a Losses during the defined 12-month period as a percentage of the number assigned at the start of the period.RAND MG1251-2.7
USAR TCcompanies
ARNG TCcompanies
USAR MPcompanies
ARNG MPcompanies
ARNG infantrybattalions
60
50
40
30
20
10
0
Loss
es (
per
cen
tag
e o
f as
sig
ned
)a
Unit type
4947
3645
40383632 2829
M – 12 to M-day M – 24 to M – 12
Figure 2.8Personnel Losses During Two Years Before Mobilization: Noncommissioned Officers
a Losses during the defined 12-month period as a percentage of the number assigned at the start of the period.RAND MG1251-2.8
USAR TCcompanies
ARNG TCcompanies
USAR MPcompanies
ARNG MPcompanies
ARNG infantrybattalions
40
35
30
25
20
15
10
5
0
Loss
es (
per
cen
tag
e o
f as
sig
ned
)a
Unit type
3529
202427
222522 2225
M – 12 to M-day M – 24 to M – 12

Stability of Unit Leadership 17
upcoming deployment, and their potential participation was not certain. The loss rates during that year are represented by the right bar in Figure 2.7 and Figure 2.8, shaded in gray.
The data do not show any trend in loss rates between the two time periods. In some cases, the loss rate is higher during the premob year than during its predecessor; in other cases, it is lower. For example, infantry battalion officer loss rates are 1 percentage point higher during the premob year than the preceding year. But, among the MP companies, the premob loss rates are 2 to 4 percentage points lower.
In any case, the differences are typically small, between 2 and 5 percentage points. So we concluded that there is no tendency for RC leaders to leave their units in anticipation of an upcoming mobilization. Instead, the loss rates that we observe in the blue bars seem to reflect the normal operation of the system—sizable numbers of people leaving the unit during any year.6
Many Different Reasons Underlie Leader Departures from the Unit
What happened to the leaders who were in the unit 12 months before mobilization? To trace their movements and infer some causes, we examined the set of leaders who were in the unit at M – 12 and traced their status as of M-day. Figure 2.9 illustrates the result, for ARNG infan-try battalion NCOs.7 The systematic data available from DMDC and the Army provide this
6 This is essentially the same result as we found in the earlier analysis that focused on the entire unit membership. In that analysis, loss rates had remained stable even when compared with rates during a period much earlier, before the onset of regular deployments (Lippiatt and Polich, 2010).7 The appendix reports the data for all five classes of units and for officers versus NCOs.
Figure 2.9What Happened to Army National Guard Infantry Battalion Noncommissioned Officers Who Were in the Unit 12 Months Before Mobilization?
NOTE: TDA = Table of Distribution and Allowances. TOE = Table of Organization and Equipment.RAND MG1251-2.9
PersonnelcohortM – 12
Personnel cohort at M-day
Assigned =100%
Deploy same1%
Deploy later4%
Deploy earlier4%
TDA2%
TOE4%
Deploy9%
Not deploy6%
Rejoin later1%
Permanent loss10%
Deploy57%
Service loss11%
Unit move15%
Not deploy17%
Stay in unit74%
Leave unit26%

18 Leadership Stability in Army Reserve Component Units
type of information. Although the information does not specifically identify detailed reasons or underlying causes for moves, examining the subgroups helps to suggest some of the most-likely reasons.
At the left of Figure 2.9, we begin with all NCOs who were assigned to the unit at 12 months before mobilization. Thus, those assigned are treated as 100 percent. To the right, we display the percentage (out of those assigned) who flowed into various boxes that reflect differing outcomes at M-day.
First of all, we see that 26 percent of that cohort had left the unit by one year later, while 74 percent remained in the unit. Let us examine the components of these two groups in more detail.
Unit Moves
Although 26 percent left the unit, they were not generally losses to the Army. In fact, more than half of those losses (15 percent of assigned) moved to another unit within the Army RCs.
Tracing their evolution further, we saw that the majority of the unit movers (9 percent of the original cohort) eventually deployed with another unit. The green boxes at the upper right of Figure 2.9 show that, of that 9 percent, 4 percent actually deployed earlier than the unit from which they had moved (on average, about three months before the original unit deployed), and another 1 percent deployed at the same time as the original unit.8 We sus-pect that many of them were cross-leveled into another unit because its needs were deemed more pressing. Beyond those groups, another 4 percent deployed later (on average, within 18 months). We show all of those groups with green shading because they did in fact deploy.
Now consider the 6 percent who moved units but did not deploy. One reason they might not have deployed is that they transferred to another unit to perform a different function. For example, one-third of them (2 percent of the original cohort) moved into TDA positions, such as staff positions, state headquarters, or training institutions.9 Some TDA positions are regarded as broadening assignments or “stepping stones” to greater responsibility; for example, serving at a combat training center, teaching in an Army school, or attending a competitive school course may provide valuable experience and enrich a leader’s record. Therefore, many of those moves may reflect professional development or needs of the service for purposes other than deploying operational units. Because they may reflect such competing priorities, we show those people in a gray box.
The remaining 4 percent moved to another TOE unit but did not deploy. One might interpret this as an undesirable outcome (because those personnel left a deploying unit and did not deploy with their new units), so we shaded them in red. There are many possible explana-tions for such moves.10 Such moves could reflect an accommodation by the service, for example to protect an individual with a personal or family hardship or whose circumstances preclude a deployment at the time (e.g., a student). However, in some cases, the moves could have been driven by other conditions. For example, some soldiers may move to other TOE units because of promotion; one’s current unit may not have an appropriate position for the higher grade,
8 Unless stated otherwise, “on average” refers to the mean value across all personnel.9 TDA refers to units that provide institutional support but generally do not deploy for operational missions. TDA units are contrasted with TOE units, which are intended to deploy and conduct operations in the field.10 The systematic data that we have do not record specific reasons for unit moves.

Stability of Unit Leadership 19
but another unit does.11 In addition, leaders are expected to get broad experience in a variety of career-enhancing positions to be competitive for promotion in the future; to gain access to such a valued position (such as battalion operations or executive officer), a leader may need to move to another unit.
Alternatively, a unit move could result from changes in the leader’s personal circum-stances: The individual may have moved his or her household to another area because of civil-ian employment, family needs, or other reasons, and, as a result, the leader may have joined a different unit that was not scheduled to deploy. Some fraction of the 4 percent, therefore, could be viewed as benign outcomes—the soldier remained with the service despite a move.
Service Losses
The other people who left the unit became losses from the service. They represented 11 percent of the original cohort, as shown by the white box in the lowest part of Figure 2.9. Most of them were permanent service losses, although a minority (in this case, 1 percentage point) returned to the service later (on average, within ten months).
Nondeployers
Finally, we must note the outcomes among the 74 percent who remained in the unit. Even though they stayed with the unit, that does not mean they deployed. In fact, 17 percent (nearly one-fourth) of that 74 percent did not deploy with the unit.
Virtually all of the nondeployers were qualified (97 percent), so their deployments were not barred by incomplete training or education (unlike the situation among junior enlisted personnel, many of whom had not yet completed initial training). Later we will look into other circumstances that may help to explain the large number of nondeployers.
Future Reductions in Cross-Leveling Demand
One other consideration is the possibility that some of the “turbulence problem” may go away if the pace of operations ebbs in the future (e.g., after withdrawal from Afghanistan). To gain a rough estimate of the potential effect, suppose that RC deployments were curtailed to such an extent that there was little need for cross-leveling actions (transferring personnel from a donor unit to a deploying unit that requires additional people). In Figure 2.9, those actions would be represented by moves into a unit that deployed earlier or at the same time as the source unit (4 percent and 1 percent, respectively, in the green boxes at the upper right).
Although those moves do create turbulence, note that they represent only a minority of the unit losses: only 5 percent, or about one-fifth, of the 26-percent unit losses. Therefore, if deployment tempo does slow in the future, it would create a modest reduction in personnel turbulence, but most of the turbulence would remain.
Prospects for Reducing Losses
What does this tell us about the prospects for managing or reducing loss rates? First, we note the relatively small numbers of leaders who actually represent losses that the Army might wish to prevent. In Figure 2.9, the most-relevant groups are in the two boxes shaded in red: perma-
11 Promotions are an essential part of the personnel management and leader development process, and they occur fre-quently during the early years of a career. For example, promotions are built into the system for officers; first lieutenants can be promoted after two years in grade. Both officers and NCOs are also affected by up-or-out policies, which require leaders to be promoted or leave the service by a certain point. These practices nevertheless produce leader turbulence in units.

20 Leadership Stability in Army Reserve Component Units
nent losses from the service and people who transfer to another TOE unit but do not deploy from that new unit.12 These are not very large groups to begin with: In the aggregate, they rep-resent only 14 percent of the assigned NCOs, and, among officers, the corresponding groups are even smaller (e.g., 9 percent of officers in infantry battalions).
This suggests that even intensive efforts to reduce losses would have a limited payoff. First, it might be difficult to further reduce the permanent loss rate; a level of 10 percent is already modest, and it did not vary markedly over the preceding years, so it probably arises from many causes that are evidently persistent. However, let us suppose that some policy intervention (say, a unit retention bonus) could further reduce both permanent losses and movements to other TOE units. Even if both groups could be cut by 25 percent, the result would reduce the total unit loss rate by only 3.5 percentage points. In addition, some of the people newly retained in the unit would be short-tenure “new arrivals,” and some of them would not deploy.13 After all of these considerations are factored in, the net increase in stable deployers would probably be only 2 to 3 percentage points.
Nondeployers
Prevalence of Nondeployers
We now switch our focus from mobilization to the later point when the unit deploys (D-day).14 The first thing to understand about the unit situation at deployment is how the unit membership has grown. Although we saw earlier that many types of units were undermanned 12 months before mobilization, by D-day, the units were overfilled. Figure 2.10 and Figure 2.11 exhibit the data for all five classes of units.
Consider, for example, ARNG MP companies, shown in the leftmost bars of Figure 2.10 and Figure 2.11. The total number of members, as a percentage of authorized, is shown in blue above the top of each bar. The ARNG MP units were manned at 126 percent of authorized officers and 117 percent of authorized NCOs. The other unit types generally enjoyed similar levels of overmanning.15
Nevertheless, a sizable fraction of those leaders did not deploy. For example, among the ARNG MP companies, the deployers represented 86 percent of authorized, while another 40 percent of authorized did not deploy. That means that 32 percent of the unit’s members were nondeployers 40 126 32 .( )÷ = Nondeployment rates were lower among NCOs but still ranged from 18 to 28 percent of members.
12 Of course, those who stay in the unit but do not deploy represent another “problem” group, but we consider them in the next section.13 Recall that nearly half of deploying infantry battalion leaders had been in the unit for less than one year, and the overall deployment rate among people who stayed in the unit was 75 percent.14 Actually, the data describe the month when the main body of the unit deployed. In most of our statistics, we examine the status of the unit at D + 1 month, to capture the modest number of additional unit personnel who deployed slightly later than the main body of the unit. That is the point we loosely describe as D-day.15 The sole exception is USAR truck companies, which apparently had persistent officer manning problems (91-percent fill at D-day). This fits the overall pattern of personnel shortages and turbulence that we repeatedly observed among USAR truck units during this period.

Stability of Unit Leadership 21
Of course, a partial reason for nondeployment could be that the units were overmanned and therefore not all of the members were needed to fill the Combatant Command (COCOM) request. However, that cannot be the only explanation. In every unit type, the unit deployed
Figure 2.10Deployers and Nondeployers in the Unit at Deployment: Officers
RAND MG1251-2.10
USAR TCcompanies
ARNG TCcompanies
USAR MPcompanies
ARNG MPcompanies
ARNG infantrybattalions
160
140
120
100
80
60
40
20
0
Perc
enta
ge
of
auth
ori
zed
Unit type
126
86
134
82
102
81
91
67
107
74
40 52
21
2433
Deployed Nondeployed
Figure 2.11Deployers and Nondeployers in the Unit at Deployment: Noncommissioned Officers
RAND MG1251-2.11
USAR TCcompanies
ARNG TCcompanies
USAR MPcompanies
ARNG MPcompanies
ARNG infantrybattalions
160
140
120
100
80
60
40
20
0
Perc
enta
ge
of
auth
ori
zed
Unit type
117
93
139
110
122
100
156
121
127
92
24
2922
35
35
Deployed Nondeployed
22 Leadership Stability in Army Reserve Component Units
with less than 100 percent of its authorized officers, and both ARNG MP companies and infantry battalions deployed with fewer than their authorized numbers of NCOs.
Another potential reason could be that the overseas command requested only part of a unit. In fact, partial-unit deployments were not uncommon during this period. However, we selected units that deployed essentially as whole units (infantry battalions that deployed at least 90 percent of authorized and companies that deployed at least 75 percent).16 The number of nondeployers that we see in these data cannot be explained by partial-unit deployments.
There are some considerations that make the nondeployment problem less severe than it might appear at first glance. First, the data showed that some leaders deployed to the unit after D-day. In each type of unit, the percentage of authorized who deployed rose by about 3 to 5 percent in the next one or two months after the unit’s original deployment date.17
It is also true that some of the nondeployers had long tenure in the unit. About one-third of nondeploying officers and one-half of nondeploying NCOs had been in the unit for 12 months or more. Those leaders could have assisted in training oversight and planning even though they did not deploy. So the presence of those stable nondeployers would be a mitigating factor in helping the unit to prepare despite the influx of new leaders.
Nonetheless, the large number of nondeployers is striking to many observers. In some cases, it even meant that the unit deployed under strength. What factors may underlie this phenomenon? To address that question, we traced the later behavior of nondeployers during the months after the unit deployed.
Reasons for Nondeployment
Figure 2.12 outlines a sequence of events (essentially, branches in a tree diagram) that imply reasons that unit leaders may not have deployed. Each box represents a particular event or con-dition and reports the fraction of nondeployers who were in that condition within 12 months after the unit deployed. These data illustrate the results for infantry battalion NCOs.18 In total, they paint a picture showing multiple, discrete causes of nondeployment: There are many spe-cific causes, and each cause accounts for only a small part of the overall nondeployment rate.
Figure 2.12 begins at the left with all nondeployers in the unit, as of D-day. Note that, in this diagram, “100 percent” represents all nondeployers, not all personnel assigned to the unit. In this case, nondeployers were 23 percent of assigned. So, although the numbers in the boxes may appear large, it should be borne in mind that those percentages are much smaller when expressed as a fraction of all people in the unit.
The first branch in the tree in Figure 2.12 refers to whether or not the individual was activated. Among nondeployers, one-third were activated. Let us trace their evolution first. Among those who were activated, about half deployed later with their units (17 percent of non-deployers, shaded green). The other half (16 percent) did not deploy even though they had been activated. Many of them stayed in the units (9 percent, shaded gray). We suspect that those activated stayers included many people who remained behind as a rear detachment, perhaps for local duties, remote support for the unit, facility management and maintenance, or assistance
16 In fact, even the companies, on average, deployed nearly 85 percent of their authorized strength.17 The rise among infantry officers was even greater (about 15 percent), but that could be related to the fact that some infantry battalions were organized as security force elements, and hence the battalion staff may not have been required at the outset.18 The full set of data for all types of units, officers and NCOs, can be found in the appendix.

Stability of Unit Leadership 23
to families. (Such a group, at 9 percent of nondeployers, would represent only about 2 percent of unit membership, a reasonably sized group to serve as a rear detachment.)
The remaining 7 percent among those activated left the units; 3 percent were service losses, and 4 percent moved to new units. Finally, among those who moved to new units, 1 percent deployed with their new units while 3 percent did not deploy. In our interpretation, the only groups that unambiguously reflect an adverse end state are the two boxes shaded red: the 3-percent service losses and the 3 percent who moved but did not deploy.
What about the two-thirds who were not activated at all? Again, we found a complex chain of events in which only some of the end states appear adverse. First, among the 67 per-cent who were not activated, 3 percent deployed later with the unit. The rest split into 2 percent
Figure 2.12What Happened to Soldiers Who Did Not Deploy? Noncommissioned Officers in Army National Guard Infantry Battalions
NOTE: Nondeployers made up 23 percent of assigned.RAND MG1251-2.12
Personnelcohort at
D-day
Personnel cohort at D + 12
Nondeployers
Activated
Notactivated
Not deploylater with
unit
Deploylater with
unit
Deploylater with
unit
Qualified
Notqualified
Stay inunit
Leaveunit
Move tonew unit
Servicelosses
Stay inservice
Servicelosses
Leaveunit
Notdeploy
Deploywith new
unit
Servicelosses
Move tonew unit
Becomequalified
Notqualified
Prioractivation
No prioractivation
Deploywith new
unit
Notdeploy
17%
16%
64%
3%
67%
33%
100%
31%
0.5%
1.5%
4%
3%
31%
2%
7%
9%
62%
7%
8%
15%
17%
17%
0.7%
0.8%
3%
1%
14%
Not deploylater with
unit
Stay inunit

24 Leadership Stability in Army Reserve Component Units
who were not qualified (a fraction of whom later became qualified) and 62 percent who were qualified.
Following the 62 percent who were qualified, one can see that they split evenly into 31 percent who stayed in their units and 31 percent who left their units. Among the 31-percent stayers, we see more than half (17 percent) who had already experienced a previous activation; during this period, many of them would not be required to reactivate.19 Thus, the only adverse outcome in this group is represented by the 14 percent who had no prior activation (shaded red).
What about the 31 percent who left their units? They split into 17 percent who left the service and 15 percent who moved to new units. And that latter 15 percent of movers included about half who deployed with their new units and half who did not deploy. So, among the unit losses, we shaded the service losses and nondeployers in red.
Once again, as in the case of unit losses, we do not have systematic data that pinpoint and count the specific events underlying nondeployments. However, we can suggest some possible factors based on anecdotal reports. Two factors often cited are lack of a required security clear-ance and medical or physical problems that required extended evaluations. It can take a long time (often months) to obtain or reinstate a clearance or to resolve a medical or physical issue that may require action by an evaluation board. Such factors could account for some of the people who were not activated (i.e., the 14 percent who had no prior activation) or who became service losses (i.e., personnel who might have eventually separated as a result of board action but after the unit deployed).
A notable feature of Figure 2.12 is that only a minority of the nondeployers occupied an end state that is adverse, in the sense that management might wish to try to change it. They fall into two broad categories: 21 percent service losses and 25 percent who never deployed. A second feature is that all of the nondeployers, taken together, still account for only 23 percent of the unit membership.
Potential Changes in Nondeployment Rates
What does this tell us about the prospects for increasing stability by tackling the problem of nondeployers? The first step in formulating an answer is to recognize the size of the groups involved, as a fraction of the unit membership. Figure 2.13 summarizes the end states shown in the preceding figure and displays the size of each group as a fraction of the unit’s assigned personnel.
Calculating the Size of Nondeployer Groups
Each bar in Figure 2.13 reflects the product of two factors: the percentage of nondeployers whose nondeployments were attributable to a specific cause (as shown in Figure 2.12) times the fraction of nondeployers in the unit membership. For example, the first bar, labeled “Deployed later with the unit,” sums the two boxes in Figure 2.12 that were labeled “Deploy later with unit” (shaded in green). Those two boxes together sum to 20 percent of nondeployers. The length of the bar is calculated as 20 percent 23 percent,× which yields 4.6 percent of unit members. All of the other bars are calculated in a parallel way.
19 In fact, we heard from several officials that OSD policies and service practices sometimes emphasized preservation of “dwell” (keeping a soldier at home for a minimum period of time after a previous deployment), even if that created a vacancy in the deploying unit that had to be filled from another source.

Stability of Unit Leadership 25
Magnitude of Potential Effects
We already discussed reasons that the bars shown in green would not necessarily be adverse results. They include three groups: deployed later with the unit, deployed after moving to another unit, and not activated because of a prior activation.
The remaining groups represented by bars shown in red could be reasonable candidates for policy interventions that would seek to reduce nondeployment. However, note how small they are. The red groups together account for only about 10 percent of unit members.
Moreover, we would argue that those remaining groups would probably be difficult to change. For example, some service losses may have arisen because the individual was found to be not deployable for health, legal, or other reasons. If the condition were discovered before mobilization, such a person would probably not be activated. Such people might account for many of the nonactivated service losses (the red box near the lower right of Figure 2.12).20 Others may be individuals whose term of service would expire before the end of the deploy-ment and who do not wish to extend their commitments. The service would probably not want to expend further resources or effort to retain people in either of those groups. The remainder—prospective “service losses” who might be persuaded to remain—would repre-sent just a few percentage points of the unit membership, and inducing them to stay would most likely require substantial bonuses or other incentives.21
The other two groups are those who moved to other units but did not deploy and those who stayed in their units but were never activated (despite not having been activated before).
20 On average, service losses occurred about six months after the unit’s D-day. That could reflect the amount of time for processing an individual’s departure from the service.21 As a practical matter, reserve unit members need to be persuaded to remain. Although they may be nominally com-mitted to service by an original contract or agreement, members can simply opt out by discontinuing attendance at unit assemblies.
Figure 2.13Nondeployers as Percentage of Assigned Personnel: Noncommissioned Officers in Army National Guard Infantry Battalions
RAND MG1251-2.13
Percentage of assigned
Type of nondeployer
Deployed later with unit
Service loss
Move to new unit, deploy
Move to new unit, not deploy
Activated, stay in unit, not deploy
Not activated, stay in unit, not deploy (prior activation)
Not activated, stay in unit, not deploy (no prior activation)
Not qualified
543210 6

26 Leadership Stability in Army Reserve Component Units
We suspect that many of those leaders had personal reasons for not deploying, and the service accommodated them rather than attempting to force their deployment. If stronger steps were taken to persuade them to deploy, they might simply leave the unit or the service.
In spite of that argument, let us outline the magnitude of possible gains. Suppose each of the three causes shown in red could be reduced by one-third. The result would be a reduction of nondeployers representing about 3 percent of unit members 10 percent one-third .( )×
Finally, we recognize that not all of that 3 percent would be people who had been in their units for a long time. Thus, the increase in the number of deployers would have to be further decremented to reflect people who had recently arrived in the unit—if stability is the goal. To be sure, such a change would be an improvement, but a small one in the overall context of unit stability.
The Personnel Buildup Process for Unit Leaders Before Mobilization
For all of the above reasons, units need to add many new personnel, including new unit lead-ers, during the premob period. At the beginning of this monograph, we showed the personnel buildup curve for all unit members—most of whom are not leaders, of course.
What does the picture look like for the unit leadership? Just as in the case of the aggregate unit membership, the picture reveals a steep buildup of unit leaders and deployers during the last few months before mobilization.
Figure 2.14 and Figure 2.15 illustrate the buildup of officers and NCOs, respectively, in units over the 14 months before deployment, for the case of USAR MP units.22 For those units,
22 Data for all classes of units and officers versus NCOs can be found in the appendix. If drawn as diagrams like this one, all of them exhibit the same shape, with some differences of degree but not of overall pattern.
Figure 2.14Personnel Buildup Before Mobilization and Deployment: U.S. Army Reserve Military Police Company Officers
RAND MG1251-2.14
Months in unit prior to deployment
Perc
enta
ge
of
auth
ori
zed
140
130
120
110
100
90
80
70
60
50
40
30
20
10
05678910111314 12 4 3 2 1 0
M-d
ay
Assigned
Deploy

Stability of Unit Leadership 27
mobilization typically occurred two months before deployment, so the mobilization point is represented by a vertical dotted line at D – 2. The two plotted lines represent the growth of personnel in the unit inventory of two types of leaders: those who were assigned to the unit on D-day (upper line, in blue) and those who eventually deployed with the unit on D-day (lower line, in red).
Figure 2.14 and Figure 2.15 portray a view looking backward from D-day, showing when each new leader arrived in the unit. The lines show the percentages of authorized personnel who were in the units on D-day according to the length of time they had been in the units before that. For example, consider the diagram for officers, in Figure 2.14. At the point labeled “0” on the x-axis (zero months before D-day), the number of assigned officers stood at 132 per-cent of authorized (blue line). At the same time, the number of deploying officers in the unit stood at 82 percent—meaning that the unit deployed with an officer strength of 82 percent of its authorized level.
The buildup began in earnest long before that. At about D – 10, the two lines begin to rise noticeably. Even so, four months later at D – 6 (four months before mobilization), the buildup of D-day officers was only partly completed (assigned at about 75 percent of authorized and deployers at about 50 percent—well below the levels they would eventually attain on D-day). Thus, the steepest part of the line appears between D – 6 and D – 2. This means that many of the officers who were in the units on D-day and many of those who eventually deployed with them were quite recent arrivals.
Figure 2.15 shows that the NCOs were more stable—beginning with a higher proportion of deployers already in the unit at D – 14—but the curves exhibit roughly the same shape and overall buildup trends as those for officers.
Evidently, then, those newly arrived leaders were not in a position to oversee the prepa-ration and training of more-junior personnel or to plan and organize the intense program of
Figure 2.15Personnel Buildup Before Mobilization and Deployment: U.S. Army Reserve Military Police Company Noncommissioned Officers
RAND MG1251-2.15
Months in unit prior to deployment
Perc
enta
ge
of
auth
ori
zed
1501401301201101009080706050403020100
5678910111314 12 4 3 2 1 0
M-d
ay
Assigned
Deploy

28 Leadership Stability in Army Reserve Component Units
premob training that occurred in the last few months before mobilization.23 Therefore, the deploying unit leadership was not stable enough to ensure that the new leaders could train directly with their troops, and some of the new unit leaders arrived just before mobilization, when some key training events (such as those shown in Figure 1.1 in Chapter One) had already taken place.
As we have already mentioned, there was one mitigating factor amid this turbulence: Many of the nondeploying leaders had considerable time in the units, so they would have been available to plan and oversee training of the units’ members even as the buildup progressed.
Summary: The Overall Picture
Let us now step back from the details and summarize key results of the foregoing analysis.
New Arrivals Soon Before Mobilization
As we saw in previous research, many new leaders arrive in the unit during the last four to five months before mobilization.
Training Impact
The scheduling and content of training are directly affected by the arrival of many new person-nel during the last few months before mobilization. Many junior unit members and leaders will arrive after key training events have already occurred. Moreover, if they live far away, many of the new arrivals may have to go on temporary duty assignment to do training or may miss AT periods and other activities centered at the unit’s location. These patterns mean that many leaders will not be present before the arrival of more-junior personnel who are cross-leveled into their units.
Manning Above Authorized Level by Deployment
Typically, leader fill rates rise to above 100 percent by D-day.
Short Unit Tenure Among Many Deploying Leaders
Even if a unit may enjoy high manning levels at D-day, that does not mean that the leaders who deploy with the units are stable—in the sense that one has long tenure in his or her unit when that unit deploys.
Policy Options Are Limited
These findings are likely to be viewed with misgivings by commanders and training managers, who naturally prefer stable units. Therefore, we considered potential DoD policy options to render units more stable. The answer, in a nutshell, is that there are no easy fixes to this prob-lem. In this section, we advance three reasons for that conclusion.
Persistence of Instability Over Time
Personnel turbulence is a long-standing, persistent, and widespread phenomenon. Loss rates, for example, were just as high in the second year preceding mobilization as in the premob year.
23 See Lippiatt and Polich (2010) for a more extensive discussion of the key training events that occurred during that period.

Stability of Unit Leadership 29
Previous analysis showed that aggregate loss rates had not changed appreciably since the year 2000. When we divided our period of observation into separate time segments (e.g., before 2008 and after), we found no noticeable trends in loss rates or nondeployment rates.
Moreover, we have seen that turbulence affects all types of units and all grades of per-sonnel, including the leadership. Indeed, previous work showed that AC units also experience turbulence as they prepare to deploy, at about the same levels as RC units (Lippiatt and Polich, 2010). If that posed a problem and the problem were straightforward to solve, the services would already have devised a way to do it. Instead, however, we have seen that they worked around the problem and managed to deploy units on time in spite of it.
Limited Prospects for Reducing Instability
There are two reasons that instability is not likely to be much affected by policy interventions. First, many instances of soldier movements are not necessarily bad for the Army. For example, many unit losses are due to personnel moving into other units rather than leaving the service. A sizable fraction of those who change units deploy with their new units. Others do not deploy but move into TDA positions or higher positions in other units, which often reflects a profes-sional development assignment. The Army would probably not wish to inhibit these deploy-ments or professional development opportunities.
Even among those who stay in their units but do not deploy with them, there may be acceptable reasons for nondeployment. For example, we saw numerous instances in which a leader did not initially deploy with his or her unit but did deploy later. Other reasons for non-deployment include maintaining a rear detachment at home station, avoiding redeployment of soldiers with prior activations, or accommodating soldiers with particular family or personal hardships. In many of these cases, the local commander probably decided that it was better to keep the soldier at home than to risk losing the person from the Army.24
Second, even strenuous attempts to reduce turbulence are unlikely to yield significant increases in stability. This is because only certain subgroups of losses and nondeployers could plausibly be addressed by policy initiatives, and each such subgroup is small to begin with. We calculated rough estimates of the possible changes in the sections above on losses and nonde-ployers, and we concluded that policy interventions would probably reduce those rates by only a few percentage points.
Uncertain Costs: Limitations on Existing Data
Finally, there is the matter of cost. With an all-volunteer force, DoD has few attractive options to persuade individuals to remain in their units. It cannot simply mandate that a soldier remain in a reserve unit without risk of losing him or her altogether (e.g., if he or she stops attending drills and drops out).
DoD’s customary approach to trying to increase retention in the past has been to offer bonuses. Bonuses have a long history as incentives for initial enlistment, and they have been used extensively for retention management, particularly to man shortage career fields in the active forces (Asch, Heaton, et al., 2010). Bonuses are preferred as a policy tool and are viewed as efficient because they can be readily focused on specific problem areas (such as skills or units
24 For a more extended discussion of the potential positive aspects of instability, see Lippiatt and Polich (2010, p. 6).

30 Leadership Stability in Army Reserve Component Units
with shortages) and can be increased or decreased flexibly (compared with pay, which, once set, is hard to adjust).
If DoD wanted to improve retention in selected RC units (say, those that are headed for a deployment), it might be feasible to offer bonuses to soldiers to remain in their units and to deploy. To design a program, one would want an answer to a question posed as follows: Sup-pose DoD offered a bonus of $X,000 to each leader who remained in his or her RC unit; how much would that reduce the loss of officers or NCOs?
However, after searching the literature and consulting experts, we found no direct esti-mates of bonus effects on retention in the Army RCs. Therefore, we cannot predict the magni-tude of the possible effects of a new program with available data.
What can one say from the available research literature? Almost all of that literature focuses on the AC, but some of its findings may still be instructive. First, reenlistment bonuses have achieved measurable effects. The Selective Reenlistment Bonus, for example, is offered in a series of steps (from 1 to 6) reflecting varying multipliers; the total bonus value is the product of the multiplier, monthly base pay, and the number of additional years obligated. The result-ing bonus amounts are sizable: In 2007, an E5 reenlisting for three years would have received about $7,700 at a step 1 level and $15,400 at a step 2 level.25 Recent analyses suggest that a one-step increase in the Army bonus for second-term reenlistments raised the reenlistment rate by 2 to 5 percentage points. The costs to achieve these effects are substantial; one estimate calcu-lated a marginal cost between $15,000 and $24,000 for each additional man-year obligated.26
Unfortunately, much less research evidence is available on reserve retention. Previous anal-yses, for example, suggest that enlistment bonuses increase Army RC enlistments (Hosek and Miller, 2011) and that reenlistment bonuses reduce Marine Reserve attrition (Hattiangadi, Par-cell, et al., 2006). However, we found no analyses directly focusing on retention in the Army RCs. What we need, but do not have, are data and analyses applying to these circumstances:
• Target population: reserve unit leaders (rather than active force members or leaders)• Policy lever: bonuses to remain in the unit (rather than pay increases or bonuses for
overall retention)• Outcome measure: retention in the unit (rather than retention in the service).
In addition, all of the above estimates are subject to caveats about potential bias (upward or downward) due to unmeasured factors or reverse causality. For example, program managers may apply bonuses to particular occupations that face shortages at certain times. An observed difference in reenlistments between bonus and nonbonus groups may therefore be due partly to the shortage condition (which prompted the bonus) and partly to the bonus. Analysts have adopted estimation strategies aiming to adjust for such variations (such as controlling for occu-
25 Asch, Heaton, et al., 2010, p. 47. For comparison, the Congressional Budget Office (2007, p. 7) estimated the value of regular military compensation at $45,000 (single) to $47,200 (married) for an E5 with six years of service. Thus, the step 2 bonus for a three-year reenlistment would add about 11 percent to regular military compensation per year. A step 1 bonus would add half as much.26 For bonus effects, see Asch, Heaton, et al. (2010, p. 97), and Hosek and Martorell (2009, pp. 41–42). For marginal costs, see Asch, Heaton, et al. (2010, p. 101). The range arises from different methods of treating bonuses paid during deploy-ments. Second-term reenlistments are most appropriate here because they apply to a population of junior leaders (E5s in reenlistment zone B, six to ten years of service).

Stability of Unit Leadership 31
pation), but they caution that some bias may still persist and other biases are possible, a situa-tion that is unavoidable in observational studies (Hosek and Martorell, 2009, pp. 30–32).
How Could DoD Collect Data to Evaluate Policy Options?
Given these difficulties, we believe that it is too hazardous to formulate a bonus policy based on currently available information. If DoD should decide to pursue use of incentives to stabilize RC unit personnel or leadership, we would recommend conducting an experiment to obtain better information. In the past, DoD has conducted numerous experiments, particularly with enlistment incentives, which have proven very useful in formulating policy (see Polich, Der-touzos, and Press, 1986; Rostker, 2006). Experiments have many advantages. For example, one can design experiments to do the following:
• Allow precise formulation of the tested program, yielding data on the specific outcome of interest.
• Select target groups and limit offers only to them, ruling out others.• Allocate target personnel into matched “test cells” (say, by seniority, specialty, geographic
location, or unit type), offering separate incentive packages to people in each cell. • Randomly allocate large numbers of individuals to different offers. With sufficient sample
size, this virtually guarantees equivalence among recipients of varying offers and allows one to attribute results unambiguously to specific programs—an advantage that observa-tional studies never have.
• Establish a control group, allowing analysts to rule out extraneous effects, such as changes in the external environment (e.g., economic conditions, world events) and maturational effects (e.g., long-term secular trends that affect everyone).
In this case, a feasible approach would be to select matched groups of units distributed over different parts of the country, offering varying incentives to each group. An illustrative design for such an experiment can be found in Orvis et al. (1996).
However, it should be noted that experiments take time and effective policy control to be successful. Before embarking on such a program, decisionmakers should consider whether it would be worth the effort. Recent changes in the defense planning environment suggest that DoD may not need to mobilize and deploy large numbers of RC units in the near future.27 If that proves true, not only will demand decline, but the nature of the demand will change, and units may have time to adjust and prepare despite their leadership turbulence. The following chapters examine those issues.
27 The most-recent strategic guidance (DoD, 2012) implies that U.S. forces will soon shift away from large-scale stability and counterinsurgency operations, the types of operations (such as Iraq and Afghanistan) that have placed stress on the force and led to repeated RC unit deployments.


33
CHAPTER THREE
Preparing Reserve Component Personnel and Units for Deployment
The foregoing results imply that units will face considerable personnel turnover—due to many different causes, with no single easy fix. Because we observe the same turnover among leaders, much of the leadership will not be present early on and therefore cannot supervise or train with their subordinates during most of the premob year (although some of the nondeploying leaders will have long tenure and can support training even if they do not deploy).
Is such instability likely to affect RC units’ ability to meet future mission demands? The answer hinges on the match between the timing of such demands and the amount of time it takes to prepare RC units for the mission.1
The history of the OEF/OIF period teaches some lessons about the RC preparation pro-cess and amount of time that may be required—as well as the resiliency of the reserves. In this chapter, we report empirically derived information about the amount of preparation time that has been used by deploying units over the past several years. In the next chapter, we combine that information with foreseeable future mission demands, to explore whether, and in what circumstances, RC personnel and training readiness may pose a problem.
Premobilization Preparation and Training Requirements
What does the preparation process look like? The first thing to understand is that RC units face extensive predeployment requirements—and are likely to do so in the future. This list summa-rizes the nature of premob requirements that evolved during the years between 2003 and 2011:
• individual U.S. Army Forces Command (FORSCOM)/COCOM requirements – soldier readiness: e.g., personnel and administration, finance, clearances, wills, medi-
cal, dental, schooling – briefings (30 tasks) – weapons qualification: one or more individual and crew-served weapons – Army Warrior Training (32 tasks)
1 We cannot trace a definite link between leader turbulence and the efficiency of unit preparation. However, we can sug-gest reasons that the arrival of new leaders in a unit—especially in the last few months before mobilization—would increase workload and complicate training. After arriving in the unit, such a new leader would need to complete his or her own individual training and preparation for deployment, which will take time and divert attention from training subordinates or participation in small-unit training (such as squad maneuver, lane training, or urban warfare exercises). That would limit the training that can be done before mobilization.

34 Leadership Stability in Army Reserve Component Units
– battle drills (12 tasks) – leader tasks (22 general tasks and five mission dependent)
• collective tasks scheduled during premob period by some BCTs – base defense – counter-IED – mobile checkpoint operations – urban operations.
These requirements must be met by all members of units embarking on a deployment.First of all, units must ensure individual personnel readiness as required by the Soldier
Readiness Program (SRP). For example, all soldiers must meet standards for medical and dental conditions, preparation of wills, financial arrangements, security clearances, and numer-ous administrative requirements.
Second, the Army has mandated extensive premob training that must be done for all unit members. These requirements focus largely on individuals, rather than on collective train-ing. For example, requirements established by the COCOMs and FORSCOM mandated that individuals receive some 30 briefings, on topics ranging from language and cultural familiar-ization to combat stress and suicide prevention. Soldiers also had to qualify on their weapons, a process that requires access to ranges and appropriate weaponry; regulations also require that the qualification must have been done within a specified time period before deployment (say, six or 12 months). In addition, individuals needed to master 32 general warfighting tasks under the rubric of Army Warrior Training (FORSCOM, 2010).
Official guidance further required accomplishment of 12 battle drills, such as conducting patrols, reacting to contact, and evacuating casualties. In addition, NCOs and officers had to be trained on 22 leader tasks, plus five others that might be needed depending on the unit’s mission.
Third, beyond individual training, BCTs often scheduled training on some collective tasks before mobilization. These tasks included base defense, procedures to counter IEDs, checkpoint operations, and operations in urban terrain. However, most units planned to use the postmob period for the bulk of their collective training and for training focused on the specific mission.
Conducting that training created a crowded calendar in the months before mobilization. Figure 3.1 illustrates a typical training plan—in this case, for a particular MP company. It reveals how much unit activities during the premob period concentrated on individual train-ing and preparation.
For example, during the first four months (February through May), the primary activities were conducted on drill weekends, focusing on
• receiving new personnel and equipment• imparting fundamental skills and knowledge, such as driver training, military occu-
pational specialty qualification training, professional military education of individuals (NCO Education System [NCOES] and Officer Education System [OES]), and other schools
• accomplishing some of the steps in the SRP, which ensures that individuals have family plans, insurance and wills, security clearances, and medical examinations.

Preparing Reserve Component Personnel and Units for Deployment 35
In month 5, the unit conducted a three-week AT, which focused on Army Warrior Train-ing for all members present. Then followed two months when drill weekends were occupied by further training in fundamental individual skills, completing SRP preparation, and conduct-ing briefings for families. The next month (September) included special assemblies of leaders (E5 and above) (for example, to accomplish theater-specific leader training and “train-the-trainer” activity).
The final month (October) included a 28-day AT period in which the unit planned to carry out the following:
• inventory of clothing and equipment• theater-specific individual training
Figure 3.1Typical Company Preparation Plan Example: Military Police Company
SOURCE: Joint assessment conference briefing.NOTE: Blue indicates MUTA training (typically weekend drills); green indicates AT. MUTA = Multiple Unit TrainingAssembly (the number, e.g., the 4 in MUTA-4, indicates the number of four-hour blocks in the session).STAMIS = Standard Army Maintenance Information System. DMOSQ = duty military occupational specialtyqualification. NEF = new-equipment fielding. NET = new-equipment training. OCIE = Organizational Clothingand Individual Equipment. TSIT = theater-specific individual training. IWQ = individual weapons qualification.CSWQ = crew-served weapons qualification.RAND MG1251-3.1
AlertJoint
assessment
February March April May June
MUTA-4
MUTA-4 MUTA-4
MUTA-4 MUTA-4
Personnel and equipment fills
Driver training, STAMIS training, security clearances, DMOSQ, NCOES, OES
Ancillary schools, such as NEF, NET, and predeployment training
AT focus (maximumindividual training)• Army Warrior Training• June 7–27, 2008MUTA focus
• SRP 1 (March 10, 2008)• Medical and dental screening and treatment
July August September October November
Driver training, STAMIS training, securityclearances, DMOSQ, NCOES, OES
MUTA focus• Family briefs
MUTA focus• SRP 2 (July 19, 2008)
November 5,2008
Mobilization
Premob training 2a
Premob training 2b Premob training 2c
Personnel and equipment fills
Ancillary schools, such as NEF, NET, andpredeployment training
Focus• OCIE showdown• TSIT• 11 battle drills• IWQ and CSWQ• CLS (100%)• October 4–31, 2008
Focus• OCIE showdown and theater-specific leader training (E5 and above) September 20–26, 2008, home station• Police Training Team train the trainer (E5 and above) September 27– October 1, 2008

36 Leadership Stability in Army Reserve Component Units
• battle drills• individual weapons qualification and crew-served weapons qualification• combat lifesaver.
The common thread of these events is their focus on individual preparation and train-ing. The same focus appears in numerous other unit training plans, which were reviewed and approved at the unit’s joint assessment conference (normally nine to 12 months before mobi-lization, recently around 12 months). As we will see later, the units needed all of their premob time, and more, to complete their own individual training and other predeployment require-ments, such as SRP.2
Premobilization Training Accomplishment
The Army monitored and recorded the completion of key tasks for each unit being mobilized. We were able to secure data for each unit, showing the number of individuals who completed IWQ, CSWQ, theater-specific training, Army Warrior Training, battle drills, CLS, driver training, and other things. Those data permitted a unit-level calculation of individual training accomplishment: the fraction of all unit members who had completed all individual training called for, at the time the unit reached the mobilization station. Table 3.1 displays the results for three types of units.3
Consider first the training accomplished by the median unit (column 2). In the median BCT unit, 71 percent of the soldiers had completed training on all of the prescribed tasks. The median reflects the point at which half the units are above and half are below on the variable being tabulated. So this means that the “typical” unit stood at 71 percent; half of the units
2 In future deployments, it is possible that some of these requirements might be relaxed, particularly if the units are going to a benign or familiar environment. However, we observed that most of these briefings and training requirements were developed over a long period of time as the Army and COCOMs gained experience and learned that such preparation was necessary. Given the history, it is likely that the COCOMs would require this type of preparation for any sort of operation on the ground in a foreign country. Some of the training might be waived (say, some of the briefings about local conditions) if the personnel were to serve inside a compound or in an environment not requiring contact with the local population, but our review of previous operations and potential scenarios suggests that relatively few deployments are so restricted.3 For the tabulations in this chapter, BCT units include any separate unit identification code assigned to the BCT. Com-panies include MP, truck, engineer, and quartermaster units that deployed from 2007 through 2010.
Table 3.1Individual Training Accomplishment Before Mobilization
Unit Type
Percentage of Soldiers Completing All Tasks
Median 25th Percentile 75th Percentile
BCT unit 71 65 80
ARNG company 70 53 82
USAR company 79 68 89
NOTE: Includes individual tasks, such as weapons qualification, theater-specific training, Army Warrior Training, battle drills, CLS, and driver training.

Preparing Reserve Component Personnel and Units for Deployment 37
had more than 71 percent of their soldiers who completed all tasks, while the other half had 71 percent or less.
Table 3.1 also shows two other points in the distribution of units: the 25th and 75th per-centiles. Thus, among BCT units, one-fourth of the units (25 percent) had 65 percent or less of their soldiers completing the tasks. And, one-fourth of the units had 80 percent or more completing those tasks. This illustrates the considerable variability across units; some units managed to qualify the great majority of their soldiers, but many other units qualified only about half to two-thirds of them.
The picture among companies (MP and truck companies) was broadly similar. The median ARNG company had 70 percent of its soldiers who completed all the tasks, while the median USAR company had 79 percent. Nevertheless, it is clear that the demands of the mandated individual training were quite time-consuming and hard for the units to achieve. Despite the intensive efforts made by units and the chain of command, on average, 20 to 30 percent of the soldiers still needed to complete some training after mobilization.
What made it so difficult? In addition to the workload, we can identify numerous factors that impinge on a unit’s ability to complete all tasks before mobilization. Let us describe the most important of those factors:
• Equipment: Soldiers have to qualify on their weapons using appropriate body armor. However, up-to-date body armor may have been in short supply, and some weapons may have been required in theater but not organic to the unit. Appropriate night-vision equip-ment may not have been available. And the unit may not have had the kind of vehicles in use in theater.
• AT attendance: Some soldiers may be unable to attend AT, where many of these tasks were trained. Historically, about 70 to 80 percent of unit members attend AT. For longer ATs (greater than 15 days), some soldiers could not attend the entire period because of civilian job commitments.
• Personnel turnover: Many units receive a large number of new members in the last few months before mobilization. Even though the unit may have conducted training on certain tasks in the preceding months, the newcomers did not participate in those unit assemblies, and so, in many cases, they missed that training.4
Premobilization Training Time Investment
RC units invested a considerable amount of extra time during the premob year as they attempted to accomplish the prescribed training. As we saw in the illustration of the MP com-pany plan, many of the important training events occurred during special AT periods—often a unit would conduct two or more such periods during the year. We wanted to know how much time was invested to prepare unit personnel during the 12 months before mobilization.
4 The USAR attempted to cope with some of these limitations by operating Reserve Training Centers (RTCs) that pos-sessed equipment appropriate to the theater, necessary ranges and training areas, and observer-controllers to facilitate field events, such as weapons qualification, Army Warrior Training, and battle drills. In addition, to mitigate personnel turnover, a unit’s RTC rotation was typically scheduled very close to its mobilization date. RTCs may have helped USAR companies complete more premob events than corresponding ARNG companies. However, the RTC program may not be sustained in a future environment with infrequent mobilizations and more-limited resources.

38 Leadership Stability in Army Reserve Component Units
To gauge the training time invested, we tracked the number of AT days spent by each individual who deployed with the unit. We counted AT days by determining the number of full-time paid days that were recorded for each individual in the pay files.5 Table 3.2 summa-rizes the number of AT days during the premob year, for three types of units.
The median unit’s soldiers put in an average of 34 to 36 AT days. Typically, this was done in two separate AT periods—for example, one period lasting about two weeks and another lasting about three weeks. Because a typical unit in normal times has 15 days of AT time, that reflects a 19- to 21-day increment above the norm. As we have seen, units did accomplish a great deal in that time, but some individual training and much of their collective training still remained to be done after mobilization.
Postmobilization Training Time
In planning for the future, a crucial question is how long it will take for units to finish their preparation for deployment. That is, how long was the postmob training period?6
Assessing Duration of the Postmobilization Training Period
By aggregating individual personnel records, we identified the date of unit mobilization and the date when the main body of the unit arrived in theater. Table 3.3 shows the length of time for the postmob training period, under that definition.
For the median unit in a BCT, the postmob training period lasted 75 days—about 2.5 months. For the median ARNG company, which had fewer tasks to perform, the postmob training period lasted 57 days—or about two months.7 Separate USAR companies took a little less time—on average, 50 days.
As always, there was considerable variation around those values. One-fourth of the BCT units (the 25th percentile and below) took 69 days or less, while another one-fourth (the 75th percentile and up) took 80 days or more.8 The companies had a similar span of variation. Among ARNG companies, the interquartile range was from 46 days (25th percentile) to 66 days (75th percentile). Among USAR companies, that range was from 45 to 58 days.
5 The term AT days is an informal shorthand for our measure that includes all full-time paid days for unit personnel who generally serve part time. The calculation was limited to soldiers who mobilized with the unit. Soldiers who were paid for 28 days or more during the month were omitted because they were typically acting as full-time support personnel during the unit’s preparation period. We also omitted any days paid to personnel classified as Active Guard and Reserve.6 We term the period training informally, to distinguish it from the later period of operations in theater. In our measures, the length of the training period included all training, preparation, and transport time until the unit arrived in theater.7 The postmob period, as measured in our data set, includes about 15 days for nontraining activities required to prepare and send the unit to theater. That period typically includes three days at home station assembling personnel and equipment and preparing for unit movement, one day to move to the mobilization station, two days for reception and preparation at the mobilization station, four days of predeployment leave at the end of the training cycle, and five days loading equipment for shipment and moving personnel to the theater.8 The information tabulated here excludes two BCTs that were assigned counterinsurgency missions, which involved considerably more preparation. One of those BCTs spent 120 days in postmob status after 42 days of premob training. The other spent only 67 days postmob but spent 81 AT days in premob training. Both cases were outliers for this analysis and reflected an unusual mission, so we omitted them from these tabulations.

Preparing Reserve Component Personnel and Units for Deployment 39
We conclude that, under conditions prevailing in 2007–2010, BCTs would require a postmob period lasting between 2.5 and three months, whereas companies would require at least 1.5 months and typically two months.
Change Over Time in the Duration of Postmobilization Training Period
The above figures for postmob time are averages over our entire time period of observation, from 2007 to 2010. Because mobilizations have continued for so long, we wondered whether the duration of the postmob period may have declined as the system accumulated experience and, perhaps, could realize efficiencies. So we plotted the length of each unit’s postmob period by the date of mobilization.
The results show that, over time, units did use less time for postmob activities. However, the change appeared to be a one-time shift downward rather than a continuing trend. The amount of time used for postmob preparation and training initially declined over time but then held constant.
For example, consider Figure 3.2, which illustrates the trend for BCT units. BCTs that mobilized before early 2008 took an average time of more than 85 days. After that, the aver-age time was closer to 70 days. There was an apparent shift, but no linear trend after the shift occurred.
Table 3.4 shows statistics that document this shift for both BCTs and companies. In the center of the table is a shaded column labeled “Transition Date,” which indicates a particular time point when the transition occurred for each unit type. For BCTs, this dividing point was April 2008, whereas it was a little later for the companies.
To the left of the shaded column are several columns that report summary statistics for the units that mobilized before the transition date. For example, the median BCT mobilizing
Table 3.2Annual Training Days Spent in the 12-Month Period Before Mobilization
Unit Type
Number of AT Days
Median 25th Percentile 75th Percentile
BCT unit 34 27 44
ARNG company 34 27 43
USAR company 36 31 42
NOTE: AT days are defined as days paid for active duty during a given month, among personnel who mobilized with the unit and who were not full-time personnel during the month.
Table 3.3Duration of the Postmobilization Period Before Deployment
Unit Type
Number of Days to Complete Predeployment Preparation and Deploy
Median 25th Percentile 75th Percentile
BCT unit 75 69 80
ARNG company 57 46 66
USAR company 50 45 58

40 Leadership Stability in Army Reserve Component Units
before April 2008 took 87 days of postmob preparation. To the right of the shaded column are corresponding statistics for units that mobilized after the transition date. For BCTs, the median BCT mobilizing after that date took 72 days of postmob preparation. Thus, postmob time dropped by 15 days.
Figure 3.2Duration of the Postmobilization Period Initially Declined but Held Steady Thereafter
Jun-07 Sep-07 Dec-07 Mar-08 Jun-08 Sep-08 Dec-08 Mar-09 Jun-09 Sep-09 Dec-09 Mar-10
RAND MG1251-3.2
M-day
Post
mo
b d
ays
110
100
90
80
70
60
50
40
•••••• •
••••••••••••••
•••
•
••
•••••••
•••••••
••••
•••••
••
•••••
••••••••••••••• ••••
••••••
•••••••
•••
•
•
••
••
•
•••••••••••••
••
Table 3.4Change Over Time in Duration of Postmobilization Period
Unit Type
Duration for Units Mobilizing Before Transition Date
Transition Date
Duration for Units Mobilizing After Transition Date
Median25th
Percentile75th
Percentile Median25th
Percentile75th
Percentile
BCT unit 87 77 96 April 2008 72 67 77
ARNG company
67 62 74 December 2008
50 44 66
USAR company
60 58 62 September 2008
48 44 51
NOTE: Numbers indicate postmob days to complete predeployment preparation and deploy.

Preparing Reserve Component Personnel and Units for Deployment 41
The ARNG and USAR companies experienced a similar shift, though the overall amounts of postmob time are lower. The median ARNG company shifted from 67 to 50 days over time; the median USAR company from 60 to 48 days. Thus, postmob time dropped by 12 to 17 days.
The primary cause of this shift was a change in Army policy regarding the length of postmob training. In the early phases of OEF and OIF, some units conducted only modest amounts of premob training, leaving most training to the period after mobilization. However, in early 2008, the Army issued an order that limited the length of postmob training (for units whose missions could require them to operate outside base camps). This increased pressure to conduct more training during the premob period. Implementation of the order took some time to show effects because training plans for many units were fixed as much as one year in advance.9
Summary: What It Takes to Prepare for Deployment
Overall, what can we infer from the empirical data about the time required to prepare units for deployment? Table 3.5 summarizes the results we have derived. If the preparation process follows the patterns observed over the past decade, we would expect to find units operating under these timelines.
Line 1 shows that, before mobilization, the typical unit received about 35 days of AT.10 In lines 2 and 3, that amount is broken down into the number of “regular” AT days that would normally be allocated (15 days) and the additional amount (19 to 21 days) that they received because they were heading for mobilization and deployment. Line 4 reflects the post-mob period: After mobilization, BCTs took 75 days until arrival in theater, and companies took between 50 and 57 days.
9 The new policy was included in an execution order that, among other things, specified that units could have a maximum of 45 “training days” after mobilization (Department of the Army, 2008). This policy was consistent with guidance from the Secretary of Defense that limited total mobilization time to 12 months. The 12-month limit on mobilization increased pressure to shorten the length of postmob training in order to get the maximum “boots on the ground” time in theater.10 These AT periods were in addition to Inactive Duty Training (IDT) (typically conducted at weekend drills). Units gener-ally aim to conduct 24 days of IDT each year (two days, one weekend per month). However, the actual number of IDT days experienced by deploying soldiers while they were assigned to the unit was smaller (on average, about 15 days) because many new soldiers arrived in the unit soon before mobilization.
Table 3.5Observed Times Required for Pre- and Postmobilization Training: Recent Experience
Item Unit Type BCT Units ARNG Companies USAR Companies
1 Premob AT days 34 34 36
2 Regular AT days 15 15 15
3 Supplemental AT days 19 19 21
4 Postmob days 75 57 50
5 Supplemental AT plus postmob days 94 76 71

42 Leadership Stability in Army Reserve Component Units
We recognize that these observations are derived from a specific period of time whose characteristics might not generalize to other times and circumstances. Nonetheless, they are based on actual experience (rather than planning factors), and they are derived from the most extensive set of reserve mobilizations that have occurred during the past 50 years. Therefore, we use them as a basic yardstick or screening criterion to judge whether several classes of missions might allow sufficient time to prepare RC units for deployment.
What might happen in the future, if a unit were executing its normal training program and was then notified of an upcoming deployment? As a matter of course, such units would be executing their regular training: IDT drill and regular AT. Therefore, they would already have conducted that training (during the prior 12-month period). So if they required the same amount of preparation as the units in the historical record, they would still need the supple-mental AT days (line 3) and time for postmob training (line 4).11 Those totals are tabulated in the last row, line 5. For example, a BCT would need 19 AT days plus 75 postmob days, for a total of 94 days. Companies would need between 71 and 76 days.
We conclude, therefore, that, for a baseline case (with little or no advance notice), one should expect BCTs to require about three months of preparation (a little over 90 days) and companies to require about 2.5 months. Thus, any mission that allows the Army more than three months to plan and prepare units could be considered feasible for sourcing by an RC unit. If the circumstances allow less time, the feasibility is uncertain. In the next chapter, we use these approximate figures to judge whether foreseeable future missions might allow plan-ning and preparation time that falls roughly with those ranges.
A caveat: These figures are dependent on the conditions that prevailed during the period when the mobilizations occurred. During that period, many units were being mobilized over a long period of time; the units deployed on a predictable rotation schedule for a well-specified mission; and DoD had substantial resources available to support RC training (through supple-mental funding for overseas contingency operations). Those conditions afforded several advan-tages that we consider in the next chapter:
• Both deploying units and the chain of command had ample time for planning and assem-bling resources because they were aiming at a defined M-day. Typically, units were noti-fied of an upcoming deployment about one year beforehand.
• The Army was able to invest additional time in AT periods before the M-day—on aver-age, 19 to 21 days beyond the normal 15 days.
• Much of the AT activity could be clustered near the M-day. This permitted intensive training just before mobilization and minimized the subsequent time during which per-sonnel turnover or learning decay could erode training readiness.
• The content of the training could be honed over time and focused on specific, well-under-stood missions in environments (physical and cultural) that had become familiar to the U.S. military.
• The Army could maintain special, ready capabilities in the generating force—such as First Army training brigades, ARNG’s premob training assistance elements, and the USAR’s RTCs.
11 Naturally, there will be proposals to reduce this requirement by allocating more AT days in the future to units that are approaching their date for entering the Army Force Generation (ARFORGEN) available force pool. We examine that possi-bility in the next chapter. Such enhancements are uncertain, however, and, for this illustration, we disregard that possibility.

Preparing Reserve Component Personnel and Units for Deployment 43
Of course, those conditions might vary in the future. In particular, most of the above conditions depend on having sufficient advance notice of upcoming RC mobilizations. The question is whether future missions will permit such advance notice—enough so that the above amounts of training can be executed in time. The answer will depend on the nature and timing of missions that reserve units may be called to perform. To address that issue, the next chapter reviews several classes of scenarios that could involve reserve forces.


45
CHAPTER FOUR
Readiness for Future Missions
The empirical data presented above are based on recent experience in RC deployments. How-ever, the Army’s missions are changing as military forces draw down from continuing rota-tional operations in the Middle East. Current OSD planning guidance (DoD, 2012) suggests a coming reduction in tempo and curtailment of large-scale rotational deployments. That raises two questions: What future missions may require RC units, and how much time might those units have to prepare?
To address those questions, we reviewed OSD planning documents and service force gen-eration constructs pertaining to potential future missions.1 For RC units, those plans imply the following types of unit assignments:
• Allocated: These are units designated for definite upcoming missions, often for ongoing rotations. They have a defined mission and a specific planned date for arrival in theater.
• Regionally aligned forces (RAFs): These are units oriented to specific regions; the details of missions may be unclear, but the geographical and cultural environment is known.
• Homeland defense and civil support: Some units are to be prepared for specialized activities, such as response after a disaster or attack, or to support civil authorities in an emergency.
• Apportioned to war plans and contingency plans: These units are designated to sup-port specific plans that could call for rapid deployment of forces in a crisis or conflict.
We discuss each of these types in turn.
Allocated to Upcoming Missions
Units in this category have specific information about their mission and its timing.2 Current examples are rotations to Kosovo, MFO, and the Horn of Africa. In the near term, this cate-gory also includes planned deployments to Afghanistan. The missions are typically well defined and recurring, so the environment is well understood. All of them are likely to carry the same overall and theater-specific training requirements as we have seen in recent operations.
1 See, for example, DoD (2012) and Department of the Army (2011, 2012).2 Recent Army publications described such units as being in the Deployment Expeditionary Force. Other units are termed part of the Contingency Expeditionary Force (Department of the Army, 2011).

46 Leadership Stability in Army Reserve Component Units
Units that are allocated to definite missions are generally notified well in advance. Such units would almost certainly have many months advance notice—commonly as much as one year—and ample time to plan and train for their deployment. Their situation is similar to that of the deployments that we reviewed in Chapter Three. So we would expect them to complete their preparation on the timelines outlined above, which would ensure they were available for deployment at the scheduled time.
Regionally Aligned Forces
The Army must be positioned to respond to many possible demands, with wide variation in the geographic location, type of mission, and environment. Current plans envision that many such demands would be serviced by units in the RAFs, which are to be associated with a particular theater (Cox, 2012; McIlvaine, 2012).
RAFs are expected to be oriented toward engagement, security force assistance, conduct of exercises, and building partner capacity, under the supervision of the COCOM for the region. To facilitate such activities, RAF unit members are supposed to acquire some regional expertise, language and cultural awareness, and skills to operate in an advisory capacity.
A RAF is expected to include a BCT (a “regionally aligned brigade”) and associated enabler units and to operate in coordination with special forces (Hartmayer, 2011; Cox, 2012). RC participation is expected to include, among others, ARNG units within the State Partner-ship Program (under which a state’s Guard forces are aligned with a particular foreign nation) and USAR units, such as Civil Affairs battalions and headquarters. RAF units would retain that alignment throughout their ARFORGEN cycles.
Preliminary information suggests RAF missions that can be arrayed in two broad cat-egories: (1) theater security cooperation, generally planned in advance, and (2) unplanned or emergent requirements. Details of such missions are still evolving and are initially focused on the first RAF scheduled to be associated with U.S. Africa Command in 2013 (Ryan, 2012.) Table 4.1 lists examples of the two types of missions envisioned for a RAF aligned with that COCOM.
The focus of planned security cooperation missions is more on assisting local forces or authorities than on action in the field by U.S. forces. In many cases, the emphasis is on train-
Table 4.1Potential Missions for Regionally Aligned Brigades
Mission Type Examples
Security cooperation Military-to-military contactsDeployment assistanceTeaching courses: intelligence, logistics, tactics, policeTraining foreign forces (e.g., convoy security, IEDs)Exercise support and cooperationSecurity force assistance (noncombat)Humanitarian assistance (e.g., food, medical care)
Potential emergent Urgent humanitarian actions (e.g., anti-mine)Noncombatant evacuationCounterinsurgencyCounterdrug operationsQuick-reaction force operationsDirect or combat action

Readiness for Future Missions 47
and-advise functions and on building partner capacity. For example, these anticipated missions would involve training foreign security forces, assisting in their exercises and education pro-grams, and establishing personal contacts and ties (military to military). In such cases, action by hostile or opposing forces is unlikely to be a major factor.
For many of these missions (e.g., teaching at institutions or humanitarian assistance), the operational training requirements may be minimal; the primary requirement may be compe-tence in the soldier’s or unit’s basic tasks (such as transportation or MP functions). The core set of additional skills to be trained would probably resemble what we saw earlier for any unit deploying overseas: cultural familiarization, informational and procedural briefings, theater-specific requirements, and so forth.
Although meeting those requirements can be time-consuming, the preplanned missions can be identified well in advance. In addition, ARNG state partnership programs already exist and provide a basis for developing cultural familiarity and knowledge of conditions in the the-ater. Indeed, some planning for regionally aligned brigades supposes that one RC brigade will operate in support of and in coordination with its AC counterpart. If that tie has been estab-lished, the AC brigade (and special forces) would already have established a presence and base of knowledge about the environment—the specific country, its culture, ethnic groups, terrain, infrastructure, and so forth. The RC unit’s members would benefit from that knowledge, and, if the unit is brought in to perform a follow-on or support function, the situation should allow ample time to prepare.
What about emergent or unplanned missions, such as evacuating noncombatants from a dangerous area, or undertaking missions that could eventuate in armed conflict? Those requirements might arise in an emergency or when a U.S. force is operating in an environment where organized opposition may be expected. Under such conditions, especially when the mis-sions are unplanned, active units would almost certainly go first, often in conjunction with special forces.3 If continued for an extended period of time, the Army might eventually need replacement units to rotate into theater. The role of RC units would most likely be to fill some of these rotational requirements. Therefore, RC units should expect to receive sufficient notice to prepare for these rotations, and they could continue their regular training until notified of an upcoming deployment.
Homeland Defense and Civil Support
The next category of potential missions is homeland defense and civil support. Examples of this type of mission include the following:
• border security and surveillance• counterdrug operations• law enforcement support (trafficking in persons, money, weapons)• infrastructure protection
3 It is possible that some RC units could be sent quickly (for example, to provide transportation or relief supplies for urgent humanitarian assistance) if active assets were not available. Those units would probably be performing functions closely related to their typical unit training (e.g., operating trucks or aircraft) or providing general support that would not require specialized training.

48 Leadership Stability in Army Reserve Component Units
• natural disaster response• chemical, biological, radiological, and nuclear (CBRN) response• homeland defense and quick-reaction response• emergency operations centers and command and control.
Because they involve coordination with local civil authorities and RC personnel may sometimes operate under state control, ARNG has particular relevance here (although USAR assets may also be needed because of their specialized aviation, medical, communication, and logistics capabilities).4
Some of these missions are planned in advance and therefore allow ample time for RC preparation; examples are border security, counterdrug operations, and infrastructure protec-tion. The others can be divided into two broad groups: response to natural disasters, such as storms, floods, earthquakes, or wildfires; and response to CBRN incidents.
Natural disaster response missions could involve quite short notice. However, they are also likely to require minimal premission training. In many cases, units will be sent to perform missions that closely resemble the mission essential task list for their types of units (such as air or ground transportation, traffic control, or security); in other cases, they will form a pool of personnel available for duties that do not require highly specialized skills (e.g., constructing temporary flood barriers, debris removal, road clearance).
CBRN response may involve more-specialized skills that are not likely to be trained or practiced frequently during a typical unit’s activities. As a result, various specialized RC response forces are being established or planned. These include RC elements that contribute to the Defense CBRN Response Force, to provide such capabilities as search and rescue, evacu-ation, decontamination, medical triage, aviation, and logistics. The National Guard is also establishing ten Homeland Response Force units, one for each Federal Emergency Manage-ment Agency district, oriented toward rapid deployment in emergencies; and 57 weapons-of-mass-destruction civil support teams that assist in identifying toxic agents and determining appropriate response measures (National Guard Bureau, 2012). It is expected that individual personnel or units that may be assigned specialized missions will be identified well in advance and will receive specialized training. It seems likely that such specialized training would take precedence over regular training, so those units might not be available to serve other purposes during the portion of the cycle when they have a CBRN assignment. However, they account for a small fraction of the RC force; each of the Homeland Response Forces, for example, is planned to contain 566 personnel, and a weapons-of-mass-destruction civil support team con-sists of 22 full-time personnel.
Operational Surge and War Plans
The final category consists of missions associated with war plans and contingency plans, which call for an operational surge. In this case, an RC unit might be called on short notice to serve in a major crisis or conflict. In such an event, typically, AC units would respond first, leaving
4 For a review of these types of missions and capabilities needed to execute them, see Advisory Panel on Department of Defense Capabilities for Support of Civil Authorities After Certain Incidents (2010) and RC posture statements (National Guard Bureau, 2012; U.S. Army Reserve, 2012).

Readiness for Future Missions 49
most RC units more time to prepare. However, there are some types of units that exist only in the RCs, or the AC might contain a small number of such units, but the requirement could call for more units than are available in the AC.
We have not reviewed the detailed classified plans to determine the speed with which specific RC units might be needed or how much notice might be given. If this proves to be a serious concern, then a special study should be conducted, consulting the time-phased force and deployment data for particular plans.
However, we can outline the factors that would affect the time available for RC units to prepare and reach some tentative conclusions about the time pressure that they might encoun-ter. Figure 4.1 depicts the process that would precede deployment of an RC unit under condi-tions of relatively short notice. Factors that are external to the unit are shown in blue. Factors pertaining to the unit’s training and preparation activities are shown in green. The events por-trayed are mostly events that would occur within the available year or just before it.
Factors Affecting the Amount of Time AvailableWarning and Notification
The process begins with the events shown in blue at the left. In many cases, the United States would have advance warning of an impending crisis that could lead to military operations. For example, a period of increasing international tensions or terrorist activity might create a cli-mate in which decisionmakers would anticipate possible deployments. The earlier the warning, the more time that DoD would have to take preparatory steps—including, perhaps, informing units of possible deployments and enhancing their readiness posture and training resources.5 If warning and formal notification of sourcing occur early enough, the unit might have ample time to prepare (say, 75 days for a company or 95 days for a BCT) before the onset of the operation.6
Deployment Within Force Flow
Another key external factor is the required D-day, shown at the extreme right. Even when an operation requires RC units, those units may not appear early in the force flow because some AC units may be available earlier or because of transportation constraints. Thus, in a case of short warning, an RC unit may still have enough time to prepare if it is scheduled relatively late in the time-phased deployment schedule.
Planning and Resourcing
After a unit is notified, the training base and chain of command will need to assemble resources to support the upcoming mobilization. In recent years, First Army and mobilizing units began the process with planning conferences and joint assessment conferences about one to two years before mobilization, to coordinate their activities and marshal the necessary resources. For example, a mobilizing unit may need training ranges for gunnery, weapons qualification, and maneuver; additional equipment or enhanced maintenance to ensure that equipment is opera-tionally ready; specialized equipment for conditions in the theater; trainers, evaluators, and
5 However, political constraints could preclude taking highly visible actions, such as mobilizing reserve units or beginning intensive training. In many historical cases, governments have been reluctant to indicate they are preparing for a conflict, lest the actions prompt an adversary’s reaction or complicate diplomatic initiatives.6 These estimates apply to missions similar to those of recent years. However, it would most likely take longer to prepare large-scale units for more-demanding missions (e.g., BCTs preparing for combined arms maneuver in combat).

50 Leadership Stability in Army Reserve Component Units
possibly an opposing force for exercises; or access to a combat training center or other facility for a mission rehearsal exercise. In addition, the unit may need extra paid time for leaders to plan and prepare, and extra full-time support personnel to manage training events and SRP actions.7 And of course, numerous new personnel who are cross-leveled into the unit will need to be integrated and trained, either before or after mobilization.
Particularly if many units are being mobilized at once, the Army may need a “warm” base in the generating force to support quick processing and training. If the deployment was anticipated because of previous planning or early warning, these steps may have already been taken. However, if the training base is not readily expandable to meet the throughput demand, bottlenecks could impose delays, especially for RC units (which may be accorded lower priority than early-deploying AC units).
Premobilization Training and Preparation
We assume that the unit to be mobilized is within the available year of its ARFORGEN cycle.8 A unit in the available window will have at least one AT period during its available year and will have had at least one AT during the preceding 12-month period (which we describe as
7 RC units mobilizing for OEF and OIF received a considerable amount of additional full-time support. For example, we examined the number of full-time personnel working in a mobilizing unit (including M-day personnel working full-time and Active Guard and Reserve personnel) between M – 12 months and M-day. That number rose by about 90 percent in BCTs (starting at a baseline level of 325 full-time personnel) and by 50 to 75 percent in MP and truck companies (starting at a baseline level of seven to 11 full-time personnel).8 The ARFORGEN concept calls for RC units to plan for a one-year period of availability within a five- or six-year cycle. The cycle length depends on demand relative to supply (Department of the Army, 2011). For purposes of discussion, we assume a five-year cycle, which is consistent with OSD planning parameters, although the same logic can be applied to any other cycle length. During the first three years of the cycle, the unit undergoes reset and initial training; during the fourth
Figure 4.1Key Events in Reserve Component Preparation for a Short-Notice Deployment
NOTE: Blue = factor that is external to the unit. Green = factor pertaining to the unit’s training and preparationactivities. The events portrayed are mostly events that would occur within the available year or just before it.RAND MG1251-4.1
Mobilization
Premobpreparationand training
Previous ATs(variable dates)
Length affected byprevious AT focus
and timing
COCOMrequirements
Postmob training
Start ofintensivetraining
Plan andresource
Notify
Warning
Deploy
Time-phased forceand deployment data:
Unit deploymenttiming in flow
Premobresourcesassembled
Advancewarning ofpotential
crisisUnit notified:
Plan tomobilize and
deploy

Readiness for Future Missions 51
the preavailable year). If the unit has been apportioned to a war plan or contingency plan, it is likely that its previous AT (and IDT assemblies) focused on the tasks that will be required in theater. If so, some or all of the training during those assemblies will have been devoted to predeployment training for this mission—which would shorten the remaining time required.
The amount of training might also be adjusted to meet impending timelines. If the unit was known to be needed early in the force flow, DoD may have allotted additional training days to enhance the unit’s premob readiness. Alternatively, some of the detailed requirements that were imposed during OEF or OIF might be waived for some types of units that operate in low-risk environments or have little exposure to foreign populations (e.g., postal delivery, administration, port operations).
Postmobilization Training
Finally, the unit will undergo its postmob training and preparation immediately before deploy-ment. Much of the required training might be scheduled after mobilization because training might be completed more efficiently in a postmob environment—using a centralized facility with resources not available at home station or AT sites. If a postmob training site is ready and capable of quickly processing units (e.g., for “roll-on, roll-off” training), it could shorten the postmob preparation period.
This discussion points out many ways in which the sequence of events could allow RC units time to prepare: They might get adequate warning. They might be notified promptly of sourc-ing for the operation and given specific requirements from the COCOM and FORSCOM. The resources they need might have been prepared in advance, and mobilization stations or train-ing centers could be ready to receive and process them quickly. They would most likely have trained on the required mission-focused tasks during their previous IDT and AT assemblies—especially if they were apportioned to a war plan. The postmob training system is likely to have more resources than home station or AT sites, so the postmob environment may accelerate their preparation and allow training for some tasks to be done more quickly than if it had been attempted during the premob period.
Possible Actions to Mitigate Time Pressure
We would anticipate that at least some of the above factors are likely to operate to allow RC units time to prepare in a scenario associated with a war plan or contingency plan. However, what if events work out so that many of the factors operate in an unfavorable direction?
For example, suppose there is very little warning; the unit receives notification of sourcing only one to two months before the start of an operation; the unit is needed early in the force flow; the nature of the operation is different from what was foreseen, so previous training is not fully relevant to the tasks at hand; the generating force has atrophied so that the Army cannot provide a ready set of trainers and training support facilities; and so forth. Admittedly, it seems unlikely that all of those unfavorable conditions would occur, especially in a period of tensions that would probably precede a major crisis or conflict. But if they did, what could be done to mitigate the time pressure and attendant risk to the deployment timeline?
The conventional response to time pressure in RC mobilization planning has been to attempt more training before mobilization—if the requirement for mobilization can be antici-
year, it prepares for possible mobilization (if that seems plausible). During the fifth, it is in the available window, meaning that the unit would most likely be one of those selected to mobilize and deploy if operations required a unit of that type.

52 Leadership Stability in Army Reserve Component Units
pated. In a short-notice situation, however, no one would know in advance whether a mobili-zation might occur. Given the Army’s published ARFORGEN plan, conducting more premob training would mean enhanced training activity during the available year and the preavailabil-ity year.9 Both years would have to be covered because no one could predict whether or when the unit might be mobilized, other than the fact that mobilization might occur sometime during the available year. In each year, a primary vehicle for increasing training time would be to lengthen the existing AT period or add another AT period (say, to provide another 15 to 20 days of full-time training).
In effect, DoD and the Army would be investing in additional training time and resources to hedge against the possibility that the unit will be needed in the near future. In an era of tight budgets, it may be difficult to fund additional training for uncertain future missions. Another consideration would be the potential negative effect of increased training burden on soldier participation; for example, if AT periods are lengthened or additional ATs are held, some unit members may not be able to attend because they cannot take the time away from their civilian jobs or families. And of course, personnel turnover would also detract from the effect of train-ing done before mobilization.10
Those factors would limit the effect of the added premob training. Let us outline how those limitations would operate. Suppose that DoD, as a hedge, planned to increase training during the preavailable year. Suppose, for simplicity, that the enhanced AT ends in the middle of the preavailable year and mobilization occurs in the middle of the available year.11 That means that there will be a one-year interval between AT and mobilization. How many mem-bers who participated in that AT will still be present in the unit and able to deploy? The size of that group will be affected by three factors: AT attendance, personnel losses, and nondeployers. Here is an outline of how those factors would affect the outcome, using infantry battalions as an example.
Annual Training Attendance
Some unit members are unable to attend AT because of civilian employment commitments, attendance at other Army schools, or other reasons. Historical data from previous research and communications with OSD suggest that typical AT attendance rates are about 70 to 80 per-cent.12 We cannot predict those rates for the future, but, for this exercise, we will assume the higher figure of 80 percent, on the theory that units approaching the availability window may make special efforts and receive high priority to ensure that more of their personnel have com-pleted individual training and are available to attend AT.
9 Even if most prescribed procedures are completed during the preavailability year, ongoing personnel turbulence may require additional training during the availability year.10 Another factor is the requirement for recency of specific training events. In the past, COCOM and FORSCOM guid-ance has required that certain training events, such as weapons qualification, must be done during a specified period before deployment (say, six or 12 months). If such guidance were in effect, adding training time earlier in the cycle would not obvi-ate the need to do it again during the period before mobilization.11 The exact timing of these events cannot be predicted. The interval between AT and mobilization could be shorter or longer, but, as we will see, the results do not differ sharply based on reasonable variations in the interval length.12 Historical data indicate that AT attendance rates for large units have typically ranged around 70 percent (Sortor et al., 1994), although subsequent policies required a minimum attendance rate of 75 percent (U.S. General Accounting Office, 1995). Many of the personnel who did not attend AT missed it because they were attending Army schools to meet qualifica-tion requirements for their grades or positions.

Readiness for Future Missions 53
Personnel Losses
Some people will leave the unit during the interval. In the empirical data reviewed above, we observed that infantry battalions lost about 25 percent of their members annually. So after one year, the number of remaining unit members who participated in the previous AT will be about 75 percent.
Nondeployers
Among the unit members still present at mobilization and deployment, some will not deploy. Previous analyses (Lippiatt and Polich, 2010) found that, among “stable” personnel in an infantry battalion—those who had been in the unit for one year or more at the time the unit deployed—about 25 percent did not deploy.13
Effect of the Above Rates
These patterns exert a considerable effect on the size of the original unit membership cohort (those in the unit at the preceding AT) who will reach the deployment point and actually deploy. We can estimate the resulting fraction as follows:
fraction attending AT fraction remaining after losses fraction of members deploying .( ) ( ) ( )× ×
Assuming the above rates, that product is 0.80 0.75 0.75 0.45.× × = That is, 45 percent of unit members who were in the unit at the time of the original AT will participate in that AT, remain in the unit, and deploy with it.
Alternative Assumptions
The timing of the previous AT and mobilization would, of course, affect the outcome. For example, assume a more favorable case: Suppose one final AT period is conducted as “con-tiguous” training, shortly before the unit’s entry into the available window—say, during the 11th month of the preavailable year—and suppose further that mobilization occurs very soon thereafter—say, during the third month of the available year. Then there would be only a four-month interval between the last AT and mobilization. That would reduce the personnel loss rate to 8.3 percent, meaning that the second fraction above would rise to 0.917. If the other factors would remain the same, the product would be 55 percent. On the other hand, a heavier burden of contiguous training could cause AT attendance rates to drop. If they dropped only slightly—say, from our optimistic assumption of 80 percent to the historical pattern of 70 percent—the above calculation would yield a product of 48 percent 0.70 0.917 0.75 .( )× ×
The effect of training done during earlier years would drop off even more sharply. Con-sider, for example, enhanced training conducted during the year preceding the preavailable year (e.g., the third year of a five-year cycle). The cohort that participated in AT during the third year would be affected by another year’s worth of personnel losses, which would add another factor of 0.75 to the expression above. Factoring in that number yields an estimate that only 34 percent of personnel in the cohort in the third year would get the AT and remain to deploy during the available year.
13 The numbers used in this illustration are approximations using rounded figures; the specifics would vary somewhat depending on the type of unit. Our detailed data show that infantry battalion annual loss rates were 26 percent, on average. Nondeployers represented 27 percent of infantry battalion members who had stayed in the unit for 12 months or more.

54 Leadership Stability in Army Reserve Component Units
Thus, it seems that routinely adding AT time for the years preceding availability would not reduce required preparation for many people who deploy with the unit. At best, the addi-tional training would benefit only about 50 percent of deploying unit members. All of the remaining members would still need to undergo the training that had been done earlier. Fur-thermore, DoD would have invested additional funds in all of the unit’s participating mem-bers, which could be an appreciable expense.14
Actions to Mitigate Risk
How, then, might DoD proceed to mitigate the risk to deployment timelines? As a first step, of course, deliberate plans should recognize the time required to prepare RC units as we have outlined, so that RC units are slotted in deployment plans only in cases in which they can rea-sonably expect to meet the required timeline.
However, even if that is done, it is possible that events would not unfold as expected or that unanticipated conditions could require a faster response than planned. To hedge against the risks inherent in short-notice contingencies, we suggest three further courses of action.
First, determine how many units and personnel are likely to be affected by a short-notice deployment. Many types of units will not be needed early in a scenario. The potential problem may apply only to a small number of units—which themselves may be relatively small ele-ments. A first step would be to examine specific plans to identify the number and size of the units whose timelines might be at risk.
Second, if the risks seem significant, DoD might decide to enhance AT periods during the preavailability year, despite the limited effects outlined above. Doing so would at least give a portion of the unit some desirable training experience, which could eventually benefit the entire deploying cohort.15
Third, to minimize the effects of personnel turbulence and AT attendance, DoD could experiment with retention bonuses to induce people to remain and participate in unit activities from the preavailability AT until the end of the available year. As outlined earlier, such experi-ments, if carefully designed and executed on an appropriate scale, can yield credible data on effects and costs. If bonuses proved to be effective in retaining personnel and increasing AT attendance, they would enhance the value of doing additional training during the earlier year. Such a program might be economically feasible if the number of affected personnel is fairly small (say, a modest number of companies rather than all units or all large formations, such as BCTs).
However, as we argued in Chapter Three, currently no credible information exists to esti-mate the size of bonuses that would be needed to achieve a given effect. Therefore, if a bonus program is being considered, it would be prudent to mount a controlled experiment to assess the effects and costs of alternative bonus programs.
14 For example, suppose the unit conducts one additional AT of 21 days length during both year 4 and year 5. Therefore, during each of those two years, the unit’s participating soldiers would receive pay for 36 days instead of 15 days. Over a five-year cycle, AT pay would increase to cover 117 days 2 36 3 15( )× + × compared with 75 days 5 15( )× without the additional AT time. That would represent an increase of 56 percent in payments for AT time. In addition, DoD would incur other costs—for example, to pay for temporary full-time support personnel, consumables, and other items.15 If the risks are viewed as severe, an alternative would be to move some early-deploying units from the RC to AC. That would reduce the risk but would impose other costs for force structure changes, which we do not attempt to analyze in this monograph. Alternatively, the Army could plan to mobilize such RC units as early as possible in order to minimize the effects of personnel turbulence.

55
CHAPTER FIVE
Conclusions
The analyses in this report yield two types of results and conclusions. First, we have empirical observations that quantify the extent of personnel turbulence in RC units, its sources, and its effects. Second, we have recommendations about DoD policy: whether turbulence should be regarded as a significant problem or risk, and, if so, how DoD might take steps to mitigate that risk. This chapter reviews information on those two topics and highlights their implications.
Personnel Turbulence: Widespread and Persistent
RC units approaching mobilization face notable levels of personnel turbulence among both unit leaders and their subordinates. This turbulence is manifested in two main ways.
First, people leave the unit in the normal course of events, either because they are separat-ing from the service or because they are moving to another Army unit. The typical unit loses 30 to 50 percent of its officers over a 12-month period.1 NCOs are more stable, but, even so, the typical unit loses about 25 percent of its NCOs each year.
Second, an appreciable fraction of the personnel in the units do not deploy. For example, we found that about 30 percent of officers and 20 percent of NCOs assigned to the units at D-day did not deploy with the units.
These patterns of turbulence are persistent and pervasive. The loss rates apply not only to the period before mobilization but also to earlier periods in the cycle (for example, to the period between M – 24 and M – 12 months).2 Similar levels of turnover were found among all types of units studied, among all grades of personnel, and in both active and reserve forces.
The fact that turbulence has persisted in wide sectors of the force, despite official concerns about it, suggests that it has been difficult to prevent or control. Indeed, when we looked for underlying factors by tracing the characteristics of losses and nondeployers, we found many discrete causes of turbulence, some of which were benign (such as soldiers moving between units for promotion or earlier deployment). Other cases probably represent an Army accom-modation to a soldier’s preferences or personal hardship; the Army may have preferred to defer a member’s deployment or permit movement to another unit rather than risk losing the person altogether. Furthermore, each underlying factor accounts for only a small fraction of the over-all rate. Even if separate policies addressed several individual causes, and even if the interven-
1 These are median loss rates for several types of units. We quote a range because the median varies for different unit types.2 In earlier research, we found similar results for a baseline period based on calendar year 2000 (Lippiatt and Polich, 2010).

56 Leadership Stability in Army Reserve Component Units
tions were successful for those particular causes, the net result would reduce turbulence rates by only a few percentage points.
From all this, we conclude that DoD has dim prospects for significantly reducing person-nel turbulence. The most attractive policy option to affect turbulence rates would be to offer bonuses for remaining in the same unit, but there are no credible, empirically based estimates of the effects or costs of using bonuses in that way.
Effects of Turbulence on Preparation and Training
Personnel turbulence has two important effects on preparation and training. First, turbulence erodes the effect of preparation over time. For example, if a unit conducts a training event or exercise in a given year, by the next year, about 25 percent of the people who experienced it will have left and will have been replaced by newcomers. The longer the elapsed time since the training event, the greater the turnover, and hence the greater the erosion of the training effect.
The same is true of many actions taken to ensure personnel readiness. In effect, many steps in the SRP process have a short “half-life”: The requirements to be satisfied (such as medical evaluations, financial and family arrangements, or weapons qualification) need to be checked periodically—in some cases, shortly before deployment.
As a result, units often conduct much of their premob training in the months just before mobilization—a practice known as contiguous training. Contiguous training was scheduled in many unit training plans, and our data showed that a large fraction of full-time training days were spent during the last two months before mobilization. Thus, unit commanders and the chain of command recognize the erosion effect and take concrete steps to counter it.
Second, personnel turbulence creates a large influx of new arrivals in the unit during the last few months preceding mobilization. For example, about 40 percent of infantry officers and 35 percent of infantry NCOs who deployed had arrived during the six months before mobi-lization. Those newcomers face extensive requirements for individual preparation and train-ing, which they would not necessarily have executed in their original units.3 To satisfy these requirements, units must repeat some training, making the process less efficient, or they must postpone training until the new personnel have been absorbed, which stresses the schedule in the late part of the premob period. The result can stretch out preparation time or cause some activities to be deferred until after mobilization.
Nevertheless, it should be noted that the system proved resilient; units generally had a stable cohort of personnel by the mobilization point, and virtually all units met their planned arrival date in theater.4 Why, then, is turbulence viewed as a significant problem? The funda-mental answer, as we see it, is that turbulence slows preparation of units and limits what they can accomplish before mobilization.
3 In OEF and OIF, a unit approaching mobilization typically focused on very specific tasks (primarily SRP actions and individual training, much of which is specific to the theater or mission); those tasks were not likely to have been covered in a source unit that was not anticipating a near-term deployment.4 LADs are set by the COCOM based on the commander’s concept of operations and forces that are needed to support it. They are rarely slipped. Once the LAD is established and a unit is assigned to it, the unit and its chain of command strive to meet it.
Conclusions 57
Preparation Time
If preparation time runs too long, it may pose a risk to deployment timelines, especially for short-notice requirements.5 Before 2002, DoD had little reliable information on RC unit prep-aration times, but the past decade has produced many real-world observations on it. There-fore, we collected and analyzed data on the amount of premob and postmob training time expended. The results provided estimates of several key parameters:
• In the typical unit, deploying personnel spent about 35 AT days during the premob year, in addition to their weekend drill time.
• The postmob period typically required about 75 days for BCTs and 50 to 60 days for support companies.
What does this say about the amount of time that a typical unit would need, if alerted for an operation in the future? We calculated the potential time required, assuming that a unit were called during the one-year period in its “available” window within the ARFORGEN cycle. In that situation, the unit would already have executed its normal 15-day AT within approximately the past year. So if the unit required the same amount of preparation as observed in recent operations, it would still need about 20 additional AT days plus postmob time. Con-sidering those additional days together with the previously observed postmob times, the time from alert to availability in theater would be 94 days for a BCT and 70 to 80 days for a sup-port company.
Of course, these estimates are derived from a particular era and context, which might not apply to a future mobilization. However, the data are based on real experience, and they offer the best empirically based information that has become available in the past 50 years. There-fore, we used these estimates as a guide to judge whether various potential future missions would allow sufficient time to prepare RC units for deployment.
Meeting Future Mission Timelines
How much time will foreseeable future missions allow for RC units to prepare? We reviewed four types of missions considered in current defense planning. We judged that three of those mission types would be likely to allow adequate preparation times:
• Allocated for definite missions: If a unit is designated for a definite upcoming opera-tion (such as rotation to Kosovo, the Horn of Africa, or MFO), it will be notified well in advance—usually one year or more. Those units could prepare as they have recently, and they would have ample time.
• RAFs: Some units will be oriented to specific regions, for such missions as training and advising, security force assistance, exercises, or building partner capacity. Those missions will be planned well in advance, and RC units would have time to prepare. If unplanned
5 Note, however, that turbulence also comes with other disadvantages. In rotational missions, such as OEF and OIF, it increases pressure for a longer postmob period, which would reduce boots-on-the-ground time (when mobilization is lim-ited to a fixed duration). It increases workload, preoccupies command groups and planners, and prompts repeat training. It limits the continuity of unit leadership (if many leaders are new arrivals). Finally, it impedes progression of training to more-demanding tasks, from individual to small-unit and collective training, and from simpler tasks to more-challenging activities that depend on the lower-level tasks as a foundation.

58 Leadership Stability in Army Reserve Component Units
missions arise, especially if they involve direct conflict, active units or special forces would deploy first, and RC units would probably deploy only as follow-on or rotational forces—allowing them enough time for preparation.
• Homeland defense and civil support: Some units will be slated for disaster response or emergency support to civil authorities. Many ongoing civil support missions, such as border security or counterdrug operations, are planned in advance and allow time for preparation. Many unexpected missions, such as disaster response, require activities that are on a unit’s mission essential task list (such as transportation or traffic control) or do not require specialized skills.6
However, for the fourth type of mission, the timelines could potentially be at risk:
• Short-notice deployments in a wartime or crisis situation: In such deployments, many factors would affect the urgency with which RC units could be needed. For example, if there is actionable advance warning, DoD might take steps to notify RC units of a potential deployment and to marshal resources, such as equipment, ranges, supplies, and trainers. Even if early warning is not available, RC units might be scheduled late in the force flow, particularly if AC units deploy earlier or the flow is limited by transportation constraints. If the unit was included in a war plan, its previous training is likely to have focused on the mission and to have covered some of the necessary preparation.
These conditions could plausibly allow an RC unit two to three months to prepare before it must deploy. However, what if some of those conditions are absent—and therefore the unit has less time? What could DoD do to mitigate the potential risk to deployment timelines?
Mitigating Risk for Short-Notice Missions
The conventional response would be to increase the amount of premob training to shorten the postmob period. Under the Army’s ARFORGEN program, that would mean conducting more premob training (beyond IDT and a normal 15-day AT) during the available year and the year preceding it. Such a plan, however, has some downsides.
Problems with Increasing Training Before the Available Year
To begin with, DoD would be investing in additional training time and resources as a hedge against a possible requirement that cannot be predicted. The investment would involve not only unit members’ AT time but also full-time support, trainers, and supplies.
Moreover, the benefit would be limited to a fraction of the unit’s membership because of the problems of AT attendance, personnel turnover, and nondeployers. We estimated that the combination of those three factors would mean that only about 50 percent of deployers in the unit would actually benefit from additional premob AT. The longer the lag between the AT and mobilization, the smaller that number would be.
Therefore, we conclude that adding AT time during the year preceding availability could impose appreciable costs but yield limited benefits. All of the remaining unit members would still need to get the training that had been done during the preceding AT. The need to repeat
6 A challenging mission could be response to CBRN incidents. Plans for CBRN units indicate that they should receive specialized training and be dedicated to those missions for a considerable length of time so that they can be ready to respond on short notice.

Conclusions 59
that training could slow the preparation process and dilute any advantages that the additional AT had conferred. More generally, these considerations cast doubt on the feasibility of stretch-ing out premob training and attempting to build unit readiness sequentially over several years. Capabilities that are built up in earlier years are likely to be eroded over time by AT absences, turnover, and nondeployment.
Potential Policy Response
We recognize that this situation may pose a risk that DoD would find unacceptable, at least for some units that may be needed early in an operation. Therefore, we recommend three steps to measure and mitigate any such risk, if DoD decides to consider investing in additional premob training.
First, analysis should determine which types of units would be seriously affected by short notice—those whose timelines could be at risk. There may be few such units, and they may be small, which would minimize the needed investment.
Second, if the risks appear serious, DoD could supplement the number of AT days in selected units during the availability year and the preavailability year of the ARFORGEN cycle. Those AT days would provide enhanced training experience to some unit members, although they may be a minority of the deploying unit.
Third, DoD should consider offering bonuses to leaders and key members if they attend AT and remain in the unit during the preavailability and availability years. As part of any bonus program, DoD should undertake a controlled experiment, offering varying bonus pro-grams to matched, like-type units or individuals (including no bonus, as a control group). Such experimentation would provide valuable data to reveal the true cost and benefits of a bonus program and thereby help assess the utility of enhanced premob training.


61
APPENDIX
Supplemental Data
The tables in this appendix provide data for all five classes of units in the stability analysis (infantry battalions, ARNG and USAR MP companies, and ARNG and USAR truck com-panies). They supplement corresponding figures or tables in the main body of the text, which frequently illustrate a result for one specific subgroup (such as infantry NCOs).
Table A.1Factors Creating Instability for Army National Guard Infantry Battalions
Item Definition
Percentage of Authorized
Officers NCOs
M – 12 to M-day
Stay in unit Stayed in unit from M – 12 to M-day 51 75
Losses Left unit between M – 12 and M-day 29 25
Vacancies Position not filled at M – 12 20
Fill Positions filled at M – 12 80 100
At M-day
Stayed in unit Stayed in unit from M – 12 to M-day 51 75
Gains In unit at M-day, tenure <12 months 46 45
Fill Positions filled at M-day 97 120
At D-day
Deploy ≥1 year Deployed, tenure in unit ≥12 months 40 57
Deploy <1 year Deployed, tenure in unit <12 months 34 35
Nondeploy Did not deploy 33 34
Fill Positions filled at D-day 107 126

62 Leadership Stability in Army Reserve Component Units
Table A.2Factors Creating Instability for Military Police Companies
Item
Percentage of Authorized
ARNG MP USAR MP
Officers NCOs Officers NCOs
M – 12
Stay 72 78 53 85
Losses 34 22 32 24
Vacancies 15
Fill 106 100 85 109
M-day
Stay 72 78 53 85
Gains 48 47 71 49
Fill 120 115 124 134
D-day
Deploy ≥1 year 46 60 29 65
Deploy <1 year 40 33 53 45
Nondeploy 40 24 50 28
Fill 126 117 132 138

Supplemental Data 63
Table A.3Factors Creating Instability for Transportation Corps Companies
Item
Percentage of Authorized
ARNG TC USAR TC
Officers NCOs Officers NCOs
M – 12
Stay 43 80 23 58
Losses 34 25 20 23
Vacancies 23 57 19
Fill 77 105 43 81
M-day
Stay 43 80 23 58
Gains 51 39 59 88
Fill 94 119 82 146
D-day
Deploy ≥1 year 31 63 14 40
Deploy <1 year 50 37 53 81
Nondeploy 20 22 24 35
Fill 101 122 91 156

64 Lead
ership
Stability in
Arm
y Reserve C
om
po
nen
t Un
its
Table A.4Predeployment Buildup of Officers in Unit: Percentage of Authorized
Unit Type Measure
Months Before Deployment
14 13 12 11 10 9 8 7 6 5 4 3 2 1 0
IN2 Assigned 55 57 58 60 61 62 64 66 75 85 93 99 103 105 106
IN2 Deploy 39 40 41 42 43 44 45 46 52 59 65 70 72 74 74
MP2 Assigned 65 68 70 72 75 79 84 88 92 97 103 112 120 123 124
MP2 Deploy 46 48 50 51 52 56 60 61 65 69 74 80 85 86 86
MP3 Assigned 44 45 46 50 52 59 61 68 75 88 99 114 124 129 132
MP3 Deploy 29 30 30 33 34 38 40 45 50 57 63 74 80 82 82
TC2 Assigned 39 41 41 43 45 49 52 55 60 65 72 88 94 98 100
TC2 Deploy 31 32 32 34 36 39 42 43 48 53 59 71 77 81 81
TC3 Assigned 31 32 32 34 36 39 42 43 48 53 59 71 77 81 81
TC3 Deploy 14 14 16 18 19 21 22 24 27 32 40 49 63 65 66
NOTE: IN2 = ARNG infantry battalion. MP2 = ARNG MP company. MP3 = USAR MP company. TC2 = ARNG truck company. TC3 = USAR truck company.
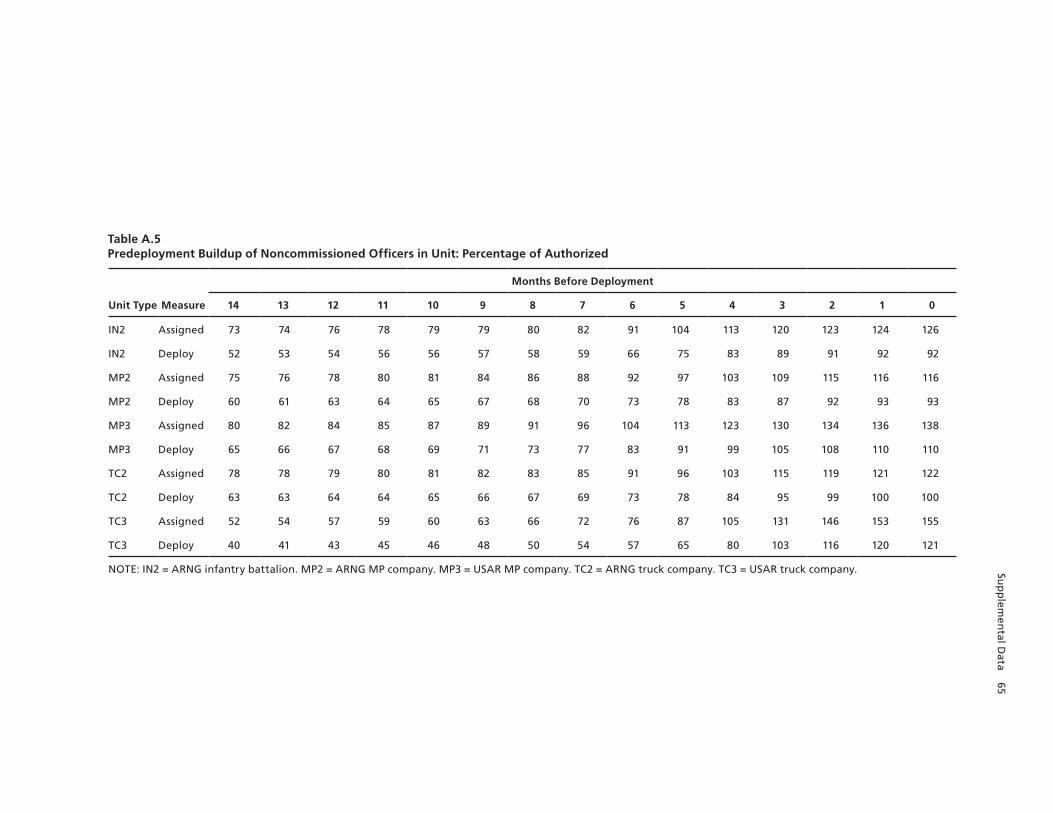
Sup
plem
ental D
ata 65
Table A.5Predeployment Buildup of Noncommissioned Officers in Unit: Percentage of Authorized
Unit Type Measure
Months Before Deployment
14 13 12 11 10 9 8 7 6 5 4 3 2 1 0
IN2 Assigned 73 74 76 78 79 79 80 82 91 104 113 120 123 124 126
IN2 Deploy 52 53 54 56 56 57 58 59 66 75 83 89 91 92 92
MP2 Assigned 75 76 78 80 81 84 86 88 92 97 103 109 115 116 116
MP2 Deploy 60 61 63 64 65 67 68 70 73 78 83 87 92 93 93
MP3 Assigned 80 82 84 85 87 89 91 96 104 113 123 130 134 136 138
MP3 Deploy 65 66 67 68 69 71 73 77 83 91 99 105 108 110 110
TC2 Assigned 78 78 79 80 81 82 83 85 91 96 103 115 119 121 122
TC2 Deploy 63 63 64 64 65 66 67 69 73 78 84 95 99 100 100
TC3 Assigned 52 54 57 59 60 63 66 72 76 87 105 131 146 153 155
TC3 Deploy 40 41 43 45 46 48 50 54 57 65 80 103 116 120 121
NOTE: IN2 = ARNG infantry battalion. MP2 = ARNG MP company. MP3 = USAR MP company. TC2 = ARNG truck company. TC3 = USAR truck company.

66 Leadership Stability in Army Reserve Component Units
Table A.6End-State Distribution of Unit Losses, from M – 12 until Mobilization Day: Officers
End State
Percentage of M – 12 Personnel in Each End State at M-Day
ARNG Infantry Battalions
MP Companies Truck Companies
ARNG USAR ARNG USAR
Deploy with unit 53.1 46.5 44.0 46.1 39.0
Not deploy, qualified 11.7 14.4 14.3 8.4 10.2
Not deploy, unqualified 4.5 3.5 2.2 0.9 0.9
Loss, permanent 4.7 1.6 4.4 4.2 6.8
Loss, rejoin 1.5 2.6 2.2 2.8 2.5
Move, deploy same/early 8.9 3.2 4.4 7.9 8.5
Move, deploy later 9.1 14.4 14.3 16.3 14.4
Move, not deploy TOE 4.3 9.6 11.0 9.3 15.3
Move, not deploy TDA 2.2 4.2 3.3 4.2 2.5
Total 100.0 100.0 100.0 100.0 100.0
NOTE: Deploy with unit = deployed with original unit at D-day. Not deploy, qualified = did not deploy but remained in unit and was qualified. Not deploy, unqualified = did not deploy but remained in unit and was unqualified. Loss, permanent = left the service and did not rejoin. Loss, rejoin = left the service but rejoined the service later. Move, deploy same/early = moved to a new unit and deployed earlier or at the same time as original unit. Move, deploy later = moved to a new unit and deployed later than original unit. Move, not deploy TOE = moved to a TOE unit and did not deploy. Move, not deploy TDA = moved to a TDA unit and did not deploy.

Supplemental Data 67
Table A.7End-State Distribution of Unit Losses, from M – 12 until Mobilization Day: Noncommissioned Officers
End State
Percentage of M – 12 Personnel in Each End State at M-Day
ARNG Infantry Battalions
MP Companies Truck Companies
ARNG USAR ARNG USAR
Deploy with unit 57.0 64.5 62.9 63.9 53.9
Not deploy, qualified 16.6 12.6 13.2 10.9 14.0
Not deploy, unqualified 0.5 0.1 0.0 0.2 0.0
Loss, permanent 9.4 7.1 5.5 11.8 10.7
Loss, rejoin 1.2 1.0 2.5 0.8 1.3
Move, deploy same/early 4.7 1.7 3.2 1.6 4.3
Move, deploy later 4.3 5.3 4.5 3.3 3.5
Move, not deploy TOE 4.6 5.4 5.2 4.9 8.7
Move, not deploy TDA 1.8 2.5 2.9 2.6 3.7
Total 100.0 100.0 100.0 100.0 100.0
NOTE: Deploy with unit = deployed with original unit at D-day. Not deploy, qualified = did not deploy but remained in unit and was qualified. Not deploy, unqualified = did not deploy but remained in unit and was unqualified. Loss, permanent = left the service and did not rejoin. Loss, rejoin = left the service but rejoined the service later. Move, deploy same/early = moved to a new unit and deployed earlier or at the same time as original unit. Move, deploy later = moved to a new unit and deployed later than original unit. Move, not deploy TOE = moved to a TOE unit and did not deploy. Move, not deploy TDA = moved to a TDA unit and did not deploy.

68 Leadership Stability in Army Reserve Component Units
Table A.8End-State Distribution of Nondeployers: Officers
End State
Percentage of Nondeployers in Each End State
ARNG Infantry Battalions
MP Companies Truck Companies
ARNG USAR ARNG USAR
Deploy with unit later 27.2 8.4 6.7 21.4 15.1
Qualified activated stay 11.1 21.7 26.7 19.6 31.8
Qualified not activated stay 19.6 24.2 8.3 17.9 10.6
Unqualified stay 19.6 20.0 15.0 7.1 4.5
Qualified service losses 6.3 1.6 11.6 8.9 3.0
Unqualified loss 0.7 4.2 3.3 1.8
Unit move deploy 11.7 10.0 13.3 14.3 21.2
Unit move nondeploy 3.7 10.0 15.0 8.9 13.7
Total 100.0 100.0 100.0 100.0 100.0
NOTE: Deploy with unit later = remained in unit and deployed later. Qualified activated stay = activated, remained in same unit, was qualified, and did not deploy. Qualified not activated stay = not activated, remained in unit, was qualified, and did not deploy. Unqualified stay = not qualified and remained in unit. Qualified service losses = qualified and left the service without deploying. Unqualified loss = not qualified and left the service. Unit move deploy = moved to a new unit and deployed with that unit. Unit move nondeploy = moved to a new unit and did not deploy.
Table A.9End-State Distribution of Nondeployers: Noncommissioned Officers
End State
Percentage of Nondeployers in Each End State
ARNG Infantry Battalions
MP Companies Truck Companies
ARNG USAR ARNG USAR
Deploy with unit later 20.2 17.5 15.7 15.8 13.2
Qualified activated stay 8.7 7.2 12.2 8.6 11.1
Qualified not activated stay 30.7 36.7 38.4 35.5 30.9
Unqualified stay 1.6 0.8 0.7
Qualified service losses 19.7 15.0 17.5 18.1 14.7
Unqualified loss 0.5 0.3
Unit move deploy 7.8 7.8 5.9 7.9 8.6
Unit move nondeploy 10.7 15.0 10.5 13.1 21.4
Total 100.0 100.0 100.0 100.0 100.0
NOTE: Deploy with unit later = remained in unit and deployed later. Qualified activated stay = activated, remained in same unit, was qualified, and did not deploy. Qualified not activated stay = not activated, remained in unit, was qualified, and did not deploy. Unqualified stay = not qualified and remained in unit. Qualified service losses = qualified and left the service without deploying. Unqualified loss = not qualified and left the service. Unit move deploy = moved to a new unit and deployed with that unit. Unit move nondeploy = moved to a new unit and did not deploy.

69
Bibliography
Advisory Panel on Department of Defense Capabilities for Support of Civil Authorities After Certain Incidents, Before Disaster Strikes: Imperatives for Enhancing Defense Support of Civil Authorities, report to the Secretary of Defense and chairs and ranking members, Committees on Armed Services of the U.S. Senate and U.S. House of Representatives, September 15, 2010. As of January 15, 2013: http://www.rand.org/nsrd/DoD-CBRNE-Panel.html
Asch, Beth J., Paul Heaton, James Hosek, Paco Martorell, Curtis Simon, and John T. Warner, Cash Incentives and Military Enlistment, Attrition, and Reenlistment, Santa Monica, Calif.: RAND Corporation, MG-950-OSD, 2010. As of January 15, 2013: http://www.rand.org/pubs/monographs/MG950.html
Asch, Beth J., James R. Hosek, and John T. Warner, “New Economics of Manpower in the Post–Cold War Era,” in Todd Sandler and Keith Hartley, eds., Handbook of Defense Economics, Vol. 2: Defense in a Globalized World, Amsterdam: Elsevier, 2007, pp. 1075–1138.
Congressional Budget Office, Evaluating Military Compensation, Washington, D.C., 2007. As of January 15, 2013: http://purl.access.gpo.gov/GPO/LPS83066
Cox, Dan, “An Enhanced Plan for Regionally Aligning Brigades Using Human Terrain Systems,” Small Wars Journal, June 14, 2012. As of January 15, 2013: http://smallwarsjournal.com/jrnl/art/an-enhanced-plan-for-regionally-aligning-brigades-using-human-terrain-systems
Department of the Army, Reserve Component Deployment Expeditionary Force Pre and Post-Mobilization Training Strategy, Washington, D.C., Execution Order 150-08, February 2008.
———, Army Force Generation, Washington, D.C., Army Regulation 525-29, March 14, 2011. As of January 15, 2013: http://www.forscom.army.mil/graphics/r525_29.pdf
———, 2012 Army Strategic Planning Guidance, Washington, D.C., April 19, 2012. As of January 15, 2013: http://usarmy.vo.llnwd.net/e2/c/downloads/243816.pdf
DoD—See U.S. Department of Defense.
FORSCOM—See U.S. Army Forces Command.
Garamone, Jim, “Kendall: Afghan Drawdown Logistics to Be ‘Huge’ Undertaking,” American Forces Press Service, July 17, 2012. As of January 15, 2013: http://www.defense.gov/News/NewsArticle.aspx?ID=117158
Hattiangadi, Anita U., Deena Ackerman, Maria Kimble, and Aline O. Quester, Cost-Benefit Analysis of Lump Sum Bonuses for Zone A, Zone B, and Zone C Reenlistments: Final Report, Alexandria, Va.: CNA Resource Analysis Research Memorandum D0009652.A4, May 1, 2004. As of January 15, 2013: http://www.cna.org/research/2004/cost-benefit-lump-sum-bonuses-zone-zone-b-zone-c
Hattiangadi, Anita U., Ann D. Parcell, David Gregory, and Ian D. MacLeod, SelRes Attrition and the Selected Reserve Incentive Program in the Marine Corps Reserve, Alexandria, Va.: CNA Resource Analysis Research Memorandum D0013618.A2, March 1, 2006. As of January 15, 2013: http://www.cna.org/research/2006/selres-attrition-selected-reserve-incentive-marine

70 Leadership Stability in Army Reserve Component Units
Hartmayer, Michael S., “Security Force Assistance in Africa: The Case for Regionally Aligned BCTs,” Army, Vol. 61, No. 11, November 2011.
Hosek, James, and Paco Martorell, How Have Deployments During the War on Terrorism Affected Reenlistment? Santa Monica, Calif.: RAND Corporation, MG-873-OSD, 2009. As of January 15, 2013: http://www.rand.org/pubs/monographs/MG873.html
Hosek, James, and Trey Miller, Effects of Bonuses on Active Component Reenlistment Versus Prior Service Enlistment in the Selected Reserve, Santa Monica, Calif.: RAND Corporation, MG-1057-OSD, 2011. As of January 15, 2013: http://www.rand.org/pubs/monographs/MG1057.html
Lippiatt, Thomas F., and J. Michael Polich, Reserve Component Unit Stability: Effects on Deployability and Training, Santa Monica, Calif.: RAND Corporation, MG-954-OSD, 2010. As of January 15, 2013: http://www.rand.org/pubs/monographs/MG954.html
McIlvaine, Rob, “Odierno: Regional Alignments to Begin Next Year,” Army News Service, May 16, 2012. As of January 15, 2013: http://www.army.mil/article/79919/
National Guard Bureau, 2012 National Guard Bureau Posture Statement: A Great Value for America, Washington, D.C., 2012. As of January 15, 2013: http://www.nationalguard.mil/features/ngps/2012_ngps.aspx
Office of the Assistant Secretary of Defense for Reserve Affairs, Contiguous Training Study, Washington, D.C.: U.S. Department of Defense, 2010.
Orvis, Bruce R., Herbert J. Shukiar, Laurie L. McDonald, Michael G. Mattock, M. Rebecca Kilburn, and Michael G. Shanley, Ensuring Personnel Readiness in the Army Reserve Components, Washington, D.C.: RAND Corporation, MR-659-A, 1996. As of January 15, 2013: http://www.rand.org/pubs/monograph_reports/MR659.html
Polich, J. Michael, James N. Dertouzos, and S. James Press, The Enlistment Bonus Experiment, Santa Monica, Calif.: RAND Corporation, R-3353-FMP, 1986. As of January 15, 2013: http://www.rand.org/pubs/reports/R3353.html
Reserve Affairs—See Office of the Assistant Secretary of Defense for Reserve Affairs.
Rostker, Bernard D., I Want You! The Evolution of the All-Volunteer Force, Santa Monica, Calif.: RAND Corporation, MG-265-RC, 2006. As of January 15, 2013: http://www.rand.org/pubs/monographs/MG265.html
Ryan, John, “3,000 Soldiers to Serve in Africa Next Year,” Army Times, June 8, 2012. As of January 15, 2013: http://www.armytimes.com/news/2012/06/army-3000-soldiers-serve-in-africa-next-year-060812/
Sortor, Ronald E., Thomas F. Lippiatt, J. Michael Polich, and James C. Crowley, Training Readiness in the Army Reserve Components, Santa Monica, Calif.: RAND Corporation, MR-474-A, 1994. As of January 15, 2013: http://www.rand.org/pubs/monograph_reports/MR474.html
U.S. Army Forces Command, Pre-Deployment Training Guidance in Support of Combatant Commands, December 2010.
U.S. Army Reserve, An Enduring Operational Army Reserve: Providing Indispensable Capabilities to the Total Force—2012 Posture Statement, Washington, D.C., 2012. As of January 15, 2013: http://issuu.com/warrior-citizen/docs/arps_2012_final?mode=window&backgroundColor=%23222222
U.S. Department of Defense, Sustaining U.S. Global Leadership: Priorities for 21st Century Defense, Washington, D.C., January 2012. As of January 15, 2013: http://www.defense.gov/news/defense_strategic_guidance.pdf
U.S. General Accounting Office, Army National Guard: Combat Brigades’ Ability to Be Ready for War in 90 Days Is Uncertain, Washington, D.C., GAO/NSIAD-95-91, June 1995. As of January 15, 2013: http://purl.access.gpo.gov/GPO/LPS22595

Bibliography 71
———, Army National Guard: Enhanced Brigade Readiness Improved but Personnel and Workload Are Problems, Washington, D.C., GAO/NSIAD-00-114, June 2000. As of January 15, 2013: http://purl.access.gpo.gov/GPO/LPS7715
White, Thomas E., Secretary of the Army, opening remarks prepared for the 2002 convention of the Association of the U.S. Army, October 2002.
Winkler, John D., “Stability and Cohesion: How Much Is Needed?” in John D. Winkler and Barbara A. Bicksler, eds., The New Guard and Reserve, San Ramon, Calif.: Falcon Books, 2008, pp. 29–44. As of January 15, 2013: http://www.sainc.com/reports/pdf/New_Guard_Reserve.pdf

Stability of personnel is highly valued in all military forces, especially in units that are preparing for deployment. A particular concern is personnel turbulence (personnel leaving the unit and being replaced by others) among the unit leadership. Even if the Army must live with turbulence among the bulk of unit members, it would prefer to have unit officers and noncommissioned offi-cers in place to plan and oversee training of the troops with whom they will deploy. This mono-graph reports results of a study to determine the level of turbulence among unit leadership and to address several related questions: What causes leader turbulence? What effects might it have on training and preparation for future missions that may require RC units? What steps, if any, could be taken to mitigate it? The authors used data from 2003 through 2011 on Army National Guard infantry battalions and Army National Guard and U.S. Army Reserve military police and truck companies. They find high rates of personnel instability, caused generally by vacancies, personnel losses, and those who don’t deploy. This turbulence generates a large influx of new leaders entering units who have not been through all the training with the soldiers they will lead. The monograph makes recommendations for estimating preparation time for different types of units and for department policy to mitigate effects on mission preparation.
RAND publications are available at www.rand.orgThis product is part of the RAND Corporation monograph series. RAND monographs present major research findings that address the challenges facing the public and private sectors. All RAND monographs undergo rigorous peer review to ensure high standards for research quality and objectivity.
MG-1251-OSD
$24.95
OBJECTIVE ANALYSIS.EFFECTIVE SOLUT IONS.
C O R P O R A T I O N