leadership of indian coop dairy industry
TRANSCRIPT
April 2012/ Volume 2/Issue 4/Article No-11/568-579 ISSN: 2249-7196
*Corresponding Author www.ijmrr.com 568
INTERNATIONAL JOURNAL OF MANAGEMENT RESEARCH
AND REVIEW
LEADERSHIP OF INDIAN COOPERATIVE DAIRY INDUSTRY:
ISSUES, CHALLENGES & STRATEGIES: CONTEXT OF GLOBALIZATION
Prof Amit Gupta*1
Research Fellow, National School of Leadership, Bangalore.
ABSTRACT
Dairy industry is of crucial importance to India in terms of livelihoods, poverty alleviation
and inclusive growth. Dairy products are a major source of cheap and nutritious food to
millions of people in India and the only acceptable source of animal protein for large
vegetarian segment of the population, particularly among the landless, small and marginal
farmers and women.
Dairy sector witnessed spectacular growth between 1971-1996, i.e, Operation Flood era. An
integrated cooperative dairy development program on the proven model of Anand pattern was
implemented in three phases by National Dairy Development Board, an institution of national
importance created for this purpose.
The major objective was to provide an assured market round the year to rural milk producers
and to establish linkage between rural milk production and urban markets through modern
technology and professional management.
In this article, an attempt has been made to trace the growth of the dairy industry since 1971,
driven by the cooperative movement, and analyse the status in the current context of
globalization and trade liberalization, wherein the constraints of cooperatives need to be seen
in light of private sector competition.
The critical issues and areas of concern need to be looked into across the dairy industry value
chain spanning from inputs, feed, credit, production, processing, marketing and value added
product mix.
The primary objective of this secondary research study is to address the following questions:
• What is the implication of these changes on the farmers –potential threats and
opportunities?
• Which models better serve the interest of the farmers?
• How can the co-operatives be strengthened to meet the emerging changes?
Keywords: Dairy cooperatives, Operation Flood, rural producers, urban markets, inputs,
processing, value chain
INTRODUCTION & OVERVIEW
Indian Dairy Industry is at cross roads. Though the industry has traditionally been dominated
by the government and cooperative sector, strong competition from private sector has made
inroads into the market share of these organizations.

April 2012/ Volume 2/Issue 4/Article No-11/568-579 ISSN: 2249-7196
Copyright © 2012 Published by IJMRR. All rights reserved 569
To understand the critical issues facing the industry let us first try and trace the basic value
chain of the cooperative dairies and summarize the salient points of Operation Flood.
Arecent World Bank audit shows that of the Rs 200 crores it invested in Operation Flood II,
the net return into the rural economy has been a whopping Rs 240, 000 crores per year over a
period of ten years, or a total of Rs 240,000 crores in all. No other major development
program has matched this input-output ratio.
Operation flood, launched in 1970, has been instrumental in helping the farmers mould their
own development. Thus helping reach milk to consumers in 700 towns and cities through a
National Milk Grid. It also help eradicate the need for middleman thereby reducing the
seasonal price variations. As a result of cooperative structure the whole exercise of
production and distribution of milk and milk products has become economically viable for
farmers to undertake their own. In this manner the farmer himself can enjoy the fruits of his
own labor, instead of surrendering a majority of the profit to corrupt middleman.
Far reaching consequences of Operation Flood:
The year 1995-96 marked the termination of Operation Flood III, funded by a World Bank
loan, EEC food aid and internal resources of NDDB. At the conclusion of Operation Flood
III, 72,744 DCSs in 170 milksheds of the country, having a total membership of 93.14
lakh had been organized. The targets set have either been effectively achieved or exceeded.
However, procurement targets could not be reached as private agencies started procuring milk
from the cooperative villages, following the new deli censing policy under the Government's
program of economic liberalization.
The conditions for long-term growth in procurement have been created. An assured
market and remunerative producer prices for raw milk, technical input services including AI,
balanced cattle feed and emergency veterinary health services have all contributed to
sustained increases in milk production. Three state-of-the-art dairies designed to produce
quality products for both the domestic and export markets have been commissioned.
While the demand for milk was rising under Operation Flood the total cattle population
remained more or less static. If milk production had to be increased
• The buffalo and milk breeds of cattle had to be upgraded
• Non-descript cows had to be crossbred with exotic semen to increase their milk
production to make them more efficient converters of feed.
With this objective in mind, thrust was given to intensive research and development in animal
husbandry. Today, animal breeding is an integration of three major areas, artificial
insemination and quantitative genetic techniques, embryo transfer and embryo micro
manipulation techniques and biotechnology and genetics engineering. The optimal genetic
improvement can be achieved by making use of developments in each of these areas.
Operation Flood which started in 1970, concluded its Third Phase in 1996. Let us look at what
April 2012/ Volume 2/Issue 4/Article No-11/568-579 ISSN: 2249-7196
Copyright © 2012 Published by IJMRR. All rights reserved 570
Structure of co-operatives:
The basic philosophy of the dairy movement in India as promoted by the Anand pattern what
is today popularly known as AMUL (originally Anand Milk Union Ltd) was to build farmer
owned co-operative milk processing facilities that provided farmers an assured outlet for their
produce and the means to market quality milk and milk products in urban areas with high
demand. A three-tier structure was established that consisted of village level dairy co-
operatives that farmers could become members of by paying a onetime membership and
continue as members by supplying a minimum quantum of milk every year. Each village co-
operative had an elected chairperson who represented the village cooperative as members of
district level milk unions. The district milk unions had an elected board from among the
chairpersons of village co-operatives and each district union had a liquid milk processing
diary that took care of district level local milk supply. The elected chairperson of each district
union represented the district milk union on the board of the milk federation that was
responsible for liquid milk sales as well as production and marketing of milk products. Profits
made by the Federation are distributed to farmers as "price difference" after keeping some
reserve for developmental expenses
Dairy Extension:
Dairy Extension covers a range of activities that provide education, training and other
services to improve the milk quality and productivity and reduce production costs at the
farmer level. These include farmer training and awareness programs on feeding, hygiene and
treatment of common ailments. Veterinary doctors visit villages for treating major ailments of
milch animals and to conduct artificial insemination to improve their breed. These extension
activities are subsidised and supported directly and indirectly by several government schemes
and are valued by farmers. ( see Annexure 7 for AI details)
Operation Flood has achieved in milk. We are not looking simply at the application of science
and technology, though both have played a role; we are not looking simply at the creation of
farmer-owned structures, though such structures have been necessary to success. What we are
looking at is all of this, combined with the orchestration of all policies and programs that
affect production. Further, they ensure to the extent possible, that these support mechanism
strengthen efforts, rather than stand as obstacles.
• Cost reduction and technology management
• modernization of process and plant technology
• interventions for productivity increase
• frontier technologies like DNA vaccines and genetically engineered bovine
somatotropin,embryo transfer technology and in vitro fertilization of oocytes
The story of Operation Flood can be seen through three angles. One is to consider what it did
to the dairy industry. Another point of view is from the eyes of the small farmer. it has
revolutionized their way of life. Operation Flood has also established a pattern of success for
other countries to follow

April 2012/ Volume 2/Issue 4/Article No-11/568-579 ISSN: 2249-7196
Copyright © 2012 Published by IJMRR. All rights reserved 571
Milk transportation:
Milk is transported in 40 litre cans twice daily to the dairies. If the dairy is at a considerable
distance from the village milk co-operative then milk is transported to nearby chilling centres
that are used to preserve the liquid milk for short periods till it can be transported in bulk to
the dairy. Chilling centres are essential in some locations as the village co-operatives do not
have refrigeration facilities and milk can only be preserved for long periods at temperatures
below 4 degrees Centigrade.
Milk composition and generic pricing method:
Milk supplied by farmers to the village milk co-operative has to meet certain quality
standards and is purchased and sold on the basis of the percentage of fat and solids non-fat
(SNF) that it contains by weight. While the fat part of milk contains energy, the SNF part of
milk contains vitamins and other nutrients. Dairy processing can separate the two parts and
adjust their proportion. The purchase price of milk is usually stated for standard milk
containing 3.5% Fat and 8.5% Solids Non Fat (SNF). Any variation in the composition from
the standard leads to an increase or decrease in price based on the price of fat and SNF.
Aseptic packaging of Milk:
Aseptic packaging in Tetra Fino Aseptic (TFA) is a world-class packaging technology for
perishable liquid products from Tetra Pak, the world leaders in liquid food packaging. The
aseptic packaging equipment is capable of UHT (ultra high treatment) processing and
aseptically packaging milk in 500 ml packages called TFA, that ensures that milk stayed
fresh for upto 8 weeks after dispatch without any refrigeration (until it was opened). Unlike
plastic milk pouches, TFA packages cannot be tampered with and could not be opened and
re-sealed. Customers could consume the milk directly without boiling it and therefore
destroying milk nutrients. The UHT technology requires that only the best quality milk be
segregated for aseptic packaging in TFA packages. Tetra Brik Aseptic (TBA) is a similar
aseptic package from Tetra Pak, except that it is slightly thicker and in a brick form and could
last for three months. The UHT process for milk was identical for both TFA and TBA
packaging.
Environmental Change:
With the signing of the World Trade Organisation (WTO) agreement by India, foreign
companies would be able and willing to sell dairy products in India. Companies like
Britannia have already tied up with New Zealand Dairy Board and Fonterra to launch value
added products, demand for which is likely to grow with increasing disposable incomes and
exposure to global trends of the young population. Food, dairy and beverages constitute the
highest “share of wallet” in our consumption basket as far as modern organized retail is
concerned.
Bulkiness of the product combined with low margins would effectively prevent any county
from shipping liquid milk to India. However, the branded and bulk milk products market
could be potentially depressed by imports. Indian customers were known to have a liking for

April 2012/ Volume 2/Issue 4/Article No-11/568-579 ISSN: 2249-7196
Copyright © 2012 Published by IJMRR. All rights reserved 572
foreign brands in general and foreign retail brands of cheese, butter, milk powder, that
matched the prices of Indian brands, could potentially capture some market share even with
little or no advertising.
On the other hand Indian exports of milk and milk products were relatively low and unless
Indian dairies exported more milk products or Indian consumers consumed more milk
products, there would be a glut in the Indian market.
Cooperatives by their very structure are constrained by the inflexibility in diverting from
liquid milk sales to carry out their social responsibility and at the same time give the most
remunerative prices to farmers, irrespective of the quantity procured and the demand in the
urban markets. The high price sensitivity of the customer and their unwillingness to pay for
premium products is something that needs to be addressed in marketing strategy.
International markets see a wide range of specialised milk products in the supermarkets.
These products are relatively expensive and included liquid milk and milk products specially
formulated for specific uses (such as tea/coffee or milk shake), with specific additives (such
as vitamins and minerals) and for specific types of consumers (such as infants, children,
pregnant women, lactating mothers, sports persons,geriatrics and people on a diet). The moot
question is how many people in India will be interested in such specialised products, and
more importantly, how many people will be willing to pay a premium for such products?
What is missed out in this strategic issue by policy makers and activists is that if consumers
are willing to pay premium prices for value added products by strategic group segmentation,
ultimate beneficiary is the rural producer. Currently almost 90% of milk procured by societies
is sold as liquid milk by cooperatives whereas it is only 20% for the private dairies with a
focus on value added products.
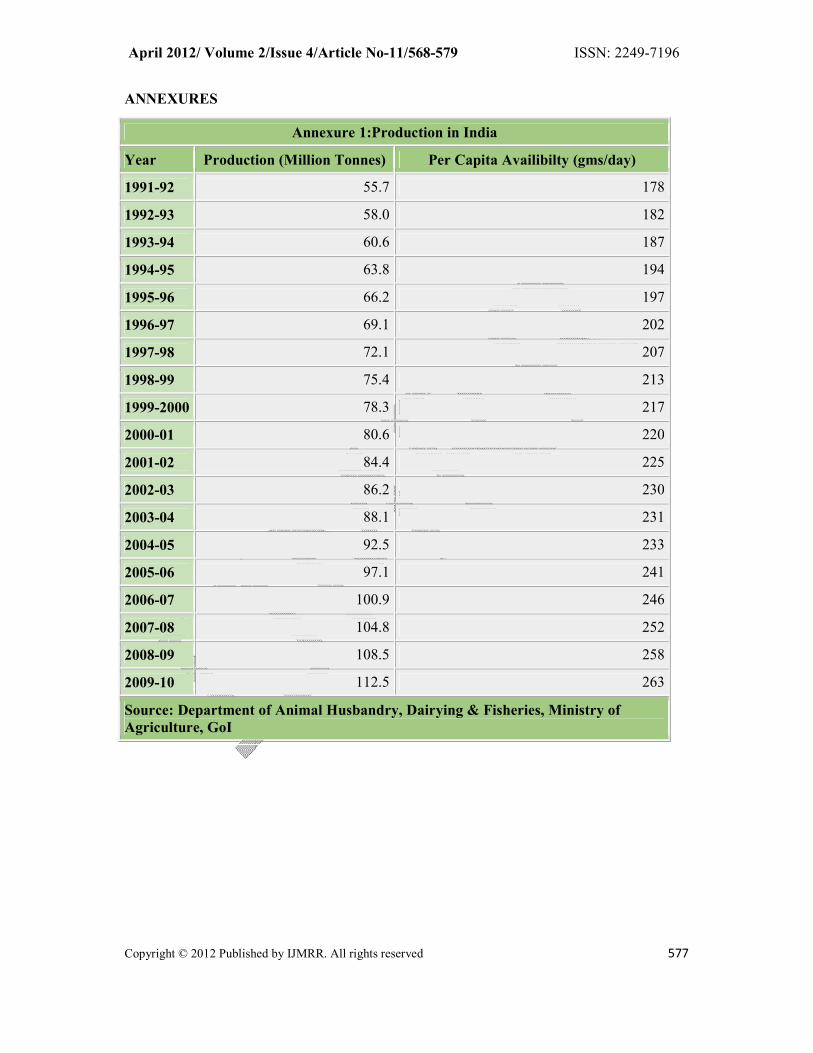
Macro production figures & per capita availability:
Both urban and rural per capita monthly expenditure on milk and milk products category
have increased by almost 15 times in the last 40 years since launch of Operation Flood in
1970, in the period that India has become the largest producer in the world at 112.5 Million
tons and per capita availability at 263 gms per day as of 2009-10 figures.( Detailed figures
and growth seen in Annexure 1 & 2)
The statewise per capita availability of milk and special mention must be made of States with
per capita well above the national average, namely Andhra Pradesh ( 342 gms/day), Gujarat (
418 gms/day),Haryana ( 662 gms/day),Himachal ( 342 gms/day), Punjab ( 944
gms/day),Rajasthan (395 gms/day),Uttaranchal ( 387 gms/day).
Regional disparities are significant with the laggards being the Eastern & North Eastern
States.
Currently co-op prices serve as a bench mark for pricing of dairy. In fact weak co-ops
competing with private sector may severely affect farmer interest. Growth potential is
tremendous, can the farmers benefit from this opportunity?

April 2012/ Volume 2/Issue 4/Article No-11/568-579 ISSN: 2249-7196
Copyright © 2012 Published by IJMRR. All rights reserved 573
Strengths & Weaknesses of Indian Dairy cooperative system
• Largest milk producer in the world: 15% of global output
• Value of output almost equals combined output of paddy and wheat!!
• 1/5thof the world bovine population
• Milch animals: (45% indigenous cattle, 55 % buffaloes, and 10% cross bred cows)
• Very low productivity, around 1000 kg/year (world average 2038 kg/year)
• Large no. of unproductive animals, low genetic potential, poor nutrition and lack of
services key factors for low productivity
Critical Issues/ Areas of concern for Dairy industry value chain:
Following areas need to be looked into as an ecosystem if India has to improve leadership of
the cooperative dairy system:
• Competitiveness, Cost of production, productivity of animals
• Production, processing & marketing infrastructure: only 10% delivered to 400 dairy
plants/ free import & export allowed
• Focus on buffalo milk specialty
• Import of value added products & export of lower value products
• Small and marginal farmers own 33 %of land, and about 60% of female cattle and
buffaloes (pro-poor impact)
• 75 % of HH have 2-4 animals on average
• Dairying is a part of the farming system, not perceived as industry
• Feed is mostly residual from crops -cow dung used as manure
• Source of regular income, crop income is seasonal, therefore minimizes risk of rural
producers
• Comprises about 1/3rdof the rural incomes
• Livestock is a security –asset to be sold in times of crisis
Regulatory Environment:
Besides the far reaching consequences of Operation Flood which has been outlined above in
detail, the industry has gone through following regulatory scenarios, which need to be taken
cognizance of and the landscape is as follows:
• Dairy sector was de-licensed in 1991
• Milk and Milk Products Order ( MMPO) 1992: some controls were placed
• Collection areas/milk sheds specified

April 2012/ Volume 2/Issue 4/Article No-11/568-579 ISSN: 2249-7196
Copyright © 2012 Published by IJMRR. All rights reserved 574
• Processing capacity fixed
• Revised MMPO in 2002: controls stand withdrawn
• Private sector investment in dairying has increased considerably
• Previously, co-operatives did not have any competition from the private sector
• To strengthen co-operatives MACS Act,1995 introduced: To reduce government
• Interference in mgt
• Farmer freedom to govern the organization
• Food Safety & Standards Authority of India ( FSSAI): Adulteration of milk-major issue?
• Agriculture is a state policy in India
• Centre cannot enforce policies, driven by the ideologies and interests of the state
government.
• Department of Livestock is with the Ministry of Agriculture
• Department of livestock has a network of veterinarians providing livestock veterinary
services
• Partial Cost recovery now initiated in several states
Bottlenecks in Dairy Value chain: Input/Feed/ Credit/Production/Marketing:
It is important to do a thorough analysis of the complete dairy value chain and address
concerns with respect to each part of the chain, in a more holistic and objective way, so as to
fully capitalize on the unfolding opportunities thrown up in the context of globalization and
changing consumer behaviour.
Breeding/health/extension
• Large majority of indigenous cattle (45% indigenous cattle constituting 55 % buffaloes,
and 10% cross bred cows)
• National Cattle and Buffalo Breeding Program
• Only small percent is covered by AI, rest is dependent on natural breeding; Performance
of AI is not up to mark
• State veterinary departments, co-operatives, NGOs, private veterinarians, and paravets
are the service providers
• Regions with high producing dairy animals –good coverage
• Other areas still lack adequate coverage of services
• Extension: Lack of extension –poor feeding practices does not enable farmers to
capitalize
Feed

April 2012/ Volume 2/Issue 4/Article No-11/568-579 ISSN: 2249-7196
Copyright © 2012 Published by IJMRR. All rights reserved 575
• Availability, quality and cost of feed is an issue.
• Land is largely rain-fed or dry land (70%), low output of dry fodder
• Availability of land for fodder grass
• Subsidized feed is available through co-ops, but quality and affordability are issues
Credit
• Poor access to institutional credit
• Credit through informal channel has very high loan rate, and results in exploitation of
farmer through lower milk prices
Production:
• Dairying is a part of the farming system, not dairy as enterprise
• Two to four animals on average, milk production is scattered throughout the country
• Low productivity, large no. of unproductive animals’ poor genetic resources, low
affordability of feed as well as poor feeding practices
• Farmer has low interest in dairying at times when crops are good
• Many areas do not have access to health and breeding services
Marketing
• Two major channels –Co-operative, traditional
• Milk prices are set by the co-operatives
• Premium on fat content hence buffalo milk fetches higher price, cow milk pricing based
on total solids
• Farmer price is Rs. X for cow milk and Rs. X+3 for buffalo milk (1 litre bottle of water
costs Rs. Y- food for thought?)
• The trader usually pays a small amount higher than the co-operative price (co-op price is
the benchmark)
• In a large part of the country, there are no testing facilities at the village level, hence
transparency of pricing is an issue
• Quality of milk depends on amount of time taken for milk to reach to bulk
cooling/chilling centre
Future potential of cooperative dairy industry:
Following factors augur well for sustainable growth of the industry, if areas of concern are
adequately addressed by public and private institutions working in this field, with support
from the Government, research and academia.

April 2012/ Volume 2/Issue 4/Article No-11/568-579 ISSN: 2249-7196
Copyright © 2012 Published by IJMRR. All rights reserved 576
• Dairy demand is income elastic. Need to move away from traditional liquid milk market
to cope with increasing demand-supply scenario
• Increase in income and increase in population-high growth rate for dairy products
(expected to be 7%)/ need to broaden product range in line with consumer expectations
• Milk products market booming due to higher incomes: Cheese 100 cr (growing @9%
pa)/ Dahi 15,000 cr ( only 10% organized share)/milk based sweets (12,000 cr largely
unorganized)/ milk & fruit based beverages
• Increasing potential for export of WMP, SMP, butter & cheese, especially to West Asian
countries and other emerging as well as LDC’s.
• High potential for enhancing farmer incomes from dairy enterprise
• Important to assess the critical weaknesses in the dairy value chain.
• Global integration-quality certification: ISO/ HACCP becoming critical
• Technology development in processing/packaging/ biotech related/ fruit processing,etc
• Identify approaches to enable farmers to capitalize on these opportunities through access
of credit, inputs, feedstock, technology, genetics, processing, marketing and distribution
CONCLUSION AND FUTURE SCOPE OF STUDY
While remarkable progress has been made due to the “White revolution” and consequent
improvement in rural incomes and urban availability of milk and milk products, putting India
on the global map as the world’s largest producer, what needs to be looked into is the post
WTO era wherein we need to move up the value chain and balance out interests of all
sections of society and enhance the sustainable competitive advantage of the cooperative
sector against not only the private sector but also impending imports.
The Doha round of trade talks also puts the spotlight on huge farm subsidies of the developed
nations and in this context we are back to addressing the three questions raised in the
beginning of this paper as to what are the implications, which models serve our interests
better and how does the cooperative system come out stronger by anticipating these emerging
changes.
REFERENCES
Department of Animal Husbandry, Dairying & Fisheries, Ministry of Agriculture, GOI
Indian Dairy.com Website
Livestock Census, Department of Animal Husbandry, Dairying & Fisheries, Ministry of
Agriculture, GoI
National Dairy Development Board (NDDB) Website and publications
NSSO Surveys and Ministry of Statistics & Program Implementation
April 2012/ Volume 2/Issue 4/Article No-11/568-579 ISSN: 2249-7196
Copyright © 2012 Published by IJMRR. All rights reserved 577
ANNEXURES
Annexure 1:Production in India
Year Production (Million Tonnes) Per Capita Availibilty (gms/day)
1991-92 55.7 178
1992-93 58.0 182
1993-94 60.6 187
1994-95 63.8 194
1995-96 66.2 197
1996-97 69.1 202
1997-98 72.1 207
1998-99 75.4 213
1999-2000 78.3 217
2000-01 80.6 220
2001-02 84.4 225
2002-03 86.2 230
2003-04 88.1 231
2004-05 92.5 233
2005-06 97.1 241
2006-07 100.9 246
2007-08 104.8 252
2008-09 108.5 258
2009-10 112.5 263
Source: Department of Animal Husbandry, Dairying & Fisheries, Ministry of
Agriculture, GoI

April 2012/ Volume 2/Issue 4/Article No-11/568-579 ISSN: 2249-7196
Copyright © 2012 Published by IJMRR. All rights reserved 578
Annexure 2:Per Capita Availability of Milk by States (gms/day)
State 91-92
92-93
93-94
94-95
95-96
96-97
97-98
98-99
99-00
00-01
01-02
02-03
03-04
04-05
05-06
06-07
07-08
08-09
09-10
All India
178 182 188 191 197 202 207 213 217 220 225 230 231 233 241 246 252 258 263
Andhra Pradesh
120 124 148 163 162 169 167 185 192 194 209 231 238 250 260 269 298 316 342
Arunachal Pradesh
22 64 62 64 119 115 109 119 119 102 105 112 109 114 113 114 74 55 59
Assam 77 78 78 79 95 79 78 79 71 69 70 71 71 72 72 70 70 70 69
Bihar 100 98 96 95 101 100 98 121 119 80 88 92 100 147 154 163 170 172 175
Goa 65 68 73 72 73 72 71 88 92 89 91 91 93 110 105 100 101 99 96
Gujarat 236 245 249 277 229 289 290 290 297 280 317 321 330 344 349 374 385 402 418
Haryana 586 597 605 625 618 617 630 623 631 614 645 647 643 631 628 633 621 644 662
Himachal Pradesh
313 314 330 324 329 316 314 347 349 335 341 339 337 378 373 370 365 365 342
Jammu & Kashmir
204 321 261 210 276 302 345 353 362 348 367 365 363 364 353 325 372 378 382
Karnataka 149 154 160 173 185 191 216 233 241 233 249 229 190 194 197 200 203 215 226
Kerala 167 174 181 190 198 199 204 221 227 219 234 203 173 169 171 172 183 197 203
Madhya Pradesh
197 196 195 199 199 192 194 262 261 211 240 236 233 233 262 259 264 271 278
Maharashtra
136 138 140 156 163 161 161 168 168 162 172 172 172 176 178 182 184 188 190
Manipur 122 119 118 88 80 75 74 87 88 81 86 85 85 90 92 82 91 90 88
Meghalaya 76 77 77 77 83 74 73 76 76 74 78 78 78 81 82 82 84 83 83
Mizoram 31 34 32 32 31 29 53 65 57 42 43 45 44 46 43 45 48 47 29
Nagaland 96 95 93 91 88 86 82 69 69 69 78 78 83 90 96 86 57 67 96
Orissa 43 46 47 47 49 54 53 58 66 64 69 68 71 92 95 100 113 110 112
Punjab 722 739 776 797 847 823 861 883 902 854 892 895 898 917 943 961 956 955 944
Rajasthan 275 276 292 280 294 322 348 356 367 353 376 368 371 376 387 408 408 399 395
Sikkim 194 191 186 192 204 190 188 186 185 173 187 222 231 221 232 230 229 226 210
Tamilnadu 164 167 168 175 180 183 185 199 210 211 219 198 198 204 231 232 232 234 237
Tripura 31 33 33 35 35 36 45 69 69 64 77 66 68 70 70 71 72 74 77
Uttar Pradesh
199 204 207 209 216 215 221 238 243 223 241 245 250 254 262 267 274 278 283
West Bengal
120 118 119 123 130 123 123 125 123 116 120 120 120 124 126 126 129 131 133
A&N Islands
227 219 223 215 173 170 169 179 184 165 177 195 183 165 135 155 149 154 137
Chandigarh
141 147 145 142 143 148 147 139 134 129 131 127 127 115 116 124 108 101 95
Dadra & Nagar Haveli
59 196 129 144 87 89 86 106 13 97 100 97 95 45 53 54 47 91 86

April 2012/ Volume 2/Issue 4/Article No-11/568-579 ISSN: 2249-7196
Copyright © 2012 Published by IJMRR. All rights reserved 579
Daman & Diu
0 25 26 25 25 16 17 26 144 17 17 17 16 10 11 13 12 15 15
Delhi 65 65 67 66 69 61 59 61 60 56 58 57 56 54 54 48 46 65 72
Lakshadweep
55 55 50 53 54 107 97 72 47 88 90 87 43 45 64 76 74 84 84
Pondicherry
90 89 103 98 90 44 43 109 106 102 104 101 107 108 108 117 107 101 96
Chhattisgarh
- - 100 105 103 102 103 103 101 103 106 110
Uttaranchal
- - 323 344 339 365 364 361 358 355 351 387
Jharkhand - - 90 96 94 92 127 126 131 132 132 130
Source : Department of Animal Husbandry, Dairying & Fisheries, Ministry of Agriculture, GoI