l&d standards 2013 - salvo
TRANSCRIPT

GLOBAL & LOCAL L&D STANDARDS &
BEST PRACTICES: Building a world-class learning function
Marius Meyer
12 June 2013
@SABPP1


Thanks to our Researchers
Dr Penny Abbott Dr Linda Chipunza
Head: HR Research Initiative, SABPP L&D Standards Leader, SABPP

Agenda
• Need for standards in L&D: SABPP
standard
• Principles and guidelines for world-class
L&D
• L&D benchmarking and standards
framework and metrics
• L&D best practices
• An integrated L&D governance model

SABPP HR System Standards Model
BUSINESS STRATEGY – HR BUSINESS ALIGNMENT
Strategic HRM
Talent Management
HR Risk Management
FUNCTIONAL & CROSS FUNCTIONAL HR VALUE CHAIN
HR VALUE & DELIVERY PLATFORM
Work- force
planning Learning
Perfor- mance
Reward Well- ness
ERM OD
HR Service Delivery
HR Technology (HRIS)
Pre- pare
Im- ple-
ment
Review Improve MEASURING HR SUCCESS HR Audit: Standards & Metrics
H R
C O
M P
E T E N C
I E S

SOUTH AFRICAN HR COMPETENCY MODEL
STRATEGY
TALENT MANAGEMENT
HR GOVERNANCE, RISK, COMPLIANCE
ANALYTICS & MEASUREMENT
HR SERVICE DELIVERY
5 HR
CAPABILITIES
LEADERSHIP & PERSONAL CREDIBILITY
ORGANISATIONAL CAPABILITY
SOLUTION CREATION & IMPLEMENTATION
INTERPERSONAL & COMMUNICATION
CITIZENSHIP FOR FUTURE: INNOVATION, TECHNOLOGY, SUSTAINABILITY
5 C
OR
E
CO
MP
ET
EN
CIE
S
HR & BUSINESS KNOWLEDGE
DUTY TO SOCIETY
ET
HIC
S
PR
OF
ES
SIO
NA
LIS
M
4
PILLARS

First SA National L&D Standard
1. Definition
2. Objectives
3. Implementation Official launch: 20 August 2013

Draft SA National L&D Standard
DEFINITION
L&D is the practice of providing occupationally-
directed and other learning opportunities that
enable/enhance the knowledge, practical skills,
workplace experience and behaviour of
individuals and teams, based on current and
future occupational requirements for optimal
organisational performance and sustainability.

Draft SA National L&D Standard
OBJECTIVES
• To enhance human performance in relation to organisational objectives
• To align L&D plans to organisational strategy
• To create an occupationally engaged workforce which builds
organisational capability in line with objectives of organisation
• To create a learning environment that enables optimal learning and
growth
• To develop a culture that enables individual and team competency
development in achieving organisational objectives
• To position L&D as a catalyst for change and innovation
• To evaluate the impact of L&D interventions at an individual and
organisational level

Draft SA National L&D Standard
IMPLEMENTATION • Formulate a L&D strategy for an organisation
• Align L&D strategy with organisational goals and culture
• Ensure all L&D activities conform to appropriate quality, and
compliance requirements and competency models
• Identify, select and implement appropriate interventions
according to the identified organisational need
• Ensure the design and facilitation of L&D interventions are
appropriate and integrated
• Leverage the utilisation of appropriate online technologies to
accelerate learning capacity and capability
• Evaluate the impact of L&D to assess quality and alignment
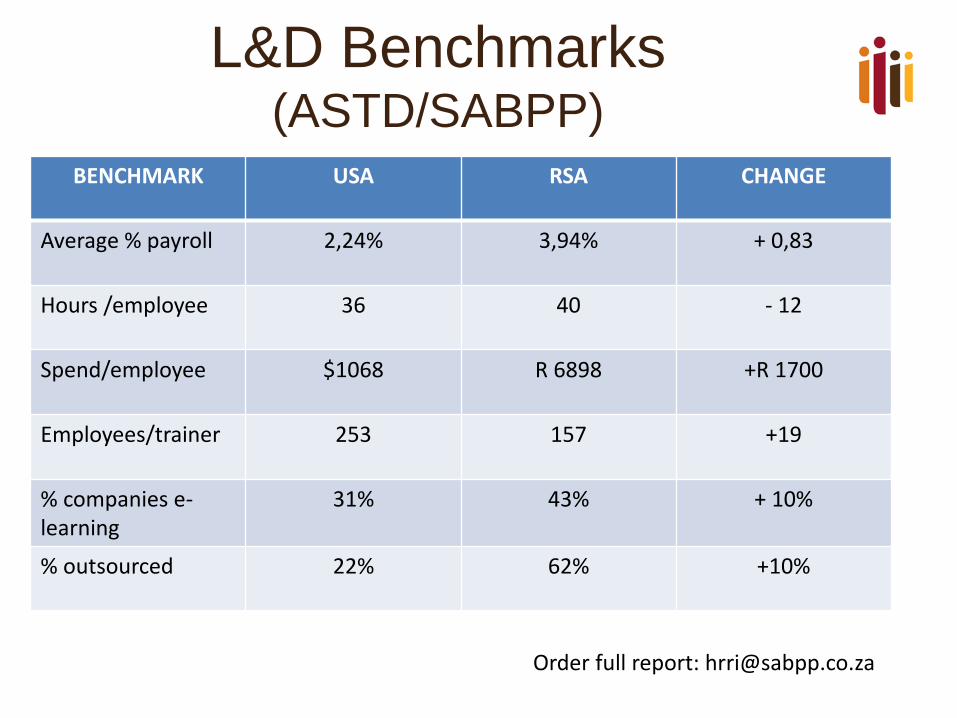
L&D Benchmarks (ASTD/SABPP)
BENCHMARK USA RSA CHANGE
Average % payroll 2,24% 3,94% + 0,83
Hours /employee 36 40 - 12
Spend/employee $1068 R 6898 +R 1700
Employees/trainer 253 157 +19
% companies e-learning
31% 43% + 10%
% outsourced 22% 62% +10%
Order full report: [email protected]

Purpose of the Research
Information about state of the HRD
trends and benchmarks
Benchmark internal practices with other companies
Benchmark internal practices with international companies
Provide guidelines to improve HRD practices

Methodology
• Questionnaires electronically distributed to L&D managers.
• Data analysis of results.
• Comparison with 2003-2011 studies and international
benchmarks where possible.

Training spend increasing
3.43
3.13
3.6
3.11
3.94
0
0.5
1
1.5
2
2.5
3
3.5
4
4.5
2007 2008 2009 2010 2011
Knowledge management
(Managing organisational knowledge)
• 75% of respondents would like to be better trained
in knowledge management and learning
organisation concepts
• Formal knowledge management initiatives only
exist in about half the organisations, and that
• Around 30% of organisations use their HRIS for
knowledge management functions

Training needs analysis methods
(Improving human performance)
0
10
20
30
40
50
60
70
80
90
Questionnaires Focus Groups PerformanceManagement Data
Interviews Customer Complaints Other
2007 2008 2009 2010 2011

More outsourcing of training
2007 20082009
20102011
47 46 47 48 39
53 54 53 52 62
Delivered internally Delivered externally

Training delivery methods
0
10
20
30
40
50
60
70
Classroom Text based Video based E-learning CD-Rom Satellite Webinars Blendedlearning
2007
2008
2009
2010
2011
43% of organisations use e-learning
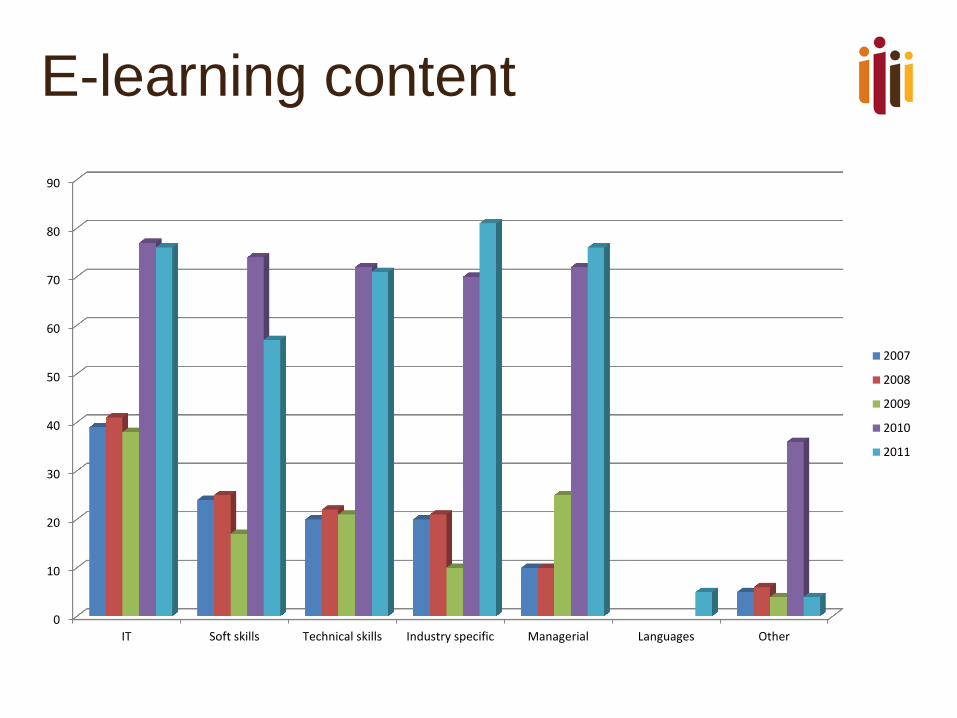
E-learning content
0
10
20
30
40
50
60
70
80
90
IT Soft skills Technical skills Industry specific Managerial Languages Other
2007
2008
2009
2010
2011

We are changing with technology

The Evaluation of Training

Evaluation
57 51
39 44
39

Training evaluation - use of
ROI
0 10 20 30 40 50 60 70 80 90 100
We use specific software to assist in the ROI process
We ask Training Providers to supply us with ROI data or information ontheir training programmes
Our training staff have formal training in ROI processes
We calculate the financial value ROI for training programmes ourselves
We use ROI data when compiling training budgets for the following year
Our Training Reports to management include ROI figures
We calculate ALL the inputs costs of training programmes
We do pre- and post-assessments of training programmes to enable usto calculate the ROI
2011
2010
2009
2008
2007

L&D Trends
(Managing the training function)

Talent Management
• 60% of organisations have a formal talent
management strategy
• Less than half of these (46%) rate their
strategy as effective

Key findings
1. Average training spend 3.94% of payroll on training (3.11% in 2010 and 3.6%
in 2009).
2. Over 95% of organisations have a computerised human resource information
system (HRIS) in place and use it for a variety of functions. (91% in 2009)
3. Training needs analyses are conducted using mainly performance
management data (68.9%), data from customer complaints (57.8%) and
interviews (40%).
4. The use of questionnaires for training needs analysis has dropped
considerably from 78% to 46.7%.
5. Outsourcing of training design and delivery continues to increase – 64% of
training is designed externally on average and 62% is delivery externally on
average.
6. Classroom learning continues to be the most popular training delivery method
(59%) with e-learning second at 20%.

Key findings (continued)
7. 45% of organisations evaluate at least some of their training using financial
ROI. (39% last year and 40% the year before). Most organisations (70%) use
between 2 and 4 of the Kirkpatrick levels in evaluating training.
8. 60% of organisations have adopted a formal talent management strategy. This
is also an increasing trend (53% last year and 49% the year before). These
strategies are rated Effective or Highly Effective by 46% of organisations (51%
last year).
9. 45% of organisation use coaching in support of their talent management
strategy. The same percentage use mentoring and 90% of those organisations
use both coaching and mentoring. Coaching seems to be regarded as more
effective than mentoring. Coaching is most often delivered by line managers,
while the use of external coaches is still not prevalent (13 – 15%).

RATING SCALE TO ASSESS
L&D
PROBLEMATIC
MEDIOCRE
EXCELLENT
High Risk
Medium Risk
Low/no Risk
L&D practice is non-existent, has a low uptake or is applied poorly. Little, no or poor results are evident. Requires urgent attention to move to medium risk over short or medium term.
Some pockets of excellence, but they are isolated, and applied inconsistently in certain parts of company. Some occasional positive results comparable to typical average L&D standards. Should be addressed before it becomes problematic.
L&D leading practice is well infused, aligned and integra- ted across the company and applied consistently with clear results. Comparable to world- class standards. Should be maintained, reinforced or used as a model for other companies.
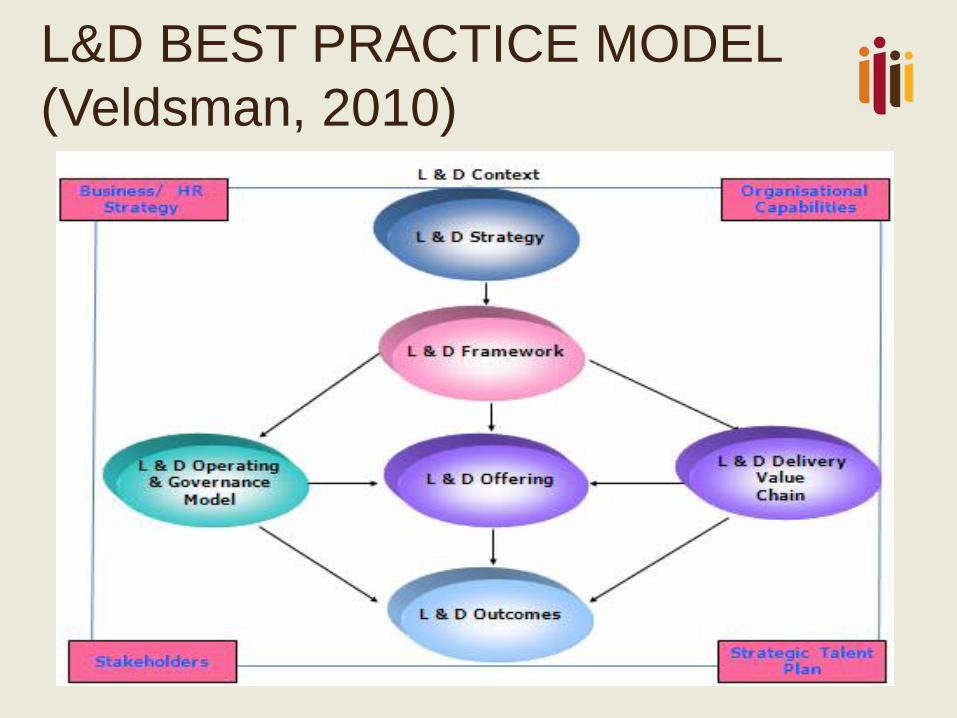
L&D BEST PRACTICE MODEL
(Veldsman, 2010)

L&D PRACTICES ASSESSMENT

BUILDING BLOCK 1: L&D CONTEXT
Sets the parameters which L&D has to be aligned
with:
• Business/HR strategy
• Organisational capabilities
• Stakeholders
• Strategic Talent Plan

BUILDING BLOCK 1: L&D CONTEXT
Sets the parameters which L&D has to be aligned
with:
• Business/HR strategy
• Organisational capabilities
• Stakeholders
• Strategic Talent Plan
• No direct alignment
• Not clearly in place
• Some clarity, not enough engagement
• Talent plan not integrated

BUILDING BLOCK 2: L&D STRATEGY
Sets the strategic direction and priorities

BUILDING BLOCK 2: L&D STRATEGY
Sets the strategic direction and priorities
• Role of L&D and strategic contribution not defined.
• No value proposition.
• No integrated L&D Strategy from talent plan.
• Thrust “grow our own timber”.
• Strategic focus/priorities of budget not clear.

BUILDING BLOCK 3: L&D FRAMEWORK
Conceptual framework used to direct and guide L&D:
• Philosophy (charter)
• Principles
• Competency model
• Learning culture

BUILDING BLOCK 3: L&D FRAMEWORK
• No clear framework.
• No philosophy.
• Partial competency model.
• Unsystematic, ad hoc, laissez-faire culture.
Conceptual framework used to direct and guide L&D:
• Philosophy (charter)
• Principles
• Competency model
• Learning culture

BUILDING BLOCK 4: OPERATING & GOVERNANCE MODEL
L&D policy;
structures, roles, responsibilities,
decision-making, reporting lines

BUILDING BLOCK 4: OPERATING & GOVERNANCE MODEL
L&D policy;
structures, roles, responsibilities,
decision-making, reporting lines
• Underdeveloped/unclear model
• Unclear roles, responsibilities, accountabilities – Group vs Divisions
• No Group governance
• Under-capacitated L&D

BUILDING BLOCK 5: L&D VALUE-CHAIN DELIVERY
• Enabling systems
• L&D process
• L&D activities
• Needs analysis
• Design
• Facilitation
• Evaluation
• Quality assurance

BUILDING BLOCK 5: L&D VALUE-CHAIN DELIVERY
• Enabling systems
• L&D process
• L&D activities
• Needs analysis
• Design
• Facilitation
• Evaluation
• Quality assurance
• Components understood.
• Value-chain not mapped.
• Fragmented value-chain.
• No LMS.
• Blended L&D delivery, mostly class-room.
• Outsourcing model in place, but fragmented.
• Performance management & PDP integration.

BUILDING BLOCK 6: L&D OFFERING
Your portfolio of L&D products and services -
content

BUILDING BLOCK 6: L&D OFFERING
• No integrated portfolio of products/services (except for manufacturing).
• Tactical/operational needs addressed, and not strategic needs.
• Not linked to talent pipe line.
Your integrated portfolio of L&D products and services - content

BUILDING BLOCK 7: L&D OUTCOMES
How do we measure the impact of L&D, which metrics do we use and how do we report it back to stakeholders

BUILDING BLOCK 7: L&D OUTCOMES
• Mainly compliance-driven reporting (BEE).
• No model to measure impact and reporting thereof.
How do we measure the impact of L&D, which
metrics do we use and how do we report it back to stakeholders

L&D PRACTICES

L&D governance model:
It is all about alignment

Guidelines for L&D
CO
MP
ETENC
Y MO
DEL
STRATEG
IC
TALEN
T PLA
N
L&D OPERATING & GOVERNANCE MODEL
L&D STRATEGY & FRAMEWORK
L&D OFFERING L&D OUTCOMES:
MEASUREMENT MODEL
L&D STAKEHOLDER ANALYSIS
Conclusion
We have made some progress on L&D
standards and benchmarks in South Africa,
but perhaps we need some more focused
work in elevating the status and impact of
learning. L&D in South Africa compares well
with international norms.
Contact us on [email protected] to participate in 2013 study.

Let us build world-class L&D functions
[email protected] (Professional Registration)
[email protected] (Professional Services)
[email protected] (Stakeholder Relations)
[email protected] (Research)
[email protected] (Learning & Quality)
[email protected] (Strategy inputs)
[email protected] (Social media)
Website : www.sabpp.co.za Blog: hrtoday.me
New office: 8 Sherborne Str, Parktown
Tel: 011 482-8595 Fax: 011 482-4830
Cel: 082 859 3593 (Marius Meyer)