lci tough choices patterns of resegregation final
TRANSCRIPT

TOUGH CHOICESFACING FLORIDA’S GOVERNMENTS
SEPTEMBER 2017
PATTERNS OF RESEGREGATION IN FLORIDA’S SCHOOLS

Patterns of Resegregation in Florida’s Schools
Tough Choices Facing Florida’s Governments
1
PATTERNS OF RESEGREGATION IN FLORIDA’S SCHOOLS
By Gary Orfield and Jongyeon Ee
September 27, 2017A Report for the LeRoy Collins Institute, Florida State University

Patterns of Resegregation in Florida’s Schools
Tough Choices Facing Florida’s Governments
2
TABLE OF CONTENTS
List of Tables ..............................................................................................................................................................3
List of Figures ............................................................................................................................................................3
Patterns of Resegregation in Florida’s Schools .........................................................................................................4
The Context of Florida’s School Segregation.............................................................................................................5
Three Supreme Court Decisions Negatively Affecting Desegregation .......................................................................6
Florida Since the 1990s .............................................................................................................................................7
Overview of Trends in Resegregation of Florida’s Schools ........................................................................................7
Public School Enrollment Trend .................................................................................................................................8
Charter School Enrollment Trend ...............................................................................................................................9
Segregation Trends in Florida .................................................................................................................................. 10
Segregation in Public Schools ................................................................................................................................. 10
Intergroup Contact in Florida Public Schools ...........................................................................................................13
Segregation in Charter Schools ...............................................................................................................................16
Double Segregation: Segregation by Race and Poverty ..........................................................................................18
Conclusions .............................................................................................................................................................20
Appendix A ..............................................................................................................................................................22
Appendix B ..............................................................................................................................................................23
Exposure to White and Asian Students by the Typical Student of Each Race by District and by Year ...............................................................23
Exposure to African American, Hispanic, and American Indian Students by the Typical Student of Each Race by District and by Year .............................................................. 27
Exposure to Low-Income Students by the Typical Student of Each Race by District and by Year ...............................................................31
Endnotes .................................................................................................................................................................36

Patterns of Resegregation in Florida’s Schools
Tough Choices Facing Florida’s Governments
3
LIST OF TABLES
Table 1: Public School Enrollment Trends in the United States and the South ..........................................................9
Table 2: Enrollment Trends in Florida Charter Schools ..............................................................................................9
Table 3: Schools Classified by Percent of Nonwhite Students ................................................................................. 10
Table 4: Exposure to Whites by the Typical Student of Each Race and the Percentage of Whites ..........................14
Table 5: Exposure to Blacks by Typical Student of Each Race and Percentage of Blacks .......................................14
Table 6: Exposure to Hispanics by the Typical Student of Each Race and the Percentage of Hispanics ................14
Table 7: Exposure to Asians by the Typical Student of Each Race and the Percentage of Asians ..........................14
Table 8: Exposure to Whites and Asians by the Typical Student of Each Race and the Percentage of Whites and Asians .........................................................................................15
Table 9: Exposure to Blacks, Hispanics, and American Indians by the Typical Student of Each Race and the Percentage of Blacks, Hispanics, and American Indians .....................................................15
Table 10: Charter Schools Classified by Percent of Nonwhite Students ..................................................................16
Table 11: Percentage of Students who are Low-Income in Multiracial and Nonwhite Schools .................................18
LIST OF FIGURES
Figure 1: Public School Enrollment Trends in Florida .................................................................................................8
Figure 2: Student Composition (%) in Public Schools and Charter Schools in Florida in 2014 ............................... 10
Figure 3: Distribution of Majority Nonwhite and White Schools in Florida, 2014 ...................................................... 11
Figure 4: Black and Hispanic Students in Nonwhite Segregated Schools in Florida, 1994-2014 .............................12
Figure 5: Percentage of 90-100% White Schools and 90-100% Nonwhite Schools in Florida, 1994-2014 ..............12
Figure 6: Percentage of Students in Multiracial Students by Race, 1994-2014 ........................................................13
Figure 7: Racial Composition of School Attended by the Typical Student in Florida, by Race, 2014-2015 ...............16
Figure 8: Black and Hispanic Students in Nonwhite Segregated Charter Schools in Florida, 1994-2014 ................17
Figure 9: Racial Composition of School Attended by the Typical Student in Florida Charter Schools, by Race, 2014-2015 .....................................................................................................17
Figure 10: Racial Group Exposure Rates to Low-Income Students for the Typical Student of Each Race in Florida Public Schools, 2014-2015 ................................................................................................18
Figure 11: Racial Group Exposure Rates to Low-Income Students for the Typical Student of Each Race in Florida Charter Schools, 2014-2015 ..............................................................................................19
Figure 12: Relationship Between Academic Achievement and SES Levels at the District Level in Florida .............19
Patterns of Resegregation in Florida’s Schools
Tough Choices Facing Florida’s Governments
4
PATTERNS OF RESEGREGATION IN FLORIDA’S SCHOOLS
Florida is a very important state for the future of American race relations. As the third largest state in a country with large white, Hispanic and black population, it is important that students in the state receive fair and equal access to the best schools. During the desegregation crisis in the South, the state of Florida experienced dramatic desegregation more peacefully than much of the region because of positive leadership of some of the state’s leaders and focus on preserving public schools while other states spent their time futilely fighting in the courts.
Another factor is that unlike most large states, Florida school districts are county-wide which leads to more racially diverse districts containing both central cities and much of the suburban ring.1 The state experienced a dramatic drop in segregation of black students, a drop that was more durable because of the county-wide school systems, which tended to produce the deepest and most durable desegregation. Many plans across the country were limited to central cities operated in heavily nonwhite systems surrounded by white suburbs, making it easy for white families to avoid desegregation in contrast to Florida’s large districts which often contained both the city and the suburban ring. In the late 1960s and early 1970s, the racial composition of schools in Florida changed very substantially and much of the intense public controversy went away over time. In the l980s, however, court decisions and a dramatic change in the position of the federal government in the Reagan and George H.W. Bush years, reopened the issues and the Supreme Court’s 1991 decision in the Board of Education of Oklahoma v. Dowell 498 U.S. 237 (l991) case authorized lower federal courts to make findings that the court order had been sufficiently implemented for a time and to dissolve court-ordered desegregation. This case gave authority to local federal judges to rule that a district was “unitary” and could return to neighborhood schools that would be segregated.2 Since that time there has been a major decline in desegregation levels in Florida and the country as a whole.3 This report provides a context for Florida’s school segregation including the impact of U.S. Supreme Court decisions and trends in school accountability and choice. It then examines enrollment trends and racial proportion changes in Florida schools including public schools and charter schools, and charts segregation trends at the state level over time
Major findings presented in the report include:
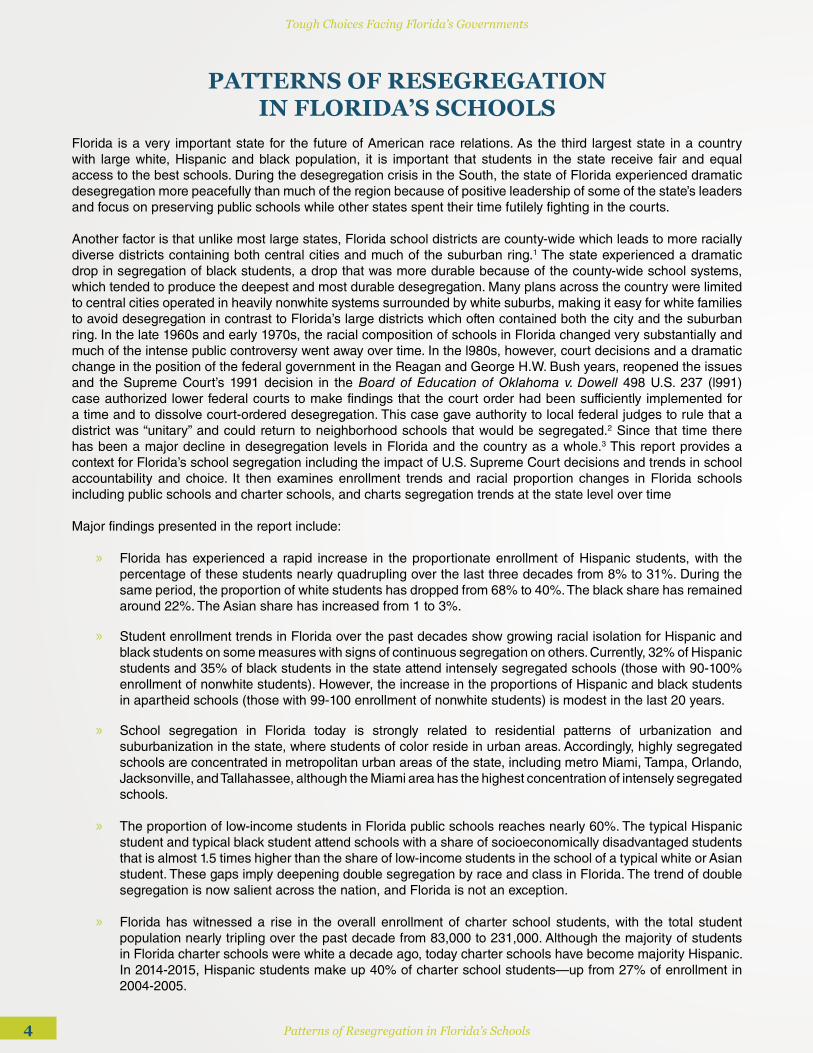
» Florida has experienced a rapid increase in the proportionate enrollment of Hispanic students, with the percentage of these students nearly quadrupling over the last three decades from 8% to 31%. During the same period, the proportion of white students has dropped from 68% to 40%. The black share has remained around 22%. The Asian share has increased from 1 to 3%.
» Student enrollment trends in Florida over the past decades show growing racial isolation for Hispanic and black students on some measures with signs of continuous segregation on others. Currently, 32% of Hispanic students and 35% of black students in the state attend intensely segregated schools (those with 90-100% enrollment of nonwhite students). However, the increase in the proportions of Hispanic and black students in apartheid schools (those with 99-100 enrollment of nonwhite students) is modest in the last 20 years.
» School segregation in Florida today is strongly related to residential patterns of urbanization and suburbanization in the state, where students of color reside in urban areas. Accordingly, highly segregated schools are concentrated in metropolitan urban areas of the state, including metro Miami, Tampa, Orlando, Jacksonville, and Tallahassee, although the Miami area has the highest concentration of intensely segregated schools.
» The proportion of low-income students in Florida public schools reaches nearly 60%. The typical Hispanic student and typical black student attend schools with a share of socioeconomically disadvantaged students that is almost 1.5 times higher than the share of low-income students in the school of a typical white or Asian student. These gaps imply deepening double segregation by race and class in Florida. The trend of double segregation is now salient across the nation, and Florida is not an exception.
» Florida has witnessed a rise in the overall enrollment of charter school students, with the total student population nearly tripling over the past decade from 83,000 to 231,000. Although the majority of students in Florida charter schools were white a decade ago, today charter schools have become majority Hispanic. In 2014-2015, Hispanic students make up 40% of charter school students—up from 27% of enrollment in 2004-2005.

Patterns of Resegregation in Florida’s Schools
Tough Choices Facing Florida’s Governments
5
» Segregation patterns are similar in public and charter schools. In charter schools, it has been increasing for Hispanics while declining modestly for blacks.
» Hispanic and black students typically attend schools with large majorities of fellow students living in poverty while white Floridians, on average, attend majority middle class schools.
» Academic achievement in the state is strongly correlated with the level of poverty in a district’s population in the data analyzed here and we have found these strong relationships at the school level in many of our other reports, so black and Hispanic students are far more likely to be segregated in schools with low achieving students.
THE CONTEXT OF FLORIDA’S SCHOOL SEGREGATIONTrends in Florida desegregation flow from both demographics and policy. Florida, like the nation, has experienced major demographic changes since the civil rights era. The white share of the student population since l970 had declined from 80% of total enrollment to 40% while the black portion has remained relatively constant around a sixth of the total and the once tiny Hispanic and Asian shares have quintupled. The basic pattern is heavily influenced by the Hispanic and Asian immigration surge since the l960s. These changes, of course, mean that even without policy changes whites would experience relatively more contact with nonwhites and blacks and, especially, Hispanics would be in contact with fewer whites. So the changes in various measures of segregation are the net result of demographic transformation and radical changes in public policy and law, first in the direction of mandatory desegregation and then toward dismantling desegregation and restoring segregated schools based on neighborhoods.
When desegregation came to the South the leaders of the region mobilized intensely to fight the implementation of the Brown decision, in many cases deciding to take great risks with the public schools to forestall any step toward implementation of the Supreme Court’s mandate. Under the slogan of “massive resistance” some 101 Southern Members of Congress signed the Southern manifesto, attacking the legitimacy of the decision, which it said was a “clear abuse of judicial power,” essentially overturning the power of Congress and state governments.4 Florida was not immune to these efforts but it enjoyed two crucial advantages. The first was that state officials adopted a far less negative stance and there was strong support for public schools, later reflected in the positive leadership of Gov. LeRoy Collins. A number of southern states adopted policies that put maintaining segregation above preserving the public schools, including Virginia’s law authorizing the governor to close schools to prevent integration. The second was that the organization of public schools by county meant that the districts included the dominant city and the great majority of its suburbs within a single district. That meant that the districts were more likely to include both predominantly white and middle-class schools and nonwhite schools with high poverty levels. However, greater Miami sprawled over three large counties so Dade County functioned more like a central city component of an urbanized area than a district containing all or most of the metropolitan housing market. Across the country, desegregation plans based on countywide districts showed the highest level of school desegregation and were far more stable than those limited to central cities.
Florida’s political leaders differed from the common southern response by taking the position that desegregation was inevitable and that it was extremely important to preserve the public schools. Gov. LeRoy Collins responded to the Brown decision by taking the position that the primary goal was to preserve public education not to fight quixotic battles against the Supreme Court. In 1957, in response to a resolution passed by the legislature declaring Brown v. Board of Education “null, void and of no force or effect,” Gov. Collins responded that the resolution was “an evil thing, whipped up by the demagogues and carried on the hot and erratic winds of passion, prejudice and hysteria.”5 He became known as a leading southern moderate and was later chosen by President Johnson to lead the Community Relations Service, a key part of the Civil Rights Act of 1964. Perhaps the most important center for designing desegregation plans in the South was the Southeastern Desegregation Center at the University of Miami which aided school districts across the South, led for 30 years by Prof. Gordon Foster.6
The plans implemented across the state produced large declines in segregation. The most dramatic changes followed the enactment of the Civil Rights Act of 1964, which threatened loss of all federal school funds for districts that did not implement desegregation and two vital unanimous Supreme Court decisions—the l968 Green v School Bd. of. New Kent Co, 391 U.S 430, decision that required systematic mandatory district-wide desegregation of students
Patterns of Resegregation in Florida’s Schools
Tough Choices Facing Florida’s Governments
6
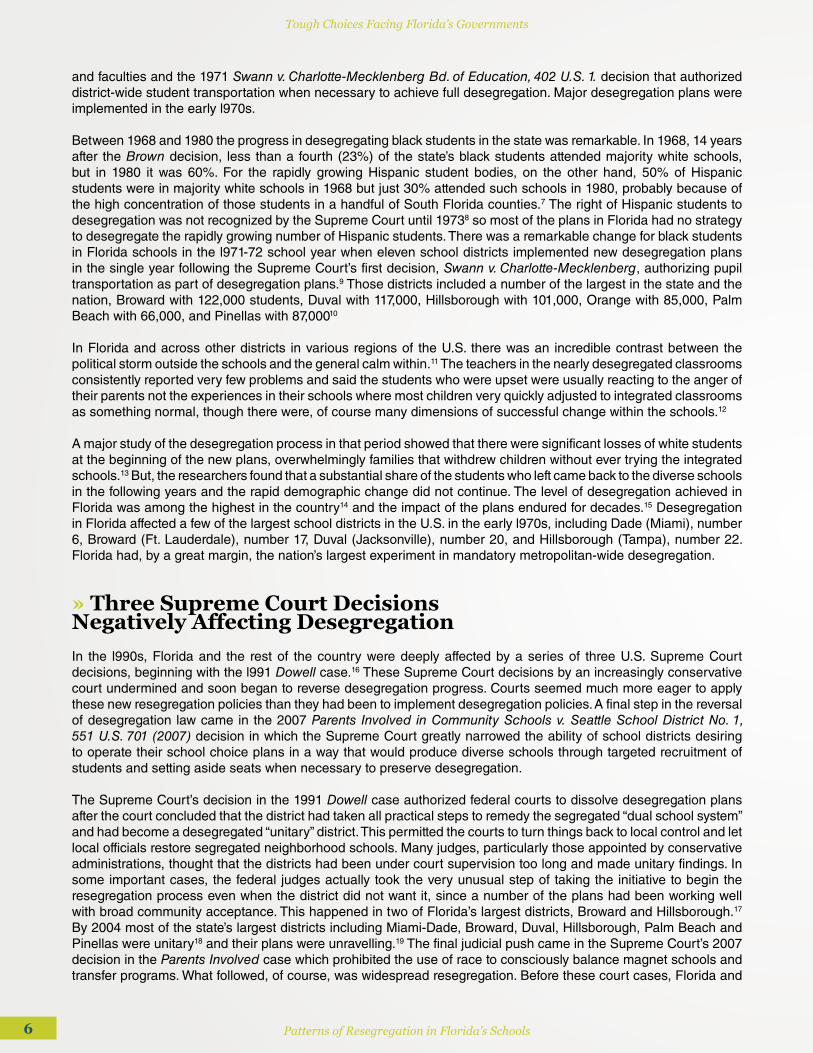
and faculties and the 1971 Swann v. Charlotte-Mecklenberg Bd. of Education, 402 U.S. 1. decision that authorized district-wide student transportation when necessary to achieve full desegregation. Major desegregation plans were implemented in the early l970s.
Between 1968 and 1980 the progress in desegregating black students in the state was remarkable. In 1968, 14 years after the Brown decision, less than a fourth (23%) of the state’s black students attended majority white schools, but in 1980 it was 60%. For the rapidly growing Hispanic student bodies, on the other hand, 50% of Hispanic students were in majority white schools in 1968 but just 30% attended such schools in 1980, probably because of the high concentration of those students in a handful of South Florida counties.7 The right of Hispanic students to desegregation was not recognized by the Supreme Court until 19738 so most of the plans in Florida had no strategy to desegregate the rapidly growing number of Hispanic students. There was a remarkable change for black students in Florida schools in the l971-72 school year when eleven school districts implemented new desegregation plans in the single year following the Supreme Court’s first decision, Swann v. Charlotte-Mecklenberg, authorizing pupil transportation as part of desegregation plans.9 Those districts included a number of the largest in the state and the nation, Broward with 122,000 students, Duval with 117,000, Hillsborough with 101,000, Orange with 85,000, Palm Beach with 66,000, and Pinellas with 87,00010
In Florida and across other districts in various regions of the U.S. there was an incredible contrast between the political storm outside the schools and the general calm within.11 The teachers in the nearly desegregated classrooms consistently reported very few problems and said the students who were upset were usually reacting to the anger of their parents not the experiences in their schools where most children very quickly adjusted to integrated classrooms as something normal, though there were, of course many dimensions of successful change within the schools.12
A major study of the desegregation process in that period showed that there were significant losses of white students at the beginning of the new plans, overwhelmingly families that withdrew children without ever trying the integrated schools.13 But, the researchers found that a substantial share of the students who left came back to the diverse schools in the following years and the rapid demographic change did not continue. The level of desegregation achieved in Florida was among the highest in the country14 and the impact of the plans endured for decades.15 Desegregation in Florida affected a few of the largest school districts in the U.S. in the early l970s, including Dade (Miami), number 6, Broward (Ft. Lauderdale), number 17, Duval (Jacksonville), number 20, and Hillsborough (Tampa), number 22. Florida had, by a great margin, the nation’s largest experiment in mandatory metropolitan-wide desegregation.
» Three Supreme Court Decisions Negatively Affecting DesegregationIn the l990s, Florida and the rest of the country were deeply affected by a series of three U.S. Supreme Court decisions, beginning with the l991 Dowell case.16 These Supreme Court decisions by an increasingly conservative court undermined and soon began to reverse desegregation progress. Courts seemed much more eager to apply these new resegregation policies than they had been to implement desegregation policies. A final step in the reversal of desegregation law came in the 2007 Parents Involved in Community Schools v. Seattle School District No. 1, 551 U.S. 701 (2007) decision in which the Supreme Court greatly narrowed the ability of school districts desiring to operate their school choice plans in a way that would produce diverse schools through targeted recruitment of students and setting aside seats when necessary to preserve desegregation.
The Supreme Court’s decision in the 1991 Dowell case authorized federal courts to dissolve desegregation plans after the court concluded that the district had taken all practical steps to remedy the segregated “dual school system” and had become a desegregated “unitary” district. This permitted the courts to turn things back to local control and let local officials restore segregated neighborhood schools. Many judges, particularly those appointed by conservative administrations, thought that the districts had been under court supervision too long and made unitary findings. In some important cases, the federal judges actually took the very unusual step of taking the initiative to begin the resegregation process even when the district did not want it, since a number of the plans had been working well with broad community acceptance. This happened in two of Florida’s largest districts, Broward and Hillsborough.17 By 2004 most of the state’s largest districts including Miami-Dade, Broward, Duval, Hillsborough, Palm Beach and Pinellas were unitary18 and their plans were unravelling.19 The final judicial push came in the Supreme Court’s 2007 decision in the Parents Involved case which prohibited the use of race to consciously balance magnet schools and transfer programs. What followed, of course, was widespread resegregation. Before these court cases, Florida and

Patterns of Resegregation in Florida’s Schools
Tough Choices Facing Florida’s Governments
7
the South had had schools that were more diverse than the state’s communities but afterwards the schools came to reflect and even exceed the segregation of neighborhoods.20
» Florida Since the 1990sThe last significant effort in Florida to try to preserve some significant diversity came in the early l990s. A number of Florida districts adopted new controlled choice plans in the l990s under a state policy supporting choice and explicitly permitting such efforts. In those plans, school districts were divided into big regions and all families were required to list their preferences in order among the schools in their regions and were assigned to the highest-ranking choice that would be compatible with keeping the schools diverse. (Controlled Open Enrollment Choice Law, F.S. 228.057). Two counties, Lee County and St. Lucie County, implemented this approach.21
Florida has become a very active incubator of conservative education policies. After Jeb Bush became governor in 1999, he instituted a series of very high stakes accountability plans, as well as a large expansion of charters and voucher programs. He also became the first governor in the U.S. to end affirmative action in higher education under his own authority. These reforms have, of course, been viewed very differently across political lines and in research findings.22 For this study what is important is that in this period the focus turned decisively toward the separate but equal theory and that segregated schools were subjected to very strong pressure on test scores.
During this period, the federal courts in the South were increasingly holding that any consideration of race was inherently suspect, even if done for the purpose of creating and stabilizing integration. In response, districts that were “unitary” moved away from any consideration of race and segregation deepened. In the 2000s, racial concerns were replaced with accountability and school choice policies including No Child Left Behind and Race to the Top. With intense pressure on schools to increasing perform on high stakes state testing program, segregation became a diversion and, even worse, an excuse. When the schools did not perform, and a very disproportionate share of schools with double segregation by race and poverty were branded with “D’s” or “F’s”, the state, under the leadership of Gov. Jeb Bush, blamed them, sanctioned them and encouraged the growth of charter and voucher schools.23 Without attention on segregation and its remedies, the goal of racial diversity was ignored.
The remainder of this report highlights the enrollment changes and segregation trends in Florida public schools since 1994, following the U.S. Supreme Court decisions undercutting desegregation and before the advent of accountability and choice. It highlights the resegregation of Florida schools, particularly notable in light of the increasing diversity in the state and its student population. In many areas, Florida has come a long way since the time of LeRoy Collins—but integration of its public schools is not one of them.
OVERVIEW OF TRENDS IN RESEGREGATION OF FLORIDA’S SCHOOLS
This report examines enrollment changes and segregation trends in Florida public schools by drawing on U.S. Department of Education’s Common Core of Data Public School Universe, 1994-1995, 2004-2005, and 2014-2015. The data come from every public school in Florida, as well as in every state in the nation. The definition of segregation in this report is the extent to which black and Hispanic students attend school with white students. This definition, of course, depicts one aspect of the intricate picture of segregation; thus, careful explanation is recommended. This report investigates segregation in two ways. First, segregation is measured by calculating the shares of black and Hispanic students in schools with less than 10 percent whites (intensely segregated schools) and with less than one percent whites (apartheid schools). The other measure used here—the exposure statistics—shows the degree of exposure of the typical student for each race to a certain racial group of students: for instance, the proportion of white students in schools attended by Hispanic students. Appendix A details the formula used to compute this measure.
The remainder of this report consists of two parts. The first part explores enrollment trends and racial proportion changes in Florida schools, including public schools and charter schools. The second part examines segregation trends at the state level over time. Appendix B reports district-level results for School Years (SY) 1994-95, 2004-2005 and 2014-2015.

Patterns of Resegregation in Florida’s Schools
Tough Choices Facing Florida’s Governments
8
» Public School Enrollment TrendOver the past four decades, Florida public schools have experienced significant changes in the number and composition of students. During the last half century, the total enrollment nearly doubled to almost 2.7 million in 2014, and racial diversity also grew rapidly (Figure 1). Most notable is the drop in the percentage of white students in Florida public schools—from 70% in 1976 to 40% in 2014. The black share slightly decreased over time. In contrast, the proportion of Hispanic students has soared during the same period, and the Asian share—virtually invisible in the past—gradually rose to closely 3% (Figure 1). As Table 1 illustrates, Florida’s trends generally reflect those of other Southern states and the nation but with larger percentages of Hispanic students and smaller percentages of white students.
Figure 1: Public School Enrollment Trends in Florida
Source: U.S. Department of Education, National Center for Education Statistics (NCES), Common Core of Data (CCD), Public Elementary/Secondary School Universe Survey Data; NCES Digest of Education Statistics. Data prior to 1994 obtained from the analysis of the Office of Civil Rights data in Orfield, G. (1983). Public School Desegregation in the United States, 1968-1980. Washington, D.C.: Joint Center for Political Studies.
Table 1: Public School Enrollment Trends in the United States and the South
Nation 1970 1980 1994 2004 2014 White 79.1 73.2 64.7 57.2 49.3 Black 15.0 16.1 16.4 16.8 15.3
Hispanic 5.1 8.0 14.1 20.2 25.9 Asian 0.5 1.9 3.7 4.6 5.2
AI 0.4 0.8 1.1 1.2 1.0 Multiracial 3.2
South 1970 1980 1994 2004 2014 White 66.9 63.3 57.8 49.3 42.6 Black 27.2 26.9 27.2 27.0 23.9
Hispanic 5.5 8.8 13.0 20.8 27.0 Asian 0.1 0.7 1.7 2.5 3.3
AI 0.2 0.3 0.4 0.5 0.5 Multiracial 2.7
Source: NCES CCD Public Elementary/Secondary School Universe Survey Data; Data prior to 1994 obtained from the analysis of the Office of Civil Rights data in Orfield, G. (1983). Public School Desegregation in the United States, 1968-1980. Washington, D.C.: Joint Center for Political Studies. Note: AI=American Indian
70.167.8
58.7
50.6
40.4
22.9 23.4 24.8 23.9 22.3
6.5 7.9
14.6 23.0
30.9
0.5 0.8 1.7 2.1 2.8
0
10
20
30
40
50
60
70
80
1976
1978
1980
1982
1984
1986
1988
1990
1992
1994
1996
1998
2000
2002
2004
2006
2008
2010
2012
2014
Percentage of Students in Florida Public Schools
White Black Hispanic Asian
1,427,8961,510,225
2,065,862
2,604,009
2,692,584
1970 1974 1978 1982 1986 1990 1994 1998 2002 2006 2010 2014
Total Enrollment in Florida Public Schools

Patterns of Resegregation in Florida’s Schools
Tough Choices Facing Florida’s Governments
9
Table 1: Public School Enrollment Trends in the United States and the South
Nation 1970 1980 1994 2004 2014White 79.1 73.2 64.7 57.2 49.3Black 15.0 16.1 16.4 16.8 15.3
Hispanic 5.1 8.0 14.1 20.2 25.9Asian 0.5 1.9 3.7 4.6 5.2
AI 0.4 0.8 1.1 1.2 1.0Multiracial 3.2
South 1970 1980 1994 2004 2014White 66.9 63.3 57.8 49.3 42.6Black 27.2 26.9 27.2 27.0 23.9
Hispanic 5.5 8.8 13.0 20.8 27.0Asian 0.1 0.7 1.7 2.5 3.3
AI .02 0.3 0.4 0.5 0.5Multiracial 2.7
Source: NCES CCD Public Elementary/Secondary School Universe Survey Data; Data prior to 1994 obtained from the analysis of the Office of Civil Rights data in Orfield, G. (1983). Public School Desegregation in the United States, 1968-1980. Washington, D.C.: Joint Center for Political Studies. Note: AI=American Indian
» Charter School Enrollment TrendThis report also examines the trend of Florida charter schools over the past decade. The charter system grew rapidly over the last 10 years, and charter school students now make up 8.6% of the total student population in Florida public schools. The total enrollment in charter schools almost tripled for the past decade, and the number of charter schools also rose by nearly 80%. A decade ago, nearly half of the student population in charter schools were white, but the white share now dropped to 35%. The black proportion also declined to less than 20%. By contrast, the percentage of Hispanic students soared to 40% (Table 2).
Table 2: Enrollment Trends in Florida Charter Schools
Percent
School Count Total Enrollment White Black Hispanic Asian AI Mixed
2004-2005 317 82,998 46.5 25.2 26.5 1.5 0.3
2014-2015 562 231,467 35.1 19.4 39.7 2.6 0.4 2.8
Source: NCES CCD Public Elementary/Secondary School Universe Survey Data
In general, charter schools tend to enroll more Hispanic students and fewer black and white students compared to the overall racial composition of Florida schools. Although public and charter schools in Florida differ slightly in student composition, the difference is trivial (Figure 2). However, given the rapid growth and changes in racial proportion of Florida charter schools, the racial composition of the student population in charter schools may well change in the future compared to public schools.

Patterns of Resegregation in Florida’s Schools
Tough Choices Facing Florida’s Governments
10
Figure 2: Student Composition (%) in Public Schools and Charter Schools in Florida in 2014
Source: NCES CCD Public Elementary/Secondary School Universe Survey Data
SEGREGATION TRENDS IN FLORIDA
» Segregation in Public SchoolsAs the racial composition of students in Florida has become more diverse, segregation trends in Florida public schools have also changed. Only one-fifth of Florida public schools were multiracial schools24 in the mid-1990s when white and black students combined made up 84% of the public-school enrollment. Twenty years later, more than one-third of public schools were multiracial schools, reflecting increasing diversity in the student population. However, the growing diversity has not been uniformly spread across Florida public schools; rather, it has been concentrated in certain schools. Specifically, the percentage of schools with 0 to 50% nonwhite students almost doubled from 29.6 to 54.8% between 1994 and 2014. The proportion of intensely segregated schools with 90 to 100% nonwhite students also doubled to 20% (Table 3). This evidence of school segregation is evident, but fortunately, the growth of apartheid schools with 99 to 100% nonwhite students is somewhat minimal.
Table 3: Schools Classified by Percent of Nonwhite Students
Percent
Total Schools
Multiracial Schools
50-100% Nonwhite Schools
90-100% Nonwhite Schools
99-100% Nonwhite Schools
1994-1995 2,312 20.9 29.6 10.6 2.1
2004-2005 3,347 30.4 44.2 15.2 3.9
2014-2015 3,710 36.3 54.8 20.2 3.7Source: NCES CCD Public Elementary/Secondary School Universe Survey Data Note: Multiracial schools are defined here as schools that have at least 10% students from three or more racial/ethnic groups.
Charter School Enrollment Trend This report also examines the trend of Florida charter schools over the past decade. The charter system grew rapidly over the last 10 years, and charter school students now make up 8.6% of the total student population in Florida public schools. The total enrollment in charter schools almost tripled for the past decade, and the number of charter schools also rose by nearly 80%. A decade ago, nearly half of the student population in charter schools were white, but the white share now dropped to 35%. The black proportion also declined to less than 20%. By contrast, the percentage of Hispanic students soared to 40% (Table 2).
Table 2: Enrollment Trends in Florida Charter Schools
Percent School Count Total Enrollment White Black Hispanic Asian AI Mixed
2004-2005 317 82,998 46.5 25.2 26.5 1.5 0.3 2014-2015 562 231,467 35.1 19.4 39.7 2.6 0.4 2.8
Source: NCES CCD Public Elementary/Secondary School Universe Survey Data In general, charter schools tend to enroll more Hispanic students and fewer black and white students compared to the overall racial composition of Florida schools. Although public and charter schools in Florida differ slightly in student composition, the difference is trivial (Figure 2). However, given the rapid growth and changes in racial proportion of Florida charter schools, the racial composition of the student population in charter schools may well change in the future compared to public schools. Figure 2: Student Composition (%) in Public Schools and Charter Schools in Florida in 2014
Source: NCES CCD Public Elementary/Secondary School Universe Survey Data
35.1
19.4
39.7
2.6 0.4
Charter
White Black Hispanic Asian AI
40.4
22.3
30.9
2.8 0.3
Public
White Black Hispanic Asian AI

Patterns of Resegregation in Florida’s Schools
Tough Choices Facing Florida’s Governments
11
The following map shows that the severe segregation in the state is concentrated in densely populated urban and suburban areas—particularly in the Miami, Broward and Palm Beach area. However, Jacksonville, Tampa, Orlando and Tallahassee also have concentrations of intensively segregated and apartheid schools. By contrast, 90-100% white schools are concentrated in the northern region of the state (Figure 3).
Figure 3: Distribution of Majority Nonwhite and White Schools in Florida, 2014
Source: NCES CCD Public Elementary/Secondary School Universe Survey DataNote: ▲ – 90-100% white school; ◍ – 90-100% nonwhite school; ■ – 99-100% nonwhite school
We further investigate segregation trends by examining the distribution of black and Hispanic students in majority nonwhite schools. For those who attend intensely segregated schools with 0 to 10% whites, the shares of Hispanic and black students in such schools rose by 4.5 and 8.4 percentage points, respectively, over the past 20 years. The percentage of Hispanic students in 99-100% nonwhite schools was not much different from 20 years ago, growing by only 0.8 percentage points. The black share attending apartheid schools rose to nearly 10% in the mid-2000s; fortunately, it declined to closely 8% in 2014. Although the proportion of students in 99-100% nonwhite schools in Florida is lower than that of other states, it is apparent that black students are more likely to go to extremely segregated schools compared to their Hispanic peers (Figure 4).
Figure 3: Distribution of Majority Nonwhite and White Schools in Florida, 2014
Source: NCES CCD Public Elementary/Secondary School Universe Survey Data Note: ▲ – 90-100% white school; ◍ – 90-100% nonwhite school; ■ – 99-100% nonwhite school

Patterns of Resegregation in Florida’s Schools
Tough Choices Facing Florida’s Governments
12
Figure 4: Black and Hispanic Students in Nonwhite Segregated Schools in Florida, 1994-2014
Source: NCES CCD Public Elementary/Secondary School Universe Survey Data
Nearly 20 years ago, the numbers of Florida public schools with 90-100% whites and 90-100% nonwhites were the same, and the proportions were about 11%, respectively. Now, the share of majority white schools dropped sharply and is less than 2% of Florida public schools. However, the percentage of majority nonwhite schools nearly doubled to 20% during the same period, and our data show that this trend is likely to continue (Figure 5).
Figure 5: Percentage of 90-100% White Schools and 90-100% Nonwhite Schools in Florida, 1994-2014
Source: NCES CCD Public Elementary/Secondary School Universe Survey Data
We further investigate segregation trends by examining the distribution of black and Hispanic students in majority nonwhite schools. For those who attend intensely segregated schools with 0 to 10% whites, the shares of Hispanic and black students in such schools rose by 4.5 and 8.4 percentage points, respectively, over the past 20 years. The percentage of Hispanic students in 99-100% nonwhite schools was not much different from 20 years ago, growing by only 0.8 percentage points. The black share attending apartheid schools rose to nearly 10% in the mid-2000s; fortunately, it declined to closely 8% in 2014. Although the proportion of students in 99-100% nonwhite schools in Florida is lower than that of other states, it is apparent that black students are more likely to go to extremely segregated schools compared to their Hispanic peers (Figure 4).
Figure 4: Black and Hispanic Students in Nonwhite Segregated Schools in Florida, 1994-2014
Source: NCES CCD Public Elementary/Secondary School Universe Survey Data
Nearly 20 years ago, the numbers of Florida public schools with 90-100% whites and 90-100% nonwhites were the same, and the proportions were about 11%, respectively. Now, the share of majority white schools dropped sharply and is less than 2% of Florida public schools. However, the percentage of majority nonwhite schools nearly doubled to 20% during the same period, and our data show that this trend is likely to continue (Figure 5).
66.8
55.4
27.6 26.2
1.76.5
72.968.5
28.732.2
1.99.7
79.3 81.1
32.1 34.6
2.57.7
0
10
20
30
40
50
60
70
80
90
Hispanic Black Hispanic Black Hispanic Black
50-100% Nonwhite School 90-100% Nonwhite School 99-100% Nonwhite School
1994-1995 2004-2005 2014-2015
Figure 5: Percentage of 90-100% white schools and 90-100% nonwhite schools in Florida, 1994-2014
Source: NCES CCD Public Elementary/Secondary School Universe Survey Data
As mentioned earlier, the growing diversity of student population has increased the proportion of students for each race attending multiracial schools. As of 2014, nearly 57% of Asians were in multiracial schools, and around 40% of white, black, and Hispanic students went to such schools. These figures demonstrate that almost half or over half of all ethnic groups of Florida students attend multiracial schools where they meet classmates from various racial backgrounds (Figure 6).
1994 2004 201490-100% White School 10.6 6.5 1.890-100% Nonwhite School 10.6 15.2 20.2
10.6
6.5
1.8
15.2
20.2
0
5
10
15
20
25
90-100% White School 90-100% Nonwhite School

Patterns of Resegregation in Florida’s Schools
Tough Choices Facing Florida’s Governments
13
As mentioned earlier, the growing diversity of student population has increased the proportion of students for each race attending multiracial schools. As of 2014, nearly 57% of Asians were in multiracial schools, and around 40% of white, black, and Hispanic students went to such schools. These figures demonstrate that almost half or over half of all ethnic groups of Florida students attend multiracial schools where they meet classmates from various racial backgrounds (Figure 6).
Figure 6: Percentage of Students in Multiracial Schools by Race, 1994-2014
Source: NCES CCD Public Elementary/Secondary School Universe Survey Data
» Intergroup Contact in Florida Public SchoolsSubstantial effects of educational and social integration flow from contact with significant numbers of students of other races or ethnicities under positive conditions.25 White middle-class student enrollment is especially important since these students typically have access to more challenging classes, peer groups and support systems in stronger schools. These educational advantages benefit disadvantaged students in ways that enrollment in predominantly minority schools do not. For this reason, this report examines the percentage of white students in a school that the typical white, black, Hispanic, and Asian student attends, respectively. Calculating the exposure index, this report explores the level of interracial contact between groups, as well as the racial composition of schools where the typical student of each race goes.
As the white share in Florida public schools dropped by nearly 20 percentage points over the past two decades, the percentage of white students that the typical student of each race meets in school also declined. In 1994 and still today, white students tend to go to schools with many white students but the exposure rates have fallen from 72.5 to 57.2%. However, black and Hispanic students’ exposure to whites fell from 1994 when they were 40% for blacks and 35% for Hispanics to 26-27% for the two groups in 2014. In 2014, white students were in schools where nearly 60% of their classmates are from the same racial background. By contrast, the percent of white students that the typical black or Hispanic student meets is just over 25%. The relatively low exposure rates are important for socialization and also can lead to differences in the resources of the schools in which each racial group attends (Table 4).
Figure 6: Percentage of Students in Multiracial Schools by Race, 1994-2014
Source: NCES CCD Public Elementary/Secondary School Universe Survey Data
Intergroup Contact in Florida Public Schools
Substantial effects of educational and social integration flow from contact with significant numbers of students of other races or ethnicities under positive conditions.xxv White middle-class student enrollment is especially important since these students typically have access to more challenging classes, peer groups and support systems in stronger schools. These educational advantages benefit disadvantaged students in ways that enrollment in predominantly minority schools do not. For this reason, this report examines the percentage of white students in a school that the typical white, black, Hispanic, and Asian student attends, respectively. Calculating the exposure index, this report explores the level of interracial contact between groups as well, as the racial composition of schools where the typical student of each race goes.
As the white share in Florida public schools dropped by nearly 20 percentage points over the past two decades, the percentage of white students that the typical student of each race meets in school also declined. In 1994 and still today, white students tend to go to schools with many white students but the exposure rates have fallen from 72.5 to 57.2%. However, black and Hispanic students’ exposure to whites fell from 1994 when they were 40% for blacks and 35% for Hispanics to 26-27% for the two groups in 2014. In 2014, white students were in schools where nearly 60% of their classmates are from the same racial background. By contrast, the percent of white students that the typical black or Hispanic student meets is just over 25%. The relatively low exposure rates are important for socialization and also can lead to differences in the resources of the schools in which each racial group attends (Table 4).
1994-1995 2004-2005 2014-2015White 18.4 30.5 41.0Black 25.4 36.1 46.4Hispanic 36.6 41.7 42.7Asian 29.2 43.9 56.7
18.4
30.5
41.0
25.4
36.1
46.4
36.6 41.742.7
29.2
43.9
56.7
0
10
20
30
40
50
60
White Black Hispanic Asian

Patterns of Resegregation in Florida’s Schools
Tough Choices Facing Florida’s Governments
14
Table 4: Exposure to Whites by the Typical Student of Each Race and the Percentage of Whites
White Black Hispanic Asian % White Enrollment
1994-1995 72.5 40.1 34.5 61.5 58.7
2004-2005 67.1 33.0 32.2 53.1 50.6
2014-2015 57.2 26.3 27.5 43.7 40.4Source: NCES CCD Public Elementary/Secondary School Universe Survey Data
As the proportion of black students slightly decreased by 2.5 percentage points over the past two decades or so, the percentage of black students in schools that each racial group attends also declined. However, non-black students in general go to schools that enroll less than 20% of black students, which is lower than the state’s overall share of black students (22%). Of all racial groups, white students in particular tend to go to schools with the least share of black classmates. In contrast to whites, the typical black student is in school where nearly half of her classmates are like her. This figure is 45%, which is twice the share of black students in Florida public schools (Table 5).
Table 5: Exposure to Blacks by Typical Student of Each Race and Percentage of Blacks
White Black Hispanic Asian % Black Enrollment
1994-1995 16.9 47.0 19.1 21.6 24.8
2004-2005 15.6 47.4 18.0 21.4 23.9
2014-2015 14.5 44.5 16.9 19.6 22.3Source: NCES CCD Public Elementary/Secondary School Universe Survey Data
Unlike black and white students, the proportion of Hispanic students in Florida public schools doubled in the last two decades to 31%; accordingly, exposure to Hispanic students increased significantly across all ethnic groups. Specifically, the Hispanic share in schools attended by all non-Hispanic students more than doubled and now ranges from 21 to 27%. Hispanic students, on the other hand, are in schools where more than half of their classmates are from the same racial background, and that figure rose by 6 percentage points over the two decades (Table 6).
Table 6: Exposure to Hispanics by the Typical Student of Each Race and the Percentage of Hispanics
White Black Hispanic Asian % Hispanic Enrollment
1994-1995 8.6 11.3 44.6 13.2 14.6
2004-2005 14.7 17.4 47.6 21.2 23.0
2014-2015 21.0 23.4 50.5 27.2 30.9Source: NCES CCD Public Elementary/Secondary School Universe Survey Data
About 20 years ago, Asian students accounted for less than 2% of the total enrollment in Florida public schools and were virtually invisible. For the past two decades, the Asian population in Florida public schools did not grow significantly. As in other Southern states, the proportion of Asians in Florida schools is barely 3%. There are a handful of Asian students in schools where the typical non-Asian student of each racial group attends, ranging from 2.4 to 3%. However, Asian students in general tend to go to schools that enroll somewhat higher share of Asian students (5.5%) (Table 7).
Table 7: Exposure to Asians by the Typical Student of Each Race and the Percentage of Asians
White Black Hispanic Asian % Asian Enrollment
1994-1995 1.8 1.5 1.6 3.5 1.7
2004-2005 2.3 1.9 2.0 4.0 2.1
2014-2015 3.0 2.4 2.5 5.5 2.8Source: NCES CCD Public Elementary/Secondary School Universe Survey Data

Patterns of Resegregation in Florida’s Schools
Tough Choices Facing Florida’s Governments
15
One way to look at segregation in a society with multiple racial and ethnic groups is to look at the contact between the two more privileged and educationally successful groups, whites and Asians, and the three more disadvantaged and educationally less successful groups, Hispanics, blacks and American Indians. This is a rough approximation—of course there are disadvantaged Asian and white students and affluent successful black and Hispanic families—but it a useful starting point in this analysis.
Combined shares of white and Asian students in Florida public schools are slightly less than 45%. However, the typical white student attends a school where more than 60% of their peers are either white or Asian. The typical Asian student also has nearly half of her classmates who are white or Asian. In contrast with these two groups, the typical black and Hispanic students go to schools where around 30% of their classmates are white or Asian. Such differences in the contacts with whites and Asians between black/Hispanic students and white/Asian students are prominent (Table 8). As was underscored earlier, the differences in the composition of students’ peer groups are not just a matter of having more exposure to white/Asian students but imply gaps in social and economic resources available to a school where a particular racial group of student attends. Furthermore, these resource gaps directly affect education quality that students experience and impact on educational outcomes, such as school discipline,26 success in college and later life,27 and drop-out rates.28
Table 8: Exposure to Whites and Asians by the Typical Student of Each Race and the Percentage of Whites and Asians
White Black Hispanic Asian% White/Asian
Enrollment
1994-1995 74.3 41.6 36.1 65.0 60.5
2004-2005 69.4 35.0 34.1 57.1 52.7
2014-2015 60.2 28.7 30.0 49.2 43.2Source: NCES CCD Public Elementary/Secondary School Universe Survey Data
With respect to black, Hispanic, and American Indian students, combined shares of these three groups in Florida public schools make up more than half of the total student population. However, the typical white student tends to go to school where these three groups account for about one-third of the total enrollment. The typical Asian student also attends a school where less than half of classmates are from these three groups. By contrast, the typical black and Hispanic students are in schools where almost 70% of their peers are black, Hispanic, or American Indian (Table 9).
Table 9: Exposure to Blacks, Hispanics, and American Indians by the Typical Student of Each Race and the Percentage of Blacks, Hispanics, and American Indians
White Black Hispanic Asian% Black/Hispanic/AI
Enrollment
1994-1995 25.7 58.4 63.9 35.0 39.5
2004-2005 30.6 65.0 65.9 42.9 47.3
2014-2015 35.8 68.2 67.7 47.1 53.5Source: NCES CCD Public Elementary/Secondary School Universe Survey Data
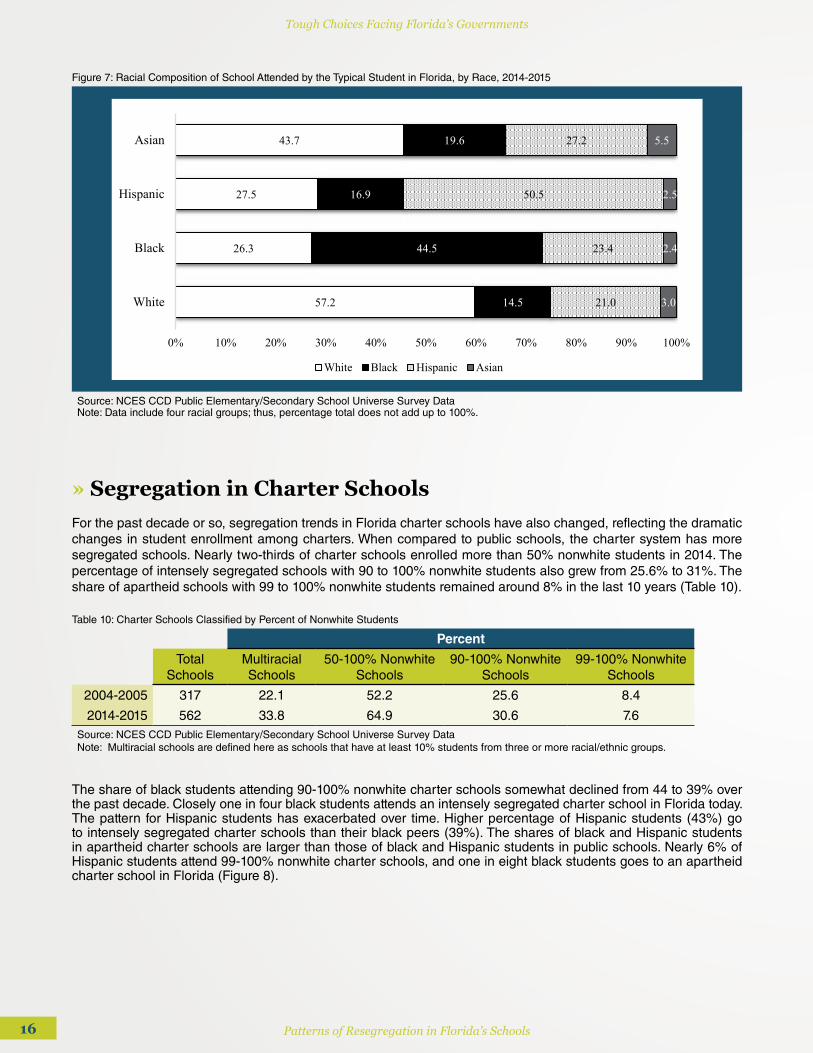
Taken together, statistics below show the overall racial composition of the school in which the typical student for each race attends. Students in general tend to go to schools where students from the same racial backgrounds are more enrolled. However, it is important to note that white and Asian students are more likely to have more contacts with their white and Asian peers; black and brown students tend to go to schools where blacks and Hispanics make up the majority of the student population (Figure 7).
Patterns of Resegregation in Florida’s Schools
Tough Choices Facing Florida’s Governments
16
Figure 7: Racial Composition of School Attended by the Typical Student in Florida, by Race, 2014-2015
Source: NCES CCD Public Elementary/Secondary School Universe Survey DataNote: Data include four racial groups; thus, percentage total does not add up to 100%.
» Segregation in Charter SchoolsFor the past decade or so, segregation trends in Florida charter schools have also changed, reflecting the dramatic changes in student enrollment among charters. When compared to public schools, the charter system has more segregated schools. Nearly two-thirds of charter schools enrolled more than 50% nonwhite students in 2014. The percentage of intensely segregated schools with 90 to 100% nonwhite students also grew from 25.6% to 31%. The share of apartheid schools with 99 to 100% nonwhite students remained around 8% in the last 10 years (Table 10).
Table 10: Charter Schools Classified by Percent of Nonwhite Students
Percent
Total
SchoolsMultiracial Schools
50-100% Nonwhite Schools
90-100% Nonwhite Schools
99-100% Nonwhite Schools
2004-2005 317 22.1 52.2 25.6 8.4
2014-2015 562 33.8 64.9 30.6 7.6Source: NCES CCD Public Elementary/Secondary School Universe Survey DataNote: Multiracial schools are defined here as schools that have at least 10% students from three or more racial/ethnic groups.
The share of black students attending 90-100% nonwhite charter schools somewhat declined from 44 to 39% over the past decade. Closely one in four black students attends an intensely segregated charter school in Florida today. The pattern for Hispanic students has exacerbated over time. Higher percentage of Hispanic students (43%) go to intensely segregated charter schools than their black peers (39%). The shares of black and Hispanic students in apartheid charter schools are larger than those of black and Hispanic students in public schools. Nearly 6% of Hispanic students attend 99-100% nonwhite charter schools, and one in eight black students goes to an apartheid charter school in Florida (Figure 8).
1994-1995 25.7 58.4 63.9 35.0 39.5 2004-2005 30.6 65.0 65.9 42.9 47.3 2014-2015 35.8 68.2 67.7 47.1 53.5
Source: NCES CCD Public Elementary/Secondary School Universe Survey Data
Taken together, statistics below show the overall racial composition of the school in which the typical student for each race attends. Students in general tend to go to schools where students from the same racial backgrounds are more enrolled. However, it is important to note that white and Asian students are more likely to have more contacts with their white and Asian peers; black and brown students tend to go to schools where blacks and Hispanics make up the majority of the student population (Figure 7).
Figure 7: Racial Composition of School Attended by the Typical Student in Florida, by Race, 2014-2015
Source: NCES CCD Public Elementary/Secondary School Universe Survey Data Note: Data include four racial groups; thus, percentage total does not add up to 100%.
Segregation in Charter Schools For the past decade or so, segregation trends in Florida charter schools have also changed, reflecting the dramatic changes in student enrollment among charters. When compared to public schools, the charter system has more segregated schools. Nearly two-thirds of charter schools enrolled more than 50% nonwhite students in 2014. The percentage of intensely segregated schools with 90 to 100% nonwhite students also grew from 25.6% to 31%. The share of apartheid schools with 99 to 100% nonwhite students remained around 8% in the last 10 years (Table 10).
Table 10: Charter Schools Classified by Percent of Nonwhite Students Percent
57.2
26.3
27.5
43.7
14.5
44.5
16.9
19.6
21.0
23.4
50.5
27.2
3.0
2.4
2.5
5.5
0% 10% 20% 30% 40% 50% 60% 70% 80% 90% 100%
White
Black
Hispanic
Asian
White Black Hispanic Asian

Patterns of Resegregation in Florida’s Schools
Tough Choices Facing Florida’s Governments
17
Figure 8: Black and Hispanic Students in Nonwhite Segregated Charter Schools in Florida, 1994-2014
Source: NCES CCD Public Elementary/Secondary School Universe Survey Data
Differences in exposure for students in charter schools exist when compared to public schools in Florida. Black and Hispanic students have lower exposure to white students and higher exposure to black and brown students in charter schools than in public schools. Specifically, the typical black and Hispanic charter school students are in schools where white students comprise slightly more than 20% of the enrollment, about 20 percentage points lower than the overall white share in the state. The typical Hispanic charter school student in particular attends a school where 61% of the student body are from the same racial group, compared to 51% (Figure 7) in Florida public schools (Figure 9).
Figure 9: Racial Composition of School Attended by the Typical Student in Florida Charter Schools, by Race, 2014-2015
Source: NCES CCD Public Elementary/Secondary School Universe Survey DataNote: Data include four racial groups; thus, percentage total does not add up to 100%.
Total Schools
Multiracial Schools
50-100% Nonwhite Schools
90-100% Nonwhite Schools
99-100% Nonwhite Schools
2004-2005 317 22.1 52.2 25.6 8.4 2014-2015 562 33.8 64.9 30.6 7.6
Source: NCES CCD Public Elementary/Secondary School Universe Survey Data Note: Multiracial schools are defined here as schools that have at least 10% students from three or more racial/ethnic groups.
The share of black students attending 90-100% nonwhite charter schools somewhat declined from 44 to 39% over the past decade. Closely one in four black students attends an intensely segregated charter school in Florida today. The pattern for Hispanic students has exacerbated over time. Higher percentage of Hispanic students (43%) go to intensely segregated charter schools than their black peers (39%). The shares of black and Hispanic students in apartheid charter schools are larger than those of black and Hispanic students in public schools. Nearly 6% of Hispanic students attend 99-100% nonwhite charter schools, and one in eight black students goes to an apartheid charter school in Florida (Figure 8).
Figure 8: Black and Hispanic Students in Nonwhite Segregated Charter Schools in Florida, 1994-2014
Source: NCES CCD Public Elementary/Secondary School Universe Survey Data
Differences in exposure for students in charter schools exist when compared to public schools in Florida. Black and Hispanic students have lower exposure to white students and higher exposure to black and brown students in charter schools than in public schools. Specifically, the typical black and Hispanic charter school students are in schools where white students comprise slightly more than 20% of the enrollment, about 20 percentage points lower than the overall white share in the state. The typical Hispanic charter school student in particular attends a school where 61%
76.9 75.8
31.9
44.4
1.1
16.4
85.9 84.8
43.039.2
5.612.4
0
10
20
30
40
50
60
70
80
90
100
Hispanic Black Hispanic Black Hispanic Black
50-100% Nonwhite School 90-100% Nonwhite School 99-100% Nonwhite School
2004-2005 2014-2015
of the student body are from the same racial group, compared to 51% (Figure 7) in Florida public schools (Figure 9).
Figure 9: Racial Composition of School Attended by the Typical Student in Florida Charter Schools, by Race, 2014-2015
Source: NCES CCD Public Elementary/Secondary School Universe Survey Data Note: Data include four racial groups; thus, percentage total does not add up to 100%.
Double Segregation: Segregation by Race and Poverty Segregation by race and concentrated poverty are strongly related across the nation and in Florida. During the past two decades, the low-incomexxix proportion in Florida public schools climbed from 36 to 59%. In 2014, segregated schools—both intensely segregated schools with 90-100% nonwhites and apartheid schools with 99-100% nonwhites—enrolled an extraordinarily high percentage of students living in poverty. For instance, such students made up more than 80% and nearly 90% of the student population in intensely segregated schools and apartheid schools, respectively (Table 11). Unfortunately, double segregation—segregation by race and poverty—trends are exacerbating over time.
Table 11: Percentage of Students who are Low-Income in Multiracial and Nonwhite Schools
55.9
22.9
21.5
40.1
12.7
44.9
13.1
17.2
24.3
26.8
61.1
32.7
3.0
2.3
2.2
6.2
0% 10% 20% 30% 40% 50% 60% 70% 80% 90% 100%
White
Black
Hispanic
Asian
White Black Hispanic Asian

Patterns of Resegregation in Florida’s Schools
Tough Choices Facing Florida’s Governments
18
» Double Segregation: Segregation by Race and PovertySegregation by race and concentrated poverty are strongly related across the nation and in Florida. During the past two decades, the low-income29 proportion in Florida public schools climbed from 36 to 59%. In 2014, segregated schools—both intensely segregated schools with 90-100% nonwhites and apartheid schools with 99-100% nonwhites—enrolled an extraordinarily high percentage of students living in poverty. For instance, such students made up more than 80% and nearly 90% of the student population in intensely segregated schools and apartheid schools, respectively (Table 11). Unfortunately, double segregation—segregation by race and poverty—trends are exacerbating over time.
Table 11: Percentage of Students who are Low-Income in Multiracial and Nonwhite Schools
Percent
Low-incomein multiracial
schools
Low-income in 50-100% non-white schools
Low-incomein 90-100% non-
white schools
Low-incomein 99-100% non-
white schools
Low-income enrollment
1994-1995 39.7 52.3 64.3 70.9 35.7
2004-2005 49.1 61.9 76.0 82.9 47.3
2014-2015 58.4 68.3 82.5 88.3 58.6Source: NCES CCD Public Elementary/Secondary School Universe Survey Data
The following chart shows the deeply-rooted relationship between race and poverty. As the number of students from low-income families grew dramatically, the exposure to such students also increased across all racial groups. Nevertheless, both white and Asian students tend to go to schools where less than half of their classmates are living in poverty. By contrast, black and Hispanic students are in schools where nearly two-thirds of their peers are poor. Low-income students also go to schools in which nearly 70% poor students account for the total enrollment. It is evident that students of color living in poverty are facing higher educational barriers than any other student (Figure 10). This is a significant gap. This is not just a numerical gap, but a gap in school resources, education quality, academic achievement, and the environment around the school.
Figure 10: Racial Group Exposure Rates to Low-Income Students for the Typical Student of Each Race in Florida Public Schools, 2014-2015
Source: NCES CCD Public Elementary/Secondary School Universe Survey Data
The overall percentage of low-income students in Florida charter schools (45%) is lower than in public schools (59%) in 2014, but double segregation trend is apparent in the charter system. As was seen in public schools, black, Hispanic and low-income students tend to attend schools where low-income students make up a considerable portion of the enrollment, ranging 52 to 63%. Conversely, white and Asian students’ exposure to school poverty is lower than that of black and Hispanic students in charter schools.
Percent
Low-income in multiracial
schools
Low-income in 50-100%
nonwhite schools
Low-income in 90-100%
nonwhite schools
Low-income in 99-100%
nonwhite schools
Low-income enrollment
1994-1995 39.7 52.3 64.3 70.9 35.7 2004-2005 49.1 61.9 76.0 82.9 47.3 2014-2015 58.4 68.3 82.5 88.3 58.6
Source: NCES CCD Public Elementary/Secondary School Universe Survey Data The following chart shows the deeply-rooted relationship between race and poverty. As the number of students from low-income families grew dramatically, the exposure to such students also increased across all racial groups. Nevertheless, both white and Asian students tend to go to schools where less than half of their classmates are living in poverty. By contrast, black and Hispanic students are in schools where nearly two-thirds of their peers are poor. Low-income students also go to schools in which nearly 70% poor students account for the total enrollment. It is evident that students of color living in poverty are facing higher educational barriers than any other student (Figure 10). This is a significant gap. This is not just a numerical gap, but a gap in school resources, education quality, academic achievement, and the environment around the school.
Figure 10: Racial Group Exposure Rates to Low-Income Students for the Typical Student of Each Race in Florida Public Schools, 2014-2015
Source: NCES CCD Public Elementary/Secondary School Universe Survey Data
The overall percentage of low-income students in Florida charter schools (45%) is lower than in public schools (59%) in 2014, but double segregation trend is apparent in the charter system. As was seen in public schools, black, Hispanic and low-income students tend to attend schools where low-income students make up a considerable portion of the enrollment, ranging 52 to 63%. Conversely, white and Asian students’ exposure to school poverty is lower than that of black and Hispanic students in charter schools.
49.3
68.0
65.3
48.1
68.1
58.6
0 10 20 30 40 50 60 70 80
White exposure to low-income
Black exposure to low-income
Hispanic exposure to low-income
Asian exposure to low-income
Low-income exposure to low-income
% Low-Income Enrollment
Patterns of Resegregation in Florida’s Schools
Tough Choices Facing Florida’s Governments
19
Figure 11: Racial Group Exposure Rates to Low-Income Students for the Typical Student of Each Race in Florida Charter Schools, 2014-2015
Source: NCES CCD Public Elementary/Secondary School Universe Survey Data
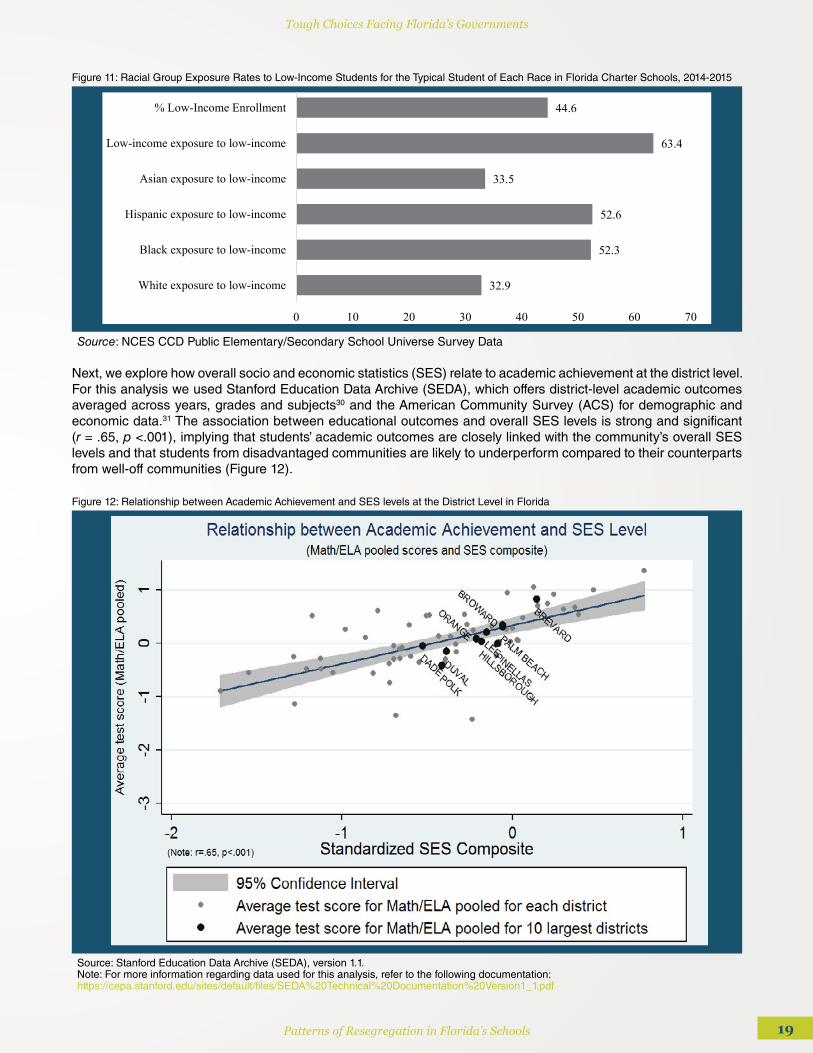
Next, we explore how overall socio and economic statistics (SES) relate to academic achievement at the district level. For this analysis we used Stanford Education Data Archive (SEDA), which offers district-level academic outcomes averaged across years, grades and subjects30 and the American Community Survey (ACS) for demographic and economic data.31 The association between educational outcomes and overall SES levels is strong and significant (r = .65, p <.001), implying that students’ academic outcomes are closely linked with the community’s overall SES levels and that students from disadvantaged communities are likely to underperform compared to their counterparts from well-off communities (Figure 12).
Figure 12: Relationship between Academic Achievement and SES levels at the District Level in Florida
Source: Stanford Education Data Archive (SEDA), version 1.1. Note: For more information regarding data used for this analysis, refer to the following documentation: https://cepa.stanford.edu/sites/default/files/SEDA%20Technical%20Documentation%20Version1_1.pdf
Figure 11: Racial Group Exposure Rates to Low-Income Students for the Typical Student of Each Race in Florida Charter Schools, 2014-2015
Source: NCES CCD Public Elementary/Secondary School Universe Survey Data
Next, we explore how overall socio and economic statistics (SES) relate to academic achievement at the district level. For this analysis we used Stanford Education Data Archive (SEDA), which offers district-level academic outcomes averaged across years, grades and subjectsxxx and the American Community Survey (ACS) for demographic and economic data.xxxi The association between educational outcomes and overall SES levels is strong and significant (r = .65, p <.001), implying that students’ academic outcomes are closely linked with the community’s overall SES levels and that students from disadvantaged communities are likely to underperform compared to their counterparts from well-off communities (Figure 12).
32.9
52.3
52.6
33.5
63.4
44.6
0 10 20 30 40 50 60 70
White exposure to low-income
Black exposure to low-income
Hispanic exposure to low-income
Asian exposure to low-income
Low-income exposure to low-income
% Low-Income Enrollment
Figure 12: Relationship between Academic Achievement and SES levels at the District Level in Florida
Source: Stanford Education Data Archive (SEDA), version 1.1. Note: For more information regarding data used for this analysis, refer to the following documentation: https://cepa.stanford.edu/sites/default/files/SEDA%20Technical%20Documentation%20Version1_1.pdf

Patterns of Resegregation in Florida’s Schools
Tough Choices Facing Florida’s Governments
20
CONCLUSIONSThe racial composition of Florida schools has changed significantly over the past decades. The Hispanic student population has climbed from 8 to 31%, and the white share has dropped from 68 to 40%. The percentage of black students has remained the same around 22%. Students in Florida charter schools have also grown substantially, making up 9% of the total student population in Florida public schools. Although the racial makeup in both charter and public schools does not differ substantially, charter schools tend to enroll more Hispanic students and fewer white students when compared to public schools.
The concentration of students in majority nonwhite schools in Florida indicates a reliable measure of school segregation in the state. Schools in which 50-100 percent of the student population is composed of students of color make up more than half of Florida public schools. In 2014-2015, one-fifth of schools in Florida are intensely segregated schools (those with 90-100% enrollment of nonwhite students), compared to slightly over one-tenth in 1994-1995. Additionally, apartheid schools (99-100% nonwhite schools) account for nearly 4% of Florida public schools in 2014-2015, compared to 2% in 1994-1995. The great majority of students who go to segregated schools are from low-income families. Around 90% of students attending apartheid schools are poor, and this trend has exacerbated over the last two decades.
Exposure statistics demonstrate the overall intergroup experiences for a typical student of each race. The exposure rates in Florida signify limited intergroup contacts, especially for black and Hispanic students. The typical white student in 2014-2015 attended a school where about one-third of the enrollment was black, Hispanic or American Indian students (even though these three groups account for around one-third of the total student enrollment in the state). In contrast, black and Hispanic students are in schools where almost 70% of their peers are black, Hispanic or American Indian.
Double segregation is a strikingly notable trend in Florida. Nearly 90% of students attending apartheid schools in Florida are from low-income families. The typical black student and Hispanic student attend schools with 68% and 65% low-income students, respectively, while the typical white student and Asian student are in schools where less than half of students are poor. These statistics indicate double segregation, implying that white and Asian students and low-income students in general attend different schools and thus have few opportunities to interact. By contrast, the typical black and Hispanic students generally go to schools with a high share of low-income students and with fewer resources and opportunities.
Florida has the most diverse student body in its history, and data show the diversity will become far greater. Since Brown vs. Board of Education—the landmark U.S. Supreme Court decision on segregation—schools in the South changed sharply to promote integration, and so did Florida schools. Although Florida schools achieved more integration than those in most other states, the trends in this report show that resegregation is underway in Florida schools and that segregation now is more complex than it was a half century ago. The proportion of Hispanic students dramatically increased for the past decades, adding racial and linguistic diversity in Florida schools. Moreover, segregation is concentrated in urban areas, exacerbating education quality of schools located in low-income urban communities where school segregation is deeply associated with residential segregation. Additionally, it is mainly black and Hispanic students who attend such segregated schools in Florida.
The state is facing a critical moment regarding whether its hard-earned accomplishment in desegregation going back to the courage of Gov. LeRoy Collins is moving forward or backward. To preserve the history of integration in the state and move forward, active policy discussions and conscious efforts are needed. Based on the authors’ experience and substantial policy research, here are some recommendations that the state might consider:

Patterns of Resegregation in Florida’s Schools
Tough Choices Facing Florida’s Governments
21
Magnet/charter schools with integration policies and special programs
1. expansion of the federal magnet school program and the imposition of similar desegregation requirement for federally supported charter schools. (In the desegregation era magnet schools were required to have desegregation goals and strategies to attain them, sometimes for oversubscribed schools giving preference to students who would increase the school’s diversity. After a court order ends such preference for individual students is forbidden by the Parents Involved decision but preference for students from segregated neighborhoods, students with different home languages, and many other criteria that could increase diversity is still permitted).
2. federal and state funding and university sponsorship for the creation of integrated metropolitan-wide magnet schools
3. creation of more two-way language immersion programs where students of each language group learn with, work with, and help each other to acquire English and a partner language (e.g., Spanish)
Inter-district and urban-suburban supports
4. provision of funding for better counseling and transportation for inter-district transfer policies
5. funding of teacher exchanges between city and suburban school district and training of teachers in techniques for successful interracial classrooms
State-level and local-level policies
6. creation of expertise on desegregation and race relations training in the Florida Department of Education
7. exploration of school and housing policies to avoid massive resegregation of large sections of the inner suburbs
8. active support by private foundations and community groups of efforts to continue local desegregation plans and programs through research, advocacy, and litigation
9. school district surveys documenting the value (in legal terms, the compelling interest) of interracial schooling experience in their own cities
Research to support desegregation policy and effective education
10. serious research to learn about the most effective approaches to effective education and race relations in schools with three or more racial groups present in significant numbers and two or more languages strongly represented
11. careful research and analysis documenting what happens in students in districts that restore segregated neighborhood schools

Patterns of Resegregation in Florida’s Schools
Tough Choices Facing Florida’s Governments
22
» Appendix ASegregation Statistics (Exposure Rates)
This report uses exposure statistics to measure segregation and to capture student experiences of segregation. Exposure of certain racial groups to one another or to majority groups shows the distribution of racial groups among organizational units—state and district in this report—and describes the average contact between different groups. It is calculated by employing the percentage of a particular group of students of interest in a small unit (e.g., school) with a certain group of students in a larger geographic or organizational unit (e.g., state or district) to show a weighted average of the composition of a particular racial group. The formula for calculating the exposure rates of a student in racial group A to students in racial group B is:
» where n is the number of small units (e.g., school) in a larger unit (e.g., state or district) » ai is the number of students in racial group A in the small unit i (school i) » A is the total number of students in racial group A in the larger unit (state or district) » bi is the number of students in racial group B in the small unit i (school i) » ti is the total number of students in all racial groups in the small unit i (school i)
Appendix A
Segregation Statistics (Exposure Rates)
This report uses exposure statistics to measure segregation and to capture student experiences of segregation. Exposure of certain racial groups to one another or to majority groups shows the distribution of racial groups among organizational units—state and district in this report—and describes the average contact between different groups. It is calculated by employing the percentage of a particular group of students of interest in a small unit (e.g., school) with a certain group of students in a larger geographic or organizational unit (e.g., state or district) to show a weighted average of the composition of a particular racial group. The formula for calculating the exposure rates of a student in racial group A to students in racial group B is:
● where n is the number of small units (e.g., school) in a larger unit (e.g., state or district) ● ai is the number of students in racial group A in the small unit i (school i) ● A is the total number of students in racial group A in the larger unit (state or district) ● bi is the number of students in racial group B in the small unit i (school i) ● ti is the total number of students in all racial groups in the small unit i (school i)

Patterns of Resegregation in Florida’s Schools
Tough Choices Facing Florida’s Governments
23
Year District Name Total Enrollment % of White and AsianWhite exposure to
wht/AsiBlack exposure to
wht/AsiHispanic exposure
to wht/AsiAsian exposure to
wht/Asi
1994 ALACHUA 27981 61.3 65.1 55.4 59.8 57.51994 BAKER 4619 82.7 82.8 82.5 83.1 83.71994 BAY 24006 83.6 85.3 75.8 79.8 77.51994 BRADFORD 4088 77.9 78.4 76.0 80.9 79.61994 BREVARD 64308 82.0 84.0 71.3 80.9 83.81994 BROWARD 195487 53.5 67.5 31.6 54.3 60.51994 CALHOUN 2287 82.0 84.1 71.7 87.1 73.21994 CHARLOTTE 14814 88.6 89.1 85.0 85.6 87.31994 CHARLOTTE 14814 88.6 89.1 85.0 85.6 87.31994 CITRUS 13338 93.0 93.2 90.6 92.1 92.61994 CLAY 23839 89.2 89.9 83.2 86.9 87.01994 COLLIER 25630 66.4 79.5 44.4 38.6 80.01994 COLUMBIA 8878 73.9 74.4 72.3 75.7 72.91994 COLUMBIA 8878 73.9 74.4 72.3 75.7 72.91994 DADE 314881 16.4 33.3 10.5 14.9 27.71994 DE SOTO 4243 63.8 64.1 63.2 63.4 64.01994 DIXIE 2227 89.1 89.6 84.9 93.1 96.01994 DUVAL 118195 58.8 70.6 40.4 67.4 69.91994 ESCAMBIA 43887 65.0 72.4 51.1 67.7 64.11994 FLAGLER 4924 80.4 80.6 79.9 79.0 79.91994 D M UNI LAB SCHOOL 575 0.2 0.2 0.2 0.0 0.01994 FRANKLIN 1631 79.3 83.7 62.5 73.1 78.31994 GADSDEN 8408 9.0 15.3 8.0 14.3 9.01994 GILCHRIST 2373 93.3 93.5 89.2 92.2 0.01994 GILCHRIST 2373 93.3 93.5 89.2 92.2 0.01994 GLADES 1063 53.9 54.2 53.7 53.1 54.31994 GULF 2243 77.0 78.6 71.7 75.7 81.61994 HAMILTON 2335 46.4 47.0 45.5 51.9 50.11994 HAMILTON 2335 46.4 47.0 45.5 51.9 50.11994 HARDEE 4419 54.7 55.4 55.2 53.5 59.61994 HENDRY 6744 47.3 49.4 43.3 46.8 51.11994 HERNANDO 14795 87.7 87.8 85.6 87.8 88.11994 HERNANDO 14795 87.7 87.8 85.6 87.8 88.11994 HIGHLANDS 10462 66.1 67.3 63.8 63.3 70.21994 HIGHLANDS 10462 66.1 67.3 63.8 63.3 70.21994 HILLSBOROUGH 137770 60.9 66.6 50.4 54.8 62.31994 HOLMES 3699 96.1 96.3 90.3 97.3 90.21994 INDIAN RIVER 12773 76.7 78.4 76.8 54.1 77.81994 JACKSON 7927 65.6 66.9 63.2 66.9 65.71994 JEFFERSON 2123 32.2 32.5 32.0 33.4 34.31994 JEFFERSON 2123 32.2 32.5 32.0 33.4 34.31994 LAFAYETTE 965 84.1 84.2 84.2 83.6 0.01994 LAKE 22636 76.4 78.5 68.4 72.7 79.91994 LEE 47930 75.0 76.3 70.8 72.2 74.21994 LEON 29165 61.6 71.1 45.9 60.9 65.91994 LEVY 5434 78.3 79.5 73.7 75.7 77.21994 LIBERTY 1194 85.1 85.6 81.9 84.0 84.31994 MADISON 3359 42.5 52.3 34.8 78.0 26.71994 MANATEE 30264 72.9 78.2 58.5 58.6 80.11994 MARION 33741 72.9 75.8 63.3 72.4 75.41994 MARTIN 13467 79.3 85.2 59.5 51.8 80.81994 MONROE 9291 75.1 77.5 66.0 69.2 73.41994 NASSAU 9396 86.7 87.3 82.5 84.2 85.11994 OKALOOSA 28639 84.2 84.8 81.1 82.1 82.91994 OKEECHOBEE 6216 71.6 72.3 70.1 69.6 71.11994 ORANGE 117444 57.7 66.3 39.7 57.8 62.51994 OSCEOLA 24009 66.1 72.2 56.2 54.9 60.01994 PALM BEACH 124384 58.3 70.7 36.0 52.0 66.31994 PALM BEACH 124384 58.3 70.7 36.0 52.0 66.31994 PASCO 39804 90.5 92.1 70.1 78.7 94.01994 PINELLAS 99558 79.6 80.9 74.6 78.4 77.0
Exposure to White and Asian Students by the Typical Student of Each Race by District and by Year
» Appendix BDistrict-level exposure rates:

Patterns of Resegregation in Florida’s Schools
Tough Choices Facing Florida’s Governments
24
Year District Name Total Enrollment % of White and AsianWhite exposure to
wht/AsiBlack exposure to
wht/AsiHispanic exposure
to wht/AsiAsian exposure to
wht/Asi
1994 PINELLAS 99558 79.6 80.9 74.6 78.4 77.01994 POLK 68597 70.1 71.7 67.0 64.0 72.51994 PUTNAM 12711 65.2 67.0 62.0 62.3 61.61994 SAINT JOHNS 14389 85.8 87.5 74.7 84.2 88.51994 SAINT LUCIE 25679 62.3 63.6 60.8 57.4 63.91994 SANTA ROSA 18675 93.6 94.1 85.8 91.8 91.91994 SANTA ROSA 18675 93.6 94.1 85.8 91.8 91.91994 SARASOTA 27201 84.6 88.1 66.1 64.9 82.91994 SEMINOLE 52794 76.6 78.8 64.7 76.4 79.21994 SEMINOLE 52794 76.6 78.8 64.7 76.4 79.21994 ST. JOHNS 14389 85.8 87.5 74.7 84.2 88.51994 ST. LUCIE 25679 62.3 63.6 60.8 57.4 63.91994 SUMTER 5611 69.1 72.1 61.6 68.8 74.01994 SUWANNEE 5482 78.7 79.5 75.6 77.9 75.41994 SUWANNEE 5482 78.7 79.5 75.6 77.9 75.41994 TAYLOR 3681 72.0 72.9 69.7 69.5 70.41994 UF - LAB SCHOOL 127 33.1 33.1 33.1 33.1 0.01994 UNION 2074 79.7 79.7 79.5 79.3 80.21994 VOLUSIA 52954 77.5 80.3 67.2 70.2 77.81994 WAKULLA 3887 86.4 86.4 86.3 86.0 86.11994 WALTON 5019 86.6 87.5 80.2 83.8 86.81994 WASHINGTON 3113 79.5 79.6 79.2 77.8 80.51994 WASHINGTON 3113 79.5 79.6 79.2 77.8 80.52004 ALACHUA 28757 56.2 64.4 44.1 60.7 58.92004 BAKER 4771 85.1 85.2 84.9 84.3 84.92004 BAY 26765 81.5 84.3 68.2 79.0 76.02004 BRADFORD 3814 73.4 74.4 70.5 72.5 71.42004 BREVARD 73622 79.4 81.7 68.3 74.4 82.12004 BROWARD 268304 38.1 52.8 22.2 40.3 44.82004 CALHOUN 2307 84.9 86.7 74.1 83.9 76.12004 CHARLOTTE 16855 86.0 86.7 81.1 82.2 84.72004 CITRUS 15328 91.6 91.9 85.4 90.5 91.12004 CLAY 32282 83.6 85.2 75.6 77.4 79.12004 COLLIER 41448 49.8 65.4 31.9 35.1 64.92004 COLUMBIA 9883 74.0 77.2 62.9 77.5 77.12004 DADE 362500 11.3 24.8 6.7 10.9 19.72004 DESOTO 4930 52.2 53.2 51.6 50.9 51.22004 DIXIE 2143 88.7 89.0 86.3 88.8 85.12004DOZIER/OKEECHOBEE 3904 82.1 82.1 82.0 81.9 82.22004 DUVAL 127012 50.3 62.3 36.2 54.9 59.42004 ESCAMBIA 42657 60.3 68.5 47.3 61.2 59.12004 FLAGLER 9691 79.9 80.1 78.9 79.7 79.72004 LABORATORY SCHOOL 519 0.0 0.0 0.0 0.0 0.02004 LABORATORY SCHOOL 639 55.6 55.6 55.6 55.6 55.62004 DEAF AND THE BLIND 745 55.0 56.1 53.1 53.8 62.52004 LABORATORY SCHOOL 2316 55.1 58.9 56.5 44.6 49.52004 FRANKLIN 1361 83.8 87.7 60.9 82.8 91.32004 GADSDEN 6582 4.5 8.5 3.9 7.1 3.72004 GILCHRIST 2851 93.3 93.4 91.4 93.6 92.52004 GLADES 1237 48.7 48.8 47.9 49.0 49.32004 GULF 2177 83.1 83.5 81.6 82.2 81.02004 HAMILTON 1927 44.3 44.5 43.7 46.5 44.62004 HARDEE 5130 41.4 43.3 44.0 39.5 40.82004 HENDRY 7587 33.8 35.0 31.9 33.7 35.22004 HERNANDO 20530 83.7 83.9 81.9 83.4 83.72004 HIGHLANDS 12025 59.1 60.8 56.1 56.8 61.92004 HILLSBOROUGH 185421 50.4 60.8 35.8 43.6 55.42004 HOLMES 3389 95.0 95.5 82.7 93.2 95.22004 INDIAN RIVER 16726 70.9 73.7 69.4 57.6 73.12004 JACKSON 7133 66.1 67.7 62.6 68.4 62.22004 JEFFERSON 1373 27.2 27.8 27.0 27.1 31.92004 LAFAYETTE 1058 79.1 79.2 79.1 78.4 81.72004 LAKE 35570 70.7 72.6 65.2 67.7 67.72004 LEE 69657 62.3 65.8 52.1 59.3 64.62004 LEON 31111 55.8 70.0 37.0 56.0 63.62004 LEVY 6132 78.4 79.4 74.5 75.0 80.02004 LIBERTY 1383 80.3 84.2 62.3 70.3 0.0

Patterns of Resegregation in Florida’s Schools
Tough Choices Facing Florida’s Governments
25
Year District Name Total Enrollment % of White and AsianWhite exposure to
wht/AsiBlack exposure to
wht/AsiHispanic exposure
to wht/AsiAsian exposure to
wht/Asi
2004 MADISON 3060 41.1 47.0 36.7 42.9 44.62004 MANATEE 40017 64.8 72.0 51.8 51.5 70.52004 MARION 40129 68.3 71.0 61.8 64.1 68.12004 MARTIN 17648 73.9 81.7 59.3 47.5 79.22004 MONROE 8619 66.3 69.3 57.5 61.7 67.72004 NASSAU 10624 89.3 89.7 85.5 85.3 87.32004 OKALOOSA 30593 82.8 84.0 76.1 79.4 81.82004 OKEECHOBEE 6828 64.4 65.2 63.9 62.9 67.82004 ORANGE 171057 42.6 54.3 29.5 39.2 48.42004 OSCEOLA 46690 41.7 56.7 30.4 32.0 38.32004 PALM BEACH 172676 48.0 63.5 28.5 40.9 55.82004 PASCO 60305 84.8 86.7 71.6 75.3 84.32004 PINELLAS 110345 73.1 76.6 62.2 68.8 71.42004 POLK 84549 60.6 63.7 58.9 52.0 65.22004 PUTNAM 12299 62.2 68.0 52.5 53.9 60.42004 SANTA ROSA 24910 91.8 92.1 85.7 91.0 91.42004 SARASOTA 38543 79.7 84.4 57.2 64.5 81.52004 SEMINOLE 65798 69.3 71.5 62.9 65.8 70.22004 ST. JOHNS 24269 87.8 89.0 76.4 87.4 90.62004 ST. LUCIE 34578 54.3 56.7 51.4 51.7 56.82004 SUMTER 7058 73.4 77.3 60.0 68.2 81.92004 SUWANNEE 5778 76.7 77.9 72.9 72.8 76.22004 TAYLOR 3373 74.2 75.0 71.8 74.3 72.02004 UNION 2179 80.3 80.5 79.2 80.5 81.02004 LABORATORY SCHOOL 1158 63.4 63.4 63.4 63.4 63.42004 VOLUSIA 64670 72.1 76.3 59.0 63.4 76.22004 WAKULLA 4816 88.3 88.3 88.0 88.5 88.72004 WALTON 6439 88.7 89.4 81.6 87.4 90.42004 WASHINGTON 3449 79.5 79.5 79.3 78.9 79.82014 ALACHUA 27537 50.6 57.5 40.6 53.4 51.12014 BAKER 4936 83.4 83.5 83.4 83.3 82.62014 BAY 26732 72.5 76.1 59.2 68.4 70.12014 BRADFORD 3173 72.6 73.4 70.3 73.0 72.82014 BREVARD 71392 64.8 68.5 52.9 60.3 69.72014 BROWARD 256454 27.2 40.2 16.7 29.7 33.52014 CALHOUN 2273 76.8 78.4 68.2 73.9 68.22014 CHARLOTTE 15625 72.7 74.2 67.3 69.2 73.62014 CITRUS 14821 84.1 84.2 83.3 83.2 83.82014 CLAY 35592 70.8 74.1 61.2 65.5 63.72014 COLLIER 43932 38.3 56.3 25.4 26.5 55.42014 COLUMBIA 10056 68.5 71.4 59.1 70.9 67.42014 DADE 352042 8.7 21.3 5.2 8.2 14.82014 DESOTO 4680 41.3 43.1 40.7 39.9 39.02014 DIXIE 2101 85.1 85.4 80.9 85.7 81.52014 DUVAL 124674 42.0 54.7 28.9 45.0 52.22014 ESCAMBIA 39629 53.0 61.0 41.8 50.8 52.62014 FAMU LAB SCH 482 1.5 1.5 1.5 1.5 0.02014 FAU LAB SCH 2420 46.2 46.1 45.9 46.1 48.12014 FL VIRTUAL 6108 63.9 63.9 63.9 63.9 63.92014 FLAGLER 12793 65.5 66.1 63.7 65.1 65.42014 FRANKLIN 1283 79.9 80.2 79.8 78.7 75.72014 FSU LAB SCH 2411 46.9 49.8 47.2 41.5 41.22014 GADSDEN 5709 3.5 9.8 2.8 4.9 2.92014 GILCHRIST 2615 85.4 85.5 83.1 85.1 87.02014 GLADES 1592 39.8 43.9 43.9 45.1 46.72014 GULF 1872 78.2 78.7 76.8 74.6 77.12014 HAMILTON 1727 43.0 43.4 41.9 44.3 41.32014 HARDEE 5210 31.4 32.7 32.4 30.7 33.02014 HENDRY 7040 21.6 22.8 19.9 21.6 20.52014 HERNANDO 22019 71.3 71.9 70.0 70.0 71.42014 HIGHLANDS 12219 47.0 49.4 44.2 44.9 49.72014 HILLSBOROUGH 202892 39.8 51.0 28.1 34.0 46.82014 HOLMES 3313 91.3 91.5 89.1 90.5 88.42014 INDIAN RIVER 17755 58.0 62.1 54.2 49.8 61.62014 JACKSON 6559 59.4 61.7 55.8 57.6 59.12014 JEFFERSON 886 18.2 20.7 17.6 17.5 17.72014 LAFAYETTE 1244 69.6 69.8 69.9 69.1 66.8

Patterns of Resegregation in Florida’s Schools
Tough Choices Facing Florida’s Governments
26
Year District Name Total Enrollment % of White and AsianWhite exposure to
wht/AsiBlack exposure to
wht/AsiHispanic exposure
to wht/AsiAsian exposure to
wht/Asi
2014 LAKE 41464 58.0 61.1 52.6 54.4 55.72014 LEE 87050 45.9 54.7 33.5 40.0 50.22014 LEON 32460 48.1 63.9 30.6 47.4 60.82014 LEVY 5402 72.8 73.6 70.3 70.0 72.12014 LIBERTY 1327 78.4 80.3 71.8 70.8 81.32014 MADISON 2513 40.5 50.1 32.0 46.8 43.82014 MANATEE 47052 50.9 59.8 40.4 41.4 57.02014 MARION 41566 54.3 58.1 48.7 50.3 53.82014 MARTIN 18800 62.4 70.5 54.8 46.1 65.82014 MONROE 8442 50.5 56.0 40.5 45.9 50.12014 NASSAU 11170 84.0 84.6 80.8 80.5 81.02014 OKALOOSA 29422 71.0 72.9 65.2 67.0 69.12014 OKEECHOBEE 6081 49.8 50.8 48.7 48.5 52.92014 ORANGE 186668 33.8 45.6 23.1 31.0 40.92014 OSCEOLA 57358 28.7 42.5 21.9 23.6 29.02014 PALM BEACH 182417 36.7 53.6 21.9 30.6 46.42014 PASCO 68566 67.9 70.2 61.1 63.1 67.62014 PINELLAS 99760 62.6 68.8 45.0 59.1 64.52014 POLK 96938 45.4 50.8 42.2 39.3 51.02014 PUTNAM 10944 55.3 60.5 50.8 43.8 53.92014 SANTA ROSA 26123 81.5 82.2 77.1 79.3 80.42014 SARASOTA 39199 66.4 71.6 48.5 57.5 69.32014 SEMINOLE 65664 58.1 61.2 50.8 55.5 60.32014 ST. JOHNS 34777 82.8 83.5 75.0 82.2 84.82014 ST. LUCIE 39511 38.6 42.7 34.0 37.4 43.32014 SUMTER 8247 70.4 73.3 55.3 69.7 78.02014 SUWANNEE 6002 65.6 67.6 60.6 62.2 65.62014 TAYLOR 2980 67.5 68.5 65.4 68.7 66.02014 UF LAB SCH 1153 53.1 53.1 53.1 53.1 53.12014 UNION 2343 78.6 78.6 78.5 78.5 78.72014 VOLUSIA 60900 62.1 67.0 53.0 53.0 68.02014 WAKULLA 5100 81.6 81.7 81.2 81.4 81.82014 WALTON 8120 79.0 79.8 72.3 76.8 80.82014 WASHINGTON 3267 75.0 75.1 74.8 74.3 75.4

Patterns of Resegregation in Florida’s Schools
Tough Choices Facing Florida’s Governments
27
Year District NameTotal
Enrollment4
% of Black, Hispanic, and
American Indian
White exposure to Blk/Hsp/AI
Black exposure to Blk/Hsp/AI
Hispanic exposure to Blk/Hsp/AI
Asian exposure to Blk/Hsp/AI
1994 ALACHUA 27981 38.7 34.9 44.6 40.2 42.51994 BAKER 4619 17.3 17.2 17.5 16.9 16.31994 BAY 24006 16.4 14.7 24.2 20.2 22.51994 BRADFORD 4088 22.1 21.6 24.0 19.1 20.41994 BREVARD 64308 18.0 16.0 28.7 19.1 16.21994 BROWARD 195487 46.5 32.5 68.4 45.7 39.51994 CALHOUN 2287 18.0 15.9 28.3 12.9 26.81994 CHARLOTTE 14814 11.4 10.9 15.0 14.4 12.71994 CHARLOTTE 14814 11.4 10.9 15.0 14.4 12.71994 CITRUS 13338 7.0 6.8 9.4 7.9 7.41994 CLAY 23839 10.8 10.1 16.8 13.1 13.01994 COLLIER 25630 33.6 20.5 55.6 61.4 20.01994 COLUMBIA 8878 26.1 25.6 27.7 24.3 27.11994 COLUMBIA 8878 26.1 25.6 27.7 24.3 27.11994 DADE 314881 83.6 66.7 89.5 85.1 72.31994 DE SOTO 4243 36.2 35.9 36.8 36.6 36.01994 DIXIE 2227 10.9 10.4 15.1 6.9 4.01994 DUVAL 118195 41.2 29.4 59.6 32.6 30.11994 ESCAMBIA 43887 35.0 27.6 48.9 32.3 35.91994 FLAGLER 4924 19.6 19.4 20.1 21.0 20.1
1994FLORIDA A AND M
UNI LAB SCHOOL575 99.8 99.8 99.8 0.0 0.0
1994 FRANKLIN 1631 20.7 16.3 37.5 26.9 21.71994 GADSDEN 8408 91.0 84.7 92.0 85.7 91.01994 GILCHRIST 2373 6.7 6.5 10.8 7.8 0.01994 GILCHRIST 2373 6.7 6.5 10.8 7.8 0.01994 GLADES 1063 46.1 45.8 46.3 46.9 45.71994 GULF 2243 23.0 21.4 28.3 24.3 18.41994 HAMILTON 2335 53.6 53.0 54.5 48.1 49.91994 HAMILTON 2335 53.6 53.0 54.5 48.1 49.91994 HARDEE 4419 45.3 44.6 44.8 46.5 40.41994 HENDRY 6744 52.7 50.6 56.7 53.2 48.91994 HERNANDO 14795 12.3 12.2 14.4 12.2 11.91994 HERNANDO 14795 12.3 12.2 14.4 12.2 11.91994 HIGHLANDS 10462 33.9 32.7 36.2 36.7 29.81994 HIGHLANDS 10462 33.9 32.7 36.2 36.7 29.81994 HILLSBOROUGH 137770 39.1 33.4 49.6 45.2 37.71994 HOLMES 3699 3.9 3.7 9.7 2.7 9.81994 INDIAN RIVER 12773 23.3 21.6 23.2 45.9 22.21994 JACKSON 7927 34.4 33.1 36.8 33.1 34.31994 JEFFERSON 2123 67.8 67.5 68.0 66.6 65.71994 JEFFERSON 2123 67.8 67.5 68.0 66.6 65.71994 LAFAYETTE 965 15.9 15.8 15.8 16.4 0.01994 LAKE 22636 23.6 21.5 31.6 27.3 20.11994 LEE 47930 25.0 23.7 29.2 27.8 25.81994 LEON 29165 38.4 28.9 54.1 39.1 34.11994 LEVY 5434 21.7 20.5 26.3 24.3 22.81994 LIBERTY 1194 14.9 14.4 18.1 16.0 15.71994 MADISON 3359 57.5 47.7 65.2 22.0 73.31994 MANATEE 30264 27.1 21.8 41.5 41.4 19.91994 MARION 33741 27.1 24.2 36.7 27.6 24.61994 MARTIN 13467 20.7 14.8 40.5 48.2 19.21994 MONROE 9291 24.9 22.5 34.0 30.8 26.61994 NASSAU 9396 13.3 12.7 17.5 15.8 14.91994 OKALOOSA 28639 15.8 15.2 18.9 17.9 17.11994 OKEECHOBEE 6216 28.4 27.7 29.9 30.4 28.91994 ORANGE 117444 42.3 33.7 60.3 42.2 37.51994 OSCEOLA 24009 33.9 27.8 43.8 45.1 40.01994 PALM BEACH 124384 41.7 29.3 64.0 48.0 33.71994 PALM BEACH 124384 41.7 29.3 64.0 48.0 33.71994 PASCO 39804 9.5 7.9 29.9 21.3 6.01994 PINELLAS 99558 20.4 19.1 25.4 21.6 23.01994 PINELLAS 99558 20.4 19.1 25.4 21.6 23.01994 POLK 68597 29.9 28.3 33.0 36.0 27.51994 PUTNAM 12711 34.8 33.0 38.0 37.7 38.4
Exposure to African American, Hispanic, and American Indian Students by the Typical Student of Each Race by District and by Year

Patterns of Resegregation in Florida’s Schools
Tough Choices Facing Florida’s Governments
28
Year District NameTotal
Enrollment4
% of Black, Hispanic, and
American Indian
White exposure to Blk/Hsp/AI
Black exposure to Blk/Hsp/AI
Hispanic exposure to Blk/Hsp/AI
Asian exposure to Blk/Hsp/AI
1994 SAINT JOHNS 14389 14.2 12.5 25.3 15.8 11.51994 SAINT LUCIE 25679 37.7 36.4 39.2 42.6 36.11994 SANTA ROSA 18675 6.4 5.9 14.2 8.2 8.11994 SANTA ROSA 18675 6.4 5.9 14.2 8.2 8.11994 SARASOTA 27201 15.4 11.9 33.9 35.1 17.11994 SEMINOLE 52794 23.4 21.2 35.3 23.6 20.81994 SEMINOLE 52794 23.4 21.2 35.3 23.6 20.81994 ST. JOHNS 14389 14.2 12.5 25.3 15.8 11.51994 ST. LUCIE 25679 37.7 36.4 39.2 42.6 36.11994 SUMTER 5611 30.9 27.9 38.4 31.2 26.01994 SUWANNEE 5482 21.3 20.5 24.4 22.1 24.61994 SUWANNEE 5482 21.3 20.5 24.4 22.1 24.61994 TAYLOR 3681 28.0 27.1 30.3 30.5 29.61994 UF - LAB SCHOOL 127 66.9 66.9 66.9 66.9 0.01994 UNION 2074 20.3 20.3 20.5 20.7 19.81994 VOLUSIA 52954 22.5 19.7 32.8 29.8 22.21994 WAKULLA 3887 13.6 13.6 13.7 14.0 13.91994 WALTON 5019 13.4 12.5 19.8 16.2 13.21994 WASHINGTON 3113 20.5 20.4 20.8 22.2 19.51994 WASHINGTON 3113 20.5 20.4 20.8 22.2 19.52004 ALACHUA 28757 43.8 35.6 55.9 39.3 41.12004 BAKER 4771 14.9 14.8 15.1 15.7 15.12004 BAY 26765 18.5 15.7 31.8 21.0 24.02004 BRADFORD 3814 26.6 25.6 29.5 27.5 28.62004 BREVARD 73622 20.6 18.3 31.7 25.6 17.92004 BROWARD 268304 61.9 47.2 77.8 59.7 55.22004 CALHOUN 2307 15.1 13.3 25.9 16.1 23.92004 CHARLOTTE 16855 14.0 13.3 18.9 17.8 15.32004 CITRUS 15328 8.4 8.1 14.6 9.5 8.92004 CLAY 32282 16.4 14.8 24.4 22.6 20.92004 COLLIER 41448 50.2 34.6 68.1 64.9 35.12004 COLUMBIA 9883 26.0 22.8 37.1 22.5 22.92004 DADE 362500 88.7 75.2 93.3 89.1 80.32004 DESOTO 4930 47.8 46.8 48.4 49.1 48.82004 DIXIE 2143 11.3 11.0 13.7 11.2 14.9
2004 DOZIER/OKEECHOBEE 3904 17.9 17.9 18.0 18.1 17.8
2004 DUVAL 127012 49.7 37.7 63.8 45.1 40.62004 ESCAMBIA 42657 39.7 31.5 52.7 38.8 40.92004 FLAGLER 9691 20.1 19.9 21.1 20.3 20.3
2004FLORIDA A&M
LABORATORY SCHOOL519 100.0 0.0 100.0 100.0 0.0
2004FLORIDA ATLANTIC
UNIVERSITY LABORATORY SCHOOL
639 44.4 44.4 44.4 44.4 44.4
2004FLORIDA SCHOOL FOR
THE DEAF AND THE BLIND
745 45.0 43.9 46.9 46.2 37.5
2004FLORIDA STATE
UNIVERSITY LABORATORY SCHOOL
2316 44.9 41.1 43.5 55.4 50.5
2004 FRANKLIN 1361 16.2 12.3 39.1 17.2 8.72004 GADSDEN 6582 95.5 91.5 96.1 92.9 96.32004 GILCHRIST 2851 6.7 6.6 8.6 6.4 7.52004 GLADES 1237 51.3 51.2 52.1 51.0 50.72004 GULF 2177 16.9 16.5 18.4 17.8 19.02004 HAMILTON 1927 55.7 55.5 56.3 53.5 55.42004 HARDEE 5130 58.6 56.7 56.0 60.5 59.22004 HENDRY 7587 66.2 65.0 68.1 66.3 64.82004 HERNANDO 20530 16.3 16.1 18.1 16.6 16.32004 HIGHLANDS 12025 40.9 39.2 43.9 43.2 38.12004 HILLSBOROUGH 185421 49.6 39.2 64.2 56.4 44.62004 HOLMES 3389 5.0 4.5 17.3 6.8 4.82004 INDIAN RIVER 16726 29.1 26.3 30.6 42.4 26.92004 JACKSON 7133 33.9 32.3 37.4 31.6 37.82004 JEFFERSON 1373 72.8 72.2 73.0 72.9 68.1

Patterns of Resegregation in Florida’s Schools
Tough Choices Facing Florida’s Governments
29
Year District NameTotal
Enrollment4
% of Black, Hispanic, and
American Indian
White exposure to Blk/Hsp/AI
Black exposure to Blk/Hsp/AI
Hispanic exposure to Blk/Hsp/AI
Asian exposure to Blk/Hsp/AI
2004 LAFAYETTE 1058 20.9 20.8 20.9 21.6 18.32004 LAKE 35570 29.3 27.4 34.8 32.3 32.32004 LEE 69657 37.7 34.2 47.9 40.7 35.42004 LEON 31111 44.2 30.0 63.0 44.0 36.42004 LEVY 6132 21.6 20.6 25.5 25.0 20.02004 LIBERTY 1383 19.7 15.8 37.7 29.7 0.02004 MADISON 3060 58.9 53.0 63.3 57.1 55.42004 MANATEE 40017 35.2 28.0 48.2 48.5 29.52004 MARION 40129 31.7 29.0 38.2 35.9 31.92004 MARTIN 17648 26.1 18.3 40.7 52.5 20.82004 MONROE 8619 33.7 30.7 42.5 38.3 32.32004 NASSAU 10624 10.7 10.3 14.5 14.7 12.72004 OKALOOSA 30593 17.2 16.0 23.9 20.6 18.22004 OKEECHOBEE 6828 35.6 34.8 36.1 37.1 32.22004 ORANGE 171057 57.4 45.7 70.5 60.8 51.62004 OSCEOLA 46690 58.3 43.3 69.6 68.0 61.72004 PALM BEACH 172676 52.0 36.5 71.5 59.1 44.22004 PASCO 60305 15.2 13.3 28.4 24.7 15.72004 PINELLAS 110345 26.9 23.4 37.8 31.2 28.62004 POLK 84549 39.4 36.3 41.1 48.0 34.82004 PUTNAM 12299 37.8 32.0 47.5 46.1 39.62004 SANTA ROSA 24910 8.2 7.9 14.3 9.0 8.62004 SARASOTA 38543 20.3 15.6 42.8 35.5 18.52004 SEMINOLE 65798 30.7 28.5 37.1 34.2 29.82004 ST. JOHNS 24269 12.2 11.0 23.6 12.6 9.42004 ST. LUCIE 34578 45.7 43.3 48.6 48.3 43.22004 SUMTER 7058 26.6 22.7 40.0 31.8 18.12004 SUWANNEE 5778 23.3 22.1 27.1 27.2 23.82004 TAYLOR 3373 25.8 25.0 28.2 25.7 28.02004 UNION 2179 19.7 19.5 20.8 19.5 19.0
2004UNIVERSITY OF
FLORIDA LABORATORY SCHOOL
1158 36.6 36.6 36.6 36.6 36.6
2004 VOLUSIA 64670 27.9 23.7 41.0 36.6 23.82004 WAKULLA 4816 11.7 11.7 12.0 11.5 11.32004 WALTON 6439 11.3 10.6 18.4 12.6 9.62004 WASHINGTON 3449 20.5 20.5 20.7 21.1 20.22014 ALACHUA 27537 43.3 36.5 53.5 40.2 42.52014 BAKER 4936 13.7 13.7 13.8 13.8 14.02014 BAY 26732 21.9 18.7 34.1 25.4 24.12014 BRADFORD 3173 24.9 24.1 27.2 24.4 24.92014 BREVARD 71392 28.2 24.7 39.7 32.5 23.72014 BROWARD 256454 70.2 56.9 81.0 67.7 63.72014 CALHOUN 2273 17.6 16.1 25.4 20.2 24.72014 CHARLOTTE 15625 22.9 21.6 27.6 25.9 22.22014 CITRUS 14821 12.0 11.8 12.6 12.8 12.52014 CLAY 35592 24.7 21.6 33.6 29.5 31.12014 COLLIER 43932 59.7 41.2 72.9 71.9 42.12014 COLUMBIA 10056 26.6 23.9 35.8 24.3 27.92014 DADE 352042 90.8 77.9 93.9 91.3 84.42014 DESOTO 4680 56.5 54.8 57.1 57.9 58.72014 DIXIE 2101 11.3 10.9 15.3 10.7 14.82014 DUVAL 124674 53.5 40.4 67.2 50.2 42.92014 ESCAMBIA 39629 40.3 32.5 51.7 42.2 40.72014 FAMU LAB SCH 482 97.9 97.9 97.9 97.9 0.02014 FAU LAB SCH 2420 49.4 49.4 49.6 49.5 47.62014 FL VIRTUAL 6108 31.1 31.1 31.1 31.2 31.12014 FLAGLER 12793 28.9 28.4 30.7 29.2 28.92014 FRANKLIN 1283 15.8 15.7 15.9 16.2 17.32014 FSU LAB SCH 2411 48.9 45.9 48.5 54.3 54.72014 GADSDEN 5709 95.2 88.5 95.9 93.7 95.92014 GILCHRIST 2615 11.7 11.5 13.5 11.9 10.62014 GLADES 1592 58.1 54.6 54.3 53.6 52.62014 GULF 1872 18.3 17.9 19.2 20.8 19.12014 HAMILTON 1727 54.6 54.1 55.8 53.2 56.12014 HARDEE 5210 67.0 65.8 65.8 67.8 65.72014 HENDRY 7040 77.7 76.5 79.7 77.6 79.02014 HERNANDO 22019 24.4 24.0 25.7 25.6 24.4

Patterns of Resegregation in Florida’s Schools
Tough Choices Facing Florida’s Governments
30
Year District NameTotal
Enrollment4
% of Black, Hispanic, and
American Indian
White exposure to Blk/Hsp/AI
Black exposure to Blk/Hsp/AI
Hispanic exposure to Blk/Hsp/AI
Asian exposure to Blk/Hsp/AI
2014 HIGHLANDS 12219 49.7 47.3 52.4 51.8 46.72014 HILLSBOROUGH 202892 56.1 44.5 67.8 62.3 48.52014 HOLMES 3313 6.5 6.4 9.1 7.3 9.72014 INDIAN RIVER 17755 38.5 34.4 42.2 47.2 34.82014 JACKSON 6559 35.2 33.1 38.6 36.7 35.62014 JEFFERSON 886 81.3 78.7 81.8 81.9 81.82014 LAFAYETTE 1244 27.9 27.8 27.6 28.3 30.42014 LAKE 41464 38.0 35.0 43.0 41.7 40.42014 LEE 87050 51.5 42.7 63.9 57.5 47.22014 LEON 32460 48.3 32.4 65.9 49.2 35.42014 LEVY 5402 23.8 23.0 26.3 26.7 24.22014 LIBERTY 1327 19.8 18.1 26.4 27.1 17.22014 MADISON 2513 57.6 47.7 66.4 50.7 54.32014 MANATEE 47052 45.8 36.9 56.3 55.4 39.72014 MARION 41566 40.8 37.1 46.1 44.8 41.02014 MARTIN 18800 34.9 26.7 42.3 51.5 31.32014 MONROE 8442 46.8 41.3 56.5 51.6 46.82014 NASSAU 11170 11.8 11.3 14.9 15.0 14.72014 OKALOOSA 29422 21.0 19.4 25.9 24.6 22.82014 OKEECHOBEE 6081 47.3 46.3 48.3 48.6 44.02014 ORANGE 186668 63.9 51.7 74.9 66.8 56.62014 OSCEOLA 57358 68.7 54.6 75.7 74.0 68.42014 PALM BEACH 182417 60.5 43.1 75.6 67.0 50.32014 PASCO 68566 27.8 25.6 34.6 32.6 28.12014 PINELLAS 99760 33.3 27.1 51.0 36.6 31.22014 POLK 96938 51.6 46.1 54.7 58.0 45.92014 PUTNAM 10944 41.2 35.8 46.0 52.4 42.72014 SANTA ROSA 26123 11.5 11.1 14.6 13.0 12.32014 SARASOTA 39199 28.8 23.7 46.3 37.8 26.02014 SEMINOLE 65664 38.5 35.5 45.6 41.0 36.42014 ST. JOHNS 34777 14.9 14.3 22.5 15.4 12.92014 ST. LUCIE 39511 57.8 53.5 62.6 59.0 52.92014 SUMTER 8247 26.1 23.4 40.6 26.9 18.82014 SUWANNEE 6002 30.6 28.6 35.7 34.0 30.62014 TAYLOR 2980 28.1 27.3 30.0 27.1 29.92014 UF LAB SCH 1153 40.2 40.2 40.2 40.2 40.22014 UNION 2343 17.2 17.2 17.3 17.3 16.92014 VOLUSIA 60900 34.0 29.1 42.5 43.8 28.02014 WAKULLA 5100 13.8 13.7 14.3 13.9 14.12014 WALTON 8120 16.2 15.5 21.9 18.2 15.12014 WASHINGTON 3267 20.2 20.1 20.4 20.7 19.9

Patterns of Resegregation in Florida’s Schools
Tough Choices Facing Florida’s Governments
31
Year District NameTotal
Enrollment% Low-Income
White exposure to low-income
Black exposure to low-income
Hispanic exposure to low-income
Asian exposure to low-income
Low-income exposure to low-
income1994 ALACHUA 27981 39.1 34.4 43.5 37.9 40.8 46.41994 BAKER 4619 37.0 36.9 37.4 35.9 26.3 39.21994 BAY 24006 35.6 34.5 41.3 34.6 39.3 44.11994 BRADFORD 4088 41.9 41.7 42.6 37.8 42.0 44.61994 BREVARD 64308 22.9 22.6 32.2 25.1 21.2 32.71994 BROWARD 195487 28.5 20.0 41.9 28.2 22.4 43.61994 CALHOUN 2287 43.8 43.4 45.8 44.4 41.2 46.21994 CHARLOTTE 14814 31.0 30.8 33.4 31.8 30.9 35.11994 CHARLOTTE 14814 31.0 30.8 33.4 31.8 30.9 35.11994 CITRUS 13338 37.6 37.6 38.0 35.6 36.2 41.21994 CLAY 23839 18.0 17.7 22.7 16.3 13.5 26.41994 COLLIER 25630 36.7 25.1 55.7 61.4 21.5 57.41994 COLUMBIA 8878 45.6 45.4 46.2 44.9 41.8 48.91994 COLUMBIA 8878 45.6 45.4 46.2 44.9 41.8 48.91994 DADE 314881 50.9 34.4 60.4 49.7 37.8 65.51994 DE SOTO 4243 53.5 53.6 52.1 55.4 48.9 55.21994 DIXIE 2227 52.6 53.0 48.6 52.2 60.3 54.01994 DUVAL 118195 20.9 17.5 26.4 19.4 16.1 27.51994 ESCAMBIA 43887 46.9 40.6 58.2 48.1 49.8 56.91994 FLAGLER 4924 33.1 33.2 33.1 31.9 30.4 35.1
1994FLORIDA A AND
M UNI LAB SCHOOL
575 10.6 10.6 10.6 0.0 0.0 10.6
1994 FRANKLIN 1631 56.0 56.0 56.1 51.5 50.6 57.51994 GADSDEN 8408 68.5 66.0 68.8 69.0 59.0 69.81994 GILCHRIST 2373 40.4 40.4 40.7 48.2 0.0 44.51994 GILCHRIST 2373 40.4 40.4 40.7 48.2 0.0 44.51994 GLADES 1063 52.9 52.7 51.8 55.4 57.3 56.21994 GULF 2243 39.6 39.6 39.7 41.8 42.5 42.21994 HAMILTON 2335 50.9 50.5 51.1 54.5 49.6 53.81994 HAMILTON 2335 50.9 50.5 51.1 54.5 49.6 53.81994 HARDEE 4419 54.7 53.6 53.6 56.7 45.8 56.71994 HENDRY 6744 58.1 57.2 58.6 59.2 54.7 59.21994 HERNANDO 14795 35.8 35.6 39.9 33.1 33.0 39.21994 HERNANDO 14795 35.8 35.6 39.9 33.1 33.0 39.21994 HIGHLANDS 10462 43.3 42.2 45.6 45.9 37.4 46.51994 HIGHLANDS 10462 43.3 42.2 45.6 45.9 37.4 46.5
1994 HILLSBOROUGH 137770 41.8 36.8 51.4 47.3 35.8 53.2
1994 HOLMES 3699 45.5 45.6 43.7 42.5 41.4 47.61994 INDIAN RIVER 12773 21.1 19.8 21.0 40.3 18.4 28.31994 JACKSON 7927 42.8 42.4 43.5 47.1 37.6 45.71994 JEFFERSON 2123 62.7 63.8 62.1 69.3 74.4 65.21994 JEFFERSON 2123 62.7 63.8 62.1 69.3 74.4 65.21994 LAFAYETTE 965 41.0 40.9 40.9 44.7 0.0 42.71994 LAKE 22636 36.5 35.5 39.5 41.2 30.2 41.81994 LEE 47930 35.2 34.0 39.3 37.9 33.5 41.61994 LEON 29165 26.7 19.2 38.9 26.6 23.3 44.81994 LEVY 5434 45.3 45.5 45.0 43.1 45.1 48.91994 LIBERTY 1194 33.8 33.7 33.6 35.5 29.3 34.31994 MADISON 3359 59.0 54.5 62.4 52.1 73.1 63.11994 MANATEE 30264 37.1 32.1 50.6 50.3 30.2 49.21994 MARION 33741 43.0 41.3 49.4 40.1 35.5 50.01994 MARTIN 13467 26.7 22.3 41.2 46.5 24.6 38.31994 MONROE 9291 28.3 26.8 34.1 32.3 27.7 33.61994 NASSAU 9396 27.0 27.0 27.0 27.3 25.9 31.41994 OKALOOSA 28639 22.1 22.0 24.1 21.3 19.6 28.11994 OKEECHOBEE 6216 51.0 50.3 50.0 54.2 47.5 54.51994 ORANGE 117444 30.9 26.7 40.0 30.6 25.8 41.9
Exposure to Low-Income Students by the Typical Student of Each Race by District and by Year

Patterns of Resegregation in Florida’s Schools
Tough Choices Facing Florida’s Governments
32
Year District NameTotal
Enrollment% Low-Income
White exposure to low-income
Black exposure to low-income
Hispanic exposure to low-income
Asian exposure to low-income
Low-income exposure to low-
income1994 OSCEOLA 24009 32.6 30.0 36.5 37.3 35.8 38.11994 PALM BEACH 124384 33.2 23.5 49.5 40.7 25.0 49.51994 PALM BEACH 124384 33.2 23.5 49.5 40.7 25.0 49.51994 PASCO 39804 38.7 37.7 52.9 46.0 33.1 45.21994 PINELLAS 99558 30.4 29.0 35.7 33.4 33.6 39.41994 PINELLAS 99558 30.4 29.0 35.7 33.4 33.6 39.41994 POLK 68597 43.0 41.5 44.7 52.6 35.2 50.51994 PUTNAM 12711 54.2 53.8 53.2 61.8 57.8 55.81994 SAINT JOHNS 14389 21.0 19.4 32.3 24.2 16.7 31.41994 SAINT LUCIE 25679 39.2 38.4 39.3 46.9 35.2 47.21994 SANTA ROSA 18675 28.4 27.7 40.7 29.3 28.1 35.41994 SANTA ROSA 18675 28.4 27.7 40.7 29.3 28.1 35.41994 SARASOTA 27201 15.8 14.3 22.9 27.7 15.6 21.91994 SEMINOLE 52794 19.8 17.8 31.2 19.4 15.6 31.71994 SEMINOLE 52794 19.8 17.8 31.2 19.4 15.6 31.71994 ST. JOHNS 14389 21.0 19.4 32.3 24.2 16.7 31.41994 ST. LUCIE 25679 39.2 38.4 39.3 46.9 35.2 47.21994 SUMTER 5611 55.7 55.2 56.8 58.4 50.8 58.11994 SUWANNEE 5482 38.0 37.8 38.3 39.8 32.2 40.31994 SUWANNEE 5482 38.0 37.8 38.3 39.8 32.2 40.31994 TAYLOR 3681 21.9 22.9 19.5 18.3 17.3 28.6
1994UF - LAB SCHOOL
127 0.0 0.0 0.0 0.0 0.0 0.0
1994 UNION 2074 34.1 33.9 34.5 38.9 33.7 36.61994 VOLUSIA 52954 35.0 33.1 42.3 39.9 30.8 41.51994 WAKULLA 3887 30.5 30.5 30.5 27.4 26.4 33.61994 WALTON 5019 39.1 39.4 36.7 40.9 37.1 48.51994 WASHINGTON 3113 43.7 43.4 44.7 48.8 36.5 47.61994 WASHINGTON 3113 43.7 43.4 44.7 48.8 36.5 47.62004 ALACHUA 28757 48.5 42.7 57.5 44.6 42.0 58.92004 BAKER 4771 45.2 45.3 44.8 42.9 41.2 47.52004 BAY 26765 47.9 45.7 58.9 50.3 48.8 58.22004 BRADFORD 3814 60.2 60.5 59.1 66.0 56.2 63.22004 BREVARD 73622 32.7 30.2 44.7 38.7 27.7 46.02004 BROWARD 268304 41.1 29.4 55.9 36.9 31.3 56.52004 CALHOUN 2307 54.9 53.6 62.3 57.7 57.9 58.52004 CHARLOTTE 16855 26.7 26.0 31.4 29.7 28.4 32.12004 CITRUS 15328 45.5 45.7 43.0 44.4 45.1 47.82004 CLAY 32282 25.0 24.6 27.5 26.0 22.9 32.42004 COLLIER 41448 45.9 30.0 63.6 61.1 30.2 64.92004 COLUMBIA 9883 56.1 54.7 61.0 54.7 51.4 59.22004 DADE 362500 64.1 45.5 73.9 62.9 49.8 73.22004 DESOTO 4930 61.1 59.9 56.3 66.4 62.8 67.92004 DIXIE 2143 65.7 65.9 64.3 65.8 61.3 66.4
2004DOZIER/OKEEC
HOBEE3904 0.0 0.0 0.0 0.0 0.0 0.0
2004 DUVAL 127012 45.1 36.7 54.9 43.4 35.3 56.92004 ESCAMBIA 42657 62.8 56.3 72.8 62.8 64.0 70.12004 FLAGLER 9691 31.8 31.8 31.5 33.0 32.6 35.3
2004FLORIDA A&M LABORATORY
SCHOOL519 46.6 0.0 46.6 46.6 0.0 46.6
2004
FLORIDA ATLANTIC
UNIVERSITY LABORATORY
SCHOOL
639 27.2 27.2 27.2 27.2 27.2 27.2
2004
FLORIDA SCHOOL FOR
THE DEAF AND THE BLIND
745 75.7 74.9 76.7 76.8 72.0 77.2

Patterns of Resegregation in Florida’s Schools
Tough Choices Facing Florida’s Governments
33
Year District NameTotal
Enrollment% Low-Income
White exposure to low-income
Black exposure to low-income
Hispanic exposure to low-income
Asian exposure to low-income
Low-income exposure to low-
income
2004
FLORIDA STATE UNIVERSITY
LABORATORY SCHOOL
2316 19.7 21.6 20.4 14.4 16.9 22.0
2004 FRANKLIN 1361 61.4 60.6 65.5 66.5 66.1 64.72004 GADSDEN 6582 76.1 75.9 76.0 77.2 70.1 77.72004 GILCHRIST 2851 50.4 50.4 51.6 51.7 47.2 51.62004 GLADES 1237 69.1 69.6 68.3 68.8 68.8 71.42004 GULF 2177 48.4 48.7 47.2 51.9 40.3 50.42004 HAMILTON 1927 59.2 59.7 57.7 64.1 57.6 61.62004 HARDEE 5130 65.8 63.1 60.0 68.7 68.8 68.62004 HENDRY 7587 66.9 65.8 65.7 68.0 64.3 68.32004 HERNANDO 20530 47.0 46.8 49.7 47.0 45.3 50.12004 HIGHLANDS 12025 61.5 60.3 63.3 63.3 57.9 62.9
2004 HILLSBOROUGH 185421 52.0 42.3 64.6 59.4 43.9 64.5
2004 HOLMES 3389 57.3 57.6 48.3 59.7 55.8 58.42004 INDIAN RIVER 16726 45.9 43.8 46.4 56.8 44.2 51.62004 JACKSON 7133 56.2 55.5 57.6 56.7 55.8 59.92004 JEFFERSON 1373 72.5 71.2 73.0 73.2 59.5 73.92004 LAFAYETTE 1058 55.5 55.3 55.6 56.7 50.7 55.92004 LAKE 35570 41.6 40.7 45.7 41.6 39.0 46.12004 LEE 69657 46.1 42.6 54.6 50.2 42.7 54.32004 LEON 31111 38.2 25.7 54.9 38.0 28.7 59.22004 LEVY 6132 55.7 55.7 54.5 59.8 50.6 57.82004 LIBERTY 1383 50.3 53.8 33.5 44.6 0.0 57.22004 MADISON 3060 63.1 60.1 65.3 64.8 46.3 68.52004 MANATEE 40017 44.8 37.5 57.4 59.0 40.0 58.42004 MARION 40129 56.5 55.3 59.0 60.1 51.2 61.42004 MARTIN 17648 35.8 28.2 50.1 60.9 30.6 52.22004 MONROE 8619 39.0 36.3 46.3 43.6 36.0 44.72004 NASSAU 10624 35.6 35.7 35.2 36.2 34.1 40.32004 OKALOOSA 30593 31.4 30.5 37.2 33.8 30.1 41.72004 OKEECHOBEE 6828 55.5 54.7 54.4 57.4 50.1 58.12004 ORANGE 171057 50.6 41.3 60.3 54.6 43.4 59.92004 OSCEOLA 46690 55.8 45.6 62.0 62.8 56.7 62.52004 PALM BEACH 172676 39.1 26.0 53.9 47.4 30.8 56.02004 PASCO 60305 47.5 46.9 50.9 50.9 42.2 56.12004 PINELLAS 110345 43.1 39.5 52.3 50.8 47.1 54.22004 POLK 84549 51.6 49.6 51.8 59.0 42.2 58.92004 PUTNAM 12299 67.6 65.0 68.4 80.4 65.6 71.72004 SANTA ROSA 24910 31.6 31.1 42.7 29.4 29.0 41.32004 SARASOTA 38543 40.7 37.0 57.8 53.9 36.0 49.52004 SEMINOLE 65798 29.5 26.8 37.9 33.4 27.0 40.12004 ST. JOHNS 24269 19.5 17.7 37.7 19.2 13.9 42.02004 ST. LUCIE 34578 50.1 47.9 52.3 53.7 47.4 55.12004 SUMTER 7058 55.1 51.6 67.0 60.1 50.2 63.32004 SUWANNEE 5778 53.3 52.7 54.5 58.1 43.1 57.32004 TAYLOR 3373 60.2 60.0 61.0 62.0 62.6 66.02004 UNION 2179 48.2 48.0 48.9 50.6 43.7 49.9
2004
UNIVERSITY OF FLORIDA
LABORATORY SCHOOL
1158 16.2 16.2 16.2 16.2 16.2 16.2
2004 VOLUSIA 64670 39.4 36.3 49.0 46.1 32.8 49.42004 WAKULLA 4816 36.3 36.3 36.1 38.6 33.5 42.02004 WALTON 6439 50.3 49.2 62.2 51.9 42.3 58.72004 WASHINGTON 3449 56.5 56.4 56.9 61.4 52.8 59.52014 ALACHUA 27537 48.7 44.2 55.9 46.2 45.1 53.42014 BAKER 4936 57.9 57.8 58.0 57.9 58.5 58.72014 BAY 26732 60.3 58.3 68.9 61.7 57.4 65.0

Patterns of Resegregation in Florida’s Schools
Tough Choices Facing Florida’s Governments
34
Year District NameTotal
Enrollment% Low-Income
White exposure to low-income
Black exposure to low-income
Hispanic exposure to low-income
Asian exposure to low-income
Low-income exposure to low-
income2014 BRADFORD 3173 72.7 72.5 73.2 72.2 73.5 73.82014 BREVARD 71392 48.4 44.7 61.2 52.3 38.8 58.32014 BROWARD 256454 61.2 48.1 74.7 55.7 50.1 70.82014 CALHOUN 2273 67.7 67.7 66.9 68.0 71.7 68.12014 CHARLOTTE 15625 63.2 62.0 66.8 66.4 60.9 65.92014 CITRUS 14821 64.7 64.7 63.8 64.9 62.9 65.82014 CLAY 35592 41.5 42.1 40.7 41.1 36.1 48.32014 COLLIER 43932 61.7 43.9 74.3 73.4 44.9 73.22014 COLUMBIA 10056 60.8 59.3 65.4 60.4 59.1 65.02014 DADE 352042 73.9 54.7 84.7 72.7 62.0 80.02014 DESOTO 4680 62.2 62.0 61.5 62.5 62.3 63.22014 DIXIE 2101 97.5 97.8 93.0 98.8 92.8 98.42014 DUVAL 124674 43.9 37.6 51.0 42.0 35.1 51.72014 ESCAMBIA 39629 63.6 57.7 72.2 64.8 62.1 69.62014 FAMU LAB SCH 482 71.4 71.4 71.4 71.4 0.0 71.42014 FAU LAB SCH 2420 40.1 40.2 40.6 40.3 36.5 40.82014 FL VIRTUAL 6108 44.8 44.7 45.3 44.4 45.0 45.62014 FLAGLER 12793 62.3 61.6 65.4 62.0 59.8 66.92014 FRANKLIN 1283 63.1 61.8 63.7 68.8 83.0 70.12014 FSU LAB SCH 2411 28.6 29.2 28.7 27.5 27.4 28.82014 GADSDEN 5709 69.6 70.6 69.4 69.9 69.9 71.42014 GILCHRIST 2615 47.6 47.5 48.7 48.0 46.3 49.02014 GLADES 1592 58.5 66.4 72.4 69.7 68.6 72.12014 GULF 1872 59.0 59.3 58.2 58.2 57.5 60.22014 HAMILTON 1727 47.8 47.3 47.5 49.7 52.9 49.42014 HARDEE 5210 79.3 78.5 77.4 79.9 78.8 79.82014 HENDRY 7040 82.1 81.4 81.1 82.6 81.8 82.72014 HERNANDO 22019 64.1 63.5 67.4 64.8 59.2 67.12014 HIGHLANDS 12219 75.8 74.1 77.6 77.4 73.8 76.8
2014 HILLSBOROUGH 202892 60.4 48.5 72.1 67.5 49.4 72.0
2014 HOLMES 3313 70.5 70.6 69.6 70.6 65.1 71.22014 INDIAN RIVER 17755 57.3 52.6 63.2 65.2 52.8 65.92014 JACKSON 6559 67.1 66.4 68.0 68.7 64.2 68.82014 JEFFERSON 886 70.8 69.0 71.1 71.5 71.0 71.12014 LAFAYETTE 1244 63.1 62.8 62.5 64.0 68.7 63.72014 LAKE 41464 34.8 34.2 37.8 34.7 31.2 37.82014 LEE 87050 66.6 59.4 76.0 71.8 61.3 73.62014 LEON 32460 36.1 29.1 44.0 38.0 25.4 44.72014 LEVY 5402 55.0 54.9 55.1 55.6 52.2 56.42014 LIBERTY 1327 49.7 49.1 53.2 50.9 50.1 50.82014 MADISON 2513 59.9 57.4 62.3 57.7 56.9 60.82014 MANATEE 47052 61.3 51.0 73.1 72.5 51.7 74.72014 MARION 41566 64.6 63.5 66.2 66.4 55.5 67.42014 MARTIN 18800 44.0 36.8 51.4 58.4 41.2 54.02014 MONROE 8442 48.6 43.0 56.6 54.4 46.3 57.42014 NASSAU 11170 49.1 49.4 47.5 46.8 45.6 50.72014 OKALOOSA 29422 43.5 41.7 49.8 46.6 41.9 51.02014 OKEECHOBEE 6081 76.3 75.3 76.1 77.7 76.7 77.62014 ORANGE 186668 60.2 48.4 70.4 63.6 51.5 70.82014 OSCEOLA 57358 72.0 63.5 75.8 75.0 71.1 74.62014 PALM BEACH 182417 57.0 40.5 71.2 63.5 46.7 70.62014 PASCO 68566 56.3 56.1 56.8 57.8 45.2 65.52014 PINELLAS 99760 45.6 42.1 53.8 49.0 45.9 50.22014 POLK 96938 58.5 55.5 60.5 61.9 50.5 62.22014 PUTNAM 10944 77.7 75.7 77.2 84.8 75.6 79.32014 SANTA ROSA 26123 43.6 43.0 52.2 40.9 40.9 50.92014 SARASOTA 39199 51.5 48.0 64.2 57.6 48.1 56.52014 SEMINOLE 65664 47.0 43.4 55.2 50.3 43.1 53.22014 ST. JOHNS 34777 23.7 22.4 42.1 23.4 15.1 42.82014 ST. LUCIE 39511 62.0 60.3 63.8 62.6 59.1 63.52014 SUMTER 8247 59.6 57.1 73.7 61.3 42.7 66.0

Patterns of Resegregation in Florida’s Schools
Tough Choices Facing Florida’s Governments
35
Year District NameTotal
Enrollment% Low-Income
White exposure to low-income
Black exposure to low-income
Hispanic exposure to low-income
Asian exposure to low-income
Low-income exposure to low-
income2014 SUWANNEE 6002 48.0 47.9 48.6 47.7 49.3 49.92014 TAYLOR 2980 56.3 55.7 57.1 54.6 57.1 58.02014 UF LAB SCH 1153 25.2 25.2 25.2 25.2 25.2 25.22014 UNION 2343 64.5 64.5 64.9 63.3 59.8 65.42014 VOLUSIA 60900 62.6 59.2 69.5 68.2 56.3 67.02014 WAKULLA 5100 52.9 52.9 52.6 54.1 49.6 54.52014 WALTON 8120 52.7 51.3 67.1 54.2 38.2 62.72014 WASHINGTON 3267 69.7 69.9 69.2 68.0 70.2 70.8

Patterns of Resegregation in Florida’s Schools
Tough Choices Facing Florida’s Governments
36
» Endnotes1 Charles T. Clotfelter, After Brown: The Rise and Retreat of School Desegregation, Princeton: Princeton Univ. Press, 2004.
2 G. Orfield and S. Eaton, Dismantling Desegregation, the Quiet Reversal of Brown v. Board of Education, New York: New Press, 1996.
3 U.S. Government Accountability Office, K-12 EDUCATION Better Use of Information Could Help Agencies Identify Disparities and Address Racial Discrimination, Washington, 2016.
4 Reed Sarratt, The Ordeal of Desegregation, New York: Harper and Row, 1966, p. 41.
5 Martin A. Dyckman. 2006. Floridian of His Century: The Courage of Governor LeRoy Collins. Gainesville: University Press of Florida, p. 160.
6 Larry Hughes, William Gordon and Larry Hillman, Desegregating America’s Schools, Southeastern Equity Center in Florida, l980.
7 G. Orfield, Public School Desegregation in the United States, 1968-1980, Washington: Joint Center for Political Studies, 1983, pp. 8-19.
8 Keyes v. Denver School Dist. No. 1, 413 U.S. l89 (1973)
9 Swann v. Charlotte-Mecklenburg Bd. Of Education, 402 U.S. 1 (1971)
10 U.S. House of Representatives, Committee on the Judiciary, Subcommittee No. 5, Hearing, School Busing, 92nd Cong., 2nd Sess, 1972, p. 1228
11 G. Orfield, “How to Make Desegregation Work: The Adaptation of Schools to Their Newly Integrated Student Bodies,” Law and Contemporary Problems, Vol. 39, No. 1 (Winter 1975), pp 314-340.
12 In the major testing case, Debra P, Gary Orfield testified about what many Florida educators told him about the many obvious forms of educational inequality before desegregation. The state was going to deny high school diplomas to one-fourth of black seniors who had completed their course requirements on the basis of an exit test given without warning and after admittedly inferior preparation in segregated schools before desegregation. The court challenge delayed the test for four years and required preparation for the exam, setting an important precedent.
13 Orfield, Public School Desegregation in the United States, 1968-1980, Washington: Joint Center for Political Studies, 1983
14 G. Orfield, Must We Bus? Segregated Schools and National Policy, Washington: Brookings Institution, 1978, p. 412.
15 Michael W. Giles; Douglas S. Gatlin; Everett F. Cataldo, Determinants of Resegregation: Compliance/Rejection Behavior and Policy Alternatives, Natl Science Foundation: Everett F. Cataldo, Michael W. Giles and Douglas S. Gatlin, School Desegregation Policy. Lexington, Mass.: Lexington Books, 1978;
16 Dowell, discussed earlier, turned back authority to local school boards which were authorized to end desegregation efforts if basic requirements spelled out in the l969 Green decision had been honored for a time. Freeman v. Pitts, 111 S. Ct 1430 (1992) permitted partial resegregation even if the order had never been fully complied with. Missouri v. Jenkins, 115 S. Ct 2938 (1995) ended the compensatory programs designed to repair the educational damage of segregation even before they had worked, lowering the requirements on state governments implicated in causing segregation.

Patterns of Resegregation in Florida’s Schools
Tough Choices Facing Florida’s Governments
37
17 Orfield, Gary. “Conservative Activists and the Rush toward Resegregation.” In Law and School Reform, edited by Jay Heubert, pp. 39-87. New Haven: Yale Univ. Press, 1999.
18 Historically illegally segregation of black from white students in separate schools was described by the courts as a “dual school system.” A unitary system meant that the dual features had bene remedied and all students were expected to receive non-segregated fair education. The Supreme Court, however, lowered the standards for making this determination and gave great discretion to federal district judges to rule that what they thought was practicable had been done and then release the district from court supervision.
19 Florida Advisory Committee to the U.S. Commission on Civil Rights, Desegregation of Public School Districts in Florida: 18 Public School Districts Have Unitary Status, 16 Remain Under Court Jurisdiction, Washington, p. 19. (Washington, U.S. Civil Rights Comm., 2007).
20 Sean F. Reardon and John T. Yun, “Integrating Neighborhoods, Segregating Schools: The Retreat from School Desegregation in the South,” in John Charles Boger and Gary Orfield, eds., School Resegregation: Must the South Turn Back?, Chapel Hill: Univ. of North Carolina Press, 1999, pp. 51-69.
21 Charles Vert Willie, Ralph Edwards, Michael J. Alves, Student Diversity, Choice and School Improvement, Westport, CT: Bergin and Garvey, 2002, chapter 3 and p. 160.
22 https://www.washingtonpost.com/news/answer-sheet/wp/2015/06/15/heres-what-jeb-bush-really-did-to-public-education-in-florida/?utm_term=.879f9b5aaa7b
23 Kathryn M. Borman, Sherman Dorn, eds, Education Reform in Florida: Diversity and Equity in Public Policy, SUNY Press, Feb 1, 2012
24 Multiracial schools are those with any three races representing 10 percent or more of the total student enrollment respectively.
25 There is a vast body of research showing that desegregated schools are related to substantial benefits for all children. Some studies encompass: (1) Schofield, J. (1995). Review of research on school desegregation’s impact on elementary and secondary school students. In J. A. Banks & C. A. M. Banks (Eds.), Handbook of multicultural education (pp. 597–616). New York: Macmillan Publishing, (2) Mickelson, R.A., & Nkomo, M. (2012). Integrated schooling, life-course outcomes, and social cohesion in multiethnic democratic societies. Review of Research in Education, 36, 197-238, (3) Pettigrew, T., & Tropp, L. (2006). A meta-analytic test of intergroup contact theory. Journal of Personality and Social Psychology, 90(5), 751-783, (4) Ready, D., & Silander, M. (2011). School racial and ethnic composition and young children’s cognitive development: Isolating family, neighborhood and school influences. In E. Frankenberg & E. DeBray (Eds.), Integrating schools in a changing society: New policies and legal options for a multiracial generation (pp. 91-113). Chapel Hill, NC: The University of North Carolina Press, and (5) Killen, M., Crystal, D., & Ruck, M (2007). The social developmental benefits of intergroup contact among children and adolescents. In E. Frankenberg & G. Orfield (Eds.), Lessons in integration: Realizing the promise of racial diversity in American schools (pp. 31-56). Charlottesville, VA: University of Virginia Press.
26 Exposure to draconian, “zero tolerance” discipline measures is linked to dropping out of school and subsequent entanglement with the criminal justice system, a very different trajectory than attending college and developing a career. Advancement Project & The Civil Rights Project (2000). Opportunities suspended: The devastating consequences of zero tolerance and school discipline policies. Cambridge, MA: Civil Rights Project. Retrieved from http://civilrightsproject.ucla.edu/research/k-12-education/schooldiscipline/opportunities-suspended-the-devastating-consequences-of-zero-tolerance-and-school-disciplinepolicies/
27 Wells, A. S., & Crain, R. L. (1994). Perpetuation theory and the long-term effects of school desegregation. Review of Educational Research, 64, 531-555; Braddock, J. H., & McPartland, J. (1989). Social-psychological processes that perpetuate racial segregation: The relationship between school and employment segregation. Journal of Black Studies, 19(3), 267-289.

Patterns of Resegregation in Florida’s Schools
Tough Choices Facing Florida’s Governments
38
28 Balfanz, R., & Legters, N. E. (2004). Locating the dropout crisis: Which high schools produce the nation’s dropouts? In G. Orfield (Ed.), Dropouts in America: Confronting the graduation rate crisis (pp. 57-84). Cambridge: Harvard Education Press, 2004; Swanson, C. (2004). Sketching a portrait of public high school graduation: Who graduates? Who doesn’t? In G. Orfield, (Ed.), Dropouts in America: Confronting the graduation rate crisis (pp. 13-40). Cambridge, MA: Harvard Education Press.
29 The definition of low-income students in the report is students who are eligible for free or reduced-price lunch (FRPL) under the National School Lunch Program.
30 EDFacts data collected for SEDA encompass assessment outcomes for students in School Years 2008-09, 2009-10, 2010-11, 2011-12, and 2012-13; grades 3 to 8; and test subjects English Language Arts (ELA) and Math. There is one observation per district; values are averaged across years, grades and subjects.
31 The demographic and economic measures include data regarding median income, percent with a bachelor’s degree or higher, poverty rate, Supplemental Nutrition Assistance Program (SNAP) rate, single mother headed household rate, and unemployment rate in the American Community Survey Data.

Patterns of Resegregation in Florida’s Schools
Tough Choices Facing Florida’s Governments
39
» Notes
________________________________________________________________________________________________________________________________________________________________________________________________________________________________________________________________________________________________________________________________________________________________________________________________________________________________________________________________________________________________________________________________________________________________________________________________________________________________________________________________________________________________________________________________________________________________________________________________________________________________________________________________________________________________________________________________________________________________________________________________________________________________________________________________________________________________________________________________________________________________________________________________________________________________________________________________________________________________________________________________________________________________________________________________________________________________________________________________

Patterns of Resegregation in Florida’s Schools
Tough Choices Facing Florida’s Governments
40
» Notes
________________________________________________________________________________________________________________________________________________________________________________________________________________________________________________________________________________________________________________________________________________________________________________________________________________________________________________________________________________________________________________________________________________________________________________________________________________________________________________________________________________________________________________________________________________________________________________________________________________________________________________________________________________________________________________________________________________________________________________________________________________________________________________________________________________________________________________________________________________________________________________________________________________________________________________________________________________________________________________________________________________________________________________________________________________________________________________________________


Beginning in 2005, the LeRoy Collins Institute has published a number of reports in a series called Tough Choices: Shaping Florida’s Future. Many of these publications provide an in-depth analysis of Florida tax and spending and local governments’ pension and other retirement benefits. This latest report is the first to focus on trends in school resegregation. The report is especially important to the LeRoy Collins Institute since it comes 60 years after Gov. Collins’ denunciation of the Florida Legislature’s interposition resolution that Florida could block or ignore the Supreme Court’s Brown v. Board of Education decision. It is also important since the impetus for this report came from a longstanding member of the board, Brian Dassler, who died unexpectedly in Spring 2017. This report reflects the passion and foresight of both Gov. Collins and Dr. Dassler.
This report was written by Dr. Gary Orfield and Jongyeon (Joy) Ee. Dr. Orfield is a distinguished research professor of education, law, political science and urban planning at the University of California, Los Angeles (UCLA) and the co-director of The Civil Rights Project at UCLA. Ee is a postdoctoral researcher at The Civil Rights Project at UCLA. The authors were assisted by Dr. Carol Weissert, Collins Institute Director and Professor of Political Science at Florida State University. Amy Stubblefield and Jennifer Fennell contributed to the editing, proofing, and production of the report. All publications from the Institute can be found on its website: http://collinsinstitute.fsu.edu/
About the LeRoy Collins Institute: Established in 1988, the LeRoy Collins Institute is a nonpartisan, statewide policy organization which studies and promotes creative solutions to key private and public issues facing the people of Florida and the nation. The Institute, located in Tallahassee at Florida State University, is affiliated and works in collaboration with the State University System of Florida. Named in honor of former Florida Governor LeRoy Collins, the Institute is governed by a distinguished board of directors, chaired by Lester Abberger. Other board members include executives, local elected officials, and other professionals from throughout the state.
Chairman Lester Abberger, Tallahassee
Director Carol S. Weissert, Ph.D., Tallahassee
Jim Apthorp, Tallahassee
Jane Collins Aurell, Tallahassee
LeRoy “Roy” Collins III, Tampa
Rena Coughlin, Jacksonville
Richard Crotty, Orlando
Sandy D’Alemberte, Tallahassee
Bryan Desloge, Tallahassee
Rick Edmonds, St. Petersburg
Joel Embry, Jacksonville
Nikki Fried, Fort Lauderdale
Pegeen Hanrahan, Gainesville
Jim Ley, Sarasota
John Marks, Tallahassee
John Martinez, Orlando
Audrey Moran, Jacksonville
Janet Owen, Jacksonville
David Rasmussen, Ph.D., Tallahassee
Don Slesnick, Coral Gables
Katy Sorenson, Coral Gables
Hansel Tookes, Palm Beach
Nicole Washington, Miami Beach
Alan Williams, Tallahassee
LeRoy Collins Institute Board of Directors:
LeRoy Collins Institute - FSU Campus P: 850.644.1441 • F: 850.644.1442
506 West Pensacola Street • Tallahassee, Florida 32306-1601http://collinsinstitute.fsu.edu - Follow us on Twitter: @LCInstitute_FL