lca of recycling cotton - esu-servicesesu-services.ch/fileadmin/download/publiclci/wendin-2016-lca...
TRANSCRIPT

LCA of recycling cotton This is the report of the Life Cycle Assessment of recycling cotton (mechanically) Date: 25 August 2016 Available to: public Report number: 75 Issued by: Miljögiraff, Södra Larmgatan 6, 411 16 Gothenburg.

Report 75 Life Cycle Assessment on Recycling cotton 2
1 Abstract1 The question is - “What is the environmental load of recycling cotton versus virgin production”? Various studies show that recycled fibre has the potential to lower impacts from fibre, textile and garment production. However, currently we lack quantitative data for how much impacts are lowered. H&M wants to understand the environmental benefits of collecting and recycling textiles and garments into fibre ready for spinning compared to sourcing virgin material. The reference used for virgin cotton is a well-known study for Cotton Incorporated by PE and generic LCI data from Ecoinvent.
Figure 1: Process steps to recycle cotton from textile.
The most relevant and comparable environmental effects categories are Water use (m3), Climate change (kg CO2 eq.) and Fossil depletion measured as Primary Energy (MJ). The comparison is per 1000 kg cotton fibre.
Figure 2 The most relevant and comparable aspects of conventional and recycled cotton as diagram. Note that Climate impact is excluding sequestration and crop rotation (without excluding that the Climate impact in PE is 268).
1 Abstract from Miljögiraff Report 75
StoresHub per country
Sorting Shredding
2740
1958
15000
10801
3310
34699
635
381
5749
0 5000 10000 15000 20000 25000 30000 35000 40000
WATER USE (AND CONSUMPTION)
CLIMATE IMPACT
PRIMARY ENERGY (FOSSIL)
Comparable, absolut figures
Recycled cotton fibre Ecoinvent - virgin cotton fibre PE - Virgin cotton fibre

Report 75 Life Cycle Assessment on Recycling cotton 3
Unit Aspect PE - Virgin cotton fibre Ecoinvent - virgin cotton fibre
Recycled cotton fibre
m3 Water use (and consumption)
2740 10801 635
Kg CO2-eq Climate impact 1958 3310 381
Kg SO2-eq Acidification 18,7 36,3 4,5
Kg PO4-eq Eutrophication 4,04 1,3 0,6
Kg R11-eq Ozone depletion 0,0000076 0,000325 5,46887E-05
Kg ethene-eq
Smog creation 0,558 0,9 0,2
MJ Primary energy (fossil) 15000 34699 5749
Table 1: The comparable aspects of one tonne conventional and recycled cotton as diagram. Note that Climate impact is excluding sequestration and crop rotation.
For the comparison of the PE study with the H&M project it is very relevant to show the effect of the assumptions to include sequestration and allocation to other crops. Using the assumptions in the reference study would change the result regarding climate change but not the overall environmental impacts. Collecting clothes and recycling cotton mechanically has a considerable potential to lower the overall environmental impact on the most important effect categories (though not an all). The result is limited to the aspects that has been possible to compare, but none of these aspects would point in the other direction. Rather it would strengthen the case for recycling. The result is also limited in validity due to how the environmental impacts are allocated between recycled and reused clothes. The physical allocation used can be regarded as a worst case. The environmental effect categories water scarcity, occupation of land and toxicity, was not comparable to the reference system, which would point in the direction that recycling is even more important. A recommendation is to change the perspective for the comparison. Instead of comparing per the functional unit (FU) 1 kg fibre ready for spinning, it would be more constructive to use the FU X times of using 1000 kg product of virgin and recycled cotton. In an example where X is 400 (2 life cycles) it would result in half as much cultivation and incineration and one extra process of transport and recycling. Adding the GWP indicate that the potential contribution of recycling in one extra loop, is roughly 40% lower climate impact (if recycled fibre completely replaces virgin). Recycled cotton fibre would have much lower environmental impact if the recycling is made closer to the country of collection. Keep in mind that the washing and drying of clothes are the most important phase of the life cycle.

Report 75 Life Cycle Assessment on Recycling cotton 4
Table of content 1 Abstract .................................................................................................................................................................... 2 1 Introduction and methodological framework ............................................................................................................ 7
1.1 Background ....................................................................................................................................................... 7 1.2 Life Cycle Assessment (LCA) ........................................................................................................................... 8
2 Goal and Scope ...................................................................................................................................................... 10 2.1 Goal ................................................................................................................................................................. 10 2.2 Scope .............................................................................................................................................................. 10
2.2.1 Name and Function of the Product/System ............................................................................................ 10 2.2.2 The Functional Unit ................................................................................................................................. 10 2.2.3 System Boundary .................................................................................................................................... 11 2.2.4 Allocation Procedure ............................................................................................................................... 11 2.2.5 Life Cycle Methodology ........................................................................................................................... 12 2.2.6 Interpretation to be used ......................................................................................................................... 13 2.2.7 Data requirements ................................................................................................................................... 14 2.2.8 Data quality requirements ....................................................................................................................... 14 2.2.9 Assumptions ............................................................................................................................................ 16 2.2.10 Type of critical review .............................................................................................................................. 16 2.2.11 Limitations of LCA ................................................................................................................................... 17
3 Life cycle inventory analysis (LCI) .......................................................................................................................... 18 3.1 Recycled Cotton (mechanically) ...................................................................................................................... 18
3.1.1 Primary data (collected) .......................................................................................................................... 18 3.1.2 Calculated data ....................................................................................................................................... 19 3.1.3 Validation of data ..................................................................................................................................... 19 3.1.4 Collection and sorting .............................................................................................................................. 19 3.1.5 Shredding at Artistic Milliners (AM) ......................................................................................................... 21
3.2 Reference system, PE virgin Cotton ............................................................................................................... 22 3.2.1 Primary data (collected) .......................................................................................................................... 22 3.2.2 Calculated data ....................................................................................................................................... 23
3.3 Reference system, Ecoinvent, virgin Cotton ................................................................................................... 24 3.3.1 Primary data (collected) .......................................................................................................................... 24 3.3.2 Calculated data ....................................................................................................................................... 24
4 Life cycle impact assessment (LCIA) ..................................................................................................................... 25 4.1 Method for impact assessment ....................................................................................................................... 25
4.1.1 Weighting and normalisation ................................................................................................................... 25 4.1.2 Single issues ........................................................................................................................................... 26
4.2 Classification ................................................................................................................................................... 26 4.3 Characterisation .............................................................................................................................................. 27 4.4 Results - Recycling cotton fibers ..................................................................................................................... 28
4.4.1 Overview of environmental effect: ........................................................................................................... 28 4.4.2 Global Warming Potential (GWP) ........................................................................................................... 31 4.4.3 Water Scarcity ......................................................................................................................................... 33 4.4.4 Primary Energy Demand (PED or CED) ................................................................................................. 34 4.4.5 Ozone depletion ...................................................................................................................................... 35 4.4.6 Acidification Potential (AP) ...................................................................................................................... 36 4.4.7 Eutrophication Potential (EP) .................................................................................................................. 37 4.4.8 Photo chemical Ozone Creation Potential (POCP) ................................................................................. 38 4.4.9 Toxicity .................................................................................................................................................... 39
4.5 Reference system, PE virgin Cotton ............................................................................................................... 40 4.5.1 Global Warming Potential (GWP) ........................................................................................................... 41 4.5.2 Water Scarcity ......................................................................................................................................... 44 4.5.3 Primary Energy Demand (PED or CED) ................................................................................................. 45 4.5.4 Ozone depletion ...................................................................................................................................... 45 4.5.5 Acidification Potential (AP) ...................................................................................................................... 45 4.5.6 Eutrophication Potential (EP) .................................................................................................................. 46 4.5.7 Photo chemical Ozone Creation Potential (POCP) ................................................................................. 47 4.5.8 Toxicity .................................................................................................................................................... 47
4.6 Reference system, Ecoinvent, virgin Cotton ................................................................................................... 48 4.6.1 Global Warming Potential (GWP) ........................................................................................................... 48 4.6.2 Water Scarcity ......................................................................................................................................... 48

Report 75 Life Cycle Assessment on Recycling cotton 5
4.6.3 Primary Energy Demand (PED or CED) ................................................................................................. 48 4.6.4 Ozone depletion ...................................................................................................................................... 49 4.6.5 Acidification Potential (AP) ...................................................................................................................... 49 4.6.6 Eutrophication Potential (EP) .................................................................................................................. 49 4.6.7 Photo chemical Ozone Creation Potential (POCP) ................................................................................. 49 4.6.8 Toxicity .................................................................................................................................................... 49
4.7 Comparison with reference system ................................................................................................................. 50 5 Life Cycle Interpretation.......................................................................................................................................... 54
5.1 Completeness check ....................................................................................................................................... 55 5.2 Sensitivity check .............................................................................................................................................. 56
5.2.1 Sensitivity Recycled cotton ..................................................................................................................... 56 5.2.2 Sensitivity in reference system ................................................................................................................ 57
5.3 Consistency check .......................................................................................................................................... 57 5.3.1 Shredding ................................................................................................................................................ 58
5.4 Conclusions, limitations and recommendations .............................................................................................. 59 5.4.1 Improvement opportunities of logistics .................................................................................................... 59 5.4.2 Improvement opportunities of sorting ...................................................................................................... 59
6 References ............................................................................................................................................................. 60 7 Appendix ................................................................................................................................................................. 63 List of figures: Figure 1: Process steps to recycle cotton from textile. ..................................................................................................... 2 Figure 2 The most relevant and comparable aspects of conventional and recycled cotton as diagram. Note that Climate impact is excluding sequestration and crop rotation (without excluding that the Climate impact in PE is 268). . 2 Figure3. The four phases of Life Cycle Assessment ........................................................................................................ 8 Figure4: The concept of Life Cycle Assessment. .............................................................................................................. 9 Figure 5: LCA system boundaries of manufacturing. ...................................................................................................... 11 Figure6: System (black box) or unit (high fidelity) data. .................................................................................................. 14 Figure 7: Process steps to recycle cotton from textile. ................................................................................................... 18 Figure 8 Environmental System Analysis as standard for data to be collected. (Kurdve, 2014) .................................... 18 Figure 9: Recycled cotton impact assessment overview, ReCiPe Endpoints Single score. .......................................... 28 Figure 10: Recycled cotton impact assessment overview, ReCiPe Normalisation. ....................................................... 29 Figure 11 GWP in kg CO2 eq. / 1 kg recycled cotton fibre, per group............................................................................ 31 Figure 12 GWP for electricity produced at AM. ............................................................................................................... 32 Figure 13 Water footprint (Hoekstra) of 1 kg recycled cotton fibres. .............................................................................. 33 Figure 14 Primary Energy Demand in MJ / 1 kg recycled cotton fibre, per group. ......................................................... 34 Figure 15 Ozone Depletion in kg CFC-11 eq / 1 kg recycled cotton fibre, per group. .................................................... 35 Figure 16: Terrestrial acidification in kg SO2 eq./ 1 kg recycled cotton fibre, per group. ............................................... 36 Figure 17: Eutrophication kg PO4--- eq1 kg recycled cotton fibre, per group. ............................................................... 37 Figure 18: Photochemical oxidant formation kg NMVOC / 1 kg recycled cotton fibre, per group. .............................. 38 Figure 19: Toxicity Normalised / 1 kg recycled cotton fibre, per group. .......................................................................... 39 Figure 20 GWP for conventional cotton fibre (Cotton Incorporated and PE International, 2012) ................................... 43 Figure 21 Conventional cotton, Water scarcity (Cotton Incorporated and PE International, 2012) ................................ 45 Figure 22 Conventional cotton, eutrophication (Cotton Incorporated and PE International, 2012) ................................ 46 Figure 23 Conventional cotton, POCP (Cotton Incorporated and PE International, 2012) ............................................ 47 Figure 24 The water balance for virgin cotton fibre on a global market. ......................................................................... 48 Figure 25 Primary energy demand for Virgin Cotton in reference system Ecoinvent and the impact assessment method CED 16. ............................................................................................................................................................... 49 Figure 27 Comparison of only the relevant and comparable environmental effects....................................................... 51 Figure 28 Comparison of all environmental effects, in absolute figures. ........................................................................ 51 Figure 29 Comparison of Smog, Eutrophication and Acidification, in absolute figures. ................................................. 52 Figure 30 Comparison of Ozone depletion, in absolute figures. ..................................................................................... 52 Figure31, Relationships between elements within the interpretation phase with the other phases of LCA ................... 54 Figure 32 Scenario in GWP for change in transport. ...................................................................................................... 56 Figure 33 Scenario for changes in assumption in reference study. ................................................................................ 57 Figure 34 Comparison of the environmental impact (ReCiPe Endpoint) for electricity production at internally at AM, generic Ecoinvent data for Russian el from natural gas and the grid in India. ............................................................... 58 Figure 35 Illustration of the Impact Assessment of an LCA ............................................................................................ 64 Figure36: Example of a harmonised midpoint-endpoint model for climate change, linking to human health and ecosystem damage. ........................................................................................................................................................ 66

Report 75 Life Cycle Assessment on Recycling cotton 6
Figure37: ReCiPe Characterisation links. ....................................................................................................................... 67 Figure 38: Allocation example ......................................................................................................................................... 74 Figure 39: Allocation of environmental impacts between two life cycles according to the PP allocation method. Here regarding to incineration of waste and resulting energy products (Image from IEC, 2008, p14). .................................. 75 List of tables Table 1: The comparable aspects of one tonne conventional and recycled cotton as diagram. Note that Climate impact is excluding sequestration and crop rotation. .................................................................................................................... 3 Table 2: ISO documents relevant to LCA, a selection. ..................................................................................................... 8 Table 3 Addressed aspects and the method for assessment. ........................................................................................ 12 Table 4 Impact categories used in reference study (Cotton Incorporated and PE International, 2012). ........................ 13 Table 5 Data for the model of boat transports of 80 tonnes of textiles to I:CO india. ..................................................... 20 Table 6 Inventory for the shredding at AM. ..................................................................................................................... 21 Table 7 Production volumes of cotton globally (USDA 2011). ........................................................................................ 22 Table 8 Process contribution with ReCiPe Endpoint (H) V1.12 / World ReCiPe H/A. .................................................... 29 Table 9 ReCiPe Midpoint (H) V1.12 / World Recipe H, Characterisation per Unit 1 kg recycled cotton. ....................... 30 Table 10 GWP in kg CO2 eq. / 1 kg recycled cotton fibre, per group. ............................................................................ 31 Table 11 GWP for 1 kg recycled cotton, major contributions. ......................................................................................... 32 Table 12: Water footprint (Hoekstra) of 1 kg recycled cotton fibres. ............................................................................... 33 Table 13 Toxicity in CTU / 1 kg recycled cotton fibre...................................................................................................... 39 Table 14: Reference values for virgin cotton fibres (Cotton Incorporated and PE International, 2012). ........................ 40 Table 15 Comparison in results of all aspects with reference system (per tonne). ........................................................ 50 Table 16: Impact category name and unit in ReCiPe (Goedkoop, o.a., 2009) ............................................................... 68

Report 75 Life Cycle Assessment on Recycling cotton 7
1 Introduction and methodological framework
1.1 Background Since 2013 H&M has enabled customers to return all their unwanted textiles, regardless of brand or condition, to any H&M store around the globe. H&M is dedicated to extensively reduce textiles going to landfill and instead implement circular processes turning textile waste into valuable resources. This garment collection program has a positive effect on the product lifecycle through reuse, repurpose or recycling possibilities. Products are, as a first priority, to give the clothes a second life (reuse) and secondly to recycle the fabric into fibres to produce new products. Currently, this is a mechanical process with certain limitations. It’s only available for cotton products and the recycled fibre content is limited to 20% in new products. The ambition is to develop the recycling process to be able to handle other mixes of fibre and increase the share of recycled fibres in new products to 100%. During 2015 H&M collected more than 7 000 tons garments in different stores since the program started. -“Various studies show that recycled fibre has the potential to lower impacts from fibre, textile and garment production. However, currently we lack quantitative data for how much impacts are lowered. H&M wants to understand the environmental benefits of collecting and recycling textiles and garments into fibre ready for spinning compared to sourcing virgin material.” The results of this study are to be used for internal buying strategies and communication and reporting to all stakeholders including customers (e.g. sustainability report, in-store communication etc.).” (Börjesson & Karlsson, 150722)

Report 75 Life Cycle Assessment on Recycling cotton 8
1.2 Life Cycle Assessment (LCA) In 1997, the European Committee for Standardization published their first set of international guidelines for the performance of LCA. This ISO 14040 standard series has become widely accepted amongst the practitioners of LCA and is continuously being developed along with progressions within the field of LCA (Rebitzer et al. 2003). The guidelines for LCA are described in two documents; ISO 14040, that contains the main principles and structure for preforming an LCA, and ISO 14044, which includes detailed requirements and recommendations. Furthermore, a document containing the format for data-documentation (ISO/TS 14048), as well as technical reports with guidelines for the different stages of an LCA (ISO/TR 14049 and ISO/TR 14047), are available in this standard series. (Carlsson & Pålsson, 2011) The environmental management method Life Cycle Assessment (LCA) is used in this study. The LCA has been performed according to the ISO 14040 series standards. Table 2: ISO documents relevant to LCA, a selection.
Area Document Use
LCA ISO 14040 (2006a) Basic principles and structure for conducting LCA
ISO 14044 (2006b) Detailed requirements and recommendations
ISO/TS 14048 (2002) Format for data documentation
ISO/TR 14047 (2012a) Examples of application: environmental impact assessment
ISO/TR 14049 (2012b) Examples of application: goal and scope description, life cycle inventory
ÖVRIGT ISO 14025 (2006c) Environmental Product Declarations
ISO 14046 (2014a) Water footprint
ISO/TS 14067 (2013) Carbon footprint
Figure3. The four phases of Life Cycle Assessment
1. The scope, including system boundary and level of detail, of an LCA depends on the subject and the intended use of the study. The depth and the breadth of LCA can differ considerably depending on the goal of a particular LCA.
2. The life cycle inventory analysis phase (LCI phase) is the second phase of LCA. It is an inventory of input per output data with regard to the system being studied. It involves the collection of the data necessary to meet the goals of the defined study.
3. The life cycle impact assessment phase (LCIA) is the third phase of the LCA. The purpose of LCIA is to provide additional information to help assess a product system’s LCI results so as to better understand their environmental significance.
4. Life cycle interpretation is the final phase of the LCA procedure, in which the results of an LCI or an LCIA, or both, are summarized and discussed as a basis for conclusions, recommendations and decision-making in accordance with the goal and scope definition.

Report 75 Life Cycle Assessment on Recycling cotton 9
Figure4: The concept of Life Cycle Assessment.
LCA can assist in o identifying opportunities to improve the environmental performance of products at various
points in their life cycle, o informing decision-makers in industry, government or non-government organizations (e.g. for
the purpose of strategic planning, priority setting, product or process design or redesign), o the selection of relevant indicators of environmental performance, including measurement
techniques, o Marketing (e.g. implementing an Eco labelling scheme, making an environmental claim, or
producing an environmental product declaration). LCA addresses the environmental aspects and potential environmental impacts) (e.g. use of resources and environmental consequences of releases) throughout a product's life cycle from raw material acquisition through production, use, end-of-life treatment, recycling and final disposal (i.e. cradle-to-grave). A major part of the environmental impact of a product depends on choices taken during the product development phase, e.g. materials, processes, functionality etc. The basic principles for abatement come from the discipline of cleaner technology, is defined in the concept of Integrated Product Policy (European Commission, Environment).

Report 75 Life Cycle Assessment on Recycling cotton 10
2 Goal and Scope The question is -“What is the environmental load of recycling cotton versus virgin production”? We know that the conventional cotton farming has severe sustainability issues that has to be addressed. But what are the alternative fiber resources? Organic farming methods are promising but still small scale. Better Cotton Initiative (a big project by WWF) are also reducing the environmental impacts substantially. Alternative fibres, such as Lyocell from dissolved pulp is also a promising contribution. Recycling cotton textiles in chemical and mechanical ways are a promising option to these solutions. This study is looking into the environmental aspects of mechanical recycling of cotton textile. However, it does not consider other scenarios for used textile.
2.1 Goal To have an assessment of the environmental impacts of mechanical recycling of cotton textiles into new fabric. And then to make a comparison between recycled cotton fibre and virgin cotton fibre. The ambition is to be viable for generic comparison but the process of mechanical recycling is still under development and specific data has been used. The intended audience is for internal strategies, external collaborations and public stakeholders. The report is to be used as a basis for active communication.
2.2 Scope
2.2.1 Name and Function of the Product/System
The name of the product assessed is “Cotton fibre ready for spinning”. The scope is limited in order to focus the resources and to avoid inclusion of specific LCI data that may distort the results from answering the question “what is the environmental impact of recycling cotton versus virgin production”. The systems being compared are in principle:
Garment collecting in stores Transport to recycling facilities Mechanical recycling process Cotton fibre ready for spinning
Cotton production Transport of lint cotton Ginning Cotton fibre ready for spinning The report compares only recycled fibres and new fibres. The report cannot make any assessment on what is the best approach to deal with clothes which are not used anymore. In reality recycled cotton would be combined with virgin cotton in a new product.
2.2.2 The Functional Unit The scope of an LCA shall clearly specify the functions (performance characteristics) of the system being studied. The functional unit shall be consistent with the goal and scope of the study. One of the primary purposes of a functional unit is to provide a reference to which the input and output data are normalized. The functional unit of this study is 1 kg of cotton fibre ready for spinning, to be used in textile for clothing. It is assumed that the weight of the cotton used in textile is the same for recycled and virgin cotton fibre.

Report 75 Life Cycle Assessment on Recycling cotton 11
2.2.3 System Boundary
The system boundary determines which unit processes shall be included within the LCA. The selection of the system boundary shall be consistent with the goal of the study. The criteria used in establishing the system boundary shall be identified and explained. The system boundary for this study is limited to material production (fibre for spinning) excluding manufacturing (fabric) and assembly (i.e. jeans). In manufacturing, extraction of raw materials, production of energy, generation of waste and emissions they are taken account for all along the process chain. The life cycle follows a core; around which boundaries are drawn depending on how peripheral the issues are. It is described in Figure 5. System boundary 1: Material composition for the component, manufacturing and assembly. System boundary 2: Production of material, energy and transport. System boundary 3: Acquisition of raw materials and production of energy. Figure 5: LCA system boundaries of manufacturing.
2.2.4 Allocation Procedure
Economic allocation will be used as far as possible. When the variations in data are expected to change the result, the sensitivity is analysed. When other allocation is used it is expressed clearly if it may be significant to the results.
Method chosen: Recycled Content: "Allocation cut-off by classification" (in accordance with ISO standard - not allocated to the recycled content )
Method not chosen: Allocation Default: "Allocation at the point of substituition" (in accordance with Ecoinvent policy - allocated to the recycled content)
The concept is further described in Appendix 5

Report 75 Life Cycle Assessment on Recycling cotton 12
2.2.5 Life Cycle Methodology
The impact categories, category indicators and characterization models used are determined by the demands stated in ISO 14040/44 and chosen to give the best answers of the goal and scope. In order to assess which category of impact that is the most important the LCIA method ReCiPe (Goedkoop, o.a., 2009) will be used. The impact assessment methods and characterization models used are further described in part 4.1 Method for impact assessment. For the sake of comparison the same impact categories addressed by the most well-known public global study (Cotton Incorporated and PE International, 2012) of virgin (conventional) cotton will also be used. Another public study on cotton from US and Turkey was also used as a reference (Julian Allen, 2005). The environmental impact categories used in these studies can be seen in Table 4. The environmental impact categories that are being addressed with specific methods can be seen Table 3.
Aspect Unit Reference system Method
Water use and consumption m3 yes CML 2Inventory
Water Scarcity m3 No Hoekstra 3
Climate impact (GWP) Kg CO2-eq Yes IPCC11
Chemical use (toxicity) CTUh No USEtox 4
Acidification (AP) Kg SO2-eq Yes ReCiPe 5
Eutrophication (EP) Kg PO4-eq Yes CML2
Ozone depletion (OD) Kg R11-eq Yes ReCiPe 5
Smog creation (POCP) Kg ethene-eq Yes CML2
Primary energy fossil (PED) MJ Yes CED16
Occupation of land m2 no ReCiPe5 Table 3 Addressed aspects and the method for assessment.
2 CML IA Baseline version 3.03 World 2000 3 Hoekstra et al 2012 (Water Scarcity) V1.02 4 USEtox (recommended + interim) 1.04 5 ReCiPe Midpoint (H) 1.12 Methods, World

Report 75 Life Cycle Assessment on Recycling cotton 13
Table 4 Impact categories used in reference study (Cotton Incorporated and PE International, 2012).
2.2.6 Interpretation to be used Interpretation of the results are made by identifying the data elements that contribute significantly to each impact category, evaluating the sensitivity of these significant data elements, assessing the completeness and consistency of the study, and drawing conclusions and recommendations based on a clear understanding of how the LCA was conducted and the results were developed.

Report 75 Life Cycle Assessment on Recycling cotton 14
2.2.7 Data requirements
This LCA include specific information on primary flow (boundary 1) and generic information on secondary flow (boundary 2 and 3). It is common practice to scan for the most important factors (“cut off” at 95% as a minimum) rather than being very thorough. The level of depth (fidelity) depends on the availability of inventory data. In general, the more details you know, the more environmental impact is revealed. That has to be balanced by covering the whole perspective of the life cycle. By employing general data from certified organisations, the fidelity and amount of Life Cycle Inventory (LCI) data may increase very much. It is crucial however, to understand that specific producers may differ significantly from general practice. Only by in depth investigations can it be perfectly determined. The picture below describes how a system can be studied on different depth.
Figure6: System (black box) or unit (high fidelity) data.
For the best flexibility of adjusting LCI data to changes in the product systems, it is also necessary to allow many process steps. General process steps are thus separated from supplier specific parts.
2.2.8 Data quality requirements
Data quality requirements shall be specified to enable the goal and scope of the LCA to be met. The data quality requirements should address the following:
time-related coverage: age of data and the minimum length of time over which data should be collected;
geographical coverage: geographical area from which data for unit processes should be collected to satisfy the goal of the study;
technology coverage: specific technology or technology mix;
precision: measure of the variability of the data values for each data expressed (e.g. variance);
completeness: percentage of flow that is measured or estimated;
representativeness: qualitative assessment of the degree to which the data set reflects the true population of interest (i.e. geographical coverage, time period and technology coverage);
consistency: qualitative assessment of whether the study methodology is applied uniformly to the various components of the analysis;
reproducibility: qualitative assessment of the extent to which information about the methodology and data values would allow an independent practitioner to reproduce the results reported in the study;
sources of the data;
Uncertainty of the information (e.g. data, models and assumptions). The methodology for the gathering of data has been that assigner send out a project description, then a format is created on web (SimaPro Share and Collect) and then it is followed up by meetings (Skype). All major assumptions are validated with assigner and described in this report. Specific LCI data is developed for core of the LCA the main processes. This study use also generic data from Ecoinvent (Hirschier, o.a., ecoinvent Version 3.2 Database, 2015) and no “Input/output data”6 has been used. Most data for “upstream” and “downstream” processes are based on general processes that are thoroughly validated. Generic data is often comprehensive which have to be considered in the overall assessment. An example of generic data is the production of consumables, energy, waste treatment and transports.
6 Regional data for gross net balance per product or services.
System
Unit

Report 75 Life Cycle Assessment on Recycling cotton 15

Report 75 Life Cycle Assessment on Recycling cotton 16
The following requirements were set (see below) for all the central LCI data to be used. More peripheral aspect may deviate from the DQI based in the rule for “cut off”. Time period:
Mixed data 2010 and after 2005-2009
Geography Europe, Western Europe, Eastern Asia, South East Asia, China Africa
Technology Average technology Modern technology Best available technology
Representativeness
Data from a specific process and company Average from a specific process Average from processes with similar outputs
Multiple output allocation
Physical causality Socio-economic causality
Substitution allocation Not applicable
Waste treatment allocation
Not applicable
Cut-off rules Less than 1% (environmental relevance)
System boundary Second order (material/energy flows including operations)
Boundary with nature Agricultural production is part of production system
2.2.9 Assumptions
Attributional perspective is used. Assumption is that I: Collect would collect clothes and re-use or recycle them to other products, regardless if H&M uses the system to recycle textile. As a consequence, the system boundaries are kept to a minimum. The alternative would be to employ a consequential perspective that consider the effects. It may be that people buy less fast fashion, that reuse and recycling is scaled up and that farming of cotton is being reduced. Assumptions that are specific, are noted under the life cycle inventory, chapter Life cycle inventory analysis (LCI).
2.2.10 Type of critical review
A critical review is necessary to allow for external communication and comparison with results from another study on conventional cotton. This is a public study with comparative assertions. Therefore, a review panel would be recommended according to ISO 14040 if it should be published. For the moment it is agreed that the review is conducted only by one person. The LCA expert (Jungbluth) is engaged to perform the critical review.
The International Organization for Standardization (ISO) (2006a:6.3) states the following concerning the procedure for the review of a comparative study planned to be published: “A critical review may be carried out as a review by interested parties. In such a case, an external independent expert should be selected by the original study commissioner to act as chairperson of a review panel of at least three members. Based on the goal and scope of the study, the chairperson should select other independent qualified reviewers. This panel may include other interested parties affected by the conclusions drawn from the LCA, such as government agencies, non-governmental groups, competitors and affected industries.”

Report 75 Life Cycle Assessment on Recycling cotton 17
2.2.11 Limitations of LCA The broad scope of analysing a whole life cycle of a product and the holistic approach can only be achieved at the expense of simplifying other aspects. Thus the following limitations have to be taken into account as recently summarised by (Guinée, o.a., 2004)
o LCA does not address localised aspects, it is not a local risk assessment tool o LCA is typically a steady-state, rather than a dynamic approach o LCA does not include market mechanisms or secondary effects on technological development o LCA regards processes as linear, both in the economy and in the environment o LCA focuses on environmental aspects and says nothing on social, economic and other
characteristics o LCA involves a number of technical assumptions and value choices that are not purely science
based

Life Cycle Assessment of recycling cotton Report-75
Page 18
3 Life cycle inventory analysis (LCI) The inventory was created by preparing and sending out a format to the suppliers appointed by Hennes & Mauritz (Karlsson E. , 2015). I: Collect GmbH (Gupta, Environmental manager, 2015), is supplying the data on collection of textile from the stores and sorting out reusable clothes and recyclable textile. Artistic Milliners (Uddin, 2015) is supplying the data on shredding to fibre for spinning. Figure 7 show the four main steps included in the system boundaries of this study. All steps will be described in depth described in this chapter.
Figure 7: Process steps to recycle cotton from textile.
3.1 Recycled Cotton (mechanically)
3.1.1 Primary data (collected) The specific data was collected using the digital format SimaPro Collect (PRé Sustainability, 2016). As a basis for the questionnaire, the approach Environmental System Analysis was used.
Figure 8 Environmental System Analysis as standard for data to be collected. (Kurdve, 2014)
The answers were completed over webinar and with information from Environmental reports.
StoresHub per country
Sorting Shredding

Life Cycle Assessment of recycling cotton
Report-75
Page 19
3.1.2 Calculated data
The CO2 emissions from natural gas at AM in Pakistan have been calculated (Lubian, 2016) based on the specific heat value (Uddin, 2015).
3.1.3 Validation of data A check on data validity is conducted during the process of data collection to confirm and provide evidence that the data quality requirements for the intended application have been fulfilled. The emission calculations were controlled by calculating the carbon content from the general composition of natural gas, the emission data from Swedish EPA and Ecoinvent. The conclusion is that the values for the CO2 emissions are slightly underestimated in relation to the input of gas. In relation to the output of electricity it may be slightly overestimated as the efficiency rate is around 25% (Lubian, 2016) in comparison to average in US at 28% (EIS US, 2016).
3.1.4 Collection and sorting
Supplier of data: I:COLLECT GMBH A der Strusbek 19, 22926 Ahrensburg Germany Recorder Marcus Wendin at Miljögiraff. In this assessment of the environmental impacts of recycling cotton to fibre ready to be new yarn we have based the calculation on existing data from I:Collect 2014 in India. In order to make a representative model that is also correct we use existing records from the ICO processes in Germany and make adjustments when needed to suit the actual situation. We are following the ISO standard for LCA, which means that the source of data and assumptions are possible to trace back from the documentation. Transports of raw material are starting at the collection points at stores. The clothes are packed and sent to hubs with the same transport service (Distribution Centre) that deliver the clothes to the stores. The average mode of transport is estimated by recorder and H&M to be Truck with payload 16-32 ton and emission standard Euro IV. Transport from stores to hub are estimated by recorder and H&M as an average per country.
In Japan the collection Points for H&M are in 50% Tokyo 0 km and 50 % Osaka 502 km (guestimate by recorder). Average distance is 251 km.
In Korea the collection Points for H&M are in 100% Seoul (guestimate by recorder). Distance is 600 km (i.e. 6 hours by train)
In Malaysia the collection Points for H&M are in 50% Kuala Lumpur, 50% Pasir Gudang. Distance is 171 km (half of 343 km).
StoresHub per country
Sorting Shredding

Life Cycle Assessment of recycling cotton
Report-75
Page 20
The clothes are not stored in the hubs but only loaded to a new container. Then the clothes are sent from the hub to port. The average distance is estimated by ICO to 100 km with truck with payload 16-32 ton and emission standard Euro IV. The ports for shipments to India are
Tokyo, Japan
Pusan, South Korea
Pasir Gudang, Malaysia The distances are from Searates (Searates, 2015) The share textile per port is based on the assumption to be the same as the share for I:CO in general (Gupta, Analysis 09_38_43, 2014). The details on the supply of textiles are described in Appendix 14 as the ton of textiles as inflow per country. The share is calculated based on only the countries used in the H&M project which is 8% of the total) to I Collect in general 2014. (For the specific recycling project at H&M US may not be a supplier.)
Nation share of textile Distance (km) Sea Transport (ton*km)
Tokyo, Japan 89% 10578 754119
United States 0% 16673 0
Saint Petersburg, Russia 0% 13487 0
Pasir Gudang, Malaysia 9% 5214 39047
Ashdod, Israel 0% 5742 0
Pusan, South Korea 2% 7896 9631
Table 5 Data for the model of boat transports of 80 tonnes of textiles to I:CO india.
The products at I:CO are reused textile 40% and recycled textile 60% Waste is 0% (in India) Therefore 100% cotton jeans are used. The jeans are cleaned of metal contaminants and cut to wipers. These are then sent for further processing to Spinning mills or shredded/pulled to produce fibres at own site. (Port Kandla, India to Karachi, Pakistan.) The transport from ICO in India to AM in Pakistan via boat and lorry is included in this dataset. For details about the LCI data, see: Appendix 9 ICO 2014 (H&M) Appendix 10 Transport to I:CO (H&M) Appendix 11 Transport by DC from Collection Points to Hubs (H&M)

Life Cycle Assessment of recycling cotton
Report-75
Page 21
3.1.5 Shredding at Artistic Milliners (AM)
Supplier of data: Artistic Milliners Denim Division Shredding Masood Khan (Senior Quality Assurance Manager) Contact No: 03002288146 Shredding of Input of raw material (denim jeans legs from I:CO) into Output of recycled cotton fibre.
Description Data Unit
Input of raw material (denim jeans legs from I:CO) 106.5 tons/year
Output of recycled cotton fibre 103.3 tons/year
Electricity used in processing of raw materials (Process from cutting of Pieces to Cotton Bales.)
3600 kWh/year
Cotton waste produced from processing of raw materials (shredding) 3.2 tons/year
Other waste produced from processing of raw materials (shredding) Nil tons/year
Chemicals used in processing of raw materials (shredding) Nil tons/year
Table 6 Inventory for the shredding at AM.
Using electricity produced at site from Natural gas. The amount of natural gas consumed yearly is put in relation to the amount of electricity produced yearly. The kg of CO2 is calculated based on the lower specific heat value (9,83 kWh/m3) (Uddin, 2015), that gives a higher content of carbon per energy content in natural gas. The emissions have also been cross calculated based on the assumptions about composition in the natural gas. Completed with data based on Ecoinvent 3, burned in gas turbine, for compressor station RU. For details about the LCI data, see Appendix 7 Electricity at Artistic Milliners Denim Division and Appendix 8 Artistic Milliners Denim Division Shredding.
StoresHub per country
Sorting Shredding

Life Cycle Assessment of recycling cotton
Report-75
Page 22
3.2 Reference system, PE virgin Cotton As a reference to the recycled cotton a global study prepared by Cotton Incorporated and PE (Cotton Incorporated and PE International, 2012) is employed. To the knowledge of Miljögiraff and our LCA network it is the most updated and complete public LCA on cotton farming and textile production. The variations in data availability, environmental systems and production systems are big so the global average is a rough figure.
3.2.1 Primary data (collected) Primary data collection was conducted globally, based on regions in the US (most of this LCI data is based on another survey made by Reed et Al. 2009), China, India, Turkey, and Latin America representative of specific growing and manufacturing conditions. Primary data collection was accomplished in the form of spreadsheets and questionnaires, and supplemented by conversations with cotton growers, textile mills, and consumers. In cases where primary data were not available or were inconsistent, secondary data that were readily available from literature, machinery manufacturers, previous Life Cycle Inventory (LCI) studies, and life cycle databases were used for the analysis. The sources for any secondary data used are documented throughout the agricultural, textile, and use phase sections of this study report. Average cotton cultivation in the US, China, and India for the years 2005–2009 was incorporated into PE INTERNATIONAL’s cultivation model based on regional production-weighted averages. Collecting data over a range of years averages out seasonal and annual variations such as droughts and floods. The US, China, and India represented 67% of the world’s cotton fiber production in 2010 (USDA 2011). The primary source of the amount of cotton produced in US annually in each state was Meyer et al. 2009. Information on cotton acreage, production, yields, and irrigation by region was obtained from the “China Statistical Yearbook 2009” compiled by the National Bureau of Statistics of China.
Country Production (million bales)
Area (million ha) Yield (kg/ha) Primary data
US 12.2 10.3 871 Meyer et al. 2009 China 32 5.3 1315 China Statistical
Yearbook 2009, National Bureau of Statistics
India 23 4.3 486 The ICAC publications “Cost of Production of Raw Cotton” (2007 and 2010) and “Cotton Production Practices” (2005 and 2008)
Other 34.2 Total 101.4
Table 7 Production volumes of cotton globally (USDA 2011).
The LCA model was originally created using the GaBi 4 software system developed by PE International, and the analysis was updated when the GaBi software was upgraded to version 5 in 2011. (GaBi 4, 2006; GaBi 5, 2011). The databases within the GaBi software were the source of the secondary LCI data upon which energy production, raw and process materials, transport, and wastewater treatment were modelled. These data were used to account for regional differences for similar processes.

Life Cycle Assessment of recycling cotton
Report-75
Page 23
The economic allocation resulted in 84% of the agricultural burden assigned to the fiber and 16% to the seed. No burden was assigned to the stalks or gin waste.
3.2.2 Calculated data The LCI data are contributing to the global average based on the weight of the produced volume. The weighting factors are China 45.6%, US 24% and India 30.4%. The leakage of nutrients from fertilisers are modelled by PE. LCI data on pesticide production were modelled in PE INTERNATIONAL GaBi 5 software based on generic pesticide production data taken from multiple sources (Birkved et al. 2006, Green 1987, Hauschild 2000, Williams 2006, and Williams 2009). The amount of pesticides applied to cotton fields was taken from USDA sources (USDA 2006 and USDA 2007) for the U.S., one study (Brookes & Barfoot, 2010) for China and two studies (Hsu & Gale 2001 and ICAC 2009) for India. The total quantity of applied pesticides was divided into fractions that deposit on the crop plants, on the soil, or that drift off the field as particles or vapor and reach the surrounding environment. A fraction of pesticide reaching the plants or the soil may volatilize depending on the properties of the pesticide ingredients. In the same manner, a fraction of the pesticide that deposits on the soil surface may reach surrounding surface waters through surface runoff. Another fraction may leach into the soil and reach ground or surface water through, for example, drain pipes in cases where these are used for soil drainage (Hauschild 2000). Emission factors were defined for each pesticide and each region. Once the fraction not emitted to air was estimated, the remaining mass was partitioned to the soil and to the plant based on pesticide class. There are no direct applications of pesticides to water during cotton production, therefore emissions to water from pesticides was zero. The biogenic CO2 sequestered in the cotton plant and its fiber was directly accounted for in the inventory as an input or uptake of carbon dioxide, which was treated as a negative emission of carbon dioxide to air. For cradle-to-gate cotton fiber production, note that the positive value for GWP denotes a net CO2 release during agricultural production, which means that the atmospheric carbon uptake of the fiber is less than the burden associated with cultivation. The carbon sequestered in cotton will eventually return to the air upon final disposal, so for this LCA, the CO2 sequestered during growth of the cotton plants was modelled as a direct release to the atmosphere during the end-of-life phase.
Life Cycle Assessment of recycling cotton
Report-75
Page 24
3.3 Reference system, Ecoinvent, virgin Cotton One of the most well-known Life Cycle Inventory libraries are Ecoinvent 37. It includes many thousands of datasets about the environmental aspects of industrial processes, including cotton farming. Ecoinvent uses a systematic approach based on the ISO standard for LCA and best practice of the LCA community. Still there are room for interpretations of how to employ the ISO 14044 standard and that´s why the Ecoinvent 3 includes two different approaches of allocation, as described in chapter 2.2.4. The dataset used as a reference is called “market for cotton fibre GLO” with the system “Recycled Content” (Allocation cut-off by classification).
3.3.1 Primary data (collected)
The production volume is 22254149659.8639 kg. One bale is 226,8kg (America, 2016) so the annual production would be equivalent to 98 million bales 2014. Primary data collection was conducted globally, based the US and China. The dataset was updated 2014-06-18. The dataset for China produces cotton (1000 kg) and cotton seed (1540kg). For US the data is put together as described by the Ecoinvent report (Schnetzer, Data v3.0 (2012)). The yield in US is 775 kg/ha and by product (seed) is 1144 kg/ha. The background baseline data used is from the database NREL (National Renewable Energy Laboratory, 2006).
3.3.2 Calculated data The LCI data are contributing to the global average based on the weight of the produced volume. The weighting factors are China 26%, US 23% and “rest of the world” 51%. This dataset has been extrapolated from year 2011 to the year of the calculation (2014). The uncertainty has been adjusted accordingly.
7 Version: 3.0.2.1

Life Cycle Assessment of recycling cotton
Report-75
Page 25
4 Life cycle impact assessment (LCIA) Databases included in the software SimaPro 8 includes methods for the evaluation of the environmental aspects which significantly streamlines the environmental assessment and the communication of these. Some terms are used below that require clarification:
- Environmental aspect: An activity that might contribute to an environmental effect, for example “electricity usage”.
- Environmental effect: An effect that might influence the environment negatively (Environmental impact), for example, “Acidification”, “Eutrophication” or “Climate change”.
- Environmental impact: The generated damage on a value we want to protect, for example damage on human health, biological diversity etc.
This is described by a simple example where a person drives a car 1km, something that has several different environmental aspects.
An environmental aspect can be carbon dioxide emission. This can contribute to the environmental effect Global warming that for example might lead to the environmental impact of flooding, draught and landslide. Another environmental aspect could be the consuming of oil that contributes to the environmental effect of resource depletion.
4.1 Method for impact assessment The methods chosen for assessing the life cycle impact is ReCiPe 10, IPCC 11, Hoekstra 15, CML8 and USEtox 9 .
4.1.1 Weighting and normalisation
Normalization is used in the results but weighting is avoided. Normalization is the calculation of the magnitude of the category indicator results relative to some reference information. The aim of the normalization is to understand better the relative magnitude for each indicator result of the product system under study. It is an optional element. Weighting is the process of converting indicator results of different impact categories by using numerical factors based on value-choices. It may include aggregation of the weighted indicator results. All environmental aspects are evaluated by the method ReCiPe10 (Goedkoop, o.a., 2009) to cover an overall perspective on environmental effects. It was chosen for this study because it is the most recently updated, the most comprehensive and the best adapted to all the environmental effects that are relevant for this study. The ReCiPe is a life cycle impact assessment method which comprises harmonised category indicators at the midpoint and the endpoint level. Weighting of environmental effects require normalisation to geographic area. A World perspective has been chosen. Further, the perspectives H/A are used as they represent the broadest scientific consensus (Goedkoop, o.a., 2009). For a more detailed description see Appendix 1, Methods for Impact Assessment and Appendix 2: ReCiPe.
8 CML IA Baseline version 3.03 World 2000 9 USEtox (recommended + interim) European 10 ReCiPe (H) V1.04 / World ReCiPe H/A

Life Cycle Assessment of recycling cotton
Report-75
Page 26
4.1.2 Single issues
Contrary to weighted results which is the combined results from many different environmental effect categories, single issue focus on just one issue. It is important to break out some single issues that are relevant for the analysed product considering that can be assessed more objectively with scientific methods. Below is a small description of the single issues that have been chosen to be reported to allow comparison and not to leave out the most important issues. The Global Warming Potential (GWP) is calculated with IPCC11. It was chosen because it is the method that best describes climate change potential for gases contributing to the greenhouse effect. All these are well recognised scientific methods. Water Scarcity is assessed with Hoekstra Water Scarcity15 and water use with CML8. For the evaluation of toxicity, USEtox is used to scan for toxic effects, however this perspective can only be covered in a rudimentary way with the broad LCA perspective. Also the ReCiPe Midpoint offers the opportunity to show separately Human toxicity, Ecological toxicity in freshwater, Ecological toxicity in marine waters and Ecological toxicity in terrestrial environment. By studying the weighted result by ReCiPe Single Score, we will choose the category of eco toxicity that has the greatest impact (i.e. Human toxicity). For the evaluation of the "occupation of land", the ReCiPe Midpoint offers the opportunity to show separately Land occupation as agriculture and Land occupation as urban. Transformation of agricultural land is accounted for as loss of land availability that could have been used for cultivating food crop as an alternative livelihood.The three forms of “land use” has been added together. For the evaluation of the "energy requirements" the method Cumulative Energy Demand (CED) has been chosen. CED offer the possibility to calculate cumulative energy like energy inherited in oil, gas and most materials.
4.2 Classification Assignment of LCI results to impact categories should consider the following, unless otherwise required by the goal and scope: Identification of LCI results that relate to more than one impact category, including
assignment of LCI results that are exclusive to one impact category;
distinction between parallel mechanisms (e.g. SO2 is apportioned between the impact categories of human health and acidification),
Assignment to serial mechanisms (e.g. NOx can be classified to contribute to both ground-level ozone formation and acidification).
11 IPCC 2013 GWP 100a (HFC, PFC and SF6 as CO2-eq) V1.02
Life Cycle Assessment of recycling cotton
Report-75
Page 27
4.3 Characterisation The calculation of indicator results (characterization) involves the conversion of LCI results to common units and the aggregation of the converted results within the same impact category. This conversion uses characterization factors. The outcome of the calculation is a numerical indicator result. The method of calculating indicator results shall be identified and documented, including the value-choices and assumptions used. If LCI results are unavailable or if data are of insufficient quality for the LCIA to achieve the goal and scope of the study, either an iterative data collection or an adjustment of the goal and scope is required. The usefulness of the indicator results for a given goal and scope depends on the accuracy, validity and characteristics of the characterization models and characterization factors. The number and kind of simplifying assumptions and value-choices used in the characterization model for the category indicator also vary between impact categories and can depend on the geographical region. A trade-off often exists between the simplicity and accuracy of the characterization model.

Life Cycle Assessment of recycling cotton
Report-75
Page 28
4.4 Results - Recycling cotton fibers The results are in general presented in diagrams in the categories12
Sea transport
Land transport
Shredding
Sorting This way representing impact assessment is easy to overview. To offer full transparency of the details, the tables of the results per LCI data is available in appendices. In the diagrams, all the aspects that are not within one category are summed in what is labelled as “Top”, 13.
4.4.1 Overview of environmental effect: The method for an overview of impact assessment is ReCiPe 10. The functional unit is 1 kg of textile ready for spinning.
4.4.1.1 Weighting The diagram shows the comparison of environmental effect categories from the contributing activities. The most important effect (based on subjective weighting by an expert panel) is on Human Toxicity, Climate change, Particulate matter and Fossil depletion.
Figure 9: Recycled cotton impact assessment overview, ReCiPe Endpoints Single score.
The result Fossil depletion can be derived to petroleum and gas production used mostly for the transports. The result Particulate matter can be derived to sea freight almost completely.
12 The calculation of impact assessment from LCI data in categories is called grouping. 13 Top include all the aspects that are not within one category.
0,
5,
10,
15,
20,
25,
30,
35,
Fossil depletion
Metal depletion
Natural land transformation
Urban land occupation
Agricultural land occupation
Marine ecotoxicity
Freshwater ecotoxicity
Terrestrial ecotoxicity
Freshwater eutrophication
Terrestrial acidification
Climate change Ecosystems
Ionising radiation
Particulate matter formation
Photochemical oxidant formation

Life Cycle Assessment of recycling cotton
Report-75
Page 29
The result Climate change can be derived to sea freight, lorry freight and waste collection. The result human toxicity can be derived to the water emission of Copper (sea transport) air emission of Antimony (land transport) and the water emissions of Manganese, Barium and Selenium. The results is also derived to the processes “LCA data”. The biggest contribution is from Sea Freight and the “Remaining” is spread on very small contributions.
processes “LCA data” pt share
Transport, freight, sea, transoceanic ship {GLO}| processing | Alloc Rec, U
13,5277 28%
Petroleum {RoW}| petroleum and gas production, on-shore | Alloc Rec, U
3,6975 8%
Petroleum {RME}| production, onshore | Alloc Rec, U 3,6553 8%
Remaining processes 26,7402 56% 47,6208
Table 8 Process contribution with ReCiPe Endpoint (H) V1.12 / World ReCiPe H/A.
4.4.1.2 Normalisation Normalisation is also a way of putting the environmental impact in the different effect categories in relation to each other. It is based on how big an environmental impact is in relation to the “actual emissions”. In that perspective the biggest impact is on ecotoxicity. (Note Top13)
Figure 10: Recycled cotton impact assessment overview, ReCiPe Normalisation.
0,0E+00
2,0E-04
4,0E-04
6,0E-04
8,0E-04
1,0E-03
1,2E-03
Sorting
Shredding
Land transport
Sea transport
Top
Life Cycle Assessment of recycling cotton Report-75
Page 30
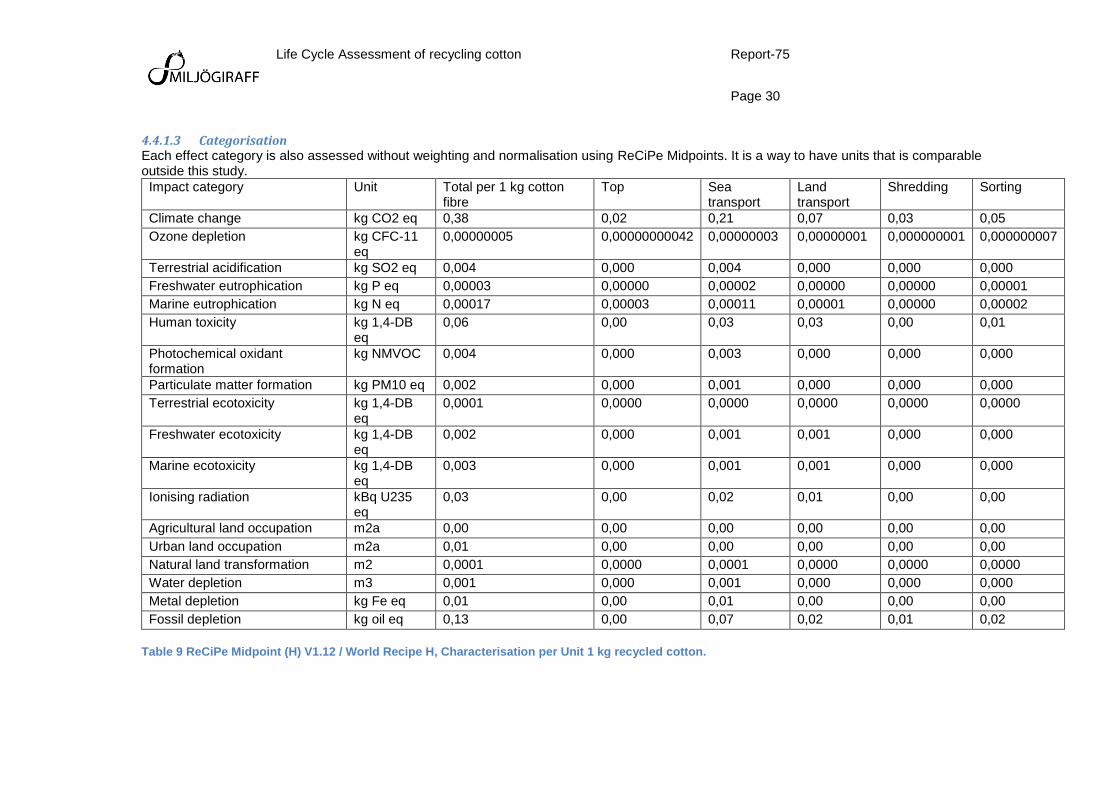
4.4.1.3 Categorisation Each effect category is also assessed without weighting and normalisation using ReCiPe Midpoints. It is a way to have units that is comparable outside this study.
Impact category Unit Total per 1 kg cotton fibre
Top Sea transport
Land transport
Shredding Sorting
Climate change kg CO2 eq 0,38 0,02 0,21 0,07 0,03 0,05
Ozone depletion kg CFC-11 eq
0,00000005 0,00000000042 0,00000003 0,00000001 0,000000001 0,000000007
Terrestrial acidification kg SO2 eq 0,004 0,000 0,004 0,000 0,000 0,000
Freshwater eutrophication kg P eq 0,00003 0,00000 0,00002 0,00000 0,00000 0,00001
Marine eutrophication kg N eq 0,00017 0,00003 0,00011 0,00001 0,00000 0,00002
Human toxicity kg 1,4-DB eq
0,06 0,00 0,03 0,03 0,00 0,01
Photochemical oxidant formation
kg NMVOC 0,004 0,000 0,003 0,000 0,000 0,000
Particulate matter formation kg PM10 eq 0,002 0,000 0,001 0,000 0,000 0,000
Terrestrial ecotoxicity kg 1,4-DB eq
0,0001 0,0000 0,0000 0,0000 0,0000 0,0000
Freshwater ecotoxicity kg 1,4-DB eq
0,002 0,000 0,001 0,001 0,000 0,000
Marine ecotoxicity kg 1,4-DB eq
0,003 0,000 0,001 0,001 0,000 0,000
Ionising radiation kBq U235 eq
0,03 0,00 0,02 0,01 0,00 0,00
Agricultural land occupation m2a 0,00 0,00 0,00 0,00 0,00 0,00
Urban land occupation m2a 0,01 0,00 0,00 0,00 0,00 0,00
Natural land transformation m2 0,0001 0,0000 0,0001 0,0000 0,0000 0,0000
Water depletion m3 0,001 0,000 0,001 0,000 0,000 0,000
Metal depletion kg Fe eq 0,01 0,00 0,01 0,00 0,00 0,00
Fossil depletion kg oil eq 0,13 0,00 0,07 0,02 0,01 0,02
Table 9 ReCiPe Midpoint (H) V1.12 / World Recipe H, Characterisation per Unit 1 kg recycled cotton.
Life Cycle Assessment of recycling cotton Report-75
Page 31
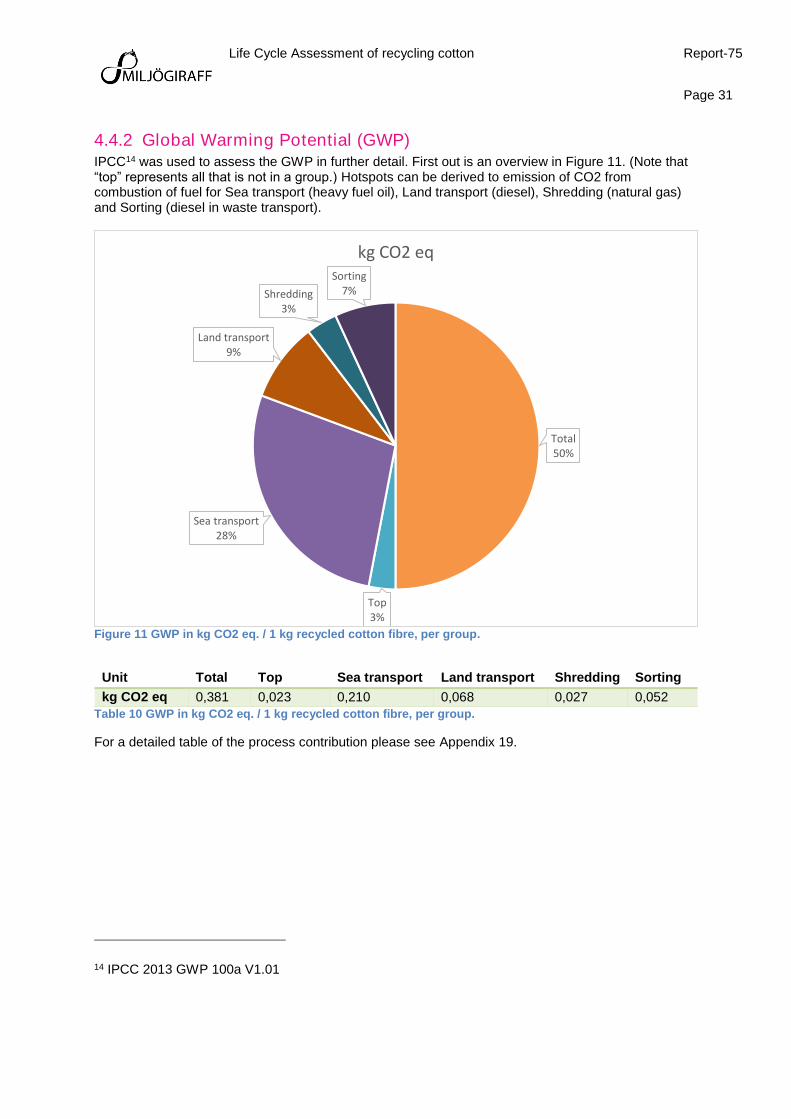
4.4.2 Global Warming Potential (GWP)
IPCC14 was used to assess the GWP in further detail. First out is an overview in Figure 11. (Note that “top” represents all that is not in a group.) Hotspots can be derived to emission of CO2 from combustion of fuel for Sea transport (heavy fuel oil), Land transport (diesel), Shredding (natural gas) and Sorting (diesel in waste transport).
Figure 11 GWP in kg CO2 eq. / 1 kg recycled cotton fibre, per group.
Unit Total Top Sea transport Land transport Shredding Sorting
kg CO2 eq 0,381 0,023 0,210 0,068 0,027 0,052
Table 10 GWP in kg CO2 eq. / 1 kg recycled cotton fibre, per group.
For a detailed table of the process contribution please see Appendix 19.
14 IPCC 2013 GWP 100a V1.01
Total50%
Top3%
Sea transport28%
Land transport9%
Shredding3%
Sorting7%
kg CO2 eq

Life Cycle Assessment of recycling cotton
Report-75
Page 32
As the table below describes, the most climate emissions are from the collecting of clothes (I:CO) and a smaller share from the production of electricity used for shredding (at AM) and for waste treatment of soiled textile.
Total 0,381 kg CO2 eq
Textiles ICO RecCotton 0,33 kg CO2 eq
AM Electricity 2014 0,0268 kg CO2 eq
Waste textile, soiled {GLO}| market for | Alloc Rec, U 0,0235 kg CO2 eq
Table 11 GWP for 1 kg recycled cotton, major contributions.
4.4.2.1 GWP for collecting clothes (I:CO) The details of the collecting (transports) show that the sea freight stands for half of the GWP and the transport by trucks from stores to hubs stands for a quarter.
4.4.2.2 GWP for shredding (AM). The important environmental aspect for shredding is electricity. The Global Warming Potential (GWP) for the electricity produced at AM is with a life cycle perspective 768 g/kWh. The major contribution 85.7% is from the combustion at AM. Then the rest is from production and exploration of natural gas (13.7 %), transport via pipeline (0.5 %) and production of gas turbine (0.06%)
Figure 12 GWP for electricity produced at AM.
75,
80,
85,
90,
95,
100,
105,
IPCC GWP 100a
%
Analysing 1 kWh 'AM Electricity 2014';Method: IPCC 2013 GWP 100a V1.01 / Characterisation
Natural gas, high pressure {RoW}|market for | Alloc Rec, U
Gas turbine, 10MW electrical{GLO}| market for | Alloc Rec, U
Transport, pipeline, long distance,natural gas {GLO}| market for |Alloc Rec, U
AM Electricity 2014

Life Cycle Assessment of recycling cotton
Report-75
Page 33
4.4.3 Water Scarcity
4.4.3.1 Water Scarcity
Calculating the contribution to water scarcity is done with the method Hoekstra15 (Arjen Y. Hoekstra,
2011). A control (Checks) of missed (no index) water flows gives a total number of 0,013 m3 but none of these contribute to water scarcity. Hotspots can be derived to water use for production of fuel for Sea transport (heavy fuel oil) and Sorting (decarbonised water for waste treatment).
Figure 13 Water footprint (Hoekstra) of 1 kg recycled cotton fibres.
Unit Total (m3)
Top Sea transport Land transport Shredding Sorting
m3 0,001216 5,78E-05
0,000688 0,000223 4,13E-06 0,000243
Table 12: Water footprint (Hoekstra) of 1 kg recycled cotton fibres.
For a detailed table of the process contribution please see Appendix 22.
4.4.3.2 Water Use An analyses of all the inventory water give 0,635 m3/kg out of which most is turbine use (55%), Cooling (1%) and raw material (44%).
15 Hoekstra et al 2012 (Water Scarcity) V1.02
Total50%
Top3%
Sea transport28%
Land transport9%
Shredding0%
Sorting10%

Life Cycle Assessment of recycling cotton
Report-75
Page 34
4.4.4 Primary Energy Demand (PED or CED)
Calculating the total use of non-renewable energy include the primary sources of energy and is done
with the method CED16 (Frischknecht R., 2003). Hotspots can be production of fuel for Sea transport
(heavy fuel oil), Land transport (diesel), Shredding (natural gas) and Sorting (diesel in waste transport).
Figure 14 Primary Energy Demand in MJ / 1 kg recycled cotton fibre, per group.
For a detailed table of the process contribution please see Appendix 23 and Appendix 24.
16 Cumulative Energy Demand V1.09
0,00
1,00
2,00
3,00
4,00
5,00
6,00
7,00
Total Top Sea transport Land transport Shredding Sorting
Primary Energy Demand (MJ) per 1 kg recycled cotton fibre.
Non renewable, fossil MJ Non-renewable, nuclear MJ

Life Cycle Assessment of recycling cotton
Report-75
Page 35
4.4.5 Ozone depletion
Calculating the contribution to ozone depletion is done with the method ReCiPe Midpoint 17 . Hotspots
can be derived to emission of emission ozone destroying gases (Methane, bromotrifluoro-, Halon 1301) for Sea transport (heavy fuel oil) and Land transport (diesel).
Figure 15 Ozone Depletion in kg CFC-11 eq / 1 kg recycled cotton fibre, per group.
For a detailed table of the process contribution please see Appendix 25. For a table of the total impact contribution please see Appendix 20.
17 ReCiPe Midpoint (H) 1.12 Methods, World
Total per 1 kg cotton fibre
50%
Top0%
Sea transport31%
Land transport11%
Shredding1%
Sorting7%
Ozone depletion kg CFC-11 eq

Life Cycle Assessment of recycling cotton
Report-75
Page 36
4.4.6 Acidification Potential (AP)
Calculating the contribution to ozone depletion is done with the method ReCiPe Midpoint 17. Hotspots can be derived to emission of SO2 (sulphur dioxide) and NOx (Nitrogen oxides) from combustion of fuel for Sea transport (heavy fuel oil).
Figure 16: Terrestrial acidification in kg SO2 eq./ 1 kg recycled cotton fibre, per group.
For a detailed table of the process contribution please see Appendix 26. For a table of the total impact contribution please see Appendix 20.
Total per 1 kg cotton fibre
50%
Top1%
Sea transport42%
Land transport3%
Shredding1%
Sorting3%
Terrestrial acidification kg SO2 eq

Life Cycle Assessment of recycling cotton
Report-75
Page 37
4.4.7 Eutrophication Potential (EP)
Calculating the contribution to ozone depletion is done with the method CML8. Hotspots can be derived to emission of NOx (Nitrogen oxides) from combustion of fuel for Sea transport (heavy fuel oil).
Figure 17: Eutrophication kg PO4--- eq1 kg recycled cotton fibre, per group.
For a detailed table of the process contribution please see Appendix 27. For a table of the total impact contribution please see Appendix 21.
Total50%
Top3%
Sea transport36%
Land transport5%
Shredding1%
Sorting5%
Eutrophication kg PO4--- eq
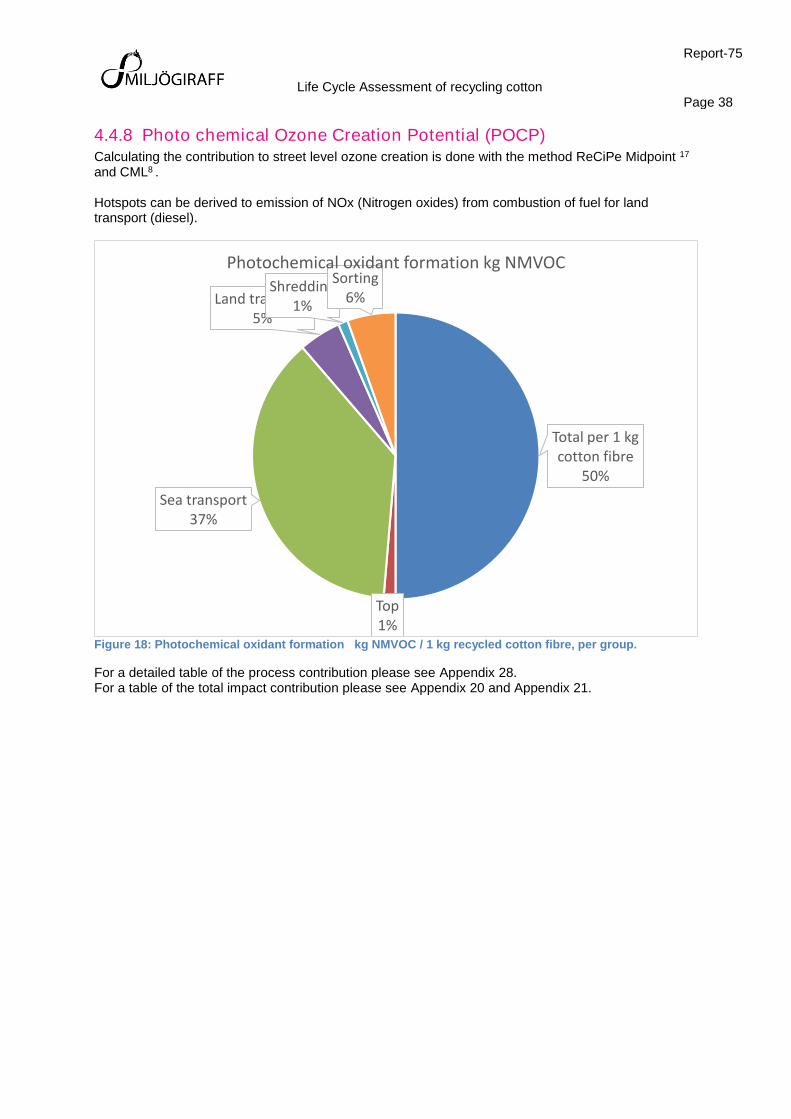
Life Cycle Assessment of recycling cotton
Report-75
Page 38
4.4.8 Photo chemical Ozone Creation Potential (POCP)
Calculating the contribution to street level ozone creation is done with the method ReCiPe Midpoint 17 and CML8 . Hotspots can be derived to emission of NOx (Nitrogen oxides) from combustion of fuel for land transport (diesel).
Figure 18: Photochemical oxidant formation kg NMVOC / 1 kg recycled cotton fibre, per group.
For a detailed table of the process contribution please see Appendix 28. For a table of the total impact contribution please see Appendix 20 and Appendix 21.
Total per 1 kg cotton fibre
50%
Top1%
Sea transport37%
Land transport5%
Shredding1%
Sorting6%
Photochemical oxidant formation kg NMVOC

Life Cycle Assessment of recycling cotton
Report-75
Page 39
4.4.9 Toxicity
Calculating the contribution to toxicity (eco and human) is done with the method USETox18.
Normalisation indicate that Human Toxicity Cancer, is best representing the issues.
Figure 19: Toxicity Normalised / 1 kg recycled cotton fibre, per group.
Impact category Unit Total
Human toxicity, cancer CTUh 8,58E-09
Human toxicity, non-cancer CTUh 4,75E-08
Freshwater ecotoxicity CTUe 1,237112
Table 13 Toxicity in CTU19 / 1 kg recycled cotton fibre
For a detailed description of the method please see Appendix 4 For a detailed table of the process contribution please see Appendix 28. For a table of the total impact contribution please see Appendix 20.
18 USEtox (recommended + interim) 1.04 19 The characterisation factor for human toxicity (Human Toxicity Potential) is expressed in Comparative Toxic Units (CTUh/kg), providing the estimated increase in morbidity in the total human population per unit mass of a chemical emitted (cases/kg), assuming equal weighting between cancer and non-cancer due to a lack of more precise insights into this issue. The characterisation factor for aquatic ecotoxicity (Ecotoxicity Potential) is expressed in Comparative Toxic Units (CTUe/kg) and provides an estimate of the potentially affected fraction of species (PAF) integrated over time and volume per unit mass of a chemical emitted (PAF m3.day/kg).
0,
0,0001
0,0001
0,0002
0,0002
0,0003
0,0003
Human toxicity, cancer Human toxicity, non-cancer
Freshwater ecotoxicity
Sorting
Shredding
Land transport
Sea transport

Life Cycle Assessment of recycling cotton
Report-75
Page 40
4.5 Reference system, PE virgin Cotton Allocation is 84% lint cotton and 16% fibre (seed). However, this is highly dependent on market prices, which fluctuate from 75-90% to lint. Note that it is the result in column with Cotton Fiber that should be compared to the recycled fibre.
Table 14: Reference values for virgin cotton fibres (Cotton Incorporated and PE International, 2012).

Life Cycle Assessment of recycling cotton
Report-75
Page 41
4.5.1 Global Warming Potential (GWP)
The study created a reference system to detect impacts that would occur even if the agriculture all and were uncultivated (not used by humans). These differences are credited back to the cotton system. The Climate impact is 268 kg CO2eq/1000 kg cotton +1540 kg CO2 eq stored20 in 1000 kg cotton released at end of life (1,808 kg CO2-eq/1000 kg cotton). Credit of 1540 kg CO2 eq. for the carbon stored in fibre during agricultural phase (not represented in Figure 20). The organic cotton study (International, 2014) cites the total carbon, including that in the fibre, for their comparison. The largest GWP contributions is the fertilizer production and field emissions. Post-harvest contributions emissions are from process energy, transportation, and packaging. Fertilizer surplus from cotton cultivation is treated as credit for next crop (avoided production of mineral fertiliser).
4.5.1.1 Expert opinions An expert (Merja, 2016) on LCA models for agricultural systems was consulted regarding “allocation for crop- rotation”. - “There should not be any biogenic carbon calculation in the case of cotton. The whole amount of fertilizer is usually allocated to the crop in question. Allocating to the next crop is wrong. Yes, if it is no reason to include entire crop rotation in the consideration, but it would be another matter and in general there is not enough knowledge to do so”. Another expert (Schmidt, 2016) on LCA models for consequential perspective was consulted regarding “inclusion of CO2 uptake and biogenic emission”. - “There should not be either CO2 uptake or any biogenic carbon calculation in the case of cotton products, instead it evens out. An alternative is to include CO2 uptake and CO2 emissions in the End of Life. But for the comparison “cradle to gate” it is relevant show that agricultural products do not use as much fossil CO2 as oil based fibres.” The author (Thylmann, 2016) of the reference study (Cotton Incorporated and PE International, 2012) was also consulted. - “The values given in COTTON INC. 2012 are considering the carbon uptake in the product (1540 kg CO2 per 1000kg, resulting in a value of 268 kg CO2-equiv. per 1000 kg of lint cotton). As cotton is a short-lived consumer good, this carbon dioxide is released later at the end-of-life in the product, so that it is only temporarily stored. This is why the carbon uptake is not considered in the impact assessment and is not declared in the organic cotton study (International, 2014). The GWP impact method used in this study refers to a time frame of 100 years (GUINÉE ET AL. 2001). Assuming a lifetime of the fibre of 10 years (highly uncertain value because of the different use patterns of textiles), 10% of the carbon stored in the product could be credited as a reduction in global warming potential. That is a potential reduction in GWP of 154kg, or 15%. However, given the large uncertainty of the expected lifetime of the final product, as a conservative approach the temporal storage of CO2 in the product is not considered in the results shown below.” Lately PRé changed the way they deal with Carbon uptake. SimaPro used to take the uptake of biotic CO2 plus the release of this carbon into account, just as this was done in Ecoinvent up to version 1.2. Ecoinvent changed this and now ignores the uptake, but also does not include the release of biotic CO2 and CO. The ReCiPe (ReCiPe method, 2016) method follow the latter principle in ReCiPe and most other SimaPro methods. For a cradle too grave LCA the result is the same, for a cradle to gate it is not. Another expert (Doka, 2016) says – “that IPCC guidelines for national annual reporting of greenhouse gases, state that sources and sinks of biogenic releases *can* (not must) be ignored, as the cycle time is usually small and uptake and release would cancel each other out.
20 Sequestration or CO2 uptake

Life Cycle Assessment of recycling cotton
Report-75
Page 42
But in LCA I would say you inventory a CO2 uptake when you have a /physical //process/ where a CO2 uptake is actually taking place. If that sink process is outside your system boundaries (for instance because you are looking at disposal of paper, starting with the waste) then you should respect those system boundaries and report the results you find with them.”
4.5.1.2 Conclusion In accordance to the iso standard the attributional perspective should not take credit for next crop if the system is not being expanded, or that the input from previous agriculture is included as input. In this LCA on recycled cotton, the issue of system boundaries is similar, but the other way around. Production of the product has CO2 uptake. After a short period of use, the most common disposal scenario is incineration. So it should even out. But the scope of the study is Cradle to gate and comparing to another recycled material. With the reasoning of Gabo Doka, the CO2 uptake should be used. But it would give a result that is lower than will actually occur in a full Life cycle. So it would distort the results. Thus, since the sequestration is over a period that is short (less than the time periods in IPCC of 100, 50 and 20 years) the CO2 uptake is excluded. Another solution is system expansion, comparing 400 (example) times use jeans of virgin and recycled cotton. The example is assuming that the jeans are used 200 times before disposed of either direct to incineration or to recycling for one extra life before incineration. It would result in half as much cultivation and incineration and one extra process of transport and recycling. Appendix 13 The methods for impact assessment deal with sequestration and biogenic CO2 in different ways if one interprets what indexes that are included (in SimaPro). The method IPCC does not treat biogenic CO2 and fossil differently (the burning of cotton emits CO2 no matter if it is biogenic or fossil. The CO2 uptake (sequestration) should be excluded. The GHG method on the other hand include sequestration and biogenic emissions if reported separately. So to be consequent the reference value for GWP on conventional cotton fibre is 1,808 kg CO2-eq/1000 kg cotton) + 150 kg CO2-eq/1000 kg cotton for the surplus of fertilizer (estimated from Figure 20). Total: 1958 kg CO2-eq/1000 kg cotton) The corresponding figure for GWP on organic cotton fibre is 978 kg CO2-eq/1000 kg cotton) (International, 2014).

Life Cycle Assessment of recycling cotton
Report-75
Page 43
Figure 20 GWP for conventional cotton fibre (Cotton Incorporated and PE International, 2012)
Life Cycle Assessment of recycling cotton
Report-75
Page 44
4.5.2 Water Scarcity
Two terms are used, water use and water consumption. Neither of them is exactly the same as water scarcity. A reason for not using water scarcity is presumable that the methods now available was not widely accepted at the time. This is explained at page 9 in the Cotton Inc. study. - “Several new metrics to describe water use from an LCA perspective are in development; however, presently there are two primary methods for modelling and reporting water and both were used for this study: Water Used (WU) refers to all of the water involved, both directly and indirectly, in any phase of a product’s life. WU includes the groundwater, river and surface water used for irrigation during cotton cultivation and the water used for wet processing during the textile manufacturing phase. WU also includes the cooling water diverted during electricity (energy) production. It can be considered the gross amount of water used. Water Consumed (WC) also consists of both direct and indirect water and is defined as the water that leaves the watershed from which it was drawn. In cases where water is returned to the same watershed, such as for treated wastewater from textile processes and consumer laundering, a credit is applied. In the case of irrigation water, it is considered to be 100% consumed since the water taken up by the cotton plant evaporates and falls later as rainfall into a different watershed or into the ocean and therefore no credit is applied. WC can be thought of as the net amount of water used. To further illustrate both definitions, consider the direct water used and consumed during the laundering of a shirt. WU can be thought of as all the water that goes through the washing machine during the wash cycle. WC can be thought of as the amount of water that was retained in the shirt and then evaporated during drying. The indirect water associated with the production of the electricity needed to run the washing machine would be added to both WU and WC. In power generation a portion of the indirect water is returned to the same watershed so a credit would be given for this water in the WC calculation.” Water use-2,740 m3 water/1,000 kg of cotton
Consists of ground water, river and surface water used for cotton irrigation.
80% used directly for irrigation. • Cooling water evaporated during electricity production and other indirect uses also included in the water use
Water consumption – 2,120 m3 water/1000 kg cotton
Irrigation is main source of water consumed in the fibre phase
Additional water consumption takes place in upstream processes, especially in the provision of energy.
Not included - 7,000 m3 of water/1,000 kg of global average cotton from precipitation to field.

Life Cycle Assessment of recycling cotton
Report-75
Page 45
Figure 21 Conventional cotton, Water scarcity (Cotton Incorporated and PE International, 2012)
4.5.3 Primary Energy Demand (PED or CED) Primary energy demand21 (non-renewable) -15,000 MJ/1000 kg cotton
Main contributors: fertilizer production processes (37%) followed by post-harvest (27%), irrigation (21%), and tractor operations (19%).
Fertilizer for next crop provide credit, about 10% of the PED used
Between-season losses due to volatilization and leaching of nitrogen were accounted for with PE cultivation model.
4.5.4 Ozone depletion Ozone depletion – 7.60E-06 kg R11-eq /1000 kg cotton
ODP emissions are usually minimal and related to electricity production, in this case for fertilizer production, pesticide production, post-harvest, and the nutrient allocation in crop rotation
In addition, R11, R12, R22, and R114 emissions occur (at negligibly small rates) during fertiliser and pesticide production.
4.5.5 Acidification Potential (AP) Acidification- 18.7 kg SO2-eq / 1000 kg cotton AP strongly affected by ammonia (NH3) field emissions and field operations. Post-harvest operations from combustion of fossil fuels and the disposal of packaging materials. Significant contribution from irrigation and tractor operations due to nitrogen oxides. Processes related to pesticide and seed production essentially no contribution to AP
21 PED is also known as Cumulative Energy Demand (CED)

Life Cycle Assessment of recycling cotton
Report-75
Page 46
4.5.6 Eutrophication Potential (EP)
Eutrophication - 3.84 kg Phosphate -eq/1000 kg cotton Potential leaching of nitrate (NO3-) into groundwater was the main contributor.
Figure 22 Conventional cotton, eutrophication (Cotton Incorporated and PE International, 2012)

Life Cycle Assessment of recycling cotton
Report-75
Page 47
4.5.7 Photo chemical Ozone Creation Potential (POCP)
POCP / Smog creation – 0.408 kg Ethene –eq /1,000kgcotton
Non-Methane Volatile Organic Compounds (NMVOCs), carbon monoxide, and nitrogen oxides from combustion processes in the tractor, in the generators used to run irrigation pumps and in the natural gas and propane used to dry cotton at the gin.
Further Sources-Nitrous oxide emissions resulting from the natural degradation of mineral and organic fertilizer nitrogen in and on the soil.
Negative values (e.g., Crop Rotation, Field Emissions) due to cause and effect relationships between nitrogen monoxide (NO) emissions and the POCP. According to CML method, NO emissions have positive (reductive) effect on creation of ozone (O3).
Figure 23 Conventional cotton, POCP (Cotton Incorporated and PE International, 2012)
4.5.8 Toxicity Toxicity (eco and human) is discussed but no results reported due to limitations, uncertainties and implausibility of the USEtox model.

Life Cycle Assessment of recycling cotton
Report-75
Page 48
4.6 Reference system, Ecoinvent, virgin Cotton Allocation is 84% lint cotton and 16% fibre (seed).
4.6.1 Global Warming Potential (GWP) The Climate impact is 3310 kg CO2eq/1000 kg cotton
4.6.2 Water Scarcity
The water scarcity, “contribution to fresh water depletion is 2750 m3 WSI /1000 kg cotton The total use of water as raw material was summed up from the inventory to 10801 m3 per 1000 kg cotton. But as you can see in Figure 24 most of the turbine water is released back to the environment immediately. Thus there is not really an impact of turbine water in the balance.
Figure 24 The water balance for virgin cotton fibre on a global market.
4.6.3 Primary Energy Demand (PED or CED) Primary energy demand22 (non-renewable) -38675 MJ/1000 kg cotton.
22 PED is also known as Cumulative Energy Demand (CED)
-10000 -5000 0 5000 10000
m3
m3
m3
m3
m3
m3
m3
m3
m3
wel
l,in
gro
un
d
Emis
sio
nto Air
Emis
sio
nto wat er
Un
sp
eci
fied
nat
ura
lo
rigi n
Turb
ine
use
Salt
Riv
er
Lake
Co
ol
ing
Water m3 per 1000 kg cotton fibre

Life Cycle Assessment of recycling cotton
Report-75
Page 49
Figure 25 Primary energy demand for Virgin Cotton in reference system Ecoinvent and the impact assessment method CED 16.
4.6.4 Ozone depletion Ozone depletion – 3.25E-04 kg CFC-eq /1000 kg cotton
4.6.5 Acidification Potential (AP) Acidification- 36.3 kg SO2-eq / 1000 kg cotton
4.6.6 Eutrophication Potential (EP)
Eutrophication – 1,27 kg Phosphate -eq/1000 kg cotton
4.6.7 Photo chemical Ozone Creation Potential (POCP) POCP / Smog creation 0,88 kg Ethene –eq /1,000kgcotton 8. (ReCiPe Midpoint gives 14,5 kg NMVOC).
4.6.8 Toxicity Toxicity (cancer) is calculated with the USEtox model to 0,000138 CTUh per 1000 kg cotton fibre.
Non renewable, fossil MJ
42%
Non-renewable, nuclear MJ
5%
Non-renewable, biomass MJ
0%
Renewable, biomass MJ
51%
Renewable, wind, solar, geothe MJ
0%
Renewable, water MJ2%
Cotton fibre {GLO}| market for | Alloc Rec, U

Life Cycle Assessment of recycling cotton
Report-75
Page 50
4.7 Comparison with reference system The dominant environmental impact is on Human Toxicity, Climate change, Particulate matter and Fossil depletion. And the aspect water use. The most relevant environmental effects for conventional cotton is Occupation of land, Water use, Water scarcity, Human Toxicity, Climate change and Fossil depletion. The most relevant and comparable environmental effects categories are Water use, Climate change and Fossil depletion.
Aspect Abbreviation
Unit PE- virgin cotton fibre
Ecoinvent - virgin cotton fibre
H&M -Recycled cotton fibre
Water use (and consumption)
water m3 2740 (2120) 10801 63523
Water Scarcity water m3 2750 1,2
Climate impact (excluding sequestration24 and crop rotation25)
GWP Kg CO2-eq 1958 (26826) 3310 381
Chemical use (toxicity) TOX CTUh19 1,4E-4 8,6E-6
Acidification AP Kg SO2-eq 18,7 36,3 4,527
Eutrophication (excluding crop rotation28)
EP Kg PO4-eq 4,04 1,27 0,5829
Ozone depletion OD Kg R11-eq 7,6E-6 3,25E-4 5,5E-5
Smog creation (excluding crop rotation30)
POCP Kg ethene-eq
0,558 0,88 0,17
Primary energy (fossil) PED (CED)
MJ 15000 3469931 574932
Occupation of land land use m2 853033 12 Table 15 Comparison in results of all aspects with reference system (per tonne).
In the diagrams below, the environmental impact of recycled cotton is divided per the same value of virgin cotton.
23 Turbine use of water. 24 Estimated to - 1540 kg CO2 25 Estimated to - 150 kg CO2 26 Original value for cotton fibre Cradle to gate, including CO2 uptake and cropratation. 27 Terrestrial Acidification 28 Estimated to - 0,2 kg PO4
3- 29 Fresh water Eutrophication 30 Estimated to -0,15 kg Ethene 31 Fossil excluding nuclear that is 3973 MJ per tonne (for the sake of comparison) 32 Fossil excluding nuclear that is 211 MJ per tonne (for the sake of comparison). 33 Agricaltural land occupation

Life Cycle Assessment of recycling cotton
Report-75
Page 51
Figure 26 Comparison of only the relevant and comparable environmental effects.
Figure 27 Comparison of all environmental effects, in absolute figures.
0% 500% 1000% 1500% 2000% 2500% 3000% 3500% 4000% 4500%
Water use (and consumption)
Climate impact
Acidification
Eutrophication
Ozone depletion
Smog creation
Primary energy (fossil)
Comparable and relevant, relative PE, virgin cotton.
Recycled cotton fibre Ecoinvent - virgin cotton fibre PE - Virgin cotton fibre
0 5000 10000 15000 20000 25000 30000 35000 40000
Water use (and consumption)
Climate impact
Primary energy (fossil)
Comparable, absolut figures
Recycled cotton fibre Ecoinvent - virgin cotton fibre TE - Virgin cotton fibre

Life Cycle Assessment of recycling cotton
Report-75
Page 52
Figure 28 Comparison of Smog, Eutrophication and Acidification, in absolute figures.
Figure 29 Comparison of Ozone depletion, in absolute figures.
0 5 10 15 20 25 30 35 40
Acidification
Eutrophication
Smog creation
Comparable, absolut figures
Recycled cotton fibre Ecoinvent - virgin cotton fibre TE - Virgin cotton fibre
0 0,00005 0,0001 0,00015 0,0002 0,00025 0,0003 0,00035
Ozone depletion
Comparable, absolut figures
Recycled cotton fibre Ecoinvent - virgin cotton fibre TE - Virgin cotton fibre

Life Cycle Assessment of recycling cotton
Report-75
Page 53

Life Cycle Assessment of recycling cotton
Report-75
Page 54
5 Life Cycle Interpretation The life cycle interpretation phase of an LCA or an LCI study comprises several elements as Depicted in Figure30, as follows:
Identification of the significant issues based on the results of the LCI and LCIA phases of LCA; An evaluation that considers completeness, sensitivity and consistency checks; Conclusions, limitations, and recommendations.
The relationship of the interpretation phase to other phases of LCA is shown in Figure30.
Figure30, Relationships between elements within the interpretation phase with the other phases of LCA
The interpretation shall also consider the following in relation to the goal of the study:
The appropriateness of the definitions of the system functions, the functional unit and system boundary; Limitations identified by the data quality assessment and the sensitivity analysis.
The documentation of the data quality assessment, sensitivity analyses, conclusions and any Recommendations from the LCI and LCIA results shall be checked. The LCI results should be interpreted with caution because they refer to input and output data and not to environmental impacts. In addition, uncertainty is introduced into the results of an LCI due to the compounded effects of input uncertainties and data variability. One approach is to characterize uncertainty in results by ranges and/or probability distributions. Whenever feasible, such analysis should be performed to better explain and support the LCI conclusions.

Life Cycle Assessment of recycling cotton
Report-75
Page 55
5.1 Completeness check The specific process for recycling cotton is compared to a broad average of conventional cotton. It would be complete to create scenarios where the cotton is recycled in different countries. Different wages could imply different solutions. The energy mix would also affect much. The distances for transport would not change dramatically as an average. Also recycling in the country of collection would imply much less transport and lower environmental impact if the fibres are also used in that region for new products. Some of the environmental effect categories was not possible to compare with the reference system. The major ones being water scarcity, occupation of land and toxicity. All of these would point in the direction that recycling is even more important.

Life Cycle Assessment of recycling cotton
Report-75
Page 56
5.2 Sensitivity check The objective of the sensitivity check is to assess the reliability of the final results and conclusions by Determining how they are affected by uncertainties in the data, allocation methods or calculation of category indicator results, etc. In a sensitivity check, consideration shall be given to
The issues predetermined by the goal and scope of the study, The results from all other phases of the study, and Expert judgements and previous experiences.
The output of the sensitivity check determines the need for more extensive and/or precise sensitivity analysis as well as shows apparent effects on the study results.
5.2.1 Sensitivity Recycled cotton Is only conducted for the choice of textile origin as it may affect the GWP for transport. When origin with the longest distance (US) is excluded it gives 5% lower results on GWP (438 gram CO2 equivalents instead of 461). Excluding also Russia and Israel gives only 381 gram CO2 equivalents.
Figure 31 Scenario in GWP for change in transport.
20
40
60
80
100
120
IPCC GWP 100a
%
Comparing 1 kg 'Baseline' with 1 kg 'US excluded';Method: IPCC 2013 GWP 100a V1.01 / Characterisation
Baseline
US excluded

Life Cycle Assessment of recycling cotton
Report-75
Page 57
5.2.2 Sensitivity in reference system
Is only conducted for spinning and consumer use assumptions. Thus not for cotton fibre. For the comparison of the PE study with the H&M project it is very relevant to show the effect of the assumptions to include sequestration and allocation to other crops. Using the assumptions in the reference study would change the result regarding climate change but not the overall environmental impacts.
Effect category Unit Reference study (PE)
Excluding sequestration
Excluding sequestration and crop rotation
Climate impact (GWP)
Kg CO2-eq 268 1808 1958
Eutrophication (EP)
Kg PO4-eq 3,84 4,04
Figure 32 Scenario for changes in assumption in reference study.
The high value of ozone depletion is a merely an effect of differences in background data. It is much different in Ecoinvent data for cotton for comparison. Than ozone depletion is also lower for the recycling also. Thus ozone depletion cannot be used as the basis for comparison.
5.3 Consistency check The collected and generic data is consistent in the two major parts of the system. But in comparison to the reference system that one is using an average of collected data. The goal to know if recycled cotton has substantially lower environmental impact, is partially fulfilled by comparing conventional farming to recycling. To have a complete picture a consequential perspective would be necessary. Regional data on environmental aspects has been used and the impact assessment has employed a world perspective. Indeed, local environmental effect could be normalised to background environment and recipients. But for the global environmental effects it is clearly representative. Allocation rules has been the same throughout the study but not the reference system has been adjusted to have a consistent basis for comparison. However, it is not clear if, in the reference system, allocation is made to recycled content or not. It is estimated not to have a big impact on the reference system but it would have a big effect on the system for recycling cotton. Also, the allocation to reused clothes and recycled fabric is made on physical basis. Economic allocation would significantly affect the results. But it would also be much more sensitive to specific cases due to that the value of reused clothes depends much on the selection of clothes and market place. The elements of impact assessment have been consistently applied.

Life Cycle Assessment of recycling cotton
Report-75
Page 58
5.3.1 Shredding
The environmental aspect electricity production for the shredding of textile is a key parameter. Thus it was tested against the option of using electricity from the grid and comparing it to a similar production. The result below, show that the internal electricity production is a better option than the grid and that the LCA model is consistent to generic data. The emission of CO2 per kWh natural gas is 162 g/kWh which can be put in relation to 190 g/kWh used in the UK study on cotton from US and Turkey (Julian Allen, 2005). The average in Sweden is 204.8 g/kWh (Naturvårdsverket (Swedish EPA), 2015). The variations are rather large but can probably be derived to differences in system boundaries and used indexes. However, the values are close enough to know that the order of magnitude is correct.
Figure 33 Comparison of the environmental impact (ReCiPe Endpoint) for electricity production at internally at AM, generic Ecoinvent data for Russian el from natural gas and the grid in India.
0,
50,
100,
150,
200,
250,
300,
350,
400,
450,
AM Electricity 2014 Electricity, mediumvoltage {RU}|
natural gas, burnedin gas turbine, for
compressor station| Alloc Def, U
Electricity, lowvoltage {IN}|
market for | AllocDef, U
Fossil depletion
Metal depletion
Natural land transformation
Urban land occupation
Agricultural land occupation
Marine ecotoxicity
Freshwater ecotoxicity
Terrestrial ecotoxicity
Freshwater eutrophication
Terrestrial acidification
Climate change Ecosystems
Ionising radiation
Particulate matter formation
Photochemical oxidant formation
Human toxicity

Life Cycle Assessment of recycling cotton
Report-75
Page 59
5.4 Conclusions, limitations and recommendations The conclusions below are valid within the frame of the goal and scope of the study; - This study is looking into the environmental aspects of mechanical recycling of cotton textile. However, it does not consider other scenarios for used textile. Collecting clothes and recycling cotton mechanically has a considerable potential to lower the overall environmental impact on the most important effect categories (though not an all). The result is limited to the aspects that has been possible and relevant to compare, Water use, Climate change and Fossil depletion. However, none of these aspects would point in the other direction. Rather it would strengthen the case for recycling. The result is limited in validity due to how the environmental impacts are allocated between recycled and reused clothes. For different product segments and markets that would mean a varying value. But the used allocation can be interpreted as a worst case as the price of recycled fabric is much lower that the price of resalable clothes (Torring, 2015). A recommendation is to change the perspective for the comparison. Instead of comparing per the functional unit (FU) 1 kg fibre ready for spinning, it would be more constructive to use the FU X times of using 1000 kg product of virgin and recycled cotton. In an example where X is 400 (2 life cycles) it would result in half as much cultivation and incineration and one extra process of transport and recycling. Adding the GWP indicate that the potential contribution of recycling in one extra loop, is roughly 40% lower climate impact. However, it is important to keep in mind that the washing and drying clothes are the most important phase of the life cycle.
5.4.1 Improvement opportunities of logistics
The impacts of transporting collected clothes are significant. Thus it is proposed to recycle closer to the point of collection in order to reduce the impacts. A recycling closer to the place of collection makes sense only if also the next stage of using the fibres is not far away. To consider this the system boundary of the LCA could be improved. It should be expanded to the gate of the “NEXT production stage”. This report uses the perspective of H&M. North-west India and South-east Pakistan is a region suitable for textile production from both virgin and recycled fibre, due the abundance of good quality cotton, skilled denim producers and low salaries. That implies that expanding the system boundary would only marginally effect the results. However, it is also realised in this study that collected textile for recycling is a bi-product of collected textile for reuse which has more economic margins. Considering the whole system including the market for reused textile, would imply different geographic points of the "NEXT production stage". Further it would require economic allocation between textile for reuse and textile for recycling.
5.4.2 Improvement opportunities of sorting Collecting clothes for reuse is very profitable. The rest of the material will be shredded. If it contains elastic polymers or strong plastic materials, it may cause significant down time of machines. To avoid risks of this the cotton recycling is relying on sorting out jeans legs and cutting out the metals and three layer seams. A suggestion is that sorting jeans upstream (in store) would reduce the need for sorting down streams and thus improve the process a lot.

Life Cycle Assessment of recycling cotton
Report-75
Page 60
6 References McLellan, R., Iyengar, L., Jeffries, B., & Oerlemans, N. (2014). Living-Planet-Report. Global: WWF. (2006-06). 2006a Environmental management - Life cycle assessment - Principles and framework.
ISO 14040:2006 Second Edition. Geneva: International Organization for Standardization (ISO).
(2006-07-01). 2006b Environmental management - Life cycle assessment - Requirements and guidelines. ISO 14044:2006; First edition. Geneva: International Organization for Standardization (ISO).
Alpvik, N. (2016). Platschef. (M. Wendin, Interviewer) mobil : 0730 36 59 46. Textilia i Örebro. America, N. C. (2016, 7 11). The Joint Cotton Industry Bale Packaging Committee (JCIBPC)
established the following guidelines in 2001 to clarify the dimensions of cotton bales compressed to U.S. Gin Universal Density Bale standards. Retrieved from http://www.cotton.org/tech/bale/bale-description.cfm
Arjen Y. Hoekstra, A. K. (2011). The Water Footprint Assessment Manual: Setting the Global Standard. London, Washington DC: earthscan. Retrieved from https://books.google.se/books?id=ZtdFcFbrhJIC&lpg=PR3&ots=ONgVU8W2gb&dq=hoekstra%20water%20footprint&lr&hl=sv&pg=PR3#v=onepage&q=hoekstra%20water%20footprint&f=false
Baumann, H., & Tillman, A. (2004). Liftarens guide till LCA. Lund, Sweden: Studentlitteratur ISBN: 91-44-02364-2.
Brohammer, G. (2016). environmental consultant. (M. Wendin, Interviewer) [email protected]. Hulanvägen 14, 427 38 Billdal, Sweden. Retrieved from www.extracon.se
Börjesson, P., & Karlsson, E. (150722). Recycled fiber comparative LCA scope. Stockholm: Hennes & Mauritz.
Carlson, R. (2015). CEO LCA expert. (M. Wendin, Interviewer) [email protected]. eco2win AB, Ansgariigatan 17, 554 66 Jönköping Sweden .
Cotton Incorporated and PE International. (2012). Life Cycle Assessment of Cotton Fiber and Fabric. US: Cotton Council International and The National Cotton Council.
Dahlin, J.-E. (n.d.). Att mäta hållbar utveckling. In J.-E. Dahlin, Hållbar utveckling – en introduktion för ingenjörer (p. kapitel 7).
Doka, G. (2016, 8 25). LCA expert. (M. Wendin, Interviewer) [email protected]. http://www.doka.ch/. EIS US. (2016, 04 05). US energy information administration. Retrieved from
https://www.eia.gov/tools/faqs/faq.cfm?id=107&t=3. European Commission, Environment. (n.d.). IPP concept. Retrieved from
http://ec.europa.eu/environment/ipp/ Frischknecht R., J. N. (2003). Implementation of Life Cycle Impact Assessment Methods. (Vol. Final
report). Duebendorf, CH: ecoinvent 2000, Swiss Centre for LCI. Retrieved from www.ecoinvent.ch
Goedkoop. (2012, 12). ReCiPe Mid/Endpoint method, version 1.08. Goedkoop, M., Heijungs, R., Huijbregts, M., Schryver, A., Struijs, J., & Zelm, R. v. (2009). ReCiPe
2008-A life cycle impact assessment method which comprises harmonised category indicators at the midpoint and the endpoint level. Holland.
Guinée, J., Gorrée, M., Heijungs, R., Huppes, G., Kleijn, R., Koning, A. d., . . . Sleeswijk, A. (2004). Handbook on Life Cycle Assessment - Operational Guide to the ISO Standards. Kluwer Academic Publications.
Gupta, C. (2014). Analysis 09_38_43. Germany: I Collect. Gupta, C. (2015, 11 01). Environmental manager. (M. Wendin, Interviewer) [email protected], +49
4102 4545-420, . An der Strusbek 19, 22926 Ahrensburg. Haglund, C. (n.d.). [email protected]. Hermansson, K. (n.d.). Miljö- och vattenplanerare, Planenheten. [email protected].
Sollentuna kommun.

Life Cycle Assessment of recycling cotton
Report-75
Page 61
Hirschier, R., Weidema , B., Althaus , H.-J., Bauer , C., Doka , G., Dones , R., . . . Wernet , G. (2015). Code of practice. ecoinvent report No. 3.2. St. Gallen: Swiss Centre for Life Cycle Inventories.
Hirschier, R., Weidema, B., Althaus, H.-J., Bauer, C., Doka, G., Dones, R., . . . Wernet, G. (2015). ecoinvent Version 3.2 Database. St. Gallen: Swiss Centre for Life Cycle Inventories.
International, P. (2014). Life Cycle Assessment (LCA) of Organic Cotton – A global average. Hauptstrase 111-113, 70771 Leinfelden- Echterdingen, Germany: Textile Exchange.
ISO. (2002). Environmental management — Life cycle assessment — Data documentation format. ISO/TS 14048:2002. Generva, Switzerland: International Organization for Standardization.
ISO. (2006a). Environmental Management – Life cycle assessment – Principles and framework. ISO 14040:2006. Geneva, Switzerland: International Organization for Standardization.
ISO. (2006b). Environmental Management – Life cycle assessment – Requirements and guidelines. ISO 14044:2006. Geneva, Switzerland: International Organization for Standardization.
ISO. (2006c). Environmental labels and declarations—type III environmental declarations—principles and procedures. ISO 14025:2006. Geneva, Switzerland: International Organization for Standardization.
ISO. (2012a). Environmental management -- Life cycle assessment -- Illustrative examples on how to apply ISO 14044 to impact assessment situations. ISO/TR 14047:2012. Geneva, Switzerland: International Organization of Standardization.
ISO. (2012b). Environmental management -- Life cycle assessment -- Illustrative examples on how to apply ISO 14044 to goal and scope definition and inventory analysis. ISO/TR 14049:2012. Geneva, Switzerland: International Organization for Standardization.
ISO. (2013). Greenhouse gases—carbon footprint of products—requirements and guidelines for quantification and communication. ISO/TS 14067:2013. Geneva, Switzerland: International Organization for Standardization.
ISO. (2014a). Environmental management—water footprint—principles, requirements and guidelines. ISO 14046:2014. Geneva, Switzerland: International Organization for Standardization.
Johansson, C.-H. (n.d.). ([email protected], Interviewer) Josefsson, L. (2016). Region Örebro Län. (M. Wendin, Interviewer) mobil 0706 96 55 00. Julian Allen, S. A. (2005). Energy Consumption in the UK Jeans Supply Chain. London: Transport
Studies Group University of Westminster. Jungbluth, N. (n.d.). LCA expert. Critical review. [email protected]. Margrit-Rainer-Strasse
11c, CH 8050 Zurich. Jämsä, K. (n.d.). Karlsson, E. (2015, 10 01). Environmental controller H&M. Stockholm. Karlsson, L. (n.d.). ([email protected], Interviewer) Kurdve, M. (2014). Green Performance Map - Handbok,. Stockholm: Mälardalens högskola. lcia-recipe.net. (n.d.). Retrieved from http://www.lcia-recipe.net/ Leifman, C. (n.d.). ([email protected], Interviewer) Lindmark, K. (2016). Textilchef. (M. Wendin, Interviewer) mobil: 0703 00 83 56. Lubian, E. (2016, 04 14). environmental engineer. (M. Wendin, Interviewer) [email protected].
Gothenburg. Merja, S. (2016, 5 2). LCA expert agricultural systems. (M. Wendin, Interviewer)
[email protected]. Finland. Mikusinska, M. (2015). LCA expert. (M. Wendin, Interviewer) [email protected]. Sweco
Environment, Örebro. Nasrin, S. (n.d.). praktikant. [email protected]. Sollentuna Kommun. National Renewable Energy Laboratory. (2006). U.S. Life-Cycle Inventory Database. Retrieved from
http://hpb-1a.nrel.gov/lci Naturvårdsverket (Swedish EPA). (2015). emissionsfaktorer-och-varmevarden-vaxthusgaser-och-
luftfororeningar-2015-Rev4. SWE EPA. Retrieved from http://www.naturvardsverket.se/Stod-i-miljoarbetet/Vagledningar/Luft-och-klimat/Berakna-utslapp-av-vaxthusgaser-och-luftfororeninga/#
Olaison, J. (2016). Miljöstrateg. (M. Wendin, Interviewer) [email protected]. Olaison, J. (n.d.). Miljö- och kvalitetschef. PRé Sustainability. (2016). SimaPro.com. Retrieved from https://simapro.com/licences/share-collect/

Life Cycle Assessment of recycling cotton
Report-75
Page 62
Prissberg, A. (2016). importör Senstex . (M. Wendin, Interviewer) mobil : 0706 25 07 72. ReCiPe method. (2016, 5 16). Characterisation. Retrieved from http://www.lcia-
recipe.net/characterisation-and-normalisation-factors Schmidt, J. (2016, 4 19). CEO. (M. Wendin, Interviewer) Fibigerstræde 13, 9220 Aalborg East,
Denmark. Schnetzer, T. N. (Data v3.0 (2012)). Data collection of inputs and yields in LCIs of agricultural
production systems in the USA. Zurich, August 2011: Agroscope Reckenholz-Tänikon Research Station ART.
Searates. (2015, 12 11). Retrieved from https://www.searates.com/reference/portdistance/ Stefano Merciai, J. S. (2016). DESIRE, Development of a system of indicators for a Resource
Effecient Europe. Seventh Framework Program – Theme FP7‐ENV‐2012‐one‐stage Grant agreement no: 308552 .
Steffen, W., Rockström, J., Cornell, S., Fetzer, I., Biggs, O., Folke, C., & Reyers, B. (2015). Planetary Boundaries: Guiding human development on a changing planet. Science Vol. 347 no. 6223. Stockholm: journal Science.
Stenberg, E. (n.d.). Miljö- och hälsoskyddsinspektör, Miljö- och byggnadskontoret. [email protected]. Sollentuna kommun.
Thylmann, D. (2016, 4 13). Senior Consultant (Food, Agriculture and Renewable Materials). (M. Wendin, Interviewer) [email protected]. Hauptstraße 111-113, 70771 Leinfelden-Echterdingen, Germany.
Torring, M. (2015, 11 11). Recycling business developer. (M. Wendin, Interviewer) Uddin, K. F. (2015, 12 06). Environmental manager. (M. Wendin, Interviewer)
[email protected]. Karachi. Warberg, F. (n.d.). Konsult Tidsverkstaden. ([email protected], Interviewer) Södra Larmgatan
6, 5 tr, Göteborg, 411 16, Sverige. Wendin, M. (n.d.). Konsult Miljögiraff. ([email protected], Interviewer) 0733 248185. c/o
Lusthuset, Södra Larmgatan 6, 41116 Göteborg. Vestlund, E. (n.d.). Miljösamordnare, Kommunledningskontoret. ([email protected],
Interviewer) Sollentuna kommun. Zackrisson, M. (2016). LCA expert. (M. Wendin, Interviewer) [email protected]. Stockholm.

Life Cycle Assessment of recycling cotton
Report-75
Page 63
7 Appendix Appendix 1, Methods for Impact Assessment ....................................................................................... 64 Appendix 2: ReCiPe .............................................................................................................................. 66 Appendix 3 Cumulative Energy Demand V1.09 .................................................................................... 71 Appendix 4 USEtox (recommended + interim) V1.04 / Europe 2004 .................................................... 72 Appendix 5: The concept of allocation .................................................................................................. 74 Appendix 6: AM Electricity 2014 ............................................................................................................ 76 Appendix 7 Electricity at Artistic Milliners Denim Division ..................................................................... 77 Appendix 8 Artistic Milliners Denim Division Shredding ........................................................................ 82 Appendix 9 ICO 2014 (H&M) ................................................................................................................. 84 Appendix 10 Transport to I:CO (H&M) .................................................................................................. 93 Appendix 11 Transport by DC from Collection Points to Hubs (H&M) .................................................. 99 Appendix 12 IPCC on GWP in relation to GHG and GWP .................................................................. 102 Appendix 13 System expansion of the LCA model (suggestion) ........................................................ 103 Appendix 14 Data on supply of textiles (Gupta, Analysis 09_38_43, 2014). ...................................... 104 Appendix 15 Flow diagram of ReCiPe10 (Single score) for 1 kg recycled cotton fibre. ....................... 106 Appendix 16 Flow diagram of GWP for rec cotton. ............................................................................. 107 Appendix 17 Flow diagram of Toxicity9 for rec cotton (cut in two pieces to fit to page). ..................... 108 Appendix 18 Process contribution with ReCiPe Endpoint (H) V1.12 / World ReCiPe H/A / Normalisation. ...................................................................................................................................... 109 Appendix 19 Global Warming Potential of 1 kg recycled cotton fibre in kg CO2 eq. per Process. ..... 110 Appendix 20 Environmental overall Impact of 1 kg AM Rec Cotton fiber analysed with ReCiPe Midpoint (H) V1.12 / World Recipe H .................................................................................................. 111 Appendix 21 Environmental overall Impact of 1 kg AM Rec Cotton fiber analysed with CML-IA baseline V3.03 / World 2000 .............................................................................................................................. 113 Appendix 22 Water Footprint of 1 kg AM Rec Cotton fiber analysed with Hoekstra et al 2012 (Water Scarcity) V1.02 .................................................................................................................................... 113 Appendix 23 Primary Energy Demand of 1 kg AM Rec Cotton fiber analysed with Cumulative Energy Demand V1.09 / Single score .............................................................................................................. 114 Appendix 24 Primary Energy Demand of 1 kg AM Rec Cotton fiber analysed with Cumulative Energy Demand V1.09 /Characterisation ........................................................................................................ 115 Appendix 25 Ozone Depletion of 1 kg AM Rec Cotton fiber analysed with ReCiPe Midpoint (H) V1.12 / World Recipe H / Characterisation ...................................................................................................... 115 Appendix 26 Terrestrial acidification in kg SO2 eq. of 1 kg AM Rec Cotton fiber analysed with ReCiPe Midpoint (H) V1.12 / World Recipe H / Characterisation ..................................................................... 115 Appendix 27 Eutrophication of 1 kg AM Rec Cotton fibre analysed with ReCiPe Midpoint (H) V1.12 / World Recipe H / Characterisation ...................................................................................................... 116 Appendix 28 Photochemical oxidant formation kg NMVOC 1 kg AM Rec Cotton fibre analysed with ReCiPe Midpoint (H) V1.12 / World Recipe H / Characterisation ....................................................... 116 Appendix 29 Human toxicity, cancer / 1 kg recycled cotton fibre, analysed with USEtox (recommended + interim) V1.04 ................................................................................................................................... 117 Appendix 30 Human toxicity, non-cancer / 1 kg recycled cotton fibre, analysed with USEtox (recommended + interim) V1.04 .......................................................................................................... 117 Appendix 31 Freshwater ecotoxicity/ 1 kg recycled cotton fibre, analysed with USEtox (recommended + interim) V1.04 ................................................................................................................................... 117
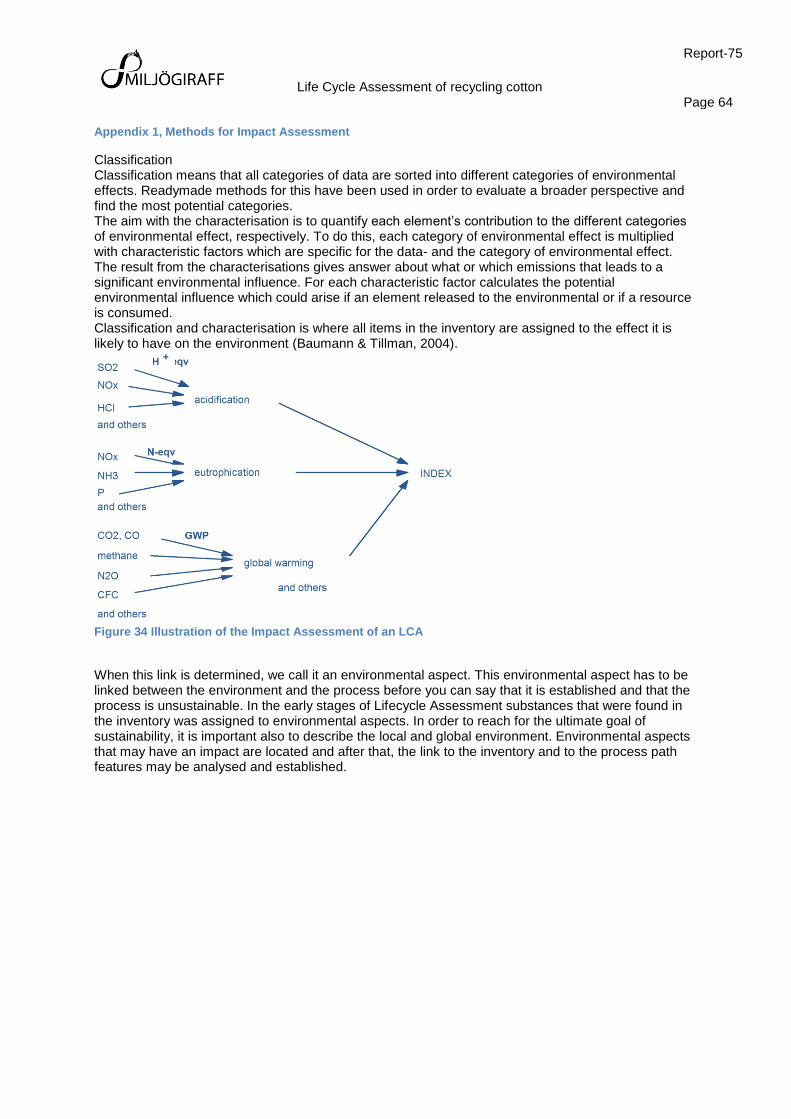
Life Cycle Assessment of recycling cotton
Report-75
Page 64
Appendix 1, Methods for Impact Assessment
Classification Classification means that all categories of data are sorted into different categories of environmental effects. Readymade methods for this have been used in order to evaluate a broader perspective and find the most potential categories. The aim with the characterisation is to quantify each element’s contribution to the different categories of environmental effect, respectively. To do this, each category of environmental effect is multiplied with characteristic factors which are specific for the data- and the category of environmental effect. The result from the characterisations gives answer about what or which emissions that leads to a significant environmental influence. For each characteristic factor calculates the potential environmental influence which could arise if an element released to the environmental or if a resource is consumed. Classification and characterisation is where all items in the inventory are assigned to the effect it is likely to have on the environment (Baumann & Tillman, 2004).
Figure 34 Illustration of the Impact Assessment of an LCA
When this link is determined, we call it an environmental aspect. This environmental aspect has to be linked between the environment and the process before you can say that it is established and that the process is unsustainable. In the early stages of Lifecycle Assessment substances that were found in the inventory was assigned to environmental aspects. In order to reach for the ultimate goal of sustainability, it is important also to describe the local and global environment. Environmental aspects that may have an impact are located and after that, the link to the inventory and to the process path features may be analysed and established.

Life Cycle Assessment of recycling cotton
Report-75
Page 65
Weighting The results of an LCA may depend on the method for impact assessment. There are a few different models to assist in assessment of the environmental impacts connected to the life cycle e.g. ecological scarcity (ECO), the environmental theme method (ET), ECO indicator (EI), ReCiPe and the Environmental Priority Strategies in Product Design (EPS) method. Weighting method implies that all of the data classes are weighted together so that only one number is expressed for the weighting method. To do a weighting, different data categories are weighed from some form of valuations principle. The basis of a valuation could be either individual or a community’s political and/or morality valuations. The weighting expresses the relation between values in the community and variations in the nature. The more effect or deviation an environmental aspect has from the valuations, the higher weighting value gets the environmental aspect [Lindahl et al. (2002)]. The basis of valuations which are used to develop a weighting method could be; political decisions, technical-financial conditions, nature conditions, effects of the health, panels, and studies of behavioural patterns. In a weighting method, there are either only one of this valuation basis or it will be a combination of these valuation bases. Since the basis of valuations varying for each weighting method, a comparison between different methods will give a shifting in the result [Lindahl et al. (2002)]. The mostly used weighting methods are collected in the book “The Hitch Hiker’s Guide to LCA”, written by Baumann H. & Tillman A-M. (2004), and the most important are presented below: Ecoindicator’99: is a weighting method based on the distance-to-target principle and the target is established as environmental critical loads 5 % ecosystem degeneration, or similar. Ecoindicator’99 are determined from three different cultural perspectives; hierarchism, egalitarian and individualist. An average value from the three cultural perspectives has been calculated and is used in this study. Ecoindicator’99 is based on Goedkoop and Spriensma (1999) (Baumann & Tillman, 2004). EPS 2000 is different from the two other weighting methods above in that case that it is not based on the distance-to-target principle. Instead this method is based on the willingness-to-pay for avoiding damages on environmental safeguard subjects. The EPS method is especially suitable for assessment of global impacts, such as climate change potential and resource depletion. The EPS indices are prepared by a group at Chalmers University of Technology and a steering committee from the industry in Sweden. EPD 2007: This method is to be used for the creation of Environmental Product Declarations or (EPDs), as published on the website Swedish Environmental Management Council (SEMC) www.environdec.com. The original document is titled: "Revision of the EPD® system into an International EPD®”. In the standard EPDs one only has to report on some specific impact categories. Specific product category guidelines may require extra information. The ReCiPe method is the most recently updated, the most comprehensive and best adapted to the environmental effects that are relevant in the area (Europe). ReCiPe is a life cycle impact assessment method which comprises harmonised category indicators at the midpoint and the endpoint level.

Life Cycle Assessment of recycling cotton
Report-75
Page 66
Appendix 2: ReCiPe
ReCiPe LCIA Methodology Life cycle assessment (LCA) is a methodological tool used to quantitatively analyse the life cycle of products/activities. ISO 14040 and 14044 provide a generic framework. After goal and scope has been determined, data has been collected, an inventory result is calculated. This inventory result is usually a very long list of emissions, consumed resources and sometimes other items. The interpretation of this list is difficult. An LCIA procedure, such as the ReCiPe method is designed to help with this interpretation. The primary objective of the ReCiPe method is to transform the long list of inventory results, into a limited number of indicator scores. These indicator scores express the relative severity on an environmental impact category. In ReCiPe we determine indicators at two levels:
Eighteen midpoint indicators Three endpoint indicators
ReCiPe uses an environmental mechanism as the basis for the modelling. An environmental mechanism can be seen as a series of effects that together can create a certain level of damage to for instance, human health or ecosystems. For instance, for climate change we know that a number of substances, increases the radiative forcing, this means heat is prevented from being radiated from the earth to space. As a result, more energy is trapped on earth, and temperature increases. As a result of this we can expect changes in habitats for living organisms, and as a result of this species may go extinct. From this example it is clear that the longer one makes this environmental mechanism the higher the uncertainties get. The radiative forcing is a physical parameter that can be relatively easily measured in a laboratory. The resulting temperature increase is less easy to determine, as there are many parallel positive and negative feedbacks. Our understanding of the expected change in habitat is also not complete, etc.
Figure35: Example of a harmonised midpoint-endpoint model for climate change, linking to human health and ecosystem damage.
So the obvious benefit of taking only the first step is the relatively low uncertainty. ReCiPe combines mid- and endpoints In ReCiPe we indeed calculate eighteen of such midpoint indicators, but also calculate three much more uncertain endpoint indicators. The motivation to calculate the endpoint indicators is that the large number of midpoint indicators is very difficult to interpret, partially as there are too many, partially because they have a very abstract meaning. How to compare radiative forcing with base saturation

Life Cycle Assessment of recycling cotton
Report-75
Page 67
numbers that express acidification? The indicators at the endpoint level are intended to facilitate easier interpretation, as there are only three, and they have a more understandable meaning The idea is that each user can choose at which level it wants to have the result:
Eighteen robust midpoints, that are relatively robust, but not easy to interpret Three easy to understand, but more uncertain endpoints: Damage to Human health Damage to ecosystems Damage to resource availability
The user can thus choose between uncertainty in the indicators, and uncertainty on the correct interpretation of indicators. The figure below provides the overall structure of the method
Figure36: ReCiPe Characterisation links.

Life Cycle Assessment of recycling cotton
Report-75
Page 68
Table 16: Impact category name and unit in ReCiPe (Goedkoop, o.a., 2009)
Impact category name Indicator name Unit
Climate change CC infra-red radiative forcing kg (CO2 to air)
Ozone depletion OD stratospheric ozone concentration kg (CFC-115 to air)
Terrestrial acidification TA base saturation kg (SO2 to air)
Freshwater eutrophication FE phosphorus concentration kg (P to freshwater)
Marine eutrophication ME nitrogen concentration kg (N to freshwater)
Human toxicity HT hazard-weighted dose kg (14DCB to urban air)
Photochemical oxidant formation POF
Photochemical ozone concentration
kg (NMVOC6 to air)
Particulate matter formation PMF PM10 intake kg (PM10 to air)
Terrestrial eco toxicity TET hazard-weighted concentration kg (14DCB to industrial soil)
Freshwater eco toxicity FET hazard-weighted concentration kg (14DCB to freshwater)
Marine eco toxicity MET hazard-weighted concentration kg (14-DCB7 to marine water)
Ionizing radiation IR absorbed dose kg (U235 to air)
Agricultural land occupation ALO
Occupation m2×yr (agricultural land)
Urban land occupation ULO Occupation m2×yr (urban land)
Natural land transformation NLT Transformation m2 (natural land)
Water depletion WD amount of water m3 (water)
Mineral resource depletion MRD grade decrease kg (Fe)
Fossil resource depletion FD upper heating value kg (oil)
At the endpoint level, most of these midpoint impact categories are further converted and aggregated into the following three endpoint categories:
Damage to human health (HH) Damage to ecosystem diversity (ED) Damage to resource availability (RA)
Climate change: Climate change causes a number of environmental mechanisms that affect both the endpoint human health and ecosystem health. Climate change models are in general developed to assess the future environmental impact of different policy scenarios. For ReCiPe 2008, we are interested in the marginal effect of adding a relatively small amount of CO2 or other greenhouse gasses, and not the impact of all emissions. Ozone layer: The characterisation factor for ozone layer depletion accounts for the destruction of the stratospheric ozone layer by anthropogenic emissions of ozone depleting substances (ODS). These are recalcitrant chemicals that contain chlorine or bromine atoms. Because of their long atmospheric lifetime, they are the source of Chlorine and Bromine reaching the stratosphere. Chlorine atoms in chlorofluorocarbons (CFC) and bromine atoms in halons are effective in degrading ozone due to heterogeneous catalysis, which leads to a slow depletion of stratospheric ozone around the globe. Acidification: Atmospheric deposition of inorganic substances, such as sulphates, nitrates, and phosphates, cause a change in acidity in the soil. For almost all plant species there is a clearly defined optimum of acidity. A serious deviation from this optimum is harmful for that specific kind of species and is referred to as acidification. As a result, changes in levels of acidity will cause shifts in species occurrence (Goldcorp and Spriensma, 1999, Hayashi et al. 2004). Major acidifying emissions are NOx, NH3, and SO2

Life Cycle Assessment of recycling cotton
Report-75
Page 69
Eutrophication: Aquatic eutrophication can be defined as nutrient enrichment of the aquatic environment. Eutrophication in inland waters as a result of human activities is one of the major factors that determine its ecological quality. On the European continent it generally ranks higher in severity of water pollution than the emission of toxic substances. Aquatic eutrophication can be caused by emissions to air, water and soil. In practice the relevant substances include phosphorus and nitrogen compounds emitted to water and soil as well as ammonia (NH3) and nitrogen oxide (NOx) emitted to air. Toxicity: The characterisation factor of human toxicity and eco toxicity accounts for the environmental persistence (fate) and accumulation in the human food chain (exposure), and toxicity (effect) of a chemical. Fate and exposure factors can be calculated by means of ‘evaluative’ multimedia fate and exposure models, while effect factors can be derived from toxicity data on human beings and laboratory animals (Hertwich et al., 1998; Huijbregts et al., 2000). Particulate matter formation: Fine Particulate Matter with a diameter of less than 10 μm (PM10) represents a complex mixture of organic and inorganic substances. PM10 causes health problems as it reaches the upper part of the airways and lungs when inhaled. Secondary PM10 aerosols are formed in air from emissions of sulphur dioxide (SO2), ammonia (NH3), and nitrogen oxides (NOx) among others (World Health Organisation, 2003). Inhalation of different particulate sizes can cause different health problems. Land occupation: The land use impact category reflects the damage to ecosystems due to the effects of occupation and transformation of land. Although there are many links between the way land is used and the loss of biodiversity, this category concentrates on the following mechanisms: 1. Occupation of a certain area of land during a certain time; 2. Transformation of a certain area of land. Both mechanisms can be combined, often occupation follows a transformation, but often occupation occurs in an area that has already been converted (transformed). In such cases the transformation impact is not allocated to the production system that occupies an area. Ionizing radiation: This describes the damage to Human Health related to the routine releases of radioactive material to the environment. Water depletion: Water is a scarce resource in many parts of the world, but also a very abundant resource in other parts of the world. Unlike other resources there is no global market that ensures a global distribution. The market does not really work over big distances as transport costs are too high. Extracting water in a dry area can cause very significant damages to ecosystems and human health. Fossil depletion: The term fossil fuel refers to a group of resources that contain hydrocarbons. The group ranges from volatile materials (like methane), to liquid petrol, to non-volatile materials (like coal). There is a highly politicised debate on the availability of conventional (liquid) oil, and this makes it difficult to obtain reliable unbiased data. The spectrum of views ranges from the Peak-oil movement (www.aspo.org or peak-oil.com) to international organisations like the International Energy Agency (IEA), or commercial organisations like the Cambridge Energy Research Agency (CERA). Therefore, it is hard to determine the seriousness of the depletion of oil, and which model to use, for this category the IEA model is used. In ReCiPe 2008 it has been decided to group different sources of uncertainty and different choices into a limited number of perspectives or scenarios, according to the “Cultural Theory” by Thompson 1990. Three perspectives are discerned:
Individualist (I) Hierarchism (H) Egalitarian (E)

Life Cycle Assessment of recycling cotton
Report-75
Page 70
These perspectives do not claim to represent archetypes of human behaviour, but they are merely used to group similar types of assumptions and choices. For instance:
Perspective I is based on the short-term interest, impact types that are undisputed, technological optimism as regards human adaptation. Perspective H is based on the most common policy principles with regards to time-frame and other issues. Perspective E is the most precautionary perspective, taking into account the longest time-frame, impact types that are not yet fully established but for which some indication is available.

Life Cycle Assessment of recycling cotton
Report-75
Page 71
Appendix 3 Cumulative Energy Demand V1.09
Method to calculate Cumulative Energy Demand (CED), based on the method published by Ecoinvent version 2.0 and expanded by PRé Consultants for raw materials available in the SimaPro 7 database. Contact info: http://www.ecoinvent.org/contact/ Frischknecht R., Jungbluth N., et.al. (2003). Implementation of Life Cycle Impact Assessment Methods. Final report Ecoinvent 2000, Swiss Centre for LCI. Duebendorf, CH, www.ecoinvent.ch Wood is not included in this methodology due to the frequent use of wood as feedstock in SimaPro. Normalization: it is not a part of this method. Weighting: Each impact category is given the weighting factor 1. For more information, see the Database manual. Adaptations (August 2004, v1.01): Added: Additional oil resources; Water, barrage Corrected values: Uranium ore, 1.11 GJ per kg, in ground; Uranium, 2291 GJ per kg, in ground; Uranium, 451 GJ per kg, in ground; Uranium, 560 GJ per kg, in ground. Not included: Energy from hydrogen; Energy, recovered; Energy, unspecified; Oil; Steam from waste incineration. Other adaptations (March 2005, v1.02): - Sulphur removed. Other adaptations (August 2005, v1.03):- In impact category Non-renewable, fossil the characterisation value for "Gas, natural in ground" has been changed from 40,3 to 38.3 MJ LHV/m3 following the Ecoinvent 1.2 update. Other adaptations (February 2008, v1.04): - Minor adaptations in Unit names and Impact category names (capitals, points) for more consistency with other categories. Other adaptations (April 2008, v1.05): - Seven extra substance flows are added: Energy, gross calorific value, in biomass, primary forest' Geothermal converted' Energy, solar, converted' Energy, from hydrogen' Energy, unspecified' - The characterisation factor of Peat, in ground' raw biotic in IC non-renewable, fossil has a new characterisation factor = 9 Other adaptations (November 2009, v1.06): - Created a new impact category: 'Non-renewable, biomass' and moved the substance 'energy, gross calorific value, in biomass, primary forest' to this new impact category. Other adaptations (March 2010, v1.07): Weighting: The weighting factor of impact category non-renewable biomass was changed to 1 Other adaptations (August 2010, v1.08): - The quantity and unit of the single score is changed: v1.07: Indicator (Pt) v1.08: Energy (MJ) Other adaptations (August 2014, v1.09): - The following flows were added: Coal, bituminous, 24.8 MJ per kg Coal, hard, 30.7 MJ per kg Gas, natural/kg - The factor for Methane was changed from 35.9 to 55.53 MJ/kg (the previous value was in MJ/m3, which is the incorrect unit).

Life Cycle Assessment of recycling cotton
Report-75
Page 72
Appendix 4 USEtox (recommended + interim) V1.04 / Europe 2004
The USEtox model to create consensus on LCIA toxicity characterization factors has been developed by a team of researchers from the Task Force on Toxic Impacts under the UNEP-SETAC Life Cycle Initiative. For more information, visit www.usetox.org or contact [email protected]. This implementation is based on data retrieved from the USEtox website on May 17, 2010. The USETox model provides a list of substances grouped into: A: Recommended characterization factors B: Interim characterization factors In this version, both recommended and interim characterisation factors are included. SimaPro also contains a version of USEtox with recommended factors only, called USEtox (consensus only). In USEtox, a distinction was made between recommended and interim characterization factors, reflecting the level of reliability of the calculations in a qualitative way. Characterisation factors for 'metals', 'dissociating substances' and 'amphiphilic' (e.g. detergents) were all classified as interim due to the relatively high uncertainty of addressing fate and human exposure for all chemicals within these substance groups. For the remaining set of chemicals, consensus has been reached that recommended aquatic Eco toxicological characterisation factors must be based on effect data of at least three different species covering at least three different trophic levels (or taxa) in order to ensure a minimum variability of biological responses. Using the version with recommended characterization factors only implies that characterisation factors for substances like metals and detergents are missing. The USEtox team advises to use the recommended USETox characterization factors ALWAYS together with the interim factors, as otherwise the substances concerned would be characterized with zero impact as no characterization factor is applied to their emissions. When an emission characterized with interim characterization factors is dominating the overall impact, it implies that the associated results have to be interpreted as having a lower level of confidence. A sensitivity study might by performed by applying only the recommended characterization factors to see if and how the results (and the conclusions) change. An example can be found in metals. They all obtained interim factors, and tend to dominate all the organic substances with several orders of magnitude in most LCAs. We recommend practitioners to take care communicating results that are dominated by interim characterisation factors, as the uncertainties of these interim factors can be very high (several orders of magnitude). If improved data become available or the model is updated in the future, interim factors could eventually be recalculated and become recommended factors if consequently they fulfil the criteria. The impact categories are: - Human toxicity, cancer - Human toxicity, non-cancer - Eco toxicity The characterisation factor for human toxicity (Human Toxicity Potential) is expressed in Comparative Toxic Units (CTUh/kg), providing the estimated increase in morbidity in the total human population per unit mass of a chemical emitted (cases/kg), assuming equal weighting between cancer and non-cancer due to a lack of more precise insights into this issue. The characterisation factor for aquatic Eco toxicity (Eco toxicity Potential) is expressed in Comparative Toxic Units (CTUe/kg) and provides an estimate of the potentially affected fraction of species (PAF) integrated over time and volume per unit mass of a chemical emitted (PAF m3.day/kg).

Life Cycle Assessment of recycling cotton
Report-75
Page 73
Normalization factors were developed for Europe and North America for 2004 and 2002/2008, respectively (Laurent, A., Lautier, A., Rosenbaum, R.K., Olsen, S.I., Hauschild, M.Z. 2011. Int J LCA 16 (8): 728-738.). For Eco toxicity, normalization references using the PestLCI model (Birkved and Hauschild 2006) were used, which assume that only 5% and 0.1% of applied pesticides ends as direct emissions to air and to water, respectively. Laurent et al. 2011 also includes normalization factors assuming 100% of the consumed pesticides as direct emissions to agricultural soil (referred to as "Pest-to-soil" in the paper). Please note that some common toxic substances are missing such as: methane, carbon monoxide, aluminium and ammonia. Also groups of substances are excluded such as: PAH, hydrocarbons, NMVOC and particulates.

Life Cycle Assessment of recycling cotton
Report-75
Page 74
Appendix 5: The concept of allocation
The inputs and outputs shall be allocated to the different products according to clearly stated procedures that shall be documented and explained together with the allocation procedure. The sum of the allocated inputs and outputs of a unit process shall be equal to the inputs and outputs of the unit process before allocation. Whenever several alternative allocation procedures seem applicable, a sensitivity analysis shall be conducted to illustrate the consequences of the departure from the selected approach.
Allocation of environmental aspects may occur when a process produces more than one product. The basis for this allocation is primarily economic value, secondarily physical properties. If the allocation has low importance it may be “cut-off”, not considered, instead all load is on the studied product. The method chosen for the allocation is the cut-off method. The cut-off method assigns the loads caused by a product to just that product. When the cut-off method is used, environmental aspects or processes which can be assumed to contribute less than 1 %, do not have to be included in the study [Baumann H. & Tillman A-M. (2004)].
Figure 37: Allocation example
The study shall identify the processes shared with other product systems and deal with them according to the stepwise procedurepresented below:
1. Wherever possible, allocation should be avoided by dividing the unit process to be allocated into two or more sub-processes and collecting the input and output data related to these sub-processes, or expanding the product system to include the additional functions related to the co-products.
2. Where allocation cannot be avoided, the inputs and outputs of the system should be partitioned between its different products or functions in a way that reflects the underlying physical relationships between them; i.e. they should reflect the way in which the inputs and outputs are changed by quantitative changes in the products or functions delivered by the system.
3. Where physical relationship alone cannot be established or used as the basis for allocation, the inputs should be allocated between the products and functions in a way that reflects other relationships between them. For example, input and output data might be allocated between co-products in proportion to the economic value of the products.
"Allocation cut-off by classification" (ISO standard). Recycled Content: The underlying philosophy of this approach is that primary (first) production of materials is always allocated to the primary user of a material. If a material is recycled, the primary producer does not receive any credit for the provision of any recyclable materials. As a consequence, recyclable materials are available burden-free to recycling processes, and secondary (recycled) materials bear only the impacts of the recycling processes. For example, recycled paper only bears the impacts of waste paper collection and the recycling process of turning waste paper into recycled paper. It is free of any burdens of the forestry activities and processing required for the primary production of the paper.

Life Cycle Assessment of recycling cotton
Report-75
Page 75
Furthermore, producers of wastes do not receive any credit for recycling or re-use of products resulting out of any waste treatment. For example, heat from the incineration of municipal solid waste can be used to heat houses or offices, and therefore has a value. Nevertheless, the incineration is allocated completely to the treatment of the waste, and therefore the burdens lay with the waste producer. The heat comes burden-free. This approach to by-product allocation has also been used in Ecoinvent versions 1 and 2, where it was the only available system model. In the ISO standards, boundaries with other systems, and the allocation of environmental burdens between them, are based on the recommendations of the international EPD system34, which are also in line with the requirements and guidelines of the ISO14040 and ISO14044 standards (IEC, 2008). In accordance with these recommendations, the Polluter Pays (PP) allocation method is applied. For allocation of environmental burdens when incinerating waste, this implies that all of the processes in the waste treatment phase, including emissions from the incineration are allocated to the life cycle in which the waste is generated. Following procedures for refining of energy or materials used as the input in a following/receiving process, are allocated to the next life cycle.
Figure 38: Allocation of environmental impacts between two life cycles according to the PP allocation method. Here regarding to incineration of waste and resulting energy products (Image from IEC, 2008, p14).
In the case of recycling, environmental burdens are accounted for outside of the generating life cycle, and have thus been allocated to the subsequent life cycle which uses the recycled materials as input. In this LCA, the heat and electricity recovered from the incineration of waste has been taken into account, but modelled as an empty energy process which does not affect the inputs of the life cycle. Recovered energy from waste incineration has been presented and discussed in the results in comparison to cumulative energy demand. Avoided materials due to recycling of cardboard and plastics have not been taken into account, this in accordance to the EPD recommendations. Allocation at the point of substitution (Ecoinvent recommended) Specifically, in the allocation-based system models, all marketable by-products yielded in treatment activities are moved into the activities producing the treated material for treatment as waste in a process called allocation at the point of substitution. Similarly, in the case of Specialty Productions, the reference product of the activity will be handled from now on as a by-product of an ordinary treatment activity. Then, all multi-output activities are allocated (using the allocation criteria defined for the specific System Model). This allocation is happening at the point of substitution, and the marketable by-products issued in treatment activities get allocated in the activities they have been moved into.
34 EPD (Environmental Product Declarations) by the International EPD Cooperation (IEC)

Life Cycle Assessment of recycling cotton
Report-75
Page 76
Appendix 6: AM Electricity 2014
SimaPro 8.1.1.16 Impact assessment Date:
Project 392 LCA on recycling cotton 2016-04-14
Calculation: Analyse
Results: Impact assessment
Product: 1 kWh AM Electricity 2014 (of project 392 LCA on recycling cotton)
Method: IPCC 2013 GWP 100a V1.01
Indicator: Characterisation
Skip categories: Never
Exclude infrastructure processes:
No
Exclude long-term emissions:
No
Sorted on item: Impact category
Sort order: Ascending
Impact category IPCC GWP 100a kg CO2 eq Total 0,767669028 AM Electricity 2014 0,657916188
Transport, pipeline, long distance, natural gas {GLO}| market for | Alloc Rec, U
0,003758924
Gas turbine, 10MW electrical {GLO}| market for | Alloc Rec, U
0,000467703
Natural gas, high pressure {RoW}| market for | Alloc Rec, U
0,105526212

Life Cycle Assessment of recycling cotton
Report-75
Page 77
Appendix 7 Electricity at Artistic Milliners Denim Division
SimaPro 8.1.1.16 process Date: 2016-04-14
Project 392 LCA on recycling cotton Time: 16:15
Process
Category type Material
Process identifier
Miljögir000042634900007
Type Unit process
Process name Electricity at Artistic Milliners Denim Division
Status To be revised
Time period 2010 and after
Geography Asia, Indian region
Technology Modern technology
Representativeness
Data from a specific process and company
Multiple output allocation
Not applicable
Substitution allocation
Not applicable
Cut off rules Less than 5% (environmental relevance)
Capital goods Second order (material/energy flows including operations)
Boundary with nature
Not applicable
Infrastructure No
Date 2015-11-26
Record Marcus Wendin
Generator Masood Khan (Senior Quality Assurance Manager) Contact No: 03002288146
External documents
Literature references
Artistic Milliners Denim Division
AM Environmental Report Marcus Wendin
Electricity Grid Pakistan
Niels Jungbluth
ESU calculation from standard SMED
Swedish EPA emission factors Ecoinvent 3
Collection method
SimaPro Share and Collect
Data treatment The kg of CO2 is calculated based on the lower specific heat value (9,83 kWh/m3), that gives a higher content of carbon per energy content in natural gas.

Life Cycle Assessment of recycling cotton
Report-75
Page 78
The emissions have also been cross calculated based on the assumptions about composition in the natural gas. Calculations of emissions are also made by Niels (average of the three values, composition of European natural gas according to Ecoinvent). Completed with data based on Ecoinvent 3, burned in gas turbine. For compressor station RU.
Verification To be verified
Comment Masood Khan (Senior Quality Assurance Manager) Contact No: 03002288146
This unit LCI data refer to the electricity from burning fossil natural gas. The amount of natural gas consumed yearly is put in relation to the amount of electricity produced yearly. It gives a low efficiency (25%). This could be followed up over time to adjust for periodic effects.
Allocation rules Economic and Rec Content "Allocation cut-off by classification" (not allocated to the recycled content). Attributional perspective.
System description
Miljögiraff
Products
Waste category
AM Electricity 2014
Electricity kWh Textiles
Materials/fuels
Transport, pipeline, long distance, natural gas {GLO}| market for | Alloc Rec, U
TrPGas kgkm
Gas turbine, 10MW electrical {GLO}| market for | Alloc Rec, U
1,25E-9*Electricity p Completed with data based on Ecoinvent 3 - allocation, rec for natural gas, burned in gas turbine. For compressor station RU.
Electricity/heat
Natural gas, high pressure {RoW}| market for | Alloc Rec, U
NaturalGasVol m3
Emissions to air
Particulates, unspecified
high. pop. PartEmission
kg
Nitrogen oxides high. pop. NOxEmission
kg
Carbon monoxide, fossil
high. pop. COEmission
kg

Life Cycle Assessment of recycling cotton
Report-75
Page 79
Carbon dioxide, fossil
high. pop. CO2weight3
kg
Mercury high. pop. 1,63E-9*Electricity
kg
Dinitrogen monoxide
high. pop. 1,087E-5*Electricity
kg
Sulfur oxides high. pop. 5,978E-6*Electricity
kg
NMVOC, non-methane volatile organic compounds, unspecified origin
high. pop. 1,0869E-5*Electricity
kg
Methane, fossil high. pop. 4,89E-5*Electricity
kg
Input parameters
NaturalGasVol 7101398 m3 at NTP from Sui Southern Gas Company
Electricity 19765222 kWh per year 2014 Produced by own unit for burning Natural Gas.
DistNaturalGas 100 km Natural gas comes through pipeline [Estimated by Marcus]
Particulates 22 mg/Nm3 [AM Environmental Report] burning of natural gas, reffering to the fluegas.
NOx 335 mg/Nm3 [AM Environmental Report] burning of natural gas, reffering to the fluegas.
CO 765 mg/Nm3 [AM Environmental Report] burning of natural gas, reffering to the fluegas.
FluegasVol 12,4 Nm3 fluegas per Nm3 burned natural gas [ESU calculation from standard]
CO2genericNM3 87000 mg/Nm3 [ESU calculation from standard] burning of natural gas, reffering to the inflow of natural gas.
COgeneric 638 mg/Nm3 [ESU calculation from standard]
NOxgeneric 367 mg/Nm3 [ESU calculation from standard]
CO2genericMJ 56 g/MJ natural gas consumed (EU) [Ecoinvent]
CO2ref1kWh 205,27 g/kWh el produced by EON Sweden [Pär Lindman email 20160315]
CO2ref2kWh 247 g/kWh el produced by Öresundskraft Sweden [Pär Lindman email 20160315]
CO2ref3kWh 203,4 g/kWh el produced by Kraftringen Sweden [Pär Lindman email 20160315]

Life Cycle Assessment of recycling cotton
Report-75
Page 80
CO2ref4kWh 204 g/kWh el produced by X Denmark [Pär Lindman email 20160315]
CO2ref5kWh 580 g/kWh el produced by (Ecoinvent) 100MV in India [calculated by Pär Lindman email 20160315]
CH4share 0,9 Methane share in Natural Gas [http://www.energigas.se/Energigaser/FAQ/Naturgas]
C2H6share 0,06 Ethane share in Natural Gas [http://www.energigas.se/Energigaser/FAQ/Naturgas]
C3H8share 0,04 Propane (and longer) share in Natural Gas [http://www.energigas.se/Energigaser/FAQ/Naturgas]
COsmed 15 g/MJ natural gas consumed [SMED]
CO2smed 204,8 g/kWh natural gas consumed [SMED row 12079, year 2013 Sweden]
HspecGasBTU 950 BTU/SCF Specific heat value [Khawaja Faheem Uddin 4 April 2016]
BTUperkWh 3412,142
kWhperBTU 0,000293
HspecGasKwh 0,278418 kWh/SCF Specific heat value [calculated from Khawaja Faheem Uddin 4 April 2016]
CuFtPerCuM 35,31467 35 cu ft / 1 cu m
CarbonShare 0,762 share at 11,025 kWh/m3 [Emiliano Lubian DGE [email protected]]
CO2ref8kWh 228,4 g/kWh natural gas at 9,83 kWh/m3 [Emiliano Lubian DGE [email protected]]
Calculated parameters
PartEmission EmissionFlow*Particulates/1000000
kg
NOxEmission EmissionFlow*NOx/1000000 kg
COEmission EmissionFlow*CO/1000000 kg
TrPGas NaturalgasWeight*DistNaturalGas
kgkm
CO2Emission EmissionFlow*CO2genericNM3/1000000
kg
COgenericEmission
EmissionFlow*CO/1000000 kg
NOxgenericEmission
EmissionFlow*NOx/1000000 kg
NaturalgasWeight
NaturalGasVol*densnaturalgas kg
CH4kmol CH4weight/CH4molar kmol
COkmol COweight/COmolar kmol
EmissionFlow NaturalGasVol*FluegasVol Nm3 fluegas per year
COweight COEmission kg CO in the flue gas during one year
CO2ref6kWh 1000*CO2Emission/Electricity g/kWh el produced [ESU calculation from standard]
C3H8molar 12*3+1*8 Propane kg/kmol

Life Cycle Assessment of recycling cotton
Report-75
Page 81
C2H6molar 12*2+1*6 Ethan kg/kmol
CH4molar 12*1+1*4 Methane kg/kmol
COmolar 12*1+16*1 Carbon monoxide kg/kmol
CH4weight NaturalgasWeight*CH4share Methane kg
C2H46weight NaturalgasWeight*C2H6share Ethan kg
C3H8weight NaturalgasWeight*C3H8share Propane kg
C3H8amount C3H8weight/C3H8molar kmole
C2H6amount C2H46weight/C2H6molar kmole
CH4amount CH4weight/CH4molar kmole
CarbonAmountTotal
C3H8amount*3+C2H6amount*2+CH4amount*1
kmole total of Carbon atoms in Natural gas
CO2molar 12*1+16*2 Carbon dioxide kg/kmol
COamount COweight/COmolar kmole in fluegas
CO2amount CarbonAmountTotal-COamount kmole in fluegas
CO2weight CO2amount*CO2molar kg in fluegas by AM Pakistan [calculated by Marcus Wendin 20160315]
CO2ref7kWh 1000*CO2weight/Electricity g/kWh el produced by AM Pakistan [calculated by Marcus Wendin 20160315]
CO2generickWh CO2genericMJ*MJperkWH g/kWh natural gas consumed (EU) [Ecoinvent]
CO2perKWhgas 1000*CO2weight3/NaturalgasEnergy
g/kWh natural gas consumed (AM)
NaturalgasEnergy
NaturalgasWeight*NaturgaskWh kWh natural gas consumed (AM)
HspecGasKwhPerM
HspecGasKwh*CuFtPerCuM kWh/m3 [calculated from Khawaja Faheem Uddin 4 April 2016]
HspecCheck NaturgaskWh*densnaturalgas kWh/m3 [calculated from Patrik Klintbom 4 April 2016]
NaturalgasEnerAM
NaturalgasWeight*HspecGasKwhPerM
kWh natural gas consumed (AM)
Carbonweight CarbonShare*NaturalgasWeight kg carbon in natural gas consumed and emitted
CarbonAmount Carbonweight/Cmolar kmole
Cmolar 12 Carbon kg/kmol
CO2weight2 CarbonAmount*CO2molar kg ok calculation
CO2weight3 0,001*CO2ref8kWh*NaturalgasEnerAM
kg CO2 calculated based on the lower specific heat value that gives a higher content of carbon per energy content in natural gas.

Life Cycle Assessment of recycling cotton
Report-75
Page 82
Appendix 8 Artistic Milliners Denim Division Shredding
SimaPro 8.1.1.16 process Date: 2016-04-14
Project 392 LCA on recycling cotton Time: 18:24
Process
Category type Material
Process identifier Miljögir000042634900005
Type Unit process
Process name Artistic Milliners Denim Division Shredding
Status Revised
Time period 2010 and after
Geography Asia, Indian region
Technology Modern technology
Representativeness Data from a specific process and company
Multiple output allocation
Unknown
Substitution allocation Not applicable
Cut off rules Less than 1% (environmental relevance)
Capital goods Second order (material/energy flows including operations)
Boundary with nature Not applicable
Infrastructure No
Date 2015-11-26
Record Marcus Wendin
Generator Masood Khan (Senior Quality Assurance Manager) Contact No: 03002288146
External documents
Literature references Artistic Milliners Denim Division email 2015-12-18
Marcus Wendin
Collection method SimaPro Share and Collect
Data treatment
Verification verified by Khawaja Faheem Uddin 2 April 2016
Comment Artistic Milliners Denim Division Shredding Masood Khan (Senior Quality Assurance Manager) Contact No: 03002288146
Shredding of Input of raw material (denim jeans legs from I:CO) into Output of recycled cotton fibre. Using electricity produced at site from Natural gas.
Allocation rules Economic and Rec Content "Allocation cut-off by classification" (not allocated to the recycled content). Attributional perspective.
System description Miljögiraff

Life Cycle Assessment of recycling cotton
Report-75
Page 83
Products
Waste category
AM Rec Cotton fibre OutputCottonFiber ton Textiles
Materials/fuels
Textiles ICO RecCotton InputCottonTextile ton
Electricity/heat
AM Electricity 2014 ElectricityShredding*OutputCottonFiber kWh
Waste to treatment
Waste textile, soiled {GLO}| market for | Alloc Rec, U
CottonWaste ton
Input parameters
OutputCottonFiber 103,3 ton/year
InputCottonTextile 106,5 ton/year
ElShreddingAM 3600 kWh / year Electricity consumption for shredding fibres at AM
Calculated parameters
ElectricityShreddingICO
ElShredding kWh/ton (based on the value from ICO)
ElectricityShredding ElShreddingAM/OutputCottonFiber kWh / ton Electricity consumption for shredding fibres at AM
CottonWaste InputCottonTextile-OutputCottonFiber ton/year

Life Cycle Assessment of recycling cotton
Report-75
Page 84
Appendix 9 ICO 2014 (H&M)
SimaPro 8.1.1.16
process
Project 392 LCA on recycling cotton Date: ########
Time: 15:09
Process
Category type
Material
Process identifier
Miljögir000042634900001
Type Unit process
Process name
ICO 2014 (H&M)
Status To be reviewed
Time period
2010 and after
Geography
Asia, Indian region
Technology
Modern technology
Representativeness
Data from a specific process and company
Multiple output allocation
Physical causality
Substitution allocation
Not applicable
Cut off rules
Less than 5% (environmental relevance)
Capital goods
Second order (material/energy flows including operations)
Boundary with nature
Not applicable
Infrastructure
No
Date 2015-11-11
Record Marcus Wendin
Generator Chetan Gupta, [email protected], +49 4102 4545-420, I:COLLECT GMBH An der Strusbek 19, 22926 Ahrensburg Germany
External documents
Literature references
I:Collect GmbH
Marcus Wendin
H&M SimaPro Collect format
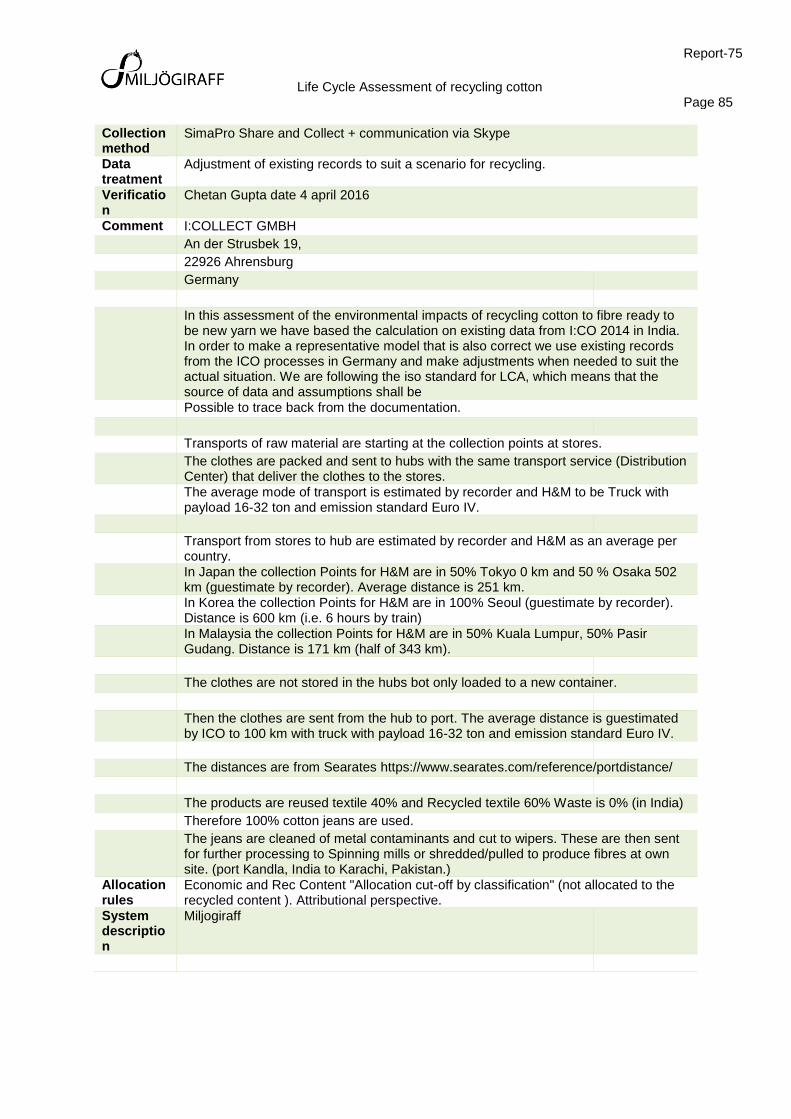
Life Cycle Assessment of recycling cotton
Report-75
Page 85
Collection method
SimaPro Share and Collect + communication via Skype
Data treatment
Adjustment of existing records to suit a scenario for recycling.
Verification
Chetan Gupta date 4 april 2016
Comment I:COLLECT GMBH An der Strusbek 19, 22926 Ahrensburg Germany
In this assessment of the environmental impacts of recycling cotton to fibre ready to be new yarn we have based the calculation on existing data from I:CO 2014 in India. In order to make a representative model that is also correct we use existing records from the ICO processes in Germany and make adjustments when needed to suit the actual situation. We are following the iso standard for LCA, which means that the source of data and assumptions shall be Possible to trace back from the documentation.
Transports of raw material are starting at the collection points at stores. The clothes are packed and sent to hubs with the same transport service (Distribution Center) that deliver the clothes to the stores. The average mode of transport is estimated by recorder and H&M to be Truck with payload 16-32 ton and emission standard Euro IV.
Transport from stores to hub are estimated by recorder and H&M as an average per country. In Japan the collection Points for H&M are in 50% Tokyo 0 km and 50 % Osaka 502 km (guestimate by recorder). Average distance is 251 km. In Korea the collection Points for H&M are in 100% Seoul (guestimate by recorder). Distance is 600 km (i.e. 6 hours by train) In Malaysia the collection Points for H&M are in 50% Kuala Lumpur, 50% Pasir Gudang. Distance is 171 km (half of 343 km).
The clothes are not stored in the hubs bot only loaded to a new container.
Then the clothes are sent from the hub to port. The average distance is guestimated by ICO to 100 km with truck with payload 16-32 ton and emission standard Euro IV.
The distances are from Searates https://www.searates.com/reference/portdistance/
The products are reused textile 40% and Recycled textile 60% Waste is 0% (in India) Therefore 100% cotton jeans are used. The jeans are cleaned of metal contaminants and cut to wipers. These are then sent for further processing to Spinning mills or shredded/pulled to produce fibres at own site. (port Kandla, India to Karachi, Pakistan.)
Allocation rules
Economic and Rec Content "Allocation cut-off by classification" (not allocated to the recycled content ). Attributional perspective.
System description
Miljogiraff

Life Cycle Assessment of recycling cotton
Report-75
Page 86
Products
Textiles ICO RecCotton
TextileIn*SortedRecCotton kg
Textile ICO Reuse
TextileIn*SortedReUse kg
Avoided products
Resources
Materials/fuels
Transport to ICO
TextileIn kg
Soap {GLO}| market for | Alloc Rec, U
CleaningDetergents kg
Lubricating oil {GLO}| market for | Alloc Rec, U
LubricantsICO*densityDiesel kg
Lubricating oil {GLO}| market for | Alloc Rec, U
Grease kg
Diesel, burned in building machine {GLO}| market for | Alloc Rec, U
DieselEnergy MJ
Transport, freight, lorry >32 metric ton, EURO4 {GLO}| market for | Alloc Rec, U
DistLocal*Consumables kgkm
Municipal waste collection
DistWaste*(Waste+WasteTextile) kgkm
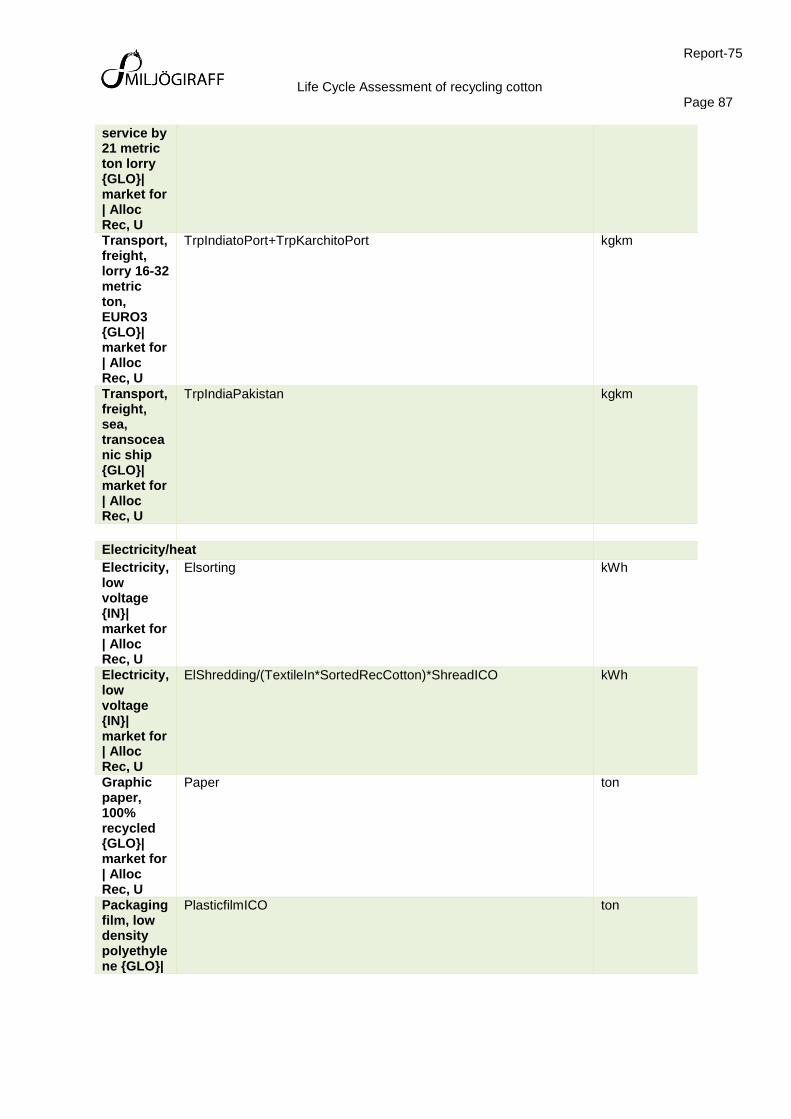
Life Cycle Assessment of recycling cotton
Report-75
Page 87
service by 21 metric ton lorry {GLO}| market for | Alloc Rec, U Transport, freight, lorry 16-32 metric ton, EURO3 {GLO}| market for | Alloc Rec, U
TrpIndiatoPort+TrpKarchitoPort kgkm
Transport, freight, sea, transoceanic ship {GLO}| market for | Alloc Rec, U
TrpIndiaPakistan kgkm
Electricity/heat
Electricity, low voltage {IN}| market for | Alloc Rec, U
Elsorting kWh
Electricity, low voltage {IN}| market for | Alloc Rec, U
ElShredding/(TextileIn*SortedRecCotton)*ShreadICO kWh
Graphic paper, 100% recycled {GLO}| market for | Alloc Rec, U
Paper ton
Packaging film, low density polyethylene {GLO}|
PlasticfilmICO ton

Life Cycle Assessment of recycling cotton
Report-75
Page 88
market for | Alloc Rec, U
Waste to treatment
PET (waste treatment) {GLO}| recycling of PET | Alloc Rec, U
PlasticStrap ton
PE (waste treatment) {GLO}| recycling of PE | Alloc Rec, U
PlasticfilmGods+PlasticfilmICO ton
Steel and iron (waste treatment) {GLO}| recycling of steel and iron | Alloc Rec, U
MetalStrap ton
Core board (waste treatment) {GLO}| recycling of core board | Alloc Rec, U
Cardboard ton
Waste textile, soiled {GLO}| market for | Alloc Rec, U
WasteTextile kg
Paper (waste treatment) {GLO}| recycling of paper |
Paper ton

Life Cycle Assessment of recycling cotton
Report-75
Page 89
Alloc Rec, U
Steel and iron (waste treatment) {GLO}| recycling of steel and iron | Alloc Rec, U
RecSteel kg
Input parameters
ProdVolumeICO2015
3500 tonnes/month 2015 3500 (from collection and sorting)
DistIndiaPakistan
481 km Distance From I:CO in India (Kandla) to Artistic Milliners (AM) in Karachi, Pakistan.
SortedReUse
0,4 Share of incoming textiles that are sorted for ReUse
SortedWaste
0 Share of incoming textiles that are sorted for Waste
DistKandlaGandhiham
40 km Distance From Port Kandla, Gujarat, India to sorting facility in Gandhiham
Elsorting 30000 kWh / month Electricity (for sorting, collection and preparation)
ShreadICO
0 on (1) off (0) if Shredding is done at I:CO or not
DieselForklift
1200 litre

Life Cycle Assessment of recycling cotton
Report-75
Page 90
PlasticStrap
3 ton Plastic strap waste is sold to recycling. I:CO receive it with input.
PlasticfilmGods
3,5 ICO receive 3-4 tons with input material which goes for recycling
MetalStrap
2 ton sold to recycler
Cardboard 3 ton reused for packaging
SoiledClothes
1,5 ton municipal waste
Paper 0,5 ton sold to recycler
DistLocal 40 km transport of purchased consumables. General assumption by Record maker (Marcus)
DistWaste 40 km transport of waste. General assumption by Record maker (Marcus)
DistKarachiAM
30 km Distance From Port in Karachi to Artistic Milliners (AM)
PackagingBags
5 kg /ton fibre packed, could be recycled by the AM for further shredding purposes
AllocationRecCotton
24 % physical of products Cotton fiber
PlasticfilmICO
7,5 ton ICO buy 7-8 tons (HD or LD).
RecCotton 0,4 Share of Sorted Recycle that is for cotton fiber recycling

Life Cycle Assessment of recycling cotton
Report-75
Page 91
ShareFabric
0,5 Share of RecOther that is fabric (ie thick layers).
LubricantsICO
10 litre lubrication oil
Grease 20 kg Grease
CleaningDetergents
300 Litre Cleaning detergents
ElShreddingICO
515 kWh / ton Electricity consumption for shredding fibres at ICO ( 515 Units /tons of fibres produced)
Elperhour 160 Average power consumption - 160 units/ hr
Productionrate
320 Average production - 320 kg/ hr
Calculated parameters
SortedRecycle
1-SortedReUse-SortedWaste Share of TextileIn that is used to recycle.
DieselEnergy
DieselMJLtr*DieselForklift MJ
Consumables
DieselForklift+(PlasticStrap+PlasticfilmGods+PlasticfilmICO+MetalStrap+Cardboard+Paper)*1000+LubricantsICO+Grease+CleaningDetergents
kg Purchased consumables as a total
Waste (PlasticStrap+PlasticfilmGods+PlasticfilmICO+MetalStrap+Cardboard+Paper)*1000+RecSteel+RecFabric
kg Restmaterial as a total
TrpIndiatoPort
DistKandlaGandhiham*TextileIn*SortedRecCotton kgkm of transport by truck for SortedRecCotton
TrpKarchitoPort
DistKarachiAM*TextileIn*SortedRecCotton kgkm of transport by truck for SortedRecCotton
WasteTextile
TextileIn*SortedWaste kg /month 2014 Sept Calculated
AllocationReused
SortedReUse*TextileIn/(TextileIn*SortedReUse+TextileIn*SortedRecCotton)*100
% allocatoed to reuse of clothes

Life Cycle Assessment of recycling cotton
Report-75
Page 92
TrpIndiaPakistan
DistIndiaPakistan*TextileIn*SortedRecCotton kgkm of transport by boat for SortedRecCotton
SortedRecCotton
SortedRecycle*RecCotton Share of TextileIn
SortedRecRest
SortedRecycle*RecOther Share of TextileIn
RecOther 1-RecCotton Share of Sorted Recycle that is not for cotton fiber recycling (ie Zipper, buttons, thick layers).
SortedCheck
SortedReUse+SortedRecCotton+SortedRecRest+SortedWaste Check that all shares is 100%
RecFabric TextileIn*SortedRecRest*ShareFabric kg Amount of RecOther that is fabric (ie thick layers).
RecSteel TextileIn*SortedRecRest*ShareSteel kg Amount of RecOther that is steel (ie Zipper, buttons).
ShareSteel
1-ShareFabric Share of RecOther that is steel (ie Zipper, buttons).
Textil TextileIn kg

Life Cycle Assessment of recycling cotton
Report-75
Page 93
Appendix 10 Transport to I:CO (H&M)
SimaPro 8.1.1.16
process
Project 392 LCA on recycling cotton Date: ########
Time: 15:01
Process
Category type
Material
Process identifier
Miljögir000042634900003
Type Unit process
Process name
Transport to I:CO (H&M)
Status To be reviewed
Time period 2010 and after
Geography Asia, Indian region
Technology Modern technology
Representativeness
Data from a specific process and company
Multiple output allocation
Physical causality
Substitution allocation
Not applicable
Cut off rules Less than 5% (environmental relevance)
Capital goods
Second order (material/energy flows including operations)
Boundary with nature
Not applicable
Infrastructure
No
Date 2015-11-11
Record Marcus Wendin
Generator Chetan Gupta, [email protected], +49 4102 4545-420, I:COLLECT GMBH An der Strusbek 19, 22926 Ahrensburg Germany
External documents
Literature references
I:Collect GmbH
Marcus Wendin
H&M SimaPro Collect format
Analysis 09_38_43 Data on supply of textiles
Collection method
SimaPro Share and Collect + communication via Skype

Life Cycle Assessment of recycling cotton
Report-75
Page 94
Data treatment
Adjustment of existing records to suit a scenario for recycling.
Verification Chetan Gupta date april 2016
Comment The clothes are not stored in the hubs bot only loaded to a new container. The packaging material is included in this set of data. The the clothes are sent from the hub to port. The average distance is guestimated by Generator to 100 km with truck with payload 16-32 ton and emission standard Euro IV.
The ports for shipments to India are Tokyo, Japan Pusan, South Korea Pasir Gudang, Malaysia
The distances are from Searates https://www.searates.com/reference/portdistance/
Allocation rules
Economic and Rec Content "Allocation cut-off by classification" (not allocated to the recycled content ). Attributional perspective.
System description
Miljogiraff
Products
Transport to ICO
TextileIn kg
Avoided products
Resources
Materials/fuels
Transport Store to Hub
TextileIn kg
Transport, freight, sea, transoceanic ship {GLO}| market for | Alloc Rec, U
TrpBoat kgkm
Transport, freight, lorry >32 metric ton, EURO4 {GLO}| market for | Alloc Rec, U
TrpTruck kgkm
Electricity/heat

Life Cycle Assessment of recycling cotton
Report-75
Page 95
Polyethylene terephthalate, granulate, amorphous {GLO}| market for | Alloc Rec, U
PlasticStrap kg
Packaging film, low density polyethylene {GLO}| market for | Alloc Rec, U
Plasticfilm ton
Steel, low-alloyed {GLO}| market for | Alloc Rec, U
MetalStrap ton
Corrugated board box {GLO}| market for corrugated board box | Alloc Rec, U
Cardboard ton
Textile, jute {GLO}| market for | Alloc Rec, U
PackagingBags kg
Input parameters
DistUSIndia 16673 km Distance to Port Kandla in India from supplier country Vancouver and NY
DistGermIndia
12056 km Distance to Port Kandla in India from supplier country Hamburg (not used for H&M project)
DistJapanIndia
10578 km Distance to Port Kandla in India from supplier country Tokyo, Japan
DistRussiaIndia
13487 km Distance to Port Kandla in

Life Cycle Assessment of recycling cotton
Report-75
Page 96
India from supplier country Saint Petersburg, Russia
DistChinaIndia
7896 km Distance to Port Kandla in India from supplier country Hong Kong, China (not used for H&M project)
DistIsraelIndia
5742 km Distance to Port Kandla in India from supplier country Ashdod
DistMalaysiaIndia
5214 km Distance to Port Kandla in India from supplier country Pasir Gudang, Malaysia
DistIndiaPakistan
481 km Distance From I:CO in India (Kandla) to Artistic Milliners (AM) in Karachi, Pakistan.
SortedReUse 0,4 Share of incoming textiles that are sorted for ReUse
SortedWaste 0 Share of incoming textiles that are sorted for Waste
DistKandlaGandhiham
40 km Distance From Port Kandla, Gujarat, India to sorting facility in Gandhiham
Elsorting 30000 kWh / month Electricity (for sorting, collection and preparation)
ElShreddingICO
515 kWh / ton Electricity consumption for shredding fibres ( 515 Units /tons of fibres produced)
ShreadICO 0 on (1) off (0) if Shredding is done at I:CO or not
DieselForklift 1200 litre

Life Cycle Assessment of recycling cotton
Report-75
Page 97
PlasticStrap 3 ton Plastic strap waste is sold to recycling. I:CO receive it with input.
Plasticfilm 3,5 ton
MetalStrap 2 ton sold to recycler
Cardboard 3 ton reused for packaging
SoiledClothes
1,5 ton municipal waste
Paper 0,5 ton sold to recycler
DistKarachiAM
30 km Distance From Port in Karachi to Artistic Milliners (AM)
PackagingBags
5 kg /ton fibre packed, could be recycled by the AM for further shredding purposes
AllocationRecycled
60 % physical of products
DistIndiaKorea
9833 km Distance to Port Kandla in India from supplier country Pusan, South Korea
DisttoPortJP 100 km Distance From hub to port guestimated by Generator ICO
DisttoPortRU 100 km Distance From hub to port guestimated by Generator ICO
DisttoPortIL 100 km Distance From hub to port guestimated by Generator ICO
DisttoPortMY 100 km Distance From hub to port guestimated by Generator ICO
DisttoPortKR 100 km Distance From hub to port guestimated by Generator ICO
DisttoPortUS 100 km Distance From hub to port
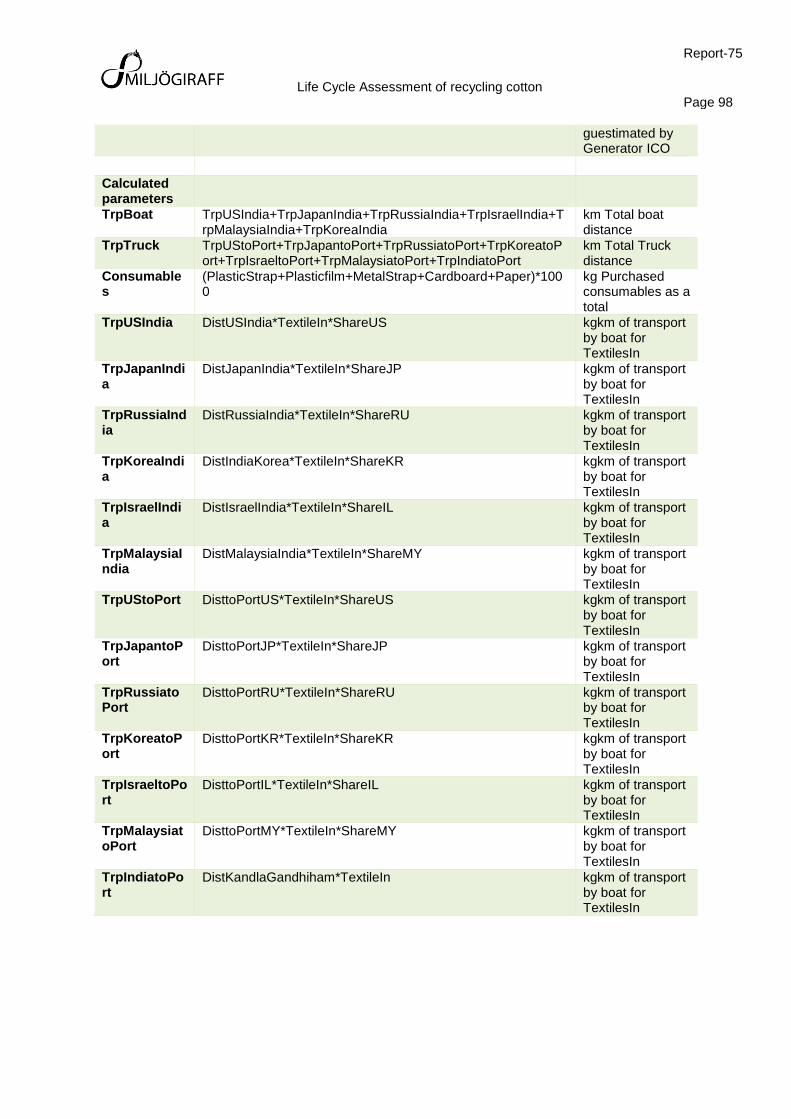
Life Cycle Assessment of recycling cotton
Report-75
Page 98
guestimated by Generator ICO
Calculated parameters
TrpBoat TrpUSIndia+TrpJapanIndia+TrpRussiaIndia+TrpIsraelIndia+TrpMalaysiaIndia+TrpKoreaIndia
km Total boat distance
TrpTruck TrpUStoPort+TrpJapantoPort+TrpRussiatoPort+TrpKoreatoPort+TrpIsraeltoPort+TrpMalaysiatoPort+TrpIndiatoPort
km Total Truck distance
Consumables
(PlasticStrap+Plasticfilm+MetalStrap+Cardboard+Paper)*1000
kg Purchased consumables as a total
TrpUSIndia DistUSIndia*TextileIn*ShareUS kgkm of transport by boat for TextilesIn
TrpJapanIndia
DistJapanIndia*TextileIn*ShareJP kgkm of transport by boat for TextilesIn
TrpRussiaIndia
DistRussiaIndia*TextileIn*ShareRU kgkm of transport by boat for TextilesIn
TrpKoreaIndia
DistIndiaKorea*TextileIn*ShareKR kgkm of transport by boat for TextilesIn
TrpIsraelIndia
DistIsraelIndia*TextileIn*ShareIL kgkm of transport by boat for TextilesIn
TrpMalaysiaIndia
DistMalaysiaIndia*TextileIn*ShareMY kgkm of transport by boat for TextilesIn
TrpUStoPort DisttoPortUS*TextileIn*ShareUS kgkm of transport by boat for TextilesIn
TrpJapantoPort
DisttoPortJP*TextileIn*ShareJP kgkm of transport by boat for TextilesIn
TrpRussiatoPort
DisttoPortRU*TextileIn*ShareRU kgkm of transport by boat for TextilesIn
TrpKoreatoPort
DisttoPortKR*TextileIn*ShareKR kgkm of transport by boat for TextilesIn
TrpIsraeltoPort
DisttoPortIL*TextileIn*ShareIL kgkm of transport by boat for TextilesIn
TrpMalaysiatoPort
DisttoPortMY*TextileIn*ShareMY kgkm of transport by boat for TextilesIn
TrpIndiatoPort
DistKandlaGandhiham*TextileIn kgkm of transport by boat for TextilesIn

Life Cycle Assessment of recycling cotton
Report-75
Page 99
Appendix 11 Transport by DC from Collection Points to Hubs (H&M)
SimaPro 8.1.1.16 process
Project 392 LCA on recycling cotton Date: 2016-06-02
Time: 14:33
Process
Category type Material
Process identifier Miljögir000042634900002
Type Unit process
Process name Transport by DC from Collection Points to Hubs (H&M)
Status To be reviewed
Time period 2010 and after
Geography World
Technology Average technology
Representativeness
Average of all suppliers
Multiple output allocation
Physical causality
Substitution allocation
Not applicable
Cut off rules Less than 1% (environmental relevance)
Capital goods Second order (material/energy flows including operations)
Boundary with nature
Not applicable
Infrastructure No
Date 2015-11-13
Record Marcus Wendin
Generator Erik Karlsson, H&M
Collection method Scenario based on current information, estimation and assumption.
Verification Erik Karlsson, H&M
Comment In this assessment of the environmental impacts of recycling cotton to fibre ready to be new yarn we have based the calculation on existing data from I:CO 2014 in India. In order to make a representative model that is also correct we use existing records from your processes and make adjustements when needed to suit the actual situation. We are following the iso standard for LCA, which means that the source of data and assumptions shall be possible to trace back from the documentation.
Transports of rawmaterial are starting at the collection points at stores. The clothes are packed and sent to hubs with the same transportservice (Distribution Center) that deliver the clothes to the stores. The average mode of transport is estimated by recorder and H&M to be Truck with payload 16-32 ton and emission standard Euro IV. The clothes are not stored in the hubs bot only loaded to a new container.
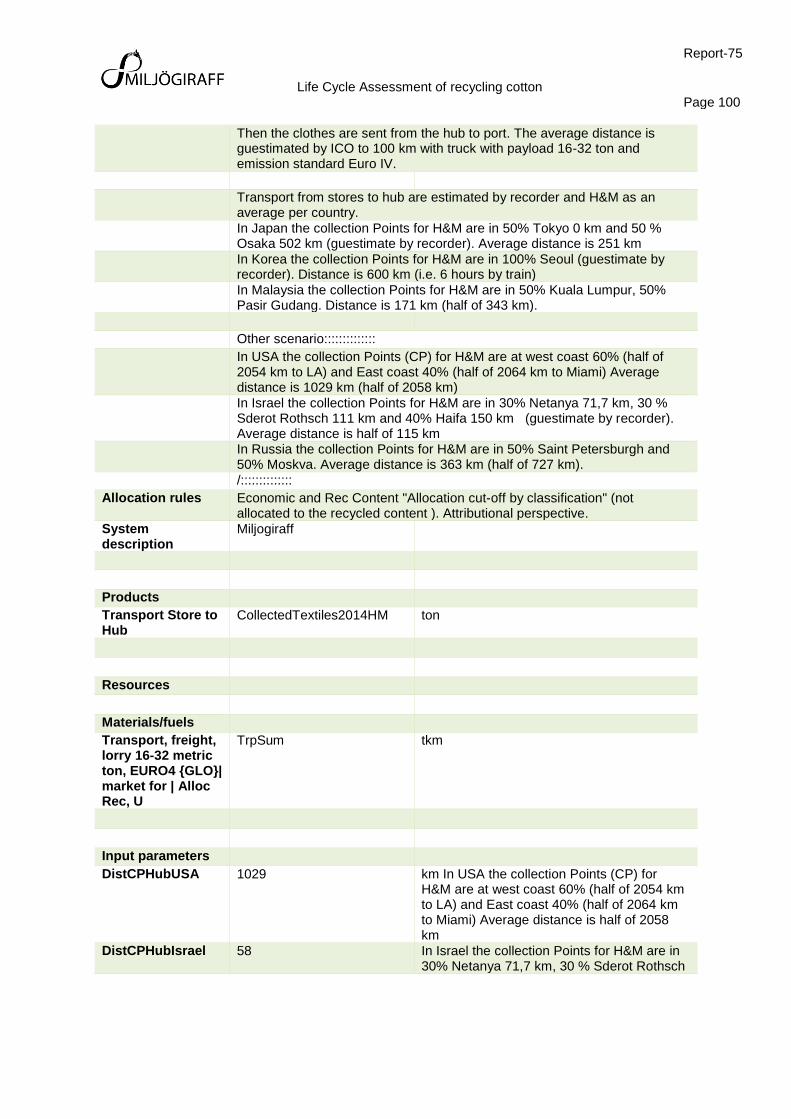
Life Cycle Assessment of recycling cotton
Report-75
Page 100
Then the clothes are sent from the hub to port. The average distance is guestimated by ICO to 100 km with truck with payload 16-32 ton and emission standard Euro IV.
Transport from stores to hub are estimated by recorder and H&M as an average per country. In Japan the collection Points for H&M are in 50% Tokyo 0 km and 50 % Osaka 502 km (guestimate by recorder). Average distance is 251 km In Korea the collection Points for H&M are in 100% Seoul (guestimate by recorder). Distance is 600 km (i.e. 6 hours by train) In Malaysia the collection Points for H&M are in 50% Kuala Lumpur, 50% Pasir Gudang. Distance is 171 km (half of 343 km).
Other scenario:::::::::::::: In USA the collection Points (CP) for H&M are at west coast 60% (half of 2054 km to LA) and East coast 40% (half of 2064 km to Miami) Average distance is 1029 km (half of 2058 km) In Israel the collection Points for H&M are in 30% Netanya 71,7 km, 30 % Sderot Rothsch 111 km and 40% Haifa 150 km (guestimate by recorder). Average distance is half of 115 km In Russia the collection Points for H&M are in 50% Saint Petersburgh and 50% Moskva. Average distance is 363 km (half of 727 km). /::::::::::::::
Allocation rules Economic and Rec Content "Allocation cut-off by classification" (not allocated to the recycled content ). Attributional perspective.
System description
Miljogiraff
Products
Transport Store to Hub
CollectedTextiles2014HM ton
Resources
Materials/fuels
Transport, freight, lorry 16-32 metric ton, EURO4 {GLO}| market for | Alloc Rec, U
TrpSum tkm
Input parameters
DistCPHubUSA 1029 km In USA the collection Points (CP) for H&M are at west coast 60% (half of 2054 km to LA) and East coast 40% (half of 2064 km to Miami) Average distance is half of 2058 km
DistCPHubIsrael 58 In Israel the collection Points for H&M are in 30% Netanya 71,7 km, 30 % Sderot Rothsch

Life Cycle Assessment of recycling cotton
Report-75
Page 101
111 km and 40% Haifa 150 km (guestimate by recorder). Average distance is half of 115 km
DistCPHubJapan 251 In Japan the collection Points for H&M are in 50% Tokyo 0 km and 50 % Osaka 502 km (guestimate by recorder). Average distance is 251 km
DistCPHubRussia 363 In Russia the collection Points for H&M are in 50% Saint Petersburgh and 50% Moskva. Average distance is 363 km (half of 727 km).
DistCPHubKorea 600 In Korea the collection Points for H&M are in 100% Seoul (guestimate by recorder). Distance is 600 km (i.e. 6 hours by train)
DistCPHubMalaysia
171 In Malaysia the collection Points for H&M are in 50% Kuala Lumpur, 50% Pasir Gudang. Distance is 171 km (half of 343 km).
CollectedTextiles2014HM
80 ton Collected Textiles 2014 by HM for the rec project according to Chetan I:CO
Calculated parameters
ShareCheck ShareJP+ShareUS+ShareRU+ShareMY+ShareIL+ShareKR+ShareIn
ok
TrpCPHubUSA DistCPHubUSA*ShareUS*CollectedTextiles2014HM
tonkm
TrpCPHubIsrael DistCPHubIsrael*ShareIL*CollectedTextiles2014HM
tonkm
TrpCPHubJapan DistCPHubJapan*ShareJP*CollectedTextiles2014HM
tonkm
TrpCPHubRussia DistCPHubRussia*ShareRU*CollectedTextiles2014HM
tonkm
TrpCPHubKorea DistCPHubKorea*ShareKR*CollectedTextiles2014HM
tonkm
TrpCPHubMalaysia
DistCPHubMalaysia*ShareMY*CollectedTextiles2014HM
tonkm
TrpSum TrpCPHubUSA+TrpCPHubIsrael+TrpCPHubJapan+TrpCPHubRussia+TrpCPHubKorea+TrpCPHubMalaysia
tonkm

Life Cycle Assessment of recycling cotton
Report-75
Page 102
Appendix 12 IPCC on GWP in relation to GHG and GWP
IPCC The characterisation factors per substance are identical to the IPCC 2007 GWP (100a) method in SimaPro. The only difference is that carbon uptake and biogenic carbon emissions are included in this method and that a distinction is made between: 1 Fossil based carbon (carbon originating from fossil fuels) 1 Biogenic carbon (carbon originating from biogenic sources such as plants and trees) 1 Carbon from Land transformation (direct impacts) -1 Carbon uptake (CO2 that is stored in plants and trees as they grow) The draft standards require fossil and biogenic carbon to be report separately. Reporting of carbon caused by direct land use change is currently defined as optional, depending on the product category while reporting of carbon uptake is not required. GHG Companies shall quantify and report the following: • Total inventory results in CO2 e per unit of analysis, which includes all emissions and removals included in the boundary from biogenic sources, non-biogenic sources, and land-use change impacts Removals from the atmosphere typically occur when CO2 is absorbed by biogenic sources (i.e. plants) and converted to energy during photosynthesis. However, removals may also occur when a product absorbs atmospheric CO2 during use, or when CO2 from the atmosphere is used during a processing step. The amount of removal calculated for materials of biogenic origin should only reflect the amount of carbon contained, or embedded, in that material. For example, if a product requires 50 tons of wood input that is 50 percent carbon, 25 tons of carbon removal is assumed. To convert carbon to CO2 , the tons of carbon are multiplied by the ratio of molecular weights of CO2 (44) and carbon (12), respectively.

Life Cycle Assessment of recycling cotton
Report-75
Page 103
Appendix 13 System expansion of the LCA model (suggestion)
FU: 400 (example) times use 1000 kg product of virgin and recycled cotton.
Process GWP Virgin Recycled difference Virgin Recycled difference
cultivation 418 2 1 1 836 418 418
manufacturing 2 2 0 0 0 0
sale 2 2 0 0 0 0
200 days of use 2 2 0 0 0 0
Transport 411 0 1 -1 0 411 -411
recycling 50 0 1 -1 0 50 -50
combustion 1540 2 1 1 3080 1540 1540
Total 3916 2419 1497
Recycling potential 38% Another LCA model is system expansion, comparing 400 (example) times use jeans of virgin and recycled cotton. The example is assuming that the jeans are used 200 times before disposed of either direct to incineration or to recycling for one extra life before incineration. It would result in half as much cultivation and incineration and one extra process of transport and recycling. Adding the GWP (in a rough manner) indicate that the potential contribution of recycling in one extra loop, is 38% lower climate impact. In this comparison recycled cotton replaces 100 % of virgin fibre. Currently that figure is only 10% so that is of course an important factor to include in the model. The number of lifecycles would also lower the environmental impact of recycled cotton dramatically.

Life Cycle Assessment of recycling cotton
Report-75
Page 104
Appendix 14 Data on supply of textiles (Gupta, Analysis 09_38_43, 2014).
Year: 2014
8 097 305,50 Country Weight % von gesamt HM rec cotton Share
DE 1 331 491,95 16,44% FR 740 961,52 9,15% ES 594 305,17 7,34% JP 592 756,38 7,32% 592 756,38 0,891141358
CN 486 468,68 6,01% IT 473 184,62 5,84% NL 444 882,56 5,49% CH 438 278,85 5,41% BE 327 743,25 4,05% GB 323 782,50 4,00% SE 244 234,68 3,02% US 236 260,28 2,92% 0,00 0
DK 234 200,87 2,89% RU 224 288,27 2,77% 0,00 0
AT 197 031,62 2,43% HR 149 593,34 1,85% FI 119 480,78 1,48% BG 104 820,00 1,29% GR 103 620,00 1,28% NO 89 719,83 1,11% CA 86 677,45 1,07% PT 86 543,05 1,07% HU 76 927,50 0,95% MY 62 267,00 0,77% 62 267,00 0,093611306
SI 59 888,19 0,74% IL 48 360,00 0,60% 0,00 0
PL 37 891,21 0,47% LV 37 720,64 0,47% HK 25 041,00 0,31% EE 21 113,53 0,26% LT 20 945,82 0,26% IE 13 920,00 0,17% RO 11 660,42 0,14% KR 10 142,00 0,13% 10 142,00 0,015247336
LU 10 039,00 0,12% TR 9 124,00 0,11% SK 7 905,00 0,10% SG 7 074,00 0,09%

Life Cycle Assessment of recycling cotton
Report-75
Page 105
CZ 6 528,54 0,08% TH 432,00 0,01% Sum 8 097 305,50 665165,38

Life Cycle Assessment of recycling cotton
Report-75
Page 106
Appendix 15 Flow diagram of ReCiPe10 (Single score) for 1 kg recycled cotton fibre.
In the diagram the arrow thickness correspond to the environmental load. Normalisation is less subjective than weighting as single score, but it has the pattern is the same in this case. To the left is the results as a sum in percent and in points not summed to the right

Life Cycle Assessment of recycling cotton
Report-75
Page 107
Appendix 16 Flow diagram of GWP for rec cotton.
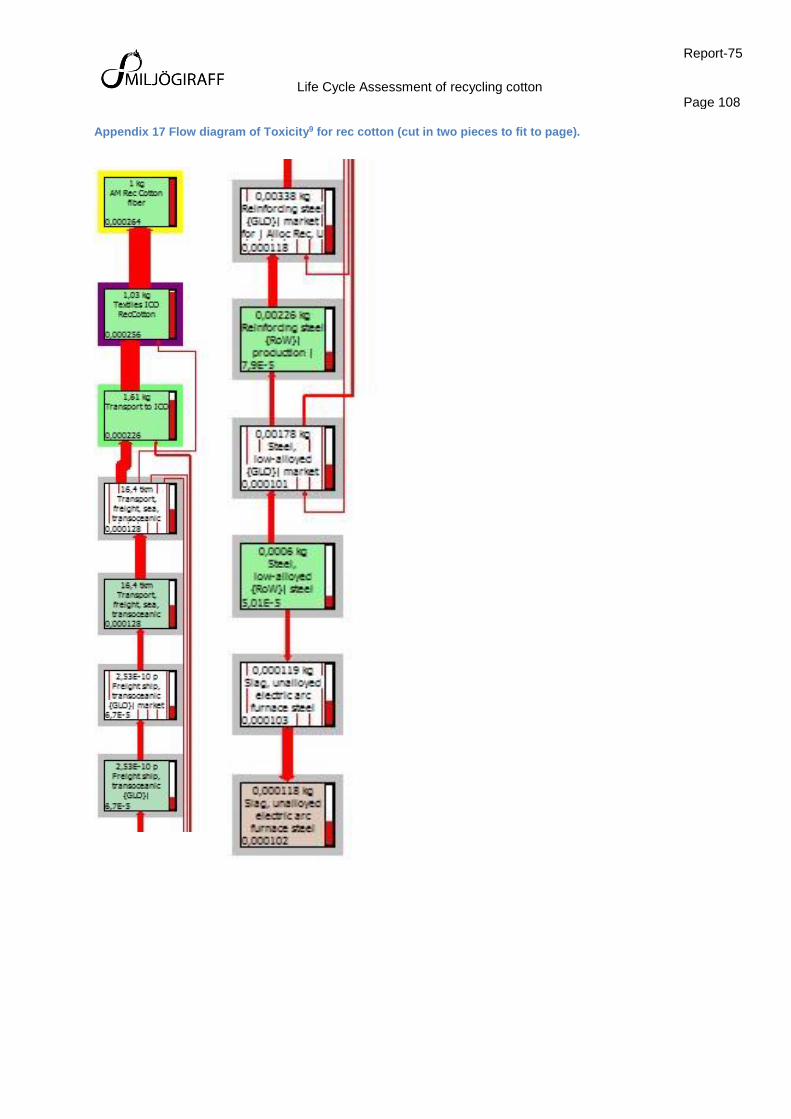
Life Cycle Assessment of recycling cotton
Report-75
Page 108
Appendix 17 Flow diagram of Toxicity9 for rec cotton (cut in two pieces to fit to page).

Life Cycle Assessment of recycling cotton
Report-75
Page 109
Appendix 18 Process contribution with ReCiPe Endpoint (H) V1.12 / World ReCiPe H/A / Normalisation.
LCI data Points of environmental impact
Transport, freight, sea, transoceanic ship {GLO}| processing | Alloc Rec, U
3,85E-05
Transport, freight, lorry 16-32 metric ton, EURO4 {RoW}| transport, freight, lorry 16-32 metric ton, EURO4 | Alloc Rec, U
6,97E-06
Municipal waste collection service by 21 metric ton lorry {RoW}| processing | Alloc Rec, U
3,64E-06
Transport, freight, lorry 16-32 metric ton, EURO4 {RER}| transport, freight, lorry 16-32 metric ton, EURO4 | Alloc Rec, U
2,83E-06
AM Electricity 2014 2,57E-06
Waste textile, soiled {RoW}| treatment of, municipal incineration | Alloc Rec, U
2,54E-06
Brake wear emissions, lorry {RoW}| treatment of | Alloc Rec, U 1,74E-06
Electricity, high voltage {CN}| electricity production, hard coal | Alloc Rec, U
1,46E-06
Electricity, high voltage {IN}| electricity production, hard coal | Alloc Rec, U
1,33E-06
Transport, freight, lorry >32 metric ton, EURO4 {RoW}| transport, freight, lorry >32 metric ton, EURO4 | Alloc Rec, U
1,06E-06
Heat, district or industrial, other than natural gas {RoW}| refinery gas, burned in furnace | Alloc Rec, U
9,69E-07
Waste natural gas, sour {GLO}| treatment of, burned in production flare | Alloc Rec, U
8,74E-07
Remaining processes 2,22E-05

Life Cycle Assessment of recycling cotton
Report-75
Page 110
Appendix 19 Global Warming Potential of 1 kg recycled cotton fibre in kg CO2 eq. per Process.
Process (LCI data) kg CO2 eq
Transport, freight, sea, transoceanic ship {GLO}| processing | Alloc Rec, U 0,129
Transport, freight, lorry 16-32 metric ton, EURO4 {RoW}| transport, freight, lorry 16-32 metric ton, EURO4 | Alloc Rec, U
0,0336
Municipal waste collection service by 21 metric ton lorry {RoW}| processing | Alloc Rec, U
0,0249
AM Electricity 2014 0,0229
Waste textile, soiled {RoW}| treatment of, municipal incineration | Alloc Rec, U 0,0195
Transport, freight, lorry 16-32 metric ton, EURO4 {RER}| transport, freight, lorry 16-32 metric ton, EURO4 | Alloc Rec, U
0,0136
Electricity, high voltage {IN}| electricity production, hard coal | Alloc Rec, U 0,0089
Transport, freight, lorry >32 metric ton, EURO4 {RoW}| transport, freight, lorry >32 metric ton, EURO4 | Alloc Rec, U
0,0087
Electricity, high voltage {CN}| electricity production, hard coal | Alloc Rec, U 0,0073
Heat, district or industrial, other than natural gas {RoW}| refinery gas, burned in furnace | Alloc Rec, U
0,0069
Waste natural gas, sweet {GLO}| treatment of, burned in production flare | Alloc Rec, U
0,0043
Hard coal {CN}| mine operation | Alloc Rec, U 0,0042
Natural gas, vented {GLO}| natural gas venting from petroleum/natural gas production | Alloc Rec, U
0,004
Remaining processes 0,0925

Life Cycle Assessment of recycling cotton
Report-75
Page 111
Appendix 20 Environmental overall Impact of 1 kg AM Rec Cotton fiber analysed with ReCiPe Midpoint (H) V1.12 / World Recipe H
Impact category Unit Total per 1 kg cotton fibre
Climate change kg CO2 eq 0,38
Ozone depletion kg CFC-11 eq 0,00000005
Terrestrial acidification kg SO2 eq 0,004
Freshwater eutrophication kg P eq 0,00003
Marine eutrophication kg N eq 0,00017
Human toxicity kg 1,4-DB eq 0,06
Photochemical oxidant formation
kg NMVOC 0,004
Particulate matter formation kg PM10 eq 0,002
Terrestrial ecotoxicity kg 1,4-DB eq 0,0001
Freshwater ecotoxicity kg 1,4-DB eq 0,002
Marine ecotoxicity kg 1,4-DB eq 0,003
Ionising radiation kBq U235 eq 0,03
Agricultural land occupation m2a 0,00
Urban land occupation m2a 0,01
Natural land transformation m2 0,0001
Water depletion m3 0,001
Metal depletion kg Fe eq 0,01
Fossil depletion kg oil eq 0,13
Impact category Unit
Climate change kg CO2 eq
Ozone depletion kg CFC-11 eq
Terrestrial acidification kg SO2 eq
Freshwater eutrophication kg P eq
Marine eutrophication kg N eq
Human toxicity kg 1,4-DB eq
Photochemical oxidant formation
kg NMVOC
Particulate matter formation kg PM10 eq
Terrestrial ecotoxicity kg 1,4-DB eq
Freshwater ecotoxicity kg 1,4-DB eq
Marine ecotoxicity kg 1,4-DB eq
Ionising radiation kBq U235 eq
Agricultural land occupation m2a
Urban land occupation m2a
Natural land transformation m2
Water depletion m3
Metal depletion kg Fe eq

Life Cycle Assessment of recycling cotton
Report-75
Page 112
Fossil depletion kg oil eq

Life Cycle Assessment of recycling cotton
Report-75
Page 113
Appendix 21 Environmental overall Impact of 1 kg AM Rec Cotton fiber analysed with CML-IA baseline V3.03 / World 2000 Appendix 22 Water Footprint of 1 kg AM Rec Cotton fiber analysed with Hoekstra et al 2012 (Water Scarcity) V1.02
Process LCI data m3
Heavy fuel oil {RoW}| petroleum refinery operation | Alloc Rec, U 0,0003
Water, decarbonised, at user {RoW}| water production and supply, decarbonised | Alloc Rec, U
0,0002
Diesel {RoW}| petroleum refinery operation | Alloc Rec, U 0,0002
Oxygen, liquid {RoW}| air separation, cryogenic | Alloc Rec, U 7,97E-05
Electricity, high voltage {IN}| electricity production, hydro, reservoir, alpine region | Alloc Rec, U
7,75E-05
Remaining processes 0,0005
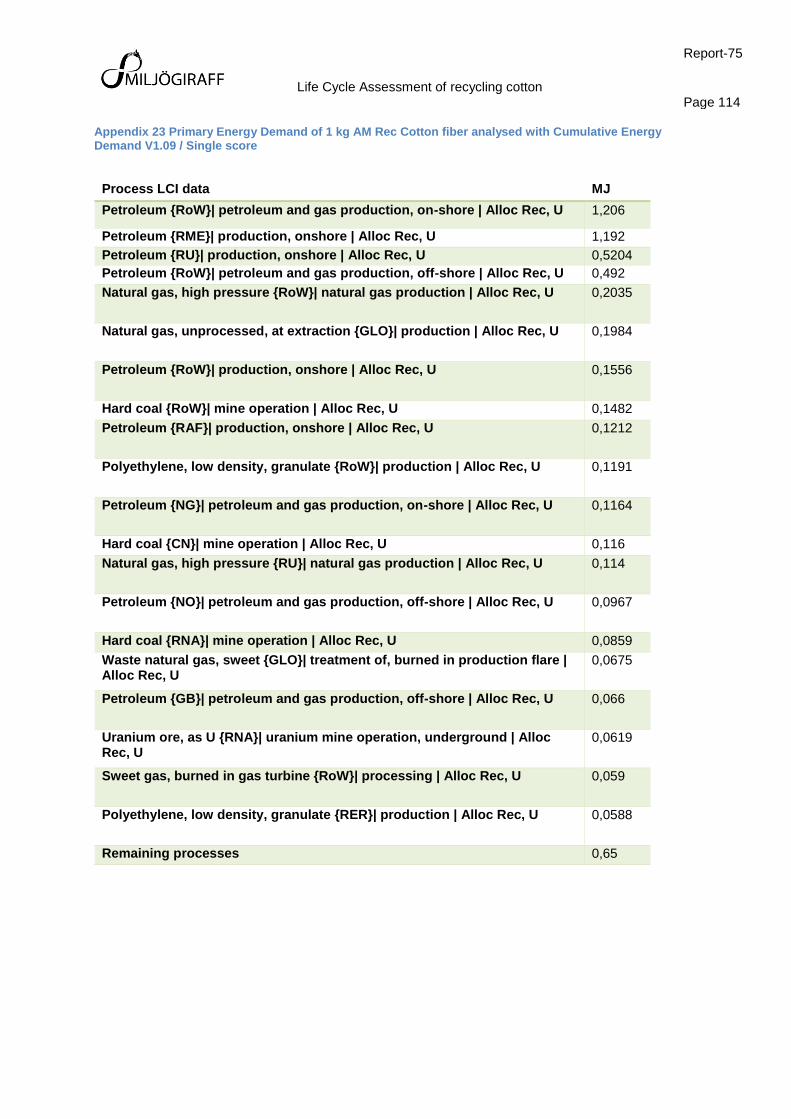
Life Cycle Assessment of recycling cotton
Report-75
Page 114
Appendix 23 Primary Energy Demand of 1 kg AM Rec Cotton fiber analysed with Cumulative Energy Demand V1.09 / Single score
Process LCI data MJ
Petroleum {RoW}| petroleum and gas production, on-shore | Alloc Rec, U 1,206
Petroleum {RME}| production, onshore | Alloc Rec, U 1,192
Petroleum {RU}| production, onshore | Alloc Rec, U 0,5204
Petroleum {RoW}| petroleum and gas production, off-shore | Alloc Rec, U 0,492
Natural gas, high pressure {RoW}| natural gas production | Alloc Rec, U 0,2035
Natural gas, unprocessed, at extraction {GLO}| production | Alloc Rec, U 0,1984
Petroleum {RoW}| production, onshore | Alloc Rec, U 0,1556
Hard coal {RoW}| mine operation | Alloc Rec, U 0,1482
Petroleum {RAF}| production, onshore | Alloc Rec, U 0,1212
Polyethylene, low density, granulate {RoW}| production | Alloc Rec, U 0,1191
Petroleum {NG}| petroleum and gas production, on-shore | Alloc Rec, U 0,1164
Hard coal {CN}| mine operation | Alloc Rec, U 0,116
Natural gas, high pressure {RU}| natural gas production | Alloc Rec, U 0,114
Petroleum {NO}| petroleum and gas production, off-shore | Alloc Rec, U 0,0967
Hard coal {RNA}| mine operation | Alloc Rec, U 0,0859
Waste natural gas, sweet {GLO}| treatment of, burned in production flare | Alloc Rec, U
0,0675
Petroleum {GB}| petroleum and gas production, off-shore | Alloc Rec, U 0,066
Uranium ore, as U {RNA}| uranium mine operation, underground | Alloc Rec, U
0,0619
Sweet gas, burned in gas turbine {RoW}| processing | Alloc Rec, U 0,059
Polyethylene, low density, granulate {RER}| production | Alloc Rec, U 0,0588
Remaining processes 0,65

Life Cycle Assessment of recycling cotton
Report-75
Page 115
Appendix 24 Primary Energy Demand of 1 kg AM Rec Cotton fiber analysed with Cumulative Energy Demand V1.09 /Characterisation
Impact category Unit Total Top Sea transport
Land transport
Shredding Sorting
Non renewable, fossil
MJ 5,57 0,06 3,11 1,08 0,52 0,80
Non-renewable, nuclear
MJ 0,1774 0,0011 0,1358 0,0164 0,0011 0,0230
Non-renewable, biomass
MJ 0,0012 0,0000003 0,00008 0,00003 0,0000003 0,00115
Renewable, biomass
MJ 0,0336 0,0003 0,0193 0,0060 0,00011 0,0079
Renewable, wind, solar, geothe
MJ 0,0107 0,00007 0,0084 0,0010 0,00007 0,0011
Renewable, water MJ 0,0541 0,0004 0,0394 0,0057 0,0004 0,0082
Appendix 25 Ozone Depletion of 1 kg AM Rec Cotton fiber analysed with ReCiPe Midpoint (H) V1.12 / World Recipe H / Characterisation
Process LCI data kg CFC-11 eq
Petroleum {RoW}| petroleum and gas production, on-shore | Alloc Rec, U
1,84E-08
Petroleum {RME}| production, onshore | Alloc Rec, U 1,82E-08
Petroleum {RU}| production, onshore | Alloc Rec, U 7,78E-09
Remaining processes 1,04E-08
Appendix 26 Terrestrial acidification in kg SO2 eq. of 1 kg AM Rec Cotton fiber analysed with ReCiPe Midpoint (H) V1.12 / World Recipe H / Characterisation
Process LCI data kg SO2 eq
Transport, freight, sea, transoceanic ship {GLO}| processing | Alloc Rec, U 0,0033
Waste natural gas, sour {GLO}| treatment of, burned in production flare | Alloc Rec, U
0,0001
Municipal waste collection service by 21 metric ton lorry {RoW}| processing | Alloc Rec, U
0,0001
Natural gas, high pressure {RoW}| natural gas production | Alloc Rec, U 9,08E-05
Transport, freight, lorry 16-32 metric ton, EURO4 {RoW}| transport, freight, lorry 16-32 metric ton, EURO4 | Alloc Rec, U
8,79E-05
Electricity, high voltage {CN}| electricity production, hard coal | Alloc Rec, U 7,69E-05
Electricity, high voltage {IN}| electricity production, hard coal | Alloc Rec, U 5,87E-05
Waste textile, soiled {RoW}| treatment of, municipal incineration | Alloc Rec, U 5,76E-05
Remaining processes 0,0006

Life Cycle Assessment of recycling cotton
Report-75
Page 116
Appendix 27 Eutrophication of 1 kg AM Rec Cotton fibre analysed with ReCiPe Midpoint (H) V1.12 / World Recipe H / Characterisation
Process LCI data kg P eq
Spoil from hard coal mining {GLO}| treatment of, in surface landfill | Alloc Rec, U
1,73E-05
Spoil from lignite mining {GLO}| treatment of, in surface landfill | Alloc Rec, U
1,07E-05
Sulfidic tailing, off-site {GLO}| treatment of | Alloc Rec, U 3,81E-06
Basic oxygen furnace waste {RoW}| treatment of, residual material landfill | Alloc Rec, U
8,35E-07
Remaining processes 7,0E-07
Appendix 28 Photochemical oxidant formation kg NMVOC 1 kg AM Rec Cotton fibre analysed with ReCiPe Midpoint (H) V1.12 / World Recipe H / Characterisation
Process LCI data kg NMVOC
Transport, freight, sea, transoceanic ship {GLO}| processing | Alloc Rec, U
0,0025
Municipal waste collection service by 21 metric ton lorry {RoW}| processing | Alloc Rec, U
0,0003
Transport, freight, lorry 16-32 metric ton, EURO4 {RoW}| transport, freight, lorry 16-32 metric ton, EURO4 | Alloc Rec, U
0,0002
Waste textile, soiled {RoW}| treatment of, municipal incineration | Alloc Rec, U
9,36E-05
Transport, freight, lorry 16-32 metric ton, EURO4 {RER}| transport, freight, lorry 16-32 metric ton, EURO4 | Alloc Rec, U
6,49E-05
Natural gas, vented {GLO}| natural gas venting from petroleum/natural gas production | Alloc Rec, U
6,18E-05
AM Electricity 2014 5,78E-05
Diesel, burned in building machine {GLO}| processing | Alloc Rec, U 5,27E-05
Diesel, burned in diesel-electric generating set {GLO}| processing | Alloc Rec, U
3,96E-05
Remaining processes 0,0005

Life Cycle Assessment of recycling cotton
Report-75
Page 117
Appendix 29 Human toxicity, cancer / 1 kg recycled cotton fibre, analysed with USEtox (recommended + interim) V1.04
Process LCI fdata CTUh
Slag, unalloyed electric arc furnace steel {RoW}| treatment of, residual material landfill | Alloc Rec, U
3,31E-09
Spoil from hard coal mining {GLO}| treatment of, in surface landfill | Alloc Rec, U
1,26E-09
Basic oxygen furnace waste {RoW}| treatment of, residual material landfill | Alloc Rec, U
1,17E-09
Spoil from lignite mining {GLO}| treatment of, in surface landfill | Alloc Rec, U 6,54E-10
Sludge from steel rolling {RoW}| treatment of, residual material landfill | Alloc Rec, U
6,11E-10
Remaining processes 1,58E-09
Appendix 30 Human toxicity, non-cancer / 1 kg recycled cotton fibre, analysed with USEtox (recommended + interim) V1.04
Process LCI data CTUh
Tyre wear emissions, lorry {RoW}| treatment of | Alloc Rec, U 6,15E-09
Sulfidic tailing, off-site {GLO}| treatment of | Alloc Rec, U 6,08E-09
Brake wear emissions, lorry {RoW}| treatment of | Alloc Rec, U 4,64E-09
Spoil from hard coal mining {GLO}| treatment of, in surface landfill | Alloc Rec, U
3,56E-09
Zinc in car shredder residue {RoW}| treatment of, municipal incineration | Alloc Rec, U
3,06E-09
Tyre wear emissions, lorry {RER}| treatment of | Alloc Rec, U 2,5E-09
Remaining processes 2,15E-08
Appendix 31 Freshwater ecotoxicity/ 1 kg recycled cotton fibre, analysed with USEtox (recommended + interim) V1.04
Process LCI data CTUe
Scrap steel {RoW}| treatment of scrap steel, municipal incineration | Alloc Rec, U
0,2246
Scrap copper {RoW}| treatment of, municipal incineration | Alloc Rec, U 0,1672
Sulfidic tailing, off-site {GLO}| treatment of | Alloc Rec, U 0,1446
Spoil from hard coal mining {GLO}| treatment of, in surface landfill | Alloc Rec, U
0,1103
Waste textile, soiled {RoW}| treatment of, municipal incineration | Alloc Rec, U 0,1064
Zinc in car shredder residue {RoW}| treatment of, municipal incineration | Alloc Rec, U
0,0916
Remaining processes 0,3924