lbos and innovation: the french case - accueil · lbos and innovation: the french case anne-laure...
TRANSCRIPT

HAL Id: halshs-00669910https://halshs.archives-ouvertes.fr/halshs-00669910
Submitted on 14 Feb 2012
HAL is a multi-disciplinary open accessarchive for the deposit and dissemination of sci-entific research documents, whether they are pub-lished or not. The documents may come fromteaching and research institutions in France orabroad, or from public or private research centers.
L’archive ouverte pluridisciplinaire HAL, estdestinée au dépôt et à la diffusion de documentsscientifiques de niveau recherche, publiés ou non,émanant des établissements d’enseignement et derecherche français ou étrangers, des laboratoirespublics ou privés.
LBOs and innovation: the French caseAnne-Laure Le Nadant, Frédéric Perdreau
To cite this version:Anne-Laure Le Nadant, Frédéric Perdreau. LBOs and innovation: the French case. RENT conference,Nov 2011, Bodo, Norway. 2011. <halshs-00669910>

LBOs and innovation: the French case
Anne-Laure Le Nadant
CREM UMR CNRS 6211
Université de Caen Basse-Normandie
19 rue Claude Bloch
14000 Caen
Tel : 02 31 56 57 63 / Fax : 02 31 93 61 94
Email : [email protected]
Frédéric Perdreau
COACTIS EA 41 61
Université de Saint-Etienne
28 avenue Léon Jouhaux
42023 Saint-Etienne Cedex 2
Tel : 06 67 32 85 50
Email : [email protected]
Abstract: A long-standing controversy is whether LBOs generate economic efficiencies through
a superior governance framework, or whether LBO funds are driven by short-term profit motives
and sacrifice long-term growth to boost short-term performance. Using a propensity score
methodology, this paper provides an empirical analysis of the innovative efforts of a sample of 89
French manufacturing firms that underwent a buyout between 2001 and 2005. The matching
estimates (average treatment on the treated, ATT) of the effect of LBOs on firm level of
innovation expenditures in 2006 show no significant differences between LBO targets and
comparable companies that did not go through an LBO. In contrast, we find significant effects of
LBOs on both service innovation and marketing innovations in design and packaging and product
promotion.
Keywords: Buyouts, Innovation, Private Equity Firms.
2
1. Introduction
Innovation is an essential preoccupation for a firm as it affects its competitiveness. A long-
standing controversy is whether LBOs generate economic efficiencies through a superior
governance framework, or whether LBO funds are driven by short-term profit motives and
sacrifice long-term growth to boost short-term performance.
LBOs involve investments in which investors and a management team pool their own money
(together with debt finance) to buy shares in a target company from its current owners
(Meuleman et al., 2009). Although the change in governance resulting from LBOs is generally
found to exert a positive impact on firm‟s economic and financial performance (Cumming et al.,
2007), these transactions have mainly been associated with cost-cutting activities and short-
termism, to the detriment of innovation and Research and Development (R&D) investments.
However, in a recent study, Boucly et al. (2011) show that, instead of reinforcing credit
constraints, as was the case in the 1980s transactions, today‟s LBOs can alleviate them.
Whether LBOs have an impact on innovation is not clear, a priori. Both positive and negative
effects are likely to occur. After an LBO, technological matters may be delayed or set aside
because managers may be more oriented to day to day operations resulting from the transaction
(Hitt et al., 1996) or because private equity firms exert pressure on management to focus on
investment opportunities that are less uncertain and more rewarding in the short term (Ughetto,
2010).
Alternatively, LBOs may foster entrepreneurial initiatives, enabling managers to better and more
thoroughly exploit firm resources for new innovation projects (Wright, Hoskisson and Busenitz,
2001). There are two reasons for this. First, private equity-backed buyouts can make use of the
private equity firm's extensive network and relationships: customers, suppliers, other investors,
access to more sophisticated resources in banking, legal and other areas, etc. Second, the private
equity firm's expertise and competencies with regard to strategy, operational and financial
management, human resources, marketing policy, and mergers and acquisitions, also help create
value for the target firm (Lee et al., 2001; Wright, Hoskisson, Busenitz, and Dial, 2001). Inside
management does not always own the tacit knowledge and idiosyncratic skills required to seize
new opportunities (Hendry, 2002). If major innovation is required, it may be necessary to
introduce outside managers who do own these skills (Wright, Hoskisson, and Busenitz, 2001). In
this situation, the private equity firm plays an important role in assessing the skills of the
incumbent managers and their potential replacements (Meuleman et al., 2009).
Evidence regarding the impact of LBOs on investment in innovation and R&D is so far limited
and rather mixed. Some studies show a decline in R&D spending (Long and Ravenscraft, 1993)
whereas others find no decline (Lichtenberg and Siegel, 1990) or stability (Smith, 1990) of
research spending after the LBO. However, as most firms involved in LBOs do not belong to
technology-intensive industries, the impact of LBOs on cumulative innovation is likely slight
(Hall, 1990).
In industries where R&D requirements are more crucial, these expenditures are used more
3
effectively. Zahra (1995) finds, on a sample of 47 LBOs, that firms involved develop more new
products and intensify their efforts in terms of innovation and productivity (even if at the same
time the level of R&D expenditure doesn‟t change). Wright et al. (2001) provide several
examples of buyouts in technology-based industries followed by significant increases in product
and technology development, R&D and patenting. Malone (1989) and Wright, Thompson and
Robbie (1992) also cite evidence of new product innovation following buyouts.
More recently, Lerner et al. (2011) investigate 472 LBOs with a focus on investments in
innovation as measured by patenting activity. They find no evidence that LBOs are associated
with a decrease in these activities. Contrary to the frequent argument that private equity firms
have short-term horizon and little incentive to favor long-term investment opportunities of target
companies, this study shows that LBOs lead in fact to significant increases in long-term
innovation. The authors find that patents granted to firms involved in LBOs are more cited (a
proxy for economic importance) and show no significant shifts in the fundamental nature of the
research. Hence, if some US and UK based studies show a decline in investment expenditure
after LBOs, critical investments in R&D seem to be maintained. Ughetto (2010) has focused on
innovation of Western European manufacturing firms undergoing an LBO. She finds that
innovation activity of portfolio firms (measured by the number of patents granted) is affected by
different types of investors, pursuing different objectives.
There are a several reasons to revisit the questions in the previous studies. First, the private equity
industry is more substantial today than it was in the 1980s. Changes in the industry–such as the
increased competition between and greater operational orientation of private equity firms–suggest
that the earlier relationships may no longer hold. Second, transactions involving technology-
intensive industries have become more common recently and it is also desirable to look beyond
public-to-private transactions, since these transactions represent a fairly small fraction of the
private equity universe. Third, the innovation surveys conducted in the last two decades have
substantially enhanced our ability to measure and study the impact on innovation. Fourth, nearly
all studies on LBOs and innovation have concentrated on the US and the UK (the only exception
we are aware of is the study of Western Europe by Ughetto (2010)). By shifting the focus to
France and following Boucly et al. (2011), this paper investigates the possibility that some LBOs
aim to seize innovation opportunities and expand the scale and scope of the target‟s activities.
France is an interesting context to study LBOs and innovation because it is a country with many
family-managed firms that tend to be, on average, smaller than non family firms and for which
access to external finance may be more difficult than in the US or the UK.
The remainder of the paper is as follows. In Section 2, we describe the construction of the
sample. Section 3 reviews the methodology employed in the study. We present the empirical
analyses in Section 4. The final section concludes the paper and discusses future work.
2. Dataset
To analyze the impact of LBOs on innovation at the company level, we use a new database built
from three different databases: Capital IQ (to isolate transactions), CIS 2006 (for innovation data)
and DIANE (for financial statements). To our knowledge, this is the first study to use a CIS
survey (Community Innovation Survey) in relation with LBOs. Community Innovation Surveys
4
are conducted at regular intervals in Europe. Questions are based on the Oslo Manual guidelines,
which distinguishes four types of innovations: product innovations, process innovations,
organizational innovations and marketing innovations. The Oslo Manual opted for collecting data
at the firm level, including all its innovation outputs and activities, which is also the level of
available accounting and financial data that can be merged with the innovation data for richer
analyses. CIS 2006 was launched in 2007, based on the reference period 2006, with the
observation period 2004 to 2006. The population of the CIS is determined by the size of the
enterprise and its principal activity. All enterprises with 20 or more employees in any of the
specified sectors were included in the statistical population. The following industries were
included in the population of the CIS 2006: mining and quarrying (NACE 10-14), manufacturing
(NACE 15-37), electricity, gas and water supply (NACE 40-41). Three reference periods were
used in the questionnaire:
The first relates to a set of questions for the whole of the period 2004-2006, for example
whether the enterprise introduced an innovation at any time during this three-year period.
The second set of questions refers uniquely to the reference year 2006, for example,
indicators such as innovation expenditure.
Finally, a limited number of basic economic indicators were requested for both 2004 and
2006, for example the turnover and employment figures.
We first identify 944 French deals over 2001-2005 reported as being “LBOs” from Capital IQ.
More precisely, we retrieve all the deals from Capital IQ with the following characteristics: (i)
they are announced between 2001 and 2005 (ii) either “closed” or “effective” (iii) reported by
Capital IQ as being “LBOs”. Most of the targets are medium sized, privately held firms. We then
obtain innovation data from CIS 2006. Our transaction and innovation data do not have the same
identifier so we match them by company name. Names are not always identical in both databases,
so in case of ambiguity we resort to company websites and annual reports. The matching process
reduces sample size to 109 transactions, of which 89 have available financial statements in Diane
(Bureau Van Dijk) for the year preceding the transaction.
Table 1 summarizes the characteristics of the final sample. 47% of deals take place since 2004.
Slightly less than 40% of the sample is composed of companies in intermediate goods (52% in
terms of value of the deals). In terms of size, the sample is mostly constituted of relatively small
companies: 34% of targets have less than 20 million (M) Euros in sales at the time of the deal,
and 67% have less than 75M. Companies with sales above 75M constitute 31% of number but
73% of the value of deals.

5
Table 1 – Descriptive statistics of final sample This table shows the number and value of deals in the sample. Value is measured using the sum of sales revenue of companies in
each category, in thousands of Euros, for the year prior to the deal. Breakdown by sector follows the French classification named
NES16 (Nomenclature Economique de Synthèse).
Panel A : Breakdown by year
Number % Value %
2001 18 20.22% 1 099 628 19.07%
2002 12 13.48% 1 000 782 17.35%
2003 17 19.10% 1 139 305 19.76%
2004 22 24.72% 1 162 113 20.15%
2005 20 22.47% 1 364 967 23.67%
Total 89 5 766 795
Panel B : Breakdown by Sector
Number % Value %
Agricultural and food industries 7 7.87% 511 133 8.86%
Consumer Goods Industry 13 14.61% 596 591 10.35%
Automotive Industry 6 6.74% 241 696 4.19%
Capital goods industries 24 26.97% 1 232 990 21.38%
Intermediate goods 35 39.33% 3 019 754 52.36%
Energy 4 4.49% 164 630 2.85%
Total 89 5 766 795
Panel C : Sample Breakdown by Sales revenues
(Sales in Thousand of Euros) Number % Value %
(0;20000] 31 34.83% 303046 5.26%
(20000;75000] 30 33.71% 1201816 20.84%
(75000;150000] 18 20.22% 1762976 30.57%
(150000; max] 10 11.24% 2498958 43.33%
Total 89 5 766 795
3. Methodology
Gauging effects of LBOs on innovation is not trivial because LBOs do not occur randomly across
the population of firms. LBO targets are selected by investors presumably because of their value
creation potential. If an outside observer concludes that the average level of innovation
expenditure of firms targeted by an LBO is higher than in other firms, one cannot rule out the
possibility that this finding is due to the fact that LBO investors tend to select better firms on
average relative to the population.
We address the problem of sample selection bias using a propensity score methodology (PSM)
(Rubin, 1974; Heckman et al., 1999). We benchmark the level of innovation of LBO firms by
selecting appropriate matching control firms to each LBO. The set of matching control firms is
composed of firms that share the same financial characteristics as the LBO firm prior to the
transaction. To select matching firms that have ex-ante the same probability of being selected by
LBO investors, we implement a probit model to estimate the likelihood of being an LBO target in
6
a given year and we use the use the probability estimate from that model to find a matching
control for a firm that indeed was the target of an LBO deal1.
The main steps of the PSM procedure are as follows. First, we introduce filters to obtain a dataset
composed of about 1,200 companies. We need to do this because fitting a discrete choice
regression model where the number of „zeros‟ (that is, observations where the firm is not an LBO
target in a given year) is very high relative to the number of „ones‟ (that is, observations where
the firm is an LBO target in a given year) results in poor estimates. This is the case since CIS
2006 contains data for about 5,200 companies, and the sample contains 89 LBOs (2 % of the
dataset). We therefore introduce filters to obtain a manageable number of non-LBO observations.
A matching company belongs to the same 4-digit sector as the target. If there are more than ten
twins, we just keep the ten nearest neighbors to the target with the nearest turnover the year
preceding the buyout. The matching methodology allows us to retain 1,144 “twin” companies to
the sample, i.e. 12.85 twins by target. We choose 1,200 as a number that seems reasonable
because it means that LBOs constitute about 8% of the regression sample.
Second, we run a probit regression that models the likelihood of a firm being the target of an
LBO in a particular year. Denote by hk* the latent unobservable variable that represents the net
present value of the acquisition of firm k by a bidder and hk,t a dummy that takes the value of 1 if
an LBO bid is made in year t: hk,t = 1 if hk,t* >0 or hk,t = 0 if hk,t* < 0. The probit regression to be
estimated for the probability of Pr(hk,t = 1) is:
hk,t* = α +Wk,t δ + υk,t (1)
The matrix Wk,t contains firm-specific variables that the literature has identified as determinants
of the likelihood that a firm is an LBO target, namely firm size (measured by turnover), the debt-
equity ratio, the level of income taxes, the firm‟s profitability (measured by ROIC), liquidity
(proxied by cash divided by assets) and level of working capital (Le Nadant and Perdreau, 2006).
The predicted value from regression model (1) is called the propensity score. Its interpretation is
that it measures the probability, as predicted by the model, that a firm becomes an LBO target in
a given year. In other words, firms with similar propensity scores share similar characteristics
that lead to being an LBO target. They constitute therefore adequate benchmarks for LBO
innovation capacity.
Third, we use propensity score to match comparison units with treated units. Smith and Todd
(2005) note that measuring the proximity of cases as the absolute difference in the propensity
score is not an approach that is robust to “choice-based sampling,” where the treated are
oversampled relative to their frequency in the population of eligible individuals (Caliendo and
Kopeinig, 2008). As a consequence, we match on the log odds of the propensity score, defined as
p/(1-p), to assure that results are invariant to choice-based sampling.
Different matching algorithms can be used: kernel matching, nearest-neighbor or radius
matching. As we have many firms not involved in LBOs in our dataset, the radius matching
1 For a binary treatment variable, there is no strong advantage to using the logit vs. probit model. We also ran a logit
model and found similar results.

7
algorithm (with a caliper of 0.06) is more appropriate: it enables us to compare firms with very
close predictions of probit models. To avoid the risk of poor matches, radius matching specifies a
“caliper” or maximum propensity score distance by which a match can be made. The basic idea
of radius matching is that it uses not only the nearest neighbor within each caliper, but all of the
comparison group members within the caliper. In other words, it uses as many comparison cases
as are available within the caliper, but not those that are poor matches (based on the specified
distance). The robustness of our results is tested using other matching methods. We then measure,
for each LBO, its level of innovation relative to the level of innovation of its matching control
pair.
4. Post LBO innovation: evidence and robustness
a) Main results
Table 2 presents summary statistics for accounting measures of LBOs and the non-LBOs firms.
Relative to their potential controls, LBO firms are larger (65 M in average turnover vs. 40M) and
slightly more profitable (23% vs. 20% in terms of average ROIC), and they have higher income
taxes expenses the year before the deal (2.39% of sales for LBO vs. 1.63% for non-LBO). Only
differences in size and income taxes expenses are significant (see Appendix 2).

8
Table 2 – Summary statistics This table shows the summary statistics for sample deals for the year before the deal. «LBO companies» refers to
statistics of the sample of LBO firms. «Non-LBO companies» refers to statistics of the sample of all non-LBO
companies from which matched controls are chosen using a propensity score model. All these accounting variables
are obtained from DIANE. Turnover is in thousands of Euros. Income taxes expense and working capital are divided
by turnover. Working Capital is divided by net fixed assets. Debt-to-equity is measured by financial debt divided by
shareholders‟ equity (in %).
Variable Obs. Mean Std. Dev. Min Max
Non-LBO
companies
Turnover 1144 39566.79 67002.48 10.76 568409.10
ROIC 1144 0.1966 0.6307 -5.0873 13.6855
Income taxes 1144 0.0163 .02335 -0.1314 0.1385
Working capital 1144 0.1936 0.4171 -2.0513 6.4868
liquidity 1144 0.7149 5.0250 0 123.8937
Debt-to-equity 1144 80.92 626.39 -2225.51 13804.17
Turnover 89 64795.45 83478.02 20.13 483000
LBO
companies
ROIC 89 0.2259 0.2817 -1.0051 1.0727
Income taxes 89 0.0239 0.0407 -0.1610 0.2417
Working capital 89 0.2173 0.6906 -0.1633 6.4498
liquidity 89 0.3629 0.9031 0 7.5630
Debt-to-equity 89 56.63 216.68 -580.73 1721.00
The results of the probit model show that the largest firms and those that have the highest level of
income taxes have a higher probability of being an LBO target (Table 3). In contrast, firms‟
financial structure, profitability, liquidity and level of working capital do not seem to explain
LBO likelihood.
9
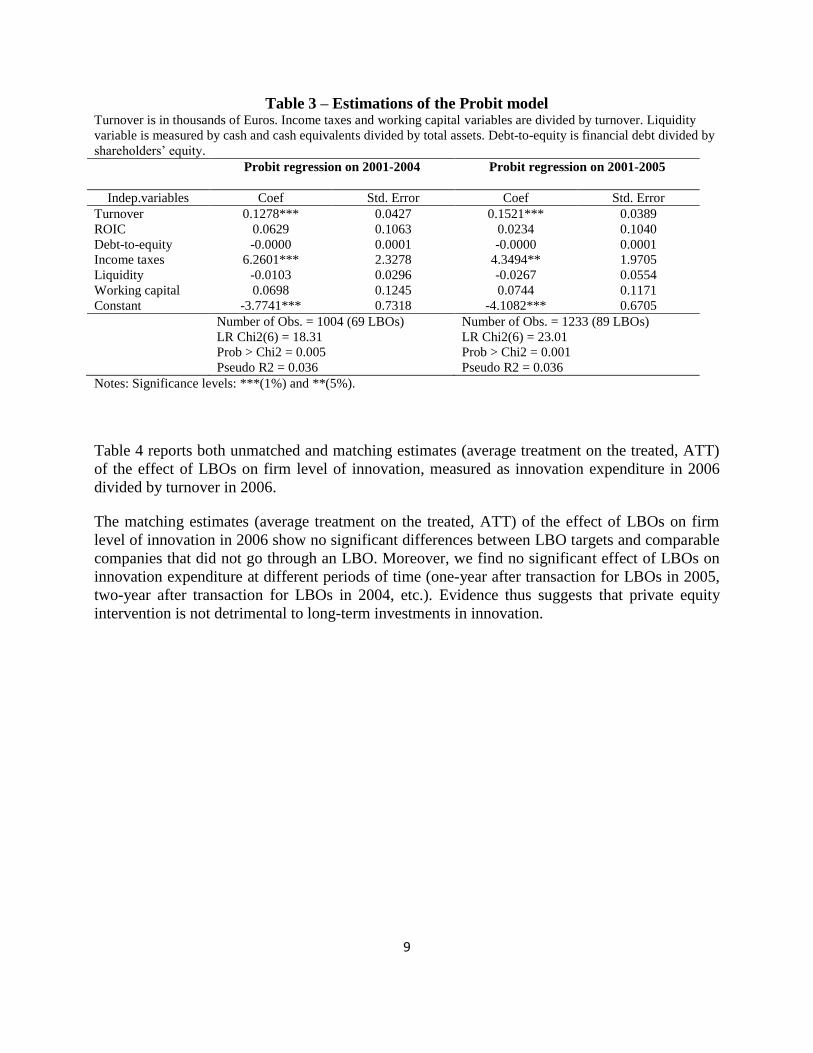
Table 3 – Estimations of the Probit model Turnover is in thousands of Euros. Income taxes and working capital variables are divided by turnover. Liquidity
variable is measured by cash and cash equivalents divided by total assets. Debt-to-equity is financial debt divided by
shareholders‟ equity.
Probit regression on 2001-2004
Probit regression on 2001-2005
Indep.variables Coef Std. Error Coef Std. Error
Turnover 0.1278*** 0.0427 0.1521*** 0.0389
ROIC 0.0629 0.1063 0.0234 0.1040
Debt-to-equity -0.0000 0.0001 -0.0000 0.0001
Income taxes 6.2601*** 2.3278 4.3494** 1.9705
Liquidity -0.0103 0.0296 -0.0267 0.0554
Working capital 0.0698 0.1245 0.0744 0.1171
Constant -3.7741*** 0.7318 -4.1082*** 0.6705
Number of Obs. = 1004 (69 LBOs)
LR Chi2(6) = 18.31
Prob > Chi2 = 0.005
Pseudo R2 = 0.036
Number of Obs. = 1233 (89 LBOs)
LR Chi2(6) = 23.01
Prob > Chi2 = 0.001
Pseudo R2 = 0.036
Notes: Significance levels: ***(1%) and **(5%).
Table 4 reports both unmatched and matching estimates (average treatment on the treated, ATT)
of the effect of LBOs on firm level of innovation, measured as innovation expenditure in 2006
divided by turnover in 2006.
The matching estimates (average treatment on the treated, ATT) of the effect of LBOs on firm
level of innovation in 2006 show no significant differences between LBO targets and comparable
companies that did not go through an LBO. Moreover, we find no significant effect of LBOs on
innovation expenditure at different periods of time (one-year after transaction for LBOs in 2005,
two-year after transaction for LBOs in 2004, etc.). Evidence thus suggests that private equity
intervention is not detrimental to long-term investments in innovation.
10
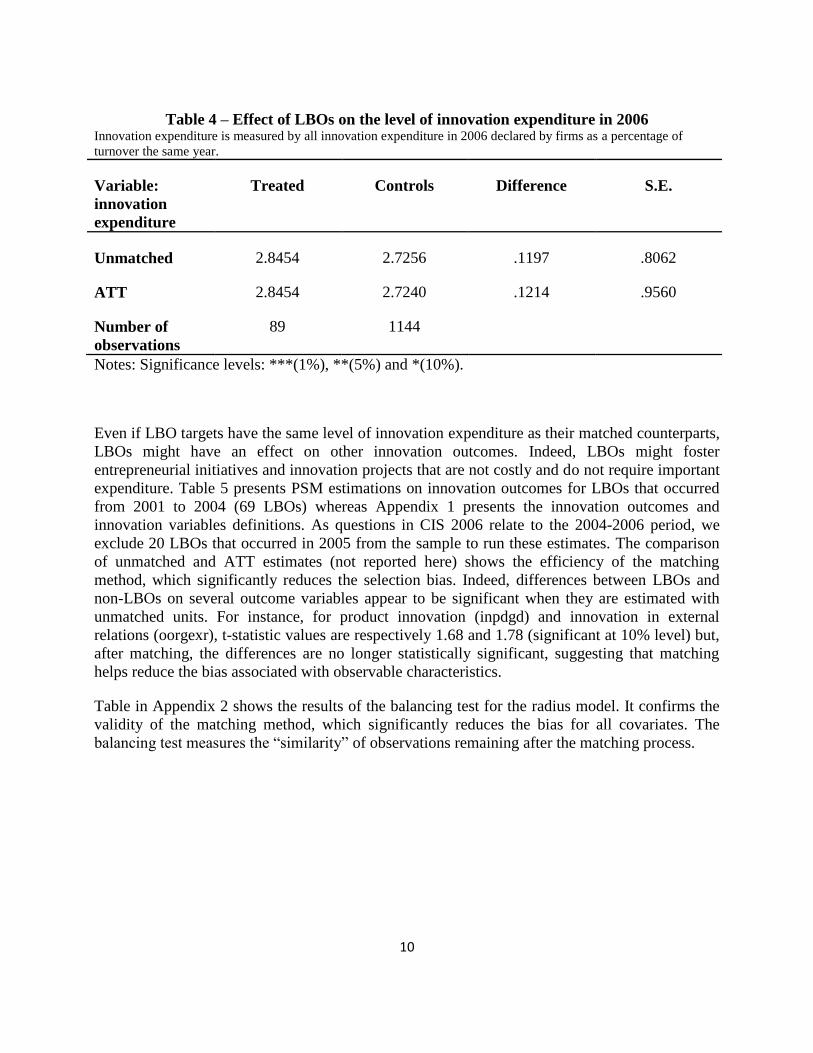
Table 4 – Effect of LBOs on the level of innovation expenditure in 2006 Innovation expenditure is measured by all innovation expenditure in 2006 declared by firms as a percentage of
turnover the same year.
Variable:
innovation
expenditure
Treated Controls Difference S.E.
Unmatched 2.8454 2.7256 .1197 .8062
ATT 2.8454 2.7240 .1214 .9560
Number of
observations
89 1144
Notes: Significance levels: ***(1%), **(5%) and *(10%).
Even if LBO targets have the same level of innovation expenditure as their matched counterparts,
LBOs might have an effect on other innovation outcomes. Indeed, LBOs might foster
entrepreneurial initiatives and innovation projects that are not costly and do not require important
expenditure. Table 5 presents PSM estimations on innovation outcomes for LBOs that occurred
from 2001 to 2004 (69 LBOs) whereas Appendix 1 presents the innovation outcomes and
innovation variables definitions. As questions in CIS 2006 relate to the 2004-2006 period, we
exclude 20 LBOs that occurred in 2005 from the sample to run these estimates. The comparison
of unmatched and ATT estimates (not reported here) shows the efficiency of the matching
method, which significantly reduces the selection bias. Indeed, differences between LBOs and
non-LBOs on several outcome variables appear to be significant when they are estimated with
unmatched units. For instance, for product innovation (inpdgd) and innovation in external
relations (oorgexr), t-statistic values are respectively 1.68 and 1.78 (significant at 10% level) but,
after matching, the differences are no longer statistically significant, suggesting that matching
helps reduce the bias associated with observable characteristics.
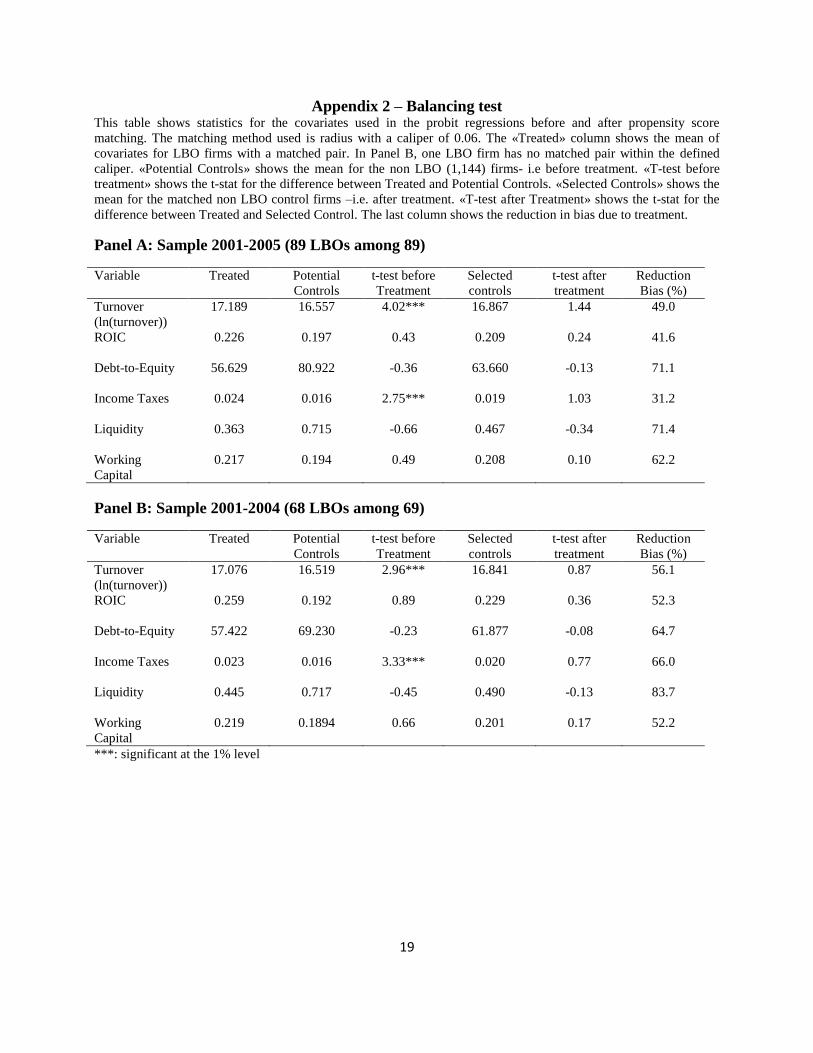
Table in Appendix 2 shows the results of the balancing test for the radius model. It confirms the
validity of the matching method, which significantly reduces the bias for all covariates. The
balancing test measures the “similarity” of observations remaining after the matching process.

11
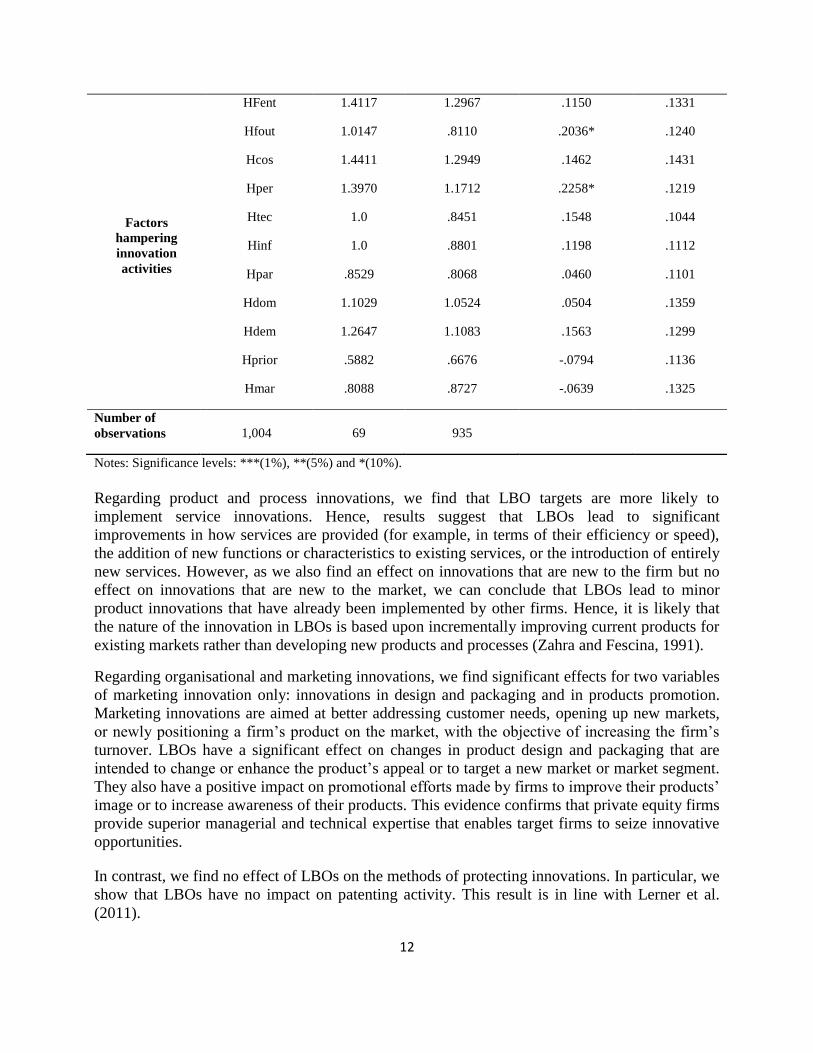
Table 5 – ATT estimates of innovation outcomes during 2004-2006 Variable type
Variable code Treated Controls Difference S.E.
Product
innovations
inpdgd .5147 .4385 .0761 .0632
inpdsv .2500 .1594 .0905* .0542
newmkt .4264 .3249 .1014 .0623
newfrm .4411 .3237 .1174* .0626
turnmar .0613 .0645 -.0031 .0197
turnin .0544 .0483 .0060 .0172
turnung .8842 .8871 -.0028 .0277
Process
innovations
inpspd .3676 .3704 -.0027 .0610
inpslg .1911 .1619 .02918 .0495
inpssu .1764 .1718 .0045 .0482
Organisational
innovations
oorgbup .3823 .3905 -.0081 .0615
oorgkms .2205 .2517 -.0312 .0527
oorgwkp .3088 .3183 -.0095 .0585
oorgexr .2500 .1762 .0737 .0544
Marketing
innovations
mktdgp .3235 .1869 .1365** .0585
mktpdp .2647 .1686 .0960* .0553
mktpdl .1029 .0988 .0040 .0383
mktpri .1617 .1044 .0573 .0461
Patents and other
protection
methods
ProPat .2941 .3245 -.0304 .0577
ProDsg .2352 .1954 .0398 .0534
ProTm .3823 .2847 .0976 .0611
ProCp .1029 .0676 .0353 .0380
prosol .1029 .0666 .0363 .0380
ProSct .1764 .1479 .0285 .0479
ProCon .2647 .2407 .0239 .0557
ProTech .2352 .1776 .0576 .0533
12
Factors
hampering
innovation
activities
HFent 1.4117 1.2967 .1150 .1331
Hfout 1.0147 .8110 .2036* .1240
Hcos 1.4411 1.2949 .1462 .1431
Hper 1.3970 1.1712 .2258* .1219
Htec 1.0 .8451 .1548 .1044
Hinf 1.0 .8801 .1198 .1112
Hpar .8529 .8068 .0460 .1101
Hdom 1.1029 1.0524 .0504 .1359
Hdem 1.2647 1.1083 .1563 .1299
Hprior .5882 .6676 -.0794 .1136
Hmar .8088 .8727 -.0639 .1325
Number of
observations 1,004 69 935
Notes: Significance levels: ***(1%), **(5%) and *(10%).
Regarding product and process innovations, we find that LBO targets are more likely to
implement service innovations. Hence, results suggest that LBOs lead to significant
improvements in how services are provided (for example, in terms of their efficiency or speed),
the addition of new functions or characteristics to existing services, or the introduction of entirely
new services. However, as we also find an effect on innovations that are new to the firm but no
effect on innovations that are new to the market, we can conclude that LBOs lead to minor
product innovations that have already been implemented by other firms. Hence, it is likely that
the nature of the innovation in LBOs is based upon incrementally improving current products for
existing markets rather than developing new products and processes (Zahra and Fescina, 1991).
Regarding organisational and marketing innovations, we find significant effects for two variables
of marketing innovation only: innovations in design and packaging and in products promotion.
Marketing innovations are aimed at better addressing customer needs, opening up new markets,
or newly positioning a firm‟s product on the market, with the objective of increasing the firm‟s
turnover. LBOs have a significant effect on changes in product design and packaging that are
intended to change or enhance the product‟s appeal or to target a new market or market segment.
They also have a positive impact on promotional efforts made by firms to improve their products‟
image or to increase awareness of their products. This evidence confirms that private equity firms
provide superior managerial and technical expertise that enables target firms to seize innovative
opportunities.
In contrast, we find no effect of LBOs on the methods of protecting innovations. In particular, we
show that LBOs have no impact on patenting activity. This result is in line with Lerner et al.
(2011).
13
Last, innovation activity may be hampered by a number of factors. There may be reasons for not
starting innovation activities at all, or factors that slow innovation activity or have a negative
effect on expected results. These include economic factors, such as high costs or lack of demand,
and enterprise factors, such as a lack of skilled personnel or knowledge. Regarding obstacles to
innovation, results show an effect of LBOs on two factors hampering innovation activities: lack
of skilled personnel and lack of external financial resource. These results suggest that LBO
targets do not have the skilled personnel needed to engage in innovation activities, or their
innovation activities may be slowed because they are unable to find the necessary personnel on
the labour market. Moreover, contrary to Boucly et al. (2011) who show that LBOs can alleviate
financial constraints and foster growth, our results suggest that LBO targets lack external
financial resource for their innovation activities.
b) Robustness check
We evaluate the robustness of the estimations by changing the matching algorithms. The
matching algorithms used are nearest neighbor (with one and three neighbors), radius (with a
caliper of 0.06) and kernel. The impact on innovation variables does not appear to depend
critically on the algorithm used, since both the value of the coefficients and its significance are
very similar using different alternatives. In particular, we find no impact of LBOs on innovation
expenditure whatever the algorithm used.
5. Conclusion
Hence, although most commentators in the public debate and many financial economists consider
LBOs as a way to implement drastic, “cost cutting” measures, this paper provides evidence that
ex-post innovation expenditure is similar in LBO targets and comparable firms in France. In
addition, we find no evidence that, as for contribution to innovation, LBOs alleviate financial
constraints or facilitate business relations.
In contrast, we find an effect of LBOs on service innovation but this effect is not related to
radical or disruptive innovation as LBOs have an impact on product innovation that is new only
to the firm. Moreover, results show that LBO targets are more likely to implement marketing
innovations (design and packaging and product promotion) in order to increase turnover and
market share. This result is in line with the idea that, following an LBO, management is not only
focused on “cost cutting” activities that aim to increase value creation. Private equity firms also
encourage managers of LBO targets to build new strategies to find and exploit value creation
potentials. Further, these results emphasize the resources and capabilities that buyout specialists
bring in terms of contribution to innovation to their portfolio companies as they suggest that
LBOs do not lead to the acquisition of skills or resources that enable the introduction of
disruptive innovation. Adversely, results show that post-LBO innovations, which are mainly
based upon marketing and service innovations, rely on existing resources with only the addition
of a marketing competency.
Contrary to Boucly et al (2011), results also suggest that LBOs do not alleviate financial
constraints as we find a positive effect of LBOs on the lack of financial resources as a factor
hampering innovation. Moreover, as we find no effect of LBOs on radical innovations or new
products or services, it seems that LBOs do not help to achieve such radical innovation. This
14
result could be a clue that LBOs lead to the strengthening of financial and human resources
constraints that hamper radical innovation.
References
Boucly, Q., D. Sraer, D. Thesmar (2011), “Growth LBOs”, Journal of Financial Economics, vol.
102, n° 2, pp. 432-453.
Bruining, H., M. Wright, (2002), “Entrepreneurial orientation in management buy-outs and the
contribution of venture capital”, Venture Capital, vol. 4(2), pp. 147-168.
Caliendo, M, S. Kopeinig, (2008), “Some Practical Guidance For The Implementation Of
Propensity Score Matching”, Journal of Economic Surveys, Wiley Blackwell, vol. 22(1), pp. 31-
72.
Cumming, D., D.S. Siegel et M. Wright (2007), “Private equity, leveraged buyouts and
governance”, Journal of Corporate Finance, vol. 13, pp. 439–460.
Hall, B.H. (1990), “The impact of corporate restructuring on industrial research and
development”, Brookings Papers: Microeconomics, pp. 85-135.
Heckman, J.J., J. Smith, R. Lalonde R. (1999), “The economics and econometrics of active
labour market programs”, Handbook of Labour Economics, 3, pp. 1865-2097.
Hendry, J. (2002), “The principal's other problems: Honest incompetence and the specification of
objectives”, Academy of Management Review, vol. 27(1), pp. 98-113.
Hitt, M.A., R. E. Hoskisson, R. A. Johnson, D. D. Moesel (1996), “The Market for Corporate
Control and Firm Innovation”, The Academy of Management Journal, vol. 39, No. 5, pp. 1084-
1119.
Le Nadant, A-L, F. Perdreau (2006), “Financial Profile of Leveraged Buyout Targets: Some
French Evidence”, The Review of Accounting and Finance, vol. 5(4), pp. 370-392.
Lee, C., K. Lee, J.M. Pennings, (2001), “Internal capabilities, external networks, and
performance: A study on technology-based ventures”, Strategic Management Journal, vol. 22,
pp. 615-640.
Lerner, J., M. Sorensen, P.J. Strömberg (2011), “Private Equity and Long-Run Investment: The
Case of Innovation”, The Journal of Finance, vol. 66(2), pp. 445-477.
Lichtenberg, F., D. Siegel (1990), “The effects of leveraged buyouts on productivity and related
aspects of firm behavior”, Journal of Financial Economics, vol.27, pp 165-194.
Long, W.F., D.J. Ravenscraft (1993), “LBOs, Debt and R&D Intensity”, Strategic Management
Journal, vol. 14, pp. 119-135.
Malone, S. (1989), “Characteristics of smaller company leveraged buyouts”, Journal of Business
Venturing, vol. 4 (5), pp. 345-359.

15
Meuleman, M., K. Amess, M. Wright, L. Scholes (2009), “Agency, Strategic Entrepreneurship,
and the Performance of Private Equity-Backed Buyouts”, Entrepreneurship Theory and Practice,
vol. 33, pp. 213–239.
Rubin, D.B. (1974), “Estimating causal effects of treatments in randomized and non randomized
studies”, Journal of Educational Psychology, vol. 66, pp. 688-701.
Smith, A. (1990), “Corporate Ownership Structure and Performance: the Case of Management
Buyouts», Journal of Financial Economics, vol. 27, pp. 143-164.
Ughetto, E. (2010), “Assessing the contribution to innovation of private equity investors: a study
on European buyouts”, Research Policy, vol. 39, pp. 126-140.
Wright, M., R. Hoskisson, L. Busenitz, (2001), “Firm Rebirth: Buyouts as Facilitators of
Strategic Growth and Entrepreneurship», Academy of Management Executive, vol.15(1), pp.111-
125.
Wright, M., R. Hoskisson, L. Busenitz, J. Dial (2001), “Finance and management buyouts:
Agency versus entrepreneurship perspectives”, Venture Capital, vol. 3(3), pp. 239-261.
Wright, M., S. Thompson, and K. Robbie (1992), “Venture capital and management-led,
leveraged buy-outs: A European perspective”, Journal of Business Venturing, vol. 7 (1), pp. 47-
71.
Zahra, S.A. (1995). “Corporate Entrepreneurship and Financial Performance: The Case of
Management Leveraged Buy-Outs», Journal of Business Venturing, 10, pp. 225-247.
Zahra, S.A., M. Fescina (1991), “Will leveraged buyouts kill U.S. corporate research and
development?”, Academy of Management Executive, 5, pp. 7-21.
16
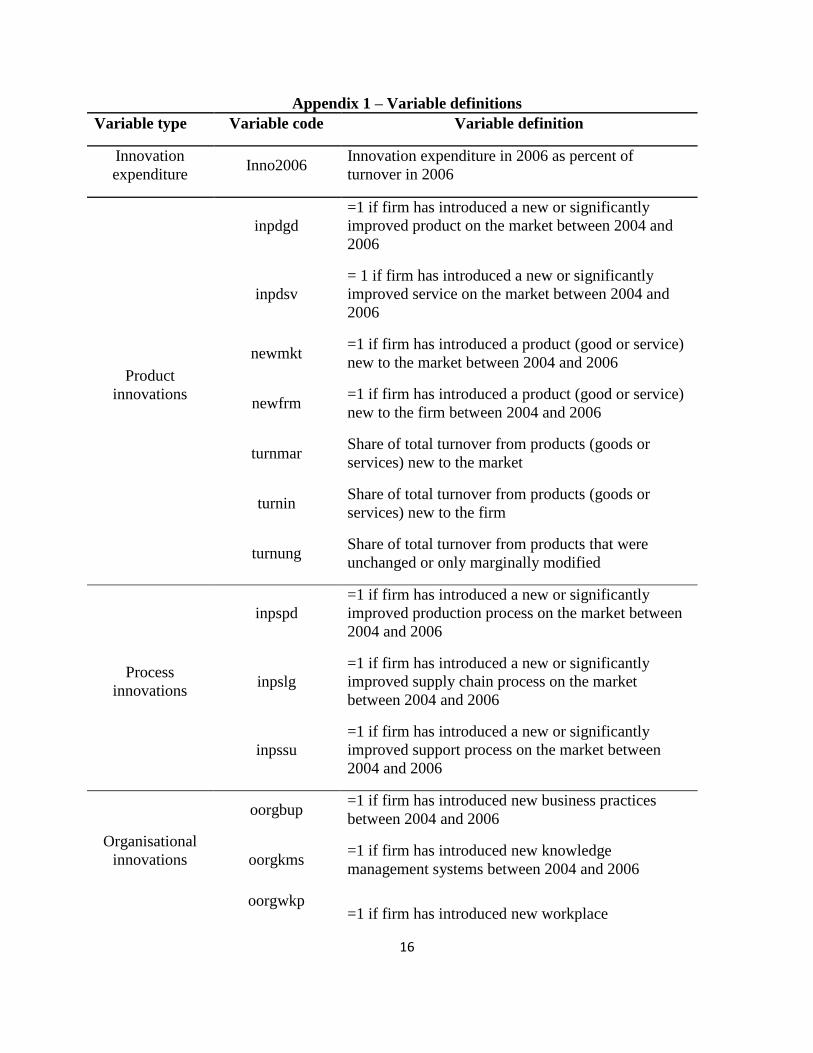
Appendix 1 – Variable definitions
Variable type Variable code Variable definition
Innovation
expenditure Inno2006
Innovation expenditure in 2006 as percent of
turnover in 2006
Product
innovations
inpdgd
=1 if firm has introduced a new or significantly
improved product on the market between 2004 and
2006
inpdsv
= 1 if firm has introduced a new or significantly
improved service on the market between 2004 and
2006
newmkt =1 if firm has introduced a product (good or service)
new to the market between 2004 and 2006
newfrm =1 if firm has introduced a product (good or service)
new to the firm between 2004 and 2006
turnmar Share of total turnover from products (goods or
services) new to the market
turnin Share of total turnover from products (goods or
services) new to the firm
turnung Share of total turnover from products that were
unchanged or only marginally modified
Process
innovations
inpspd
=1 if firm has introduced a new or significantly
improved production process on the market between
2004 and 2006
inpslg
=1 if firm has introduced a new or significantly
improved supply chain process on the market
between 2004 and 2006
inpssu
=1 if firm has introduced a new or significantly
improved support process on the market between
2004 and 2006
Organisational
innovations
oorgbup =1 if firm has introduced new business practices
between 2004 and 2006
oorgkms =1 if firm has introduced new knowledge
management systems between 2004 and 2006
oorgwkp =1 if firm has introduced new workplace

17
organisation between 2004 and 2006
oorgexr
=1 if firm has introduced new organizational
methods in firm‟s external relations between 2004
and 2006
Marketing
innovations
mktdgp
=1 if firm has introduced significant changes in
product design and packaging between 2004 and
2006
mktpdp =1 if firm has introduced new marketing methods in
product promotion between 2004 and 2006
mktpdl =1 if firm has introduced new marketing methods in
product placement between 2004 and 2006
mktpri =1 if firm has introduced innovations in pricing
between 2004 and 2006
Patents and other
protection
methods
ProPat =1 if firm has used patents between 2004 and 2006
ProDsg =1 if firm has used registration of design between
2004 and 2006
ProTm =1 if firm has used trademarks between 2004 and
2006
ProCp =1 if firm has used copyrights between 2004 and
2006
ProSol =1 if firm has used “Soleau envelopes” between
2004 and 2006
ProSct =1 if firm has used secrecy (not covered by legal
agreements) between 2004 and 2006
ProCon =1 if firm has used complexity of product design
between 2004 and 2006
ProTech =1 if firm has used lead time advantage over
competitors between 2004 and 2006
Factors
hampering
innovation
activities*
HFent Lack of funds within the enterprise
HFout Lack of finance from sources outside the enterprise
HCos Cost too high
HPer Lack of qualified personnel

18
HTec Lack of information on technology
HInf Lack of information on markets
HPar Difficulty in finding cooperation partner
HDom Market dominated by established enterprises
HDem Uncertain demand for innovative goods or services
HPrior No need to innovate due to earlier innovations
HMar No need because of lack of demand for innovations
*For factors hampering innovation activities, the survey contains questions regarding their degree
of importance and these variables can take values from 0 (no importance) to 3 (high importance).
19
Appendix 2 – Balancing test This table shows statistics for the covariates used in the probit regressions before and after propensity score
matching. The matching method used is radius with a caliper of 0.06. The «Treated» column shows the mean of
covariates for LBO firms with a matched pair. In Panel B, one LBO firm has no matched pair within the defined
caliper. «Potential Controls» shows the mean for the non LBO (1,144) firms- i.e before treatment. «T-test before
treatment» shows the t-stat for the difference between Treated and Potential Controls. «Selected Controls» shows the
mean for the matched non LBO control firms –i.e. after treatment. «T-test after Treatment» shows the t-stat for the
difference between Treated and Selected Control. The last column shows the reduction in bias due to treatment.
Panel A: Sample 2001-2005 (89 LBOs among 89)
Variable Treated Potential
Controls
t-test before
Treatment
Selected
controls
t-test after
treatment
Reduction
Bias (%)
Turnover
(ln(turnover))
17.189
16.557 4.02*** 16.867 1.44 49.0
ROIC 0.226
0.197 0.43 0.209 0.24 41.6
Debt-to-Equity 56.629
80.922 -0.36 63.660 -0.13 71.1
Income Taxes 0.024
0.016 2.75*** 0.019 1.03 31.2
Liquidity 0.363
0.715 -0.66 0.467 -0.34 71.4
Working
Capital
0.217
0.194 0.49 0.208 0.10 62.2
Panel B: Sample 2001-2004 (68 LBOs among 69)
Variable Treated Potential
Controls
t-test before
Treatment
Selected
controls
t-test after
treatment
Reduction
Bias (%)
Turnover
(ln(turnover))
17.076
16.519 2.96*** 16.841 0.87 56.1
ROIC 0.259
0.192 0.89 0.229 0.36 52.3
Debt-to-Equity 57.422
69.230 -0.23 61.877 -0.08 64.7
Income Taxes 0.023
0.016 3.33*** 0.020 0.77 66.0
Liquidity 0.445
0.717 -0.45 0.490 -0.13 83.7
Working
Capital
0.219
0.1894 0.66 0.201 0.17 52.2
***: significant at the 1% level