lawrence, ks economic overview
TRANSCRIPT

Lawrence, KSEconomic OverviewPrepared by EY to support the creation of the first economic development strategy for Lawrence
15 September 2020

Executive summary
Lawrence, KS Economic Overview2
In June 2020, the City of Lawrence hired Ernst & Young LLP (EY) to assist the City in developing its first economic development strategy. The City wishes to build this strategy around a vision and priorities identified by the community. The city also sought to understand the economic conditions and opportunities in Lawrence through subject-matter specialists with extensive national experience in economic development.
To further these objectives, EY helped the City conduct extensive stakeholder engagement and research. This included multiple interviews, focus groups, public listening sessions, and a community-wide survey that is still ongoing. These avenues will not be the final opportunities for the community to guide the strategy but were a starting point for the EY team to better understand Lawrence’s current economic conditions and the vision residents have for the future.
This Economic Overview report provides a holistic, external perspective on different factors identified as most important to Lawrence’s economic development opportunities. The analysis considers trends occurring within Lawrence as well as Lawrence’s position relative to 39 benchmark communities. The report also shares perspectives on how each of these factors relate to each other and potentially affect the future economic health of the community. The report concludes with a strengths, weaknesses, opportunities and threats (SWOT) assessment that lays a foundation for the City to identify and prioritize actions within the economic development strategy.
Overall, our study finds that Lawrence is doing well on many fronts, but the economy is not working for everybody and there are reasons to be concerned about long-term economic sustainability. The community is loved by its residents and growing, but it is becoming increasingly unaffordable and leaving many residents behind. Limited business diversity make Lawrence less resilient and raises fiscal challenges for the City when providing the high-quality services that residents expect.
Throughout interviews and surveys, residents express a desire to create higher-paying jobs, build a more resilient community and increase equitable opportunities for those in need. This shows that residents understand the community and are aligned in priorities for action, which lays a strong foundation for the upcoming strategy.

Chapter title Page
1 Introduction 04
2 A holistic approach to economic development 07
3 SWOT assessment 31
Appendix I: data benchmarking
Appendix II: survey results
Contents page
Disclaimer
Our Report may be relied upon by City of Lawrence for the purpose set out in the Scope section only pursuant to the terms of our engagement letter dated July 15, 2020. We disclaim all responsibility to any other party for any loss or liability that the other party may suffer or incur arising from or relating to or in any way connected with the contents of our report, the provision of our report to the other party or the reliance upon our report by the other party.

An opportunity to set the course for a more prosperous future
Lawrence has a long history and is loved by its residents, but like many cities, as Lawrence grows and global circumstances change, the city faces a variety of economic challenges. These challenges were further heightened by the COVID-19 pandemic, which continues to impact the lives and livelihoods of individuals across Lawrence and the world.
In order to clearly prioritize challenges and face them in a coordinated, collaborative and innovative manner, the City of Lawrence decided to create the City’s first economic development strategy.
Through a competitive bidding process, the City hired Ernst & Young LLP’s economic development advisory services (EDAS) practice to assist it in the process of creating the strategic plan. Rather than coming into Lawrence with predetermined opinions and concepts, EDAS sought to understand what economic development means to the city, its residents and its businesses.
We began the advisory process by studying Lawrence’s history, listening to diverse, representative voices from across Lawrence and conducting extensive data benchmarking. The findings of our research and listening are presented as an independent assessment in this Economic Overview.
This report does not make conclusions as to how Lawrence should proceed going forward but instead presents the factors that holistically influence Lawrence’s economic success — both the positive and negative.
4
Introduction
Lawrence, KS Economic Overview

Identifying benchmarks
In addition to interviews, focus groups, surveys and other listening avenues, EDAS conducted a detailed data benchmarking analysis. The full results of this analysis can be seen in the Appendix to this report. In this analysis, Lawrence was compared with 39 other cities with populations between 100,000 and 250,000 located within 500 miles.
5
Choosing these benchmarks offers a broad comparison to contextualize conditions in Lawrence. Geography affects economic opportunities, and these benchmarks present a range of community types across the Midwestern United States — from other university towns such as Ames, Iowa, to medical centers such as Rochester, Minnesota.
These benchmarks consider the full metropolitan areas of each city. For Lawrence, the metropolitan area covers all of Douglas County, with a population of just over 120,000 in 2018. In comparison, Lafayette, Indiana, was the largest benchmarked region, with 233,000 residents, and Fond du Lac, Wisconsin, was the smallest, with 103,000 residents.
The data highlighted in this benchmarking analysis further reinforces Lawrence residents’ stories — both good and bad. In some circumstances, we see that Lawrence is significantly outperforming its peer communities, illuminating strengths upon which to built future opportunities. In other cases, we see persistent challenges that may require strategic intervention to address.
Source: EY
Lawrence, KS Economic Overview
LAWRENCE
TopekaManhattan
St. Joseph
St. CloudEau Claire
Rochester
Sioux City
Ames
Waterloo
Iowa City
Wassau
Oshkosh
Fond du Lac
JanesvilleRacine
Michigan CityKankakee
LafayetteBloomington
BloomingtonTerre HauteSpringfield
Decatur Champaign
Monroe
Texarkana
Tyler
Lawton
Wichita FallsSherman
Jackson
JonesboroJoplin Bowling
Green
OwensboroCarbondale
Columbia
Jefferson City

6 Lawrence, KS Economic Overview
The big takeaways
The following report lays out the current condition of economic factors in Lawrence, describes how these issues are interconnected and includes observations from EY about challenges, opportunities and threats presented by these conditions.
The findings in this report are based on our economic and demographic research, stakeholder input (including focus groups, interviews, a community survey, listening sessions and advisory group meetings) and EY’s specialized experience in this subject matter.
Overall, residents want to see Lawrence grow in a sustainable and international manner that:
Diversifies the local tax base. Lawrence’s business community is dominated by educational institutions and retail, which puts a high share of the tax burden on residents. At the same time, residents expect high-quality services and amenities from the City, which often leads to increased taxes and charges for services. This ultimately can make the city less affordable and create challenges sustaining the quality of life expected by residents. Attracting more diverse businesses and private investment can help balance the tax base, make the city more affordable and provide sustainable resources to enhance public services.
Creates economic equity for all. Many residents of Lawrence express a desire to address ethnic and other disparities in the community and promote economic equity. Addressing economic equity can be a foundation of the economic development strategy and can help prioritize actions to make housing more affordable, improve access to education and other critical resources and create more high-wage career pathways for young people with different skill sets. This can help ensure that children raised in Lawrence can build a future locally and everybody can take part in economic progress.
Sustains the character and history of Lawrence. People love Lawrence because it is unique — with a rich history, arts and culture, homegrown retail and restaurants and overall character that attracts new residents and keeps the community vibrant. It is critical that efforts to diversify and grow the economy also honor Lawrence’s history, embrace its culture and preserve its natural environment.

7
A holistic approach to economic development
Defining economic development for Lawrence
“Economic development” does not have one meaning. It can focus on a range of topics — from supporting technology startups to economic equity. Historically, economic development was very focused on attracting large new corporate relocations that would bring hundreds of jobs and millions of dollars of investment. This often involved providing subsidized land and offering financial incentives for businesses to locate in a community, with the recognition that they brought significant net benefits in the form of well-paying jobs, tax revenues and multiplier effects throughout the community — new home sales, grocery purchases, car maintenance and the jobs that come with all these activities.
In more recent years, the field has shifted to recognize that every community is affected by a wide variety of factors that often go beyond business recruitment. Often interconnected, these factors include education, housing, affordability, research and innovation, equity and many more. The multifaceted nature of the field requires a holistic approach to each community in which the topics of greatest importance are revealed through the planning process.
Through residents’ voices, our research and our national experience, we identified 18 top factors that contribute to economic development in Lawrence. The following pages contain descriptions of each of these factors. In some, Lawrence is performing quite well; in others, there are persistent challenges that could require strategic action.
The intent of this analysis is to provide the Lawrence community with a balanced understanding of these topics and their trade-offs to inform decisions in the future.
Lawrence, KS Economic Overview

8 Lawrence, KS Economic Overview
Business climate
Economic growth
Education
Natural environment
Fiscal sustainability
Small business & entrepreneurship Transportation &
mobility
Housing
Office & industrial real estate
Location
Demographic change
Equity
Industry diversity
Retail & restaurants
Arts & culture
Affordability
Research & innovation
Broadband
A holistic approach to economic
development in Lawrence
Holistic wheel of economic development
Location
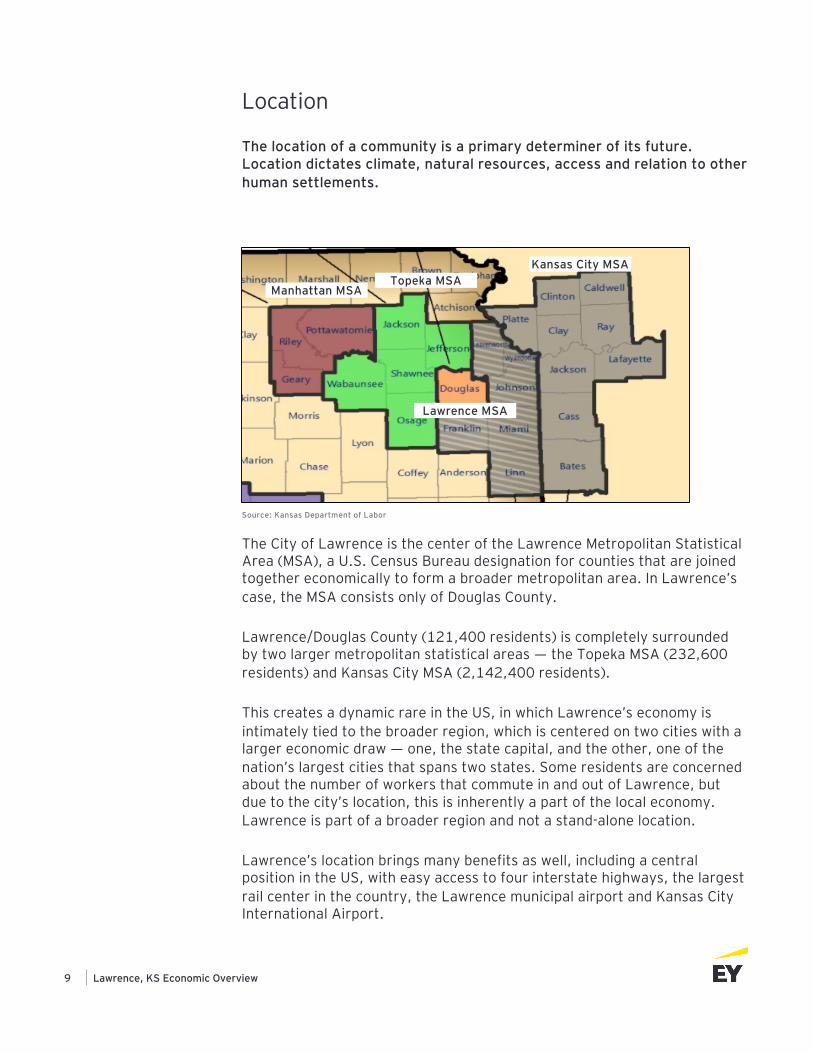
The location of a community is a primary determiner of its future. Location dictates climate, natural resources, access and relation to other human settlements.
9
The City of Lawrence is the center of the Lawrence Metropolitan Statistical Area (MSA), a U.S. Census Bureau designation for counties that are joined together economically to form a broader metropolitan area. In Lawrence’s case, the MSA consists only of Douglas County.
Lawrence/Douglas County (121,400 residents) is completely surrounded by two larger metropolitan statistical areas — the Topeka MSA (232,600 residents) and Kansas City MSA (2,142,400 residents).
This creates a dynamic rare in the US, in which Lawrence’s economy is intimately tied to the broader region, which is centered on two cities with a larger economic draw — one, the state capital, and the other, one of the nation’s largest cities that spans two states. Some residents are concerned about the number of workers that commute in and out of Lawrence, but due to the city’s location, this is inherently a part of the local economy. Lawrence is part of a broader region and not a stand-alone location.
Lawrence’s location brings many benefits as well, including a central position in the US, with easy access to four interstate highways, the largest rail center in the country, the Lawrence municipal airport and Kansas City International Airport.
Source: Kansas Department of Labor
Lawrence, KS Economic Overview
Manhattan MSATopeka MSA
Kansas City MSA
Lawrence MSA

Economic growth
Jobs, gross regional product, capital investment and other traditional economic metrics offer a core measure of the economic health of a community. They do not capture all factors, such as quality of jobs and equitable distribution of investment, but they indicate whether a community is creating new wealth and opportunity.
10
At a high level, Lawrence’s economy has been performing relatively well in recent years. From 2014 to 2019, the number of jobs in Lawrence grew 6.0% — and this ranked ninth among the 40 benchmark communities considered in this study. Only Jonesboro, Arkansas, significantly outperformed Lawrence in terms of employment growth, with an 11.9% increase over this period. Bloomington, Illinois, performed the most poorly, losing 2.8% of jobs over the same period.
Lawrence’s gross regional product (the overall value of all goods and services produced in the community) also increased rapidly in recent years. From 2013 to 2018, Lawrence’s gross regional product grew 21.4% — the sixth-highest growth among the benchmarks.
But as shown on the following pages, overall economic growth does not tell the full story.
Employment growth, 2014–2019
Source: EMSI, EY
Lawrence, KS Economic Overview
Jonesboro, AR, 11.9%
6.0% Bloomington, IL, -2.8%
9

Although the number of jobs in Lawrence grew relatively rapidly in recent years, it is important to examine the quality of those jobs. One way to evaluate the quality of job creation is by examining salary levels.
Notably, the jobs being created in Lawrence do not pay as well those held by many residents who work outside the city.
In 2019, the average annual salary of a job in Lawrence was just below $40,500. By comparison, in 2018, the median household income in for householders over 25 years old (non-student) in Lawrence was approximately $60,600.
This shows a significant gap between what jobs in Lawrence pay and what residents of Lawrence earn – often outside the community.
In 2018, 50% of all the jobs in Lawrence were held by nonresidents of the city. Relative to other benchmark communities, this is actually a fairly low share. Lawrence ranked fourth fewest for number of jobs filled by nonresidents. In comparison, Carbondale and Kankakee, Illinois, both have over 80% of local jobs filled by nonresidents.
Conversely, 53% of employed Lawrence residents work outside the city —ranking 28th among the 40 benchmarks. In comparison, only 25% of Rochester, Minnesota, residents commute out of the city each day.
The greatest concern among these commuting dynamics is the difference in pay levels between jobs inside and outside Lawrence. In 2018, only 28% of workers in the city earned over $40,000 a year — and this ranked 38th
among the benchmark communities. In contrast, 39% of those who worked outside the city earned over $40,000 a year — 10th highest among the benchmark communities.
These data reflect a common desire heard from residents of Lawrence — to create more well-paying career opportunities within the city.
Source: EMSI
Average annual salary, 2019
$40,447Source: U.S. Census Bureau, American Community Survey
Median household income excluding householders under 25 years, 2018
$60,609
11 Lawrence, KS Economic Overview

Industry diversity
Industry diversity measures the relative mix of different types of businesses in a community — retail establishments, government employers, manufacturers, professional services and more. In general, more diverse economies are more resilient to shocks, such as economic downturns or the current pandemic.
12
EY’s industry diversity score measures the overall diversity of a local economy relative to the US average of 100. Scores above 100 are more diverse, and those below are less diverse than average.
Notably, none of the 40 benchmarks considered in this study are more diverse than the US average, but Lawrence ranked 30th overall — with an industry diversity score of 63.8. Monroe, Louisiana, was the most diverse among benchmarks (92.6 score), and Springfield, Illinois, was the least (28.5).
These findings were not a surprise. The University of Kansas (KU) is the largest employer in Lawrence, and along with Haskell Indian Nations University (Haskell) and Peaslee Tech, contributes to a local economy dominated by educational employment, entertainment and retail.
Most residents of Lawrence recognize this lack of industry diversity, which contributes to more limited career opportunities, below-average salary levels and vulnerability during economic shocks — as seen during the current COVID-19 pandemic, which has severely impacted all three of Lawrence’s largest employment clusters.
Industry diversity score (100 represents the US average), 2017
Source: EMSI, EY
Lawrence, KS Economic Overview
Monroe, LA, 92.6
63.8
Springfield, IL, 28.5
30

13
Further detail on Lawrence’s industry trends can be found in the industry cluster analysis section of Appendix I.
It is worth noting that although Lawrence’s overall economy is less diverse than average, a number of advanced industries are already highly concentrated in the city, if only representing a small share of employment, and others are emerging rapidly as high-growth sectors.
Four primary industry clusters are already highly concentrated in Lawrence. These clusters include creative content, which comprises design, advertising, audio, video and other content production and has 2.5 times the employment concentration in Lawrence than the US average. The other clusters are research, 2.5 times more concentrated in Lawrence; materials, which covers a range of advanced material manufacturing and is 2.2 times more concentrated in Lawrence; and metalworking, which includes machine shops, fabricated metal and other metal machinery manufacturing and is 1.6 times more concentrated in Lawrence. Non-primary highly concentrated clusters are nonprofits and education.
Emerging clusters that are less concentrated in Lawrence but are growing rapidly include agribusiness (food production, related support, and research activities), industrial machinery (farm and other equipment design and manufacturing) and professional services (a range of professions including lawyers and accountants).
All of these emerging clusters represent potentially high-paying, technology-focused career opportunities in the community. Notably, like many stronger career opportunities in the modern economy, all these clusters require some form of education beyond high school — from certificates to master’s degrees.
It will be important that the City consider these and other factors alongside overall desirability within the community when determining which types of businesses to target for growth through recruitment and startup activity.
Lawrence, KS Economic Overview

Demographic change
A community’s economy both fundamentally serves the people of the community and is made up of those people. To understand Lawrence’s economic position, it is important to understand the demographics of Lawrence today and how they are changing.
14
From 2014 to 2019, the population of Lawrence grew 5% — the seventh fastest among the 40 benchmarks examined in this analysis. Nearly half of the other cities lost population over this period, a common but unfortunate trend among communities in the Midwestern US.
The demographics of Lawrence have been changing as the city grows. Lawrence’s population remains majority white, but in recent years, the number of white residents decreased, while the fastest-growing ethnic groups were Asian, Native American and Hispanic/Latino.
Due to the presence of the University of Kansas and Haskell Indian Nations University, Lawrence’s population remains relatively young, but the fastest-growing age cohorts are over 65 years old and between 35 and 44 years old.
The continued loss of residents between 25 and 34 years old is reflective of a common perception among residents that Lawrence offers few starting career opportunities for recent graduates, most of whom leave the city after finishing school.
Population growth, 2014–2019
Source: U.S. Census Bureau, EY
Lawrence, KS Economic Overview
Sherman, TX, 10.2%
5.0% Decatur, IL, -4.2%
7

16%
26%
17%
11% 9%8%
12%
0%
5%
10%
15%
20%
25%
30%
Under 18years
18 to 24years
25 to 34years
35 to 44years
45 to 54years
55 to 64years
65 yearsand over
City ofLawrence
US
The presence of multiple post-secondary educational institutions contributes to a much-higher-than-average concentration of 18 to 24 year olds in Lawrence’s population. However, from 2013 to 2018, the fastest-growing local age cohort was over 65 years old, followed by 35 to 44 years old.
15
Age distribution of residents, 2018
Source: U.S. Census Bureau, EY
Population growth by age cohort, 2013–2018
Source: U.S. Census Bureau, EY
Lawrence, KS Economic Overview
-1.1%
8.5%
-7.8%
16.9%
5.0%
-14.8%
42.3%
-20%
-10%
0%
10%
20%
30%
40%
50%
Under 18years
18 to 24years
25 to 34years
35 to 44years
45 to 54years
55 to 64years
65 yearsand over
City ofLawrence
US

74%
5%8% 7% 3% 4%
0%
10%
20%
30%
40%
50%
60%
70%
80%
White, Non-HispanicBlack Hispanic / Latino Asian Native Am erican Other
City ofLawrence
US
Overall, Lawrence is less ethnically diverse than the US average but is growing more diverse with time. The city has an above-average share of white residents (74% of total), Asian (7%) and Native American (3%). The fastest-growing ethnic groups from 2013 to 2018 were Asian (44%), Native American (28%) and Hispanic/Latino (25%).
16
Ethnic distribution of residents, 2018
Source: US Census Bureau, EY
Population growth by ethnicity, 2013–2018
Source: U.S. Census Bureau, EY
Lawrence, KS Economic Overview
-0.3%
14.9%24.9%
44.0%
28.3%
1.8%
-5%0%5%
10%15%20%25%30%35%40%45%50%
White, N
on-Hisp
anic
Black
Hispanic
/ Latin
oAsia
n
Native A
mer
ican
Other
City ofLawrence
US

Education
Education is the fundamental driver of the modern economy. Businesses thrive in a location with an availability of skilled individuals and an ability to attract and train new workers. Education is a primary determiner of future success for individuals.
17
Lawrence is the best-educated city among the 40 benchmark communities, with over 56% of residents over 25 years old holding a bachelor’s degree or higher.
The presence of the University of Kansas and Haskell Indian Nations University are primary reasons that Lawrence has a highly educated population, but the city is also very attractive to well-educated individuals who work in fields other than education.
This is evidenced by the fact that Lawrence has a higher share of educated adult residents than Ames, Iowa (home to Iowa State University) — 51%; Iowa City, Iowa (home to the University of Iowa) — 49%; Columbia, Missouri (home to the University of Missouri) — 48%; Manhattan, Kansas (home to Kansas State University) — 45%; Bloomington, Illinois (home to Illinois State and Illinois Wesleyan) — 43%; Bloomington, Indiana (home to Indiana University) — 43%; Champaign, Illinois (home to the University of Illinois) —42%; and Rochester, Minnesota (home to the University of Minnesota-Rochester) — 39%.
Lawrence is both a source of premier education and an attractive destination for educated individuals and the businesses they support.
Percentage of residents age 25 and older with bachelor’s degree or higher level of educational attainment, 2018
Source: U.S. Census Bureau, EY
Lawrence, KS Economic Overview
Lawrence, KS, 56.2%
Texarkana. AR, 19.2%
1

Equity
To many, a truly successful economy provides equal access to opportunity for all residents. Research also suggests that more equitable communities grow more quickly — helping their residents fulfill their potential and attracting new business and residents alike.
18
Lawrence may appear to have above average poverty level, but these data are often exaggerated by the large number of student residents, many of whom are technically unemployed, earning no income and below the poverty level. Nonetheless, enrolled students make up 22% of Lawrence’s population – the third highest among benchmarks – and nearly 56% of enrolled students are in poverty – the 7th highest among benchmarks.
Among the rest of the population, the poverty level in Lawrence was 10% in 2018 - the ninth lowest among all the benchmarks. But there are significant disparities between residents of different ethnicities.
In 2018, the ratio of non-white poverty rate to white poverty rate for non-student-age residents was 3.6 — meaning people of color are 3.6 times more likely to be in poverty in Lawrence. This was the 8th highest racial poverty gap among the benchmark cities.
The gap between the haves and have-nots in Lawrence is also high. The ratio of household income of the bottom 20% of households to the top 20% was 15.9 — the 11th highest among benchmarks.
On a more positive note, non-white residents and white residents have the same level of educational attainment. This indicates, however, that barriers to success other than education exist for people of color in Lawrence.
Ratio of non-white poverty rate to white poverty rate (excluding individuals ages 18 to 24), 2018
Source: U.S. Census Bureau, EY
Lawrence, KS Economic Overview
St Joseph, MO, 1.0
3.6
St. Cloud, MN, 4.6
33

Small business and entrepreneurship
Small businesses are the core of the American economy, accounting for the majority of new job creation and offering pathways to wealth creation for families. It is important to distinguish between the needs of traditional brick-and-mortar small businesses and new technology-based startups and entrepreneurial endeavors.
19
Lawrence has the highest share of small businesses (those with fewer than 20 workers) among the 40 benchmarked communities.
This is reflective of the community’s strong foundation in locally owned retail and restaurants and other small businesses.
Lawrence also has an important startup and entrepreneurial culture. It is more difficult to measure this community with data, but we found that Lawrence has the sixth-highest concentration of self-employed workers among the benchmarks — with seven self-employed workers per 100 residents.
Many entrepreneurs and startups are affiliated with the Bioscience & Technology Business Center (BTBC), which continues to be a highly successful business incubator funded through a partnership between the University of Kansas, City of Lawrence and Douglas County.
The success of small businesses in Lawrence demonstrates the viability and community support for them, but interviews identified many opportunities to enhance resources and better connect both traditional small business and technology entrepreneurs within the community through improved access to funding, technical assistance and more.
Share of establishments with less than 20 workers, 2018
Source: U.S. Census Bureau, EY
Lawrence, KS Economic Overview
Lawrence, KS, 85.8%Oshkosh, WI,
78.9%
1
Research and innovation
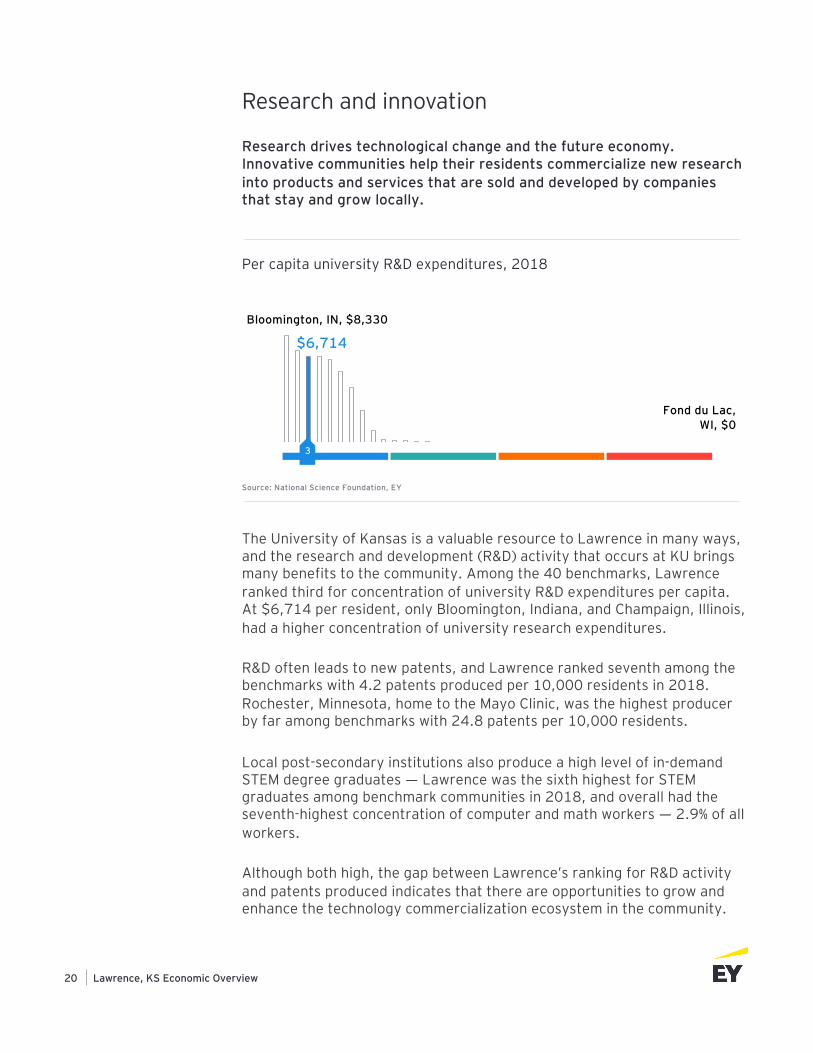
Research drives technological change and the future economy. Innovative communities help their residents commercialize new research into products and services that are sold and developed by companies that stay and grow locally.
20
The University of Kansas is a valuable resource to Lawrence in many ways, and the research and development (R&D) activity that occurs at KU brings many benefits to the community. Among the 40 benchmarks, Lawrence ranked third for concentration of university R&D expenditures per capita. At $6,714 per resident, only Bloomington, Indiana, and Champaign, Illinois, had a higher concentration of university research expenditures.
R&D often leads to new patents, and Lawrence ranked seventh among the benchmarks with 4.2 patents produced per 10,000 residents in 2018. Rochester, Minnesota, home to the Mayo Clinic, was the highest producer by far among benchmarks with 24.8 patents per 10,000 residents.
Local post-secondary institutions also produce a high level of in-demand STEM degree graduates — Lawrence was the sixth highest for STEM graduates among benchmark communities in 2018, and overall had the seventh-highest concentration of computer and math workers — 2.9% of all workers.
Although both high, the gap between Lawrence’s ranking for R&D activity and patents produced indicates that there are opportunities to grow and enhance the technology commercialization ecosystem in the community.
Per capita university R&D expenditures, 2018
Source: National Science Foundation, EY
Lawrence, KS Economic Overview
Bloomington, IN, $8,330
$6,714
Fond du Lac, WI, $0
3

Arts and culture
Arts and culture are essential to the quality of life in a community but are also important economic drivers. They draw in visitors from outside the community who spend money locally and bring together residents to celebrate and do the same. They are important for their own sake and for the economic health and vitality of a community.
21
Lawrence is recognized for its arts and culture, with a vibrant music scene, theatrical performances, artists, visual arts displays, literature and much more. All of these affiliated artists, performers, organizations and establishments contribute to the character and culture that residents and visitors love about the community.
According to an arts and economic prosperity study in 2017, the arts and culture industry created over $30,760,000 in total spending in Lawrence. This accounted for 1,061 full-time jobs, $19,290,000 in household income and $1,255,000 in local government revenue.
On a per capita basis, the arts and culture industry accounted for $264 in spending per resident of the City — the 28th highest out of 60 cities, counties and jurisdictions with 100,000–250,000 residents across the country, and the highest in Kansas.
The arts and culture industry, like others, is currently hurting during the COVID-19 pandemic. Conversations with members of this community in Lawrence reveal a desire for additional support to ensure they not only survive the pandemic but emerge stronger than before.
Per capita spending in the nonprofit arts and culture industry, 2017
Source: Arts and Economic Prosperity 5, Americans for the Arts, EY
Lawrence, KS Economic Overview
West Palm Beach, FL, $2,134
$264 Columbia County, GA $1
28

Retail and restaurants
The availability of retail and restaurants affects a community’s quality of life, brings in outside visitor dollars and creates wealth within a city. Businesses and talented workers often choose to live in locations with access to shopping and dining amenities, making communities with a robust food scene or great shopping overall more successful.
22
Compared with its benchmark communities, Lawrence has more restaurants and bars per 10,000 residents than almost every other community. Lawrence ranks fourth out of the benchmark communities with 233 full-service bars and restaurants per 10,000 residents.
Lawrence is known for its great quality of life, and many stakeholders specifically mentioned an excellent food scene as part of what makes Lawrence a great place to live. Access to restaurants and retail is an attractive quality-of-life amenity for almost any age group — so whether it’s a high school graduate trying to decide where to go to college or a professional with a family looking for a good place to live, Lawrence’s retail and restaurant offerings make it very attractive.
A robust restaurant scene was also mentioned frequently as a big draw for tourists, who bring outside dollars to the community. Increasingly, placemaking and place promoting play an important role in supporting retail and restaurants. Increased efforts to revitalize downtown and invest in placemaking across the city have the potential to continue enhancing Lawrence’s retail and restaurant community while also improving the city’s brand and image across the state and nation.
Full-service restaurants and bars per 10,000 residents, 2018
Source: EMSI, EY
Lawrence, KS Economic Overview
La Crosse, WI, 270.4
232.9Sherman, TX, 128.0
4

23 Lawrence, KS Economic Overview
Natural environment
The environment is a core quality-of-life amenity — representing the foundation for all life in a community. A beautiful natural environment cannot be re-created by other communities. It is a precious resource that often requires dedicated conservation and preservation efforts to protect.
Through conversations, interviews and the survey, it is clear that the residents of Lawrence recognize the important role the natural environment plays in the community. It plays an important role in the area’s history and local culture. It is also an important part of the local economy, contributing to a robust local food system that supports restaurants, farmers, citizens and overall health. The incorporation of local foods into mainstream culture in Lawrence is a great example of the community celebrating the natural environment while also promoting the local economy.
The commitment to respecting, protecting and celebrating the environment is a noticeable aspect of Lawrence’s culture. The focus goes beyond the environment outdoors to include creating sustainable buildings, utilities and transportation.
Lawrence’s natural environment offers great recreational activities for locals. There are more than 70 miles of trails and paths that can be used for walking, jogging or biking. Lawrence also has approximately 3,500 acres of open space in 54 parks, which is an incredible amount for a community the size of Lawrence. This network of green space is a unique asset for the community.
Throughout stakeholder input, there was a strong interest in preserving natural lands in Douglas County. While most everyone acknowledged the need to grow and change, it was clear that the community wants that growth to be intentional. To address these concerns, the economic development strategy could prioritize protecting and preserving the natural environment. This is a lifestyle amenity that few other communities can claim, that has an impact on the local economy and that is historically and culturally important to many residents.

Affordability
Regions with high costs of living may find it difficult to attract and retain talent. A higher cost of living disproportionately affects lower-income families and may create socioeconomic imbalances and hiring challenges for many “working” occupations — including teachers, nurses, hospitality workers and more.
24
Lawrence has a low cost of living compared with many benchmark communities. On a cost-of-living index that includes housing, with 100 being average, Lawrence’s index is 93.8, making it affordable than the national average. Lawrence is also more affordable than some of its notable Kansas neighbors, including Manhattan and Topeka. A low cost of living is attractive to many workers and can be key in retaining them, since wages in Lawrence go further than in 27 other benchmarked communities — and much further than in high-cost coastal cities.
A low cost of living is very attractive to both employers and individuals. For employers, a low cost of living means that a business can offer lower wages while still remaining competitive, as employees do not need as big of a paycheck to thrive compared to larger metros. Workers are attracted to areas with a low cost of living because it means they can stretch their paycheck further, maybe by purchasing a home that in a large metro has been unaffordable or by having more disposable income.
It is important to note that while Lawrence has an overall low cost of living compared with the national average, it remains expensive for many who live and work in the city. As discussed in the housing section, housing costs are much higher than local wages, which creates equity concerns and challenges for the City to support residents of all income levels in the long-term.
Cost of living (100 equals national average), 2019
Source: EMSI, EY
Lawrence, KS Economic Overview
Jonesboro, 87.293.8
Sioux City, 104.1
13

Decatur, IL, 2.9
6.4Manhattan,
KS, 6.7
Housing
The availability of affordable housing plays a critical role in determining a community’s overall quality of life. Communities with higher housing costs typically experience slower growth relative to their more affordable counterparts.
25
At first glance, housing in Lawrence appears relatively affordable. According to data from the U.S. Census Bureau, in 2018 the median price of a house in Lawrence was less than $210,000. Nationally, median home prices approached $230,000 in 2018.
The façade of affordability, however, falters upon further inspection. While median home prices in Lawrence are 10% less than the national figure, local wages are nearly 40% lower. Nationally, median home prices are 4.3 times greater than median wages, but the ratio in Lawrence is 6.4. Among the 40 examined benchmark communities, only Manhattan, Kansas, has more expensive housing relative to local wages.
As a result of the disparity between housing costs and wages, relatively few workers employed within Lawrence can become homeowners without spending a disproportionate share of their income on housing costs. This in turns pushes workers outward in search of affordable housing.
On a positive note, Lawrence is constructing new housing at a pace ahead of most benchmark communities. According to the U.S. Census Bureau, from 2013 to 2018, the number of housing units in the City grew 7% — the sixth highest among benchmarks. Costs remain high, however, indicating that other factors are contributing to the price of housing.
Ratio of median value of owner-occupied housing to median wage, 2018
Source: US Census, EMSI, EY
Lawrence, KS Economic Overview
39

Oshkosh, WI, 100.0%
25.5%
Lawton, OK, 4.8%
Broadband
While broadband accessibility has long been viewed as an important community asset, the pandemic further underscored its essential role in facilitating work, education and health care delivery.
26
According to data from the Federal Communications Commission (FCC), barely 1 in 4 Lawrence households has access to internet speeds of 250 megabytes per second. Only Lawton, Oklahoma, has lower broadband penetration. In all but six of the examined benchmarks, at least 85% of households have access to high-speed broadband.
Notably, FCC data is typically a best-case scenario; the agency’s methodology typically overstates the number of households with access to broadband internet. In less-urban areas, the difference between FCC broadband coverage estimates and reality can be especially pronounced.
Ultimately, the absence of fast and reliable broadband access can limit job creation, hamper educational opportunity and threaten quality of life. Broadband internet, for example, is often critical for information technology and professional services businesses, as well as fledging entrepreneurs. The rise of online learning and telecommuting are only possible due to the local availability of affordable and reliable internet. With a growing number of services moving online, including education and health care, robust internet access is also increasingly imperative to maintaining a community’s living standards.
Percent of households with access to 250 Mbps broadband, 2019
Source: Federal Communications Commission, EY
Lawrence, KS Economic Overview
39

Tyler, TX, 5% 6%
Kankakee, IL, 18%
Transportation and mobility
Across the US, it is often necessary to own or have access to a motor vehicle in order to reach jobs, attend school, buy groceries, access health care and much more. The availability of public transportation plays an important role in providing those without vehicle access to these same necessities, while also protecting the environment.
27
Most households in Lawrence have access to at least a vehicle. In 2018, only 6% of households did not have access to a vehicle, the fourth lowest among the benchmark communities.
Also, a relatively high share of commuting residents use public transportation to get to work — 3.6% in 2018 — the eighth highest among the benchmark communities.
Despite relatively high levels of mobility and transportation access, considering transportation access throughout economic development efforts remains important — especially from an equity perspective. Generally, those households lacking vehicle access are frequently lower-income, elderly or disabled — populations that already face greater barriers to leading healthy and productive lives.
Share of households without access to a vehicle, 2018
Source: Federal Communications Commission, EY
Lawrence, KS Economic Overview
4

0
50,000
100,000
150,000
200,000
250,000
6th &
North
Alvamar &
Wes
t
Downt
own
East 23rd
North L
awre
nce
South Io
wa
Univers
ity
West 23rd
Office and industrial real estate
For businesses to exist in a community, they must have places to locate — generally either office or industrial real estate. The size, type and price of real estate available or potentially able to be constructed can help determine what types of businesses will grow, stay and locate in a city.
28
Office and industrial space are relatively plentiful in Lawrence, but some office space may require renovations and updates to match expectations of businesses in the market.
The greatest availability of office space in Lawrence is in the downtown submarket. Offices in this area should be some of the most attractive, because many officer users want to locate near dining, shopping and residences. The high vacancy in this area may indicate a need for updates to properties or surrounding areas. Continued efforts to improve office in locations that support live/work opportunities pursued by businesses will be easier to fill and attract new tenants.
Industrial vacancy rates are much lower in Lawrence — indicating high demand for this type of real estate product. The East Hills Business Park continues to be successful, and Lawrence VenturePark has begun to develop sites for companies. VenturePark continues to offer potential through the VanTrust spec building and lots available for new construction.
Overall, Lawrence appears to have available existing buildings or properties for development to accommodate the needs of a diverse range of businesses. The challenges heard from stakeholders have more to do with costs and restrictions on development, which will be discussed more on the business climate page.
Office vacancy by Lawrence submarket, 2019
Source: Colliers International, EY
Lawrence, KS Economic Overview
11.25%
23.91%
7.19%6.49%
0.22% 10.74%0.00% 0.00%

Business climate
Business climate is a broad term but generally describes the conditions under which businesses can operate in a community. This can cover tax rates, regulations, development processes, community support and more.
29
Business climate is a difficult topic to describe, because the qualities of a community’s business climate are usually subjective vs. objective. Different people or businesses may each perceive a community as more or less friendly to businesses based on their own experiences and observations.
As a whole, Lawrence is fairly divided on this topic. When asked if they would consider Lawrence a business-friendly community, 57% of respondents to a community survey said yes, and 43% said no.
In conversations with local business owners and developers, many expressed frustrations with the City’s property development process —suggesting that it was inconsistent, costly and time consuming. These impressions, even if anecdotal, can easily deter outside businesses and developers from pursuing new opportunities in Lawrence.
These stories were heard relatively consistently, and efforts by the City and business community to better understand any challenges in the system are ongoing. Continuing these efforts can help clarify the situation and potentially identify opportunities to improve the real and perceived business climate while also protecting the values and health of the community for which regulations are intended.
Survey — Would you consider Lawrence a business-friendly community?
Source: Lawrence Economic Development Strategy Community Survey
Lawrence, KS Economic Overview
NoYes

Fiscal sustainability
A diversified tax base not only helps insulate a community from volatility associated with any one revenue source, but also ensures that the burden of funding public operations does not fall disproportionately on a single type of economic activity, such as residential, which can increase the cost of living and lead to unsustainable outcomes.
30
According to the City of Lawrence’s 2019 Comprehensive Annual Financial Report (CAFR), charges for services and sales tax were the two largest sources of revenue — both higher than the average of the other nine largest cities in Kansas. Sales taxes comprised 25% of the City’s revenues (compared with 21% of peers), and charges for services comprised 43% (compared with 31% of peers).
Property taxes comprised 19% of the City’s revenues — slightly below the peer average of 21%. Compared with peers, Lawrence is less dependent on municipal operating and capital grants, which comprise only 4% of the City’s revenues compared with 14% for peers on average.
This distribution of City revenues could have a few implications. One is that the City’s budget is vulnerable to disruptions, such as the COVID-19 pandemic, that lead to declines in retail sales. Charges for services can also raise the costs of living and doing business in a community, which can disproportionately impact lower-income individuals.
Creating more diverse non-residential businesses is one way that cities increase revenues without burdening residents. Research shows that commercial and industrial properties generate more tax revenues than they cost in services, while residential development produces the opposite —higher costs than revenues created, which is an unsustainable model.
Lawrence 2019 total government revenues
Source: Cities of Lawrence, Wichita, Olathe, Topeka, Shawnee, Manhattan, Lenexa, Overland Park CAFRs, and EY
Other 9-largest Kansas cities 2019 revenue sources
Property tax
Sales tax
Charges forservices
Franchise tax
Operating &capital grants
Other
Property tax
Sales tax
Charges forservices
Franchise tax
Operating &capital grants
Other
$254.5mAverage Revenue (US$)
$196.2mTotal Revenue (US$)
Lawrence, KS Economic Overview

31
Strengths, weaknesses, opportunities and threats (SWOT) assessment
Lawrence, KS Economic Overview
Building on strengths to address challenges
The strengths, weaknesses, opportunities and threats (SWOT)analysis on the following pages summarizes Lawrence’s competitive economic position and future opportunities through the holistic lens.
The conclusions in this section are drawn from analysis of quantitative data; qualitative information gathered from interviews, focus groups, surveys, and reports; and EY’s national perspective and subject-matter specialization in this field.
The overall findings in this section lay a foundation of strengths on which Lawrence can build future economic development opportunities. They should also help identify and prioritize strategic actions to address local challenges going forward.

Strengths• The population of Lawrence is highly educated, which is attractive to
businesses in an increasingly knowledge- and skills-based economy. • Lawrence is home to the University of Kansas and Haskell Indian Nations
University, both of which are significant drivers in the local economy. Beyond attracting and educating residents, the universities bring jobs and investment, attract visitors to events and contribute to research and innovation.
• Peaslee Tech offers specialized training and other workforce development programs that support employer needs and offer promising career pathways to individuals.
• Lawrence is a center for research and innovation, with strong assets in the University of Kansas and Bioscience & Technology Business Center (BTBC). A partnership between KU, the City of Lawrence, Douglas County and the chamber, the BTBC has been tremendously successful incubating new companies.
• Douglas County, the City of Lawrence, the chamber and other organizations overall have strong partnerships within the community. KU and Haskell University are increasingly more proactively involved with partners around community and economic development. Overall, response to the COVID-19 pandemic has increased cooperation and collaboration across the county and region.
• Lawrence is recognized and loved for its culture and character, with an historic downtown, a high concentration of small, often locally owned, businesses — especially retail establishments and restaurants — and a vibrant arts community. These factors contribute to Lawrence being the No. 1 tourist destination in Kansas.
• Lawrence has a robust local food ecosystem and a history of environmental protection and preservation.
• Compared with larger metropolitan areas, especially on the coasts, Lawrence is relatively affordable and offers a high quality of life, including high-performing schools.
• The natural environment is easily accessible within and from Lawrence —with extensive outdoor recreation opportunities.
• Lawrence features a relatively mild and safe climate. Lawrence’s location also provides strong logistical access via rail and highway. Lawrence is also surrounded by two larger metropolitan statistical areas — Topeka and Kansas City — which provides the city with benefits of being part of a larger and more diverse regional economy.
32 Lawrence, KS Economic Overview
Anonymous survey respondent
Lawrence loves its local businesses —and that's an awesome thing. “
Weaknesses• It is difficult to objectively measure the business climate in a community,
but there is a common perception that Lawrence is not a business-friendly community. Many stakeholders expressed this opinion directly, and it was shared by 42% of community survey respondents. Anecdotally, these perceptions are often based on regulations around real estate development and public opposition to new businesses and development projects in the community. Some stakeholders perceive that the City can be inconsistent and challenging to work with.
• Lawrence lacks business diversity, with a heavy concentration of local jobs in education, retail and entertainment, which are not primary, income-generating industries. Education, the largest industry in the city, is also not a tax revenue generator. Along with an overall lack of business diversity, this puts a heavy tax burden onto residents. Limited economic diversity also makes Lawrence less resilient to disruptions like the COVID-19 pandemic, which has impacted all three of Lawrence’s largest employment sectors.
• Lack of business diversity also contributes to limited career opportunities for residents, which is perceived as a significant challenge in Lawrence. When asked in the community survey, 89% of respondents felt that Lawrence is not an easy place to find a high-paying career, and data backs this up.
• Residents of Lawrence face distinct economic disparities based on ethnicity and income level. Residents are concerned about equity overall.
• Although Lawrence is affordable relative to larger metropolitan areas in the US, the city is highly unaffordable relative to local wages. The cost of housing is well beyond the means of most local workers.
• Being part of a larger regional economy that includes Topeka and Kansas City has benefits for Lawrence; it also allows many residents to commute outside the county to higher-paying jobs in neighboring locations. An exchange of commuting workers is inevitable based on Lawrence’s location, but because of Lawrence’s desirability as a place of live, it can contribute to affordability challenges without strong growth of local higher-paying jobs.
• Lawrence’s historic downtown is attractive and celebrated by residents, but some buildings have potential for greater utilization.
• High-speed broadband access is poor across much of Lawrence.
33 Lawrence, KS Economic Overview
Anonymous survey respondent
It is a hard place to find a job that makes a living wage, much less a high paying career, simply because the jobs aren't there.
“

Opportunities• As a community with attractive culture, good schools and an overall high
quality of life, Lawrence could be well positioned to grow its knowledge economy and freelance worker population — especially in light of migration trends related to COVID-19.
• Lawrence has assets that support a wide range of business types and could potentially attract more employers that match the character of the community and also offer higher-paying career opportunities for local residents.
• Lawrence’s relatively large Native population and overall connections to Native communities across North America present unique opportunities to grow indigenous businesses and investments.
• With continued expansion of the entrepreneurial ecosystem and infrastructure, Lawrence has the potential to be a major center for technological commercialization and new business creation.
• Increased business diversity and career opportunities could reduce ethnic disparities within Lawrence if undertaken with a focus on inclusion and equity. Communities that support ethnic diversity and tackle equity are themselves more attractive to people and businesses.
• Growth limits combined with policies and regulations to encourage more dense redevelopment and infill could accelerate housing construction, making Lawrence more affordable, accessible and environmentally sustainable.
• A focus on enhancing local retail, dining and arts could accelerate wealth generation, improve quality of life and attract more visitors to spend money locally — all of which would help Lawrence emerge stronger and more resilient from the COVID-19 pandemic. As the top destination in Kansas, Lawrence is presented with an opportunity to partner with these establishments and figure out a new model for operating in and after the pandemic.
• Strategic efforts could encourage new investment in downtown and other geographic parts of town to make areas more vibrant and active and to support recovery from COVID-19.
• Investments along the Kansas River could improve access to this important amenity and create new opportunities for recreation and retail.
34 Lawrence, KS Economic Overview
Anonymous survey respondent
We need to find ways to improve the lives of the people already living and working here for whom there are fewer economic choices than for others.
“

Threats• This threat is not unique to Lawrence, but without additional support
there is a chance that retail, restaurants and cultural establishments, such as music venues, will not fully recover from COVID-19. Many of these establishments rely on institutional knowledge and relationships to operate that cannot be easily replaced.
• A primary threat facing Lawrence is that the city becomes primarily a bedroom and retiree community — with most residents working outside the community or not at all. This situation could acerbate inequalities and make the city even more expensive, as the tax burden shifts further to residential and those working in health care, government, and other areas are forced to live outside the community.
• Without proactive investments and support, Lawrence could lose career-and tax-generating business opportunities to other cities in Kansas and across the nation. Loss of tax revenue could lead to degradation in public services and amenities as they become more challenging to provide with an increasingly residential tax base.
• Poor high-speed broadband access could prevent many businesses from adopting new online business models, limit the ability to support and grow technology startups and freelance workers, and acerbate economic disparities in the community.
• KU could see increased distance learning and decreased enrollment, which might reduce the student population in Lawrence and have a negative economic impact on the local economy.
• Perceived and real development restrictions could slow redevelopment and home construction, further increasing the cost of living.
• Downtown could retain its buildings and structure exactly as is but become outdated and lose economic activity that makes it a viable and attractive place for businesses, residents, and visitors.
• Young people graduating from high school and college could leave in greater numbers due to lack of entry-level career opportunities and return less frequently due to high costs and limited job availability at more senior levels as well.
• Increasing expenses and limited job opportunities for individuals with skills and training between high school and a bachelor’s degree could further increase economic disparities in the community.
• Continued business as usual could prolong and increase ethnic disparities, which are currently systemic outcomes.
35 Lawrence, KS Economic Overview
Anonymous survey respondent
We need a general attitude of embracing progress and growth if we are to thrive as anything other than an eventual suburb of Kansas City.
“