launching a campus sustainability newsletter
TRANSCRIPT

TRACS 2016: UT Rio Grande Valley
Presenter: Richard R. Johnson, Rice University
February 2, 2016
Launching a Campus Sustainability Newsletter
Photo by Neil Martin

I. Digital Communications Strategy
II. Newsletter Benchmarking Process
III. Rice Newsletter and Lessons Learned
Overview

Digital Communications Strategy

Audience Census
Communications Channel Yes / No
Web site
Newsletter
YouTube (dedicated channel)
Blog
Listservs, email groups, etc.
Google Plus

Newsletter Benchmarking Process

Sample Group (n=10)
We initially reviewed the design and content of over 30 campus sustainability newsletters.
Ten newsletters stood out above the rest: Iowa State University, Michigan State University, Missouri State
University, Montana State University, Northwestern University, Princeton University, Stanford University, Tufts
University, University of Michigan, and Washington University in St. Louis. This became our interview group.

Benchmarking Topic 1: Frequency of the Newsletter

Frequency
• 8 of 10 of the universities in our sample publish their newsletters monthly.
The other 2 publish every other week. Some alter their publication
frequency when school is not in session.
• The consensus opinion was to send out the newsletter mid-week,
preferably Wednesday or Thursday.
• Many advised that the morning is the best time of day to distribute the
newsletter.
• The respondents indicated having a set schedule is important.
• While a set schedule is important, so is having meaningful content. The
respondents advised that we avoid sending out anything lacking in
substance just to meet a self-imposed publication deadline.

Benchmarking Topic 2: Target Audience

Target Audience
• 4 of 10 of the universities have students as their only primary target
audience.
• 2 of 10 of the universities have faculty and staff as their only primary target
audience.
• 4 of 10 of the universities had no particular target audience.
• The variations in the target audiences was often reflected in the design of
the newsletter itself.
• Those newsletters with multiple audiences had a more “balanced” feel, with
target sections. Those with narrower audiences not surprisingly geared
their content for that specific group.

Benchmarking Topic 3: Size of Audience

Size of Audience
0%
5%
10%
15%
20%
25%
30%
35%
< 100 100 to 1000 1000 to 2500 2500 to 5000 > 5000
% o
f In
stit
uti
on
s Su
rvey
ed
Range of Subscriber Size
Number of Newsletter Subscribers
Does this really tell us anything?
Size of Audience
• The variation in subscriber base was not surprising considering the range
in institutional size in our sample group. Therefore, we needed a better
way to think about audience size.
• We developed a metric for subscribers per enrolled student and found a
range from less than 1% to almost 46%.
• The university with almost 46% subscribers per enrolled student
automatically enrolls all first-year students to receive their newsletter. If we
remove that data point, then the next highest figure is 22%.
• The typical range of subscribers per enrolled student was 6% to 14%.
• Age of newsletter is another factor that affects the number of subscribers.
We found a typical range of between 100 and 1,750 new subscribers per
year (again, when taking out the university with automatic newsletter
enrollment).

Benchmarking Topic 4: Building an Initial Audience

Building an Initial Audience
We identified several common themes regarding building an initial audience for the
newsletter. They are as follows:
• Presence at Events: Eight of the ten universities brought a sign-up sheet and/or
laptop to campus-wide events - specifically student activities fairs, welcome week
events, earth day festivals, and staff events - to build the number of subscribers.
• Utilizing Environmental Leaders: Four of the ten universities reached out to
environmental leaders on the campus to add subscribers and promote their
newsletter, specifically sustainability committees, green team members, EcoReps,
and other student environmental leaders.
• Utilizing Existing Listservs: Five of the ten universities sent their newsletter to
existing environmental listservs, specifically to campus departments and student
organizations.
• Cross Promotion on Social Media: Four of the ten universities cross-promote
their newsletter on their social media pages such as Facebook, Twitter, and
Instagram. One school even uses teasers (“here’s what you missed if you didn’t
sign-up for the newsletter”) to build connections between social media and
newsletter.
• Sign Up on Website: Almost all of the ten universities include a signup link on
their department’s sustainability website.

Benchmarking Topic 5: Selecting Content

Selecting Content: What’s In the Newsletter?
Content Insights:
• Always Use Photos: Pictures are popular, especially those that include people.
Generally photos get more clicks right away over just text.
• Feature Stories About People: Empower people by giving credit, recognizing
the work of others, and focusing on the people behind the work. People have a
strong emotional communication to human stories, especially when they
recognize names.
• Direct Readers to the Web Site: Many of the newsletters will link stories back to
the sustainability web site, thus providing broader coverage and multiple uses for
content while also keeping the web site “fresh”.

Benchmarking Topic 6: Time / Personnel to Create Newsletter

Time / Personnel to Create a Newsletter
0
1
2
3
4
< 10 10 to 25 25 to 50 > 50
# o
f In
stit
uti
on
s Su
rvey
ed
Range of Hours
Hours Spent Preparing Each Newsletter
Of the ten universities that we contacted, seven have staff other than the sustainability
officer who are tasked with creating the newsletter. These staff members typically hold
communications or outreach positions. Student interns are commonly used to help support
(and in some cases lead) the creation of newsletters. There is at least one intern working
on the newsletter for seven out of the ten universities.

Benchmarking Topic 7: Distribution

DistributionEmail Marketing Services
4
1
1
4

Benchmarking Topic 8: Key Metrics

Key Metrics
Seven of ten universities track metrics related to their newsletter. The
most common metrics were:
• Subscribers: number of subscribers, growth of subscriber list,
who’s subscribing/unsubscribing, and people with the most “opens.”
• Clickable Links: click-through rate, percentage of clicks, top links
clicked, what is more popular and why.
• AB Testing: testing content to see what performs best - i.e. subject
line or time of day/week. Clickbait subject titles, such as a summary
of newsletter content, increase the open rate.
• Total Hits: number of emails sent, percentage of opens
• Website Traffic: how many people driving to web site. In order to
keep the sustainability website traffic, some universities link their
newsletter and all of its stories and events back to their web site.
The website traffic is trackable via Google Analytics or Bitly.

Rice Newsletter and Lessons Learned

Rice University Sustainability Newsletter Facts
Key data points regarding the Rice University Sustainability Newsletter
include:
• Launch Date: October 2015.
• Frequency: Monthly.
• Target Audience: The Rice community, broadly defined.
• Number of Subscribers: 196 (as of Jan 27, 2016)
• Time to Create: About 20 hours. The process is intern-led.
• Distribution Method: MailChimp

Rice University Sustainability Newsletter Features
Consistent Header
Lead Feature

Section Headline
Additional Content
Section Break

Headline, short
blurb, read more
Note need for
balanced descriptions
For student-oriented or
student-led content

Content featuring
popular professor with
outstanding video
All content in this
section generated by
Rice News, part of the
Public Affairs group
Focus on faculty and
graduate students

Focus on internships,
entry-level and early
career jobs, grants, etc.
Begging for Money
A curated selection of
upcoming events
Social Media links

Analytics
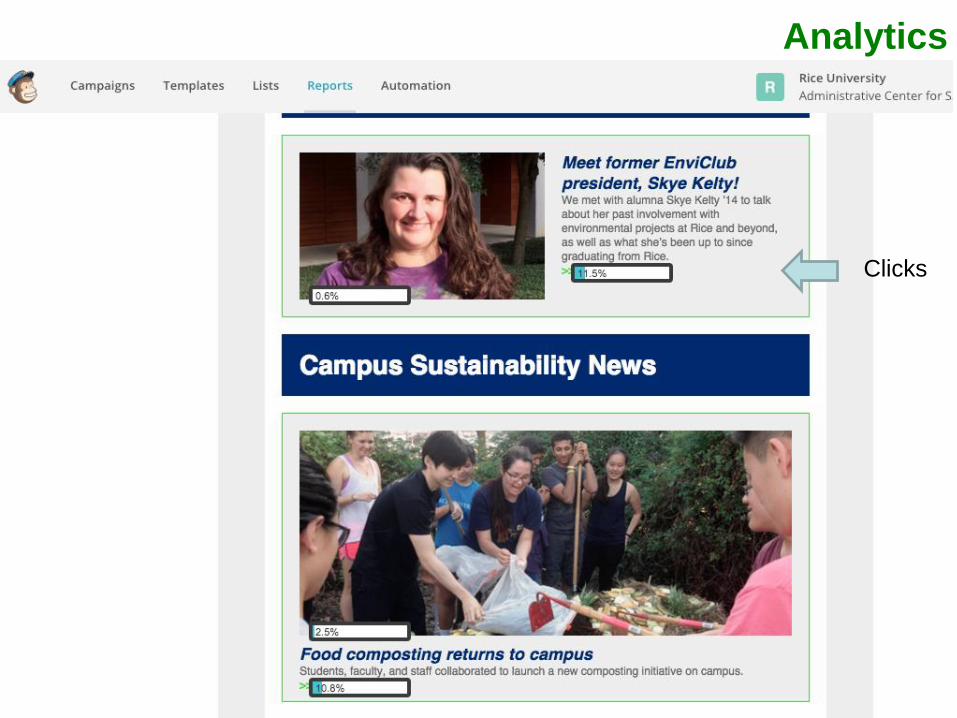
Clicks
Analytics

Lessons Learned
Key lessons regarding the Rice University Sustainability Newsletter
include:
• Template Design (kicking cooks out of the kitchen)
• Content categories (harder than you would think)
• Frequency (about those holidays…)
• Best feature: Sustainability Spotlight
• Leveraging Content (the Tom Sawyer approach)
• Synergy with Web Site and Social Media
• What takes up my time…
So, the key question I should answer: Is it worth doing?

Questions?
Contact Information:
Richard R. Johnson
Email: [email protected]
Phone: (713) 348-5003
See http://sustainability.rice.edu
Like Sustainability at Rice on Facebook
Follow @SustainableRice on Twitter and Instagram
Special thanks to Veronica Johnson for her
assistance with the Newsletter! Photo by Jackson D. Myers