lattice strain and texture evolution during room
TRANSCRIPT

LATTICE STRAIN AND TEXTURE EVOLUTION DURING ROOM-TEMPERATURE DEFORMATION IN ZIRCALOY-2
by
Feng Xu
A thesis submitted to the Department of Mechanical and Materials Engineering
in conformity with the requirements for
the degree of Doctor of Philosophy
Queen’s University
Kingston, Ontario, Canada
December, 2007
Copyright ©Feng Xu, 2007
i
A-PDF MERGER DEMO

ii
Abstract
Zircaloy-2 and its sister alloy, Zircaloy-4, have extensive applications in the nuclear industry as
core components in heavy water reactors and fuel cladding in both heavy and light water reactors.
Intergranular stresses and texture can greatly affect the mechanical performance of these
components. A complete understanding of the development of intergranular constraints and
texture in Zircaloy-2 will allow an improved understanding of the plastic deformation of
zirconium alloys, and the prediction of in-reactor deformation of tubes made by different
manufacturing routes.
Neutron diffraction was used to track the development of lattice strain and peak intensity in
three dimensions for various crystallographic planes in samples cut from a rolled Zircaloy-2 slab.
The samples were subject to room temperature compression or tension in-situ in the neutron
spectrometer in each of the three principal directions of the slab. Textures in the deformed
samples were measured using neutron diffraction. Strong evidence was found for tensile
twinning in tensile tests in the plate normal direction and compression tests in the transverse and
rolling directions. The lattice strain development inside the newly formed twins was recorded for
the first time in a Zr alloy.
An elasto-plastic self-consistent model and a visco-plastic self-consistent model were used to
interpret the lattice strain and texture data, respectively. Various slip and twinning modes were
considered in both models. Prism <a> slip, basal <a> slip, pyramidal <c+a> slip and tensile
twinning were concluded to be indispensable, while pyramidal <a> slip was unnecessary in the
modeling. The critical resolved shear stresses and hardening parameters were obtained by
simultaneously achieving a ‘best-fit’ with the complete experimental data set. The effects of
anisotropic latent hardening due to dislocation interactions were found to be critical, and the
inclusion of Lankford coefficients as modeling constraints was necessary.

iii
This research provided a comprehensive experimental data set obtained by neutron
diffraction, forming a sound basis to investigate active plastic deformation mechanisms and to
rigorously test plasticity models and twinning models. The research also made a substantial
improvement in understanding the plastic deformation of Zircaloy-2 through polycrystalline
modeling by introducing extensive data sets to constrain the modeling parameters.

iv
Acknowledgements
I thank Professors Rick Holt and Mark Daymond for their guidance, encouragement and steadfast
support. They are great advisors and source of inspiration. I have learned so much from them over
these years.
I thank the following persons for their respective contributions.
- Ron Rogge and Mike Ghargouri (NRC, Chalk River Laboratories): Constant-wavelength
neutron diffraction measurements and in-situ tensile tests.
- Ed Oliver and Javier Santisteban (ISIS Spallation Neutron Source, UK): Time-of-flight neutron
diffraction measurements and in-situ compression tests.
- Carlos Tomé (Los Alamos National Laboratory, US), Tom Holden (Northern Stress
Technologies) and N. Christodoulou (AECL): EPSC and VPSC modeling
- Brian Leitch (AECL): Monotonic tensile tests
- Larry McEwan, Corey Fowler (Queen’s) and Charlie Cooney (Queen’s): Sample preparation
- Tom Holden (Northern Stress Technologies), John Fox and Jimmy Bolduc (NRC): Thermal
residual strain measurements
- Igor Yakubtsov (McMaster University): Microstructure studies
- Dave Durance (Bruce Power): Texture measurements
- Matthew and Kemp (Queen’s): Monotonic mechanical loading
- Current and former members of the Nuclear Group (Queen’s): Helpful discussions
I thank my parents and my wife for their love and encouragement.
This research work was sponsored by NSERC, COG, OPG and Nu-Tech Precision Metals under
the Industrial Research Chair Program in Nuclear Materials at Queen’s University.

v
Table of Contents Abstract ............................................................................................................................................ ii Acknowledgements ......................................................................................................................... iv Table of Contents ............................................................................................................................. v List of Figures .................................................................................................................................. x List of Tables ................................................................................................................................. xv
Glossary ........................................................................................................................................ xvi
Chapter 1 Introduction ................................................................................................................. 1
1.1 Applications of zirconium alloys in the nuclear industry .......................................................... 1
1.2 Intergranular stress, texture and deformation mechanisms ........................................................ 2
1.3 Description of the material ......................................................................................................... 4
1.4 This Research ............................................................................................................................. 5
1.4.1 Motivation ......................................................................................................................... 5
1.4.2 Objectives ......................................................................................................................... 6
1.4.3 Guide to the thesis ............................................................................................................. 7
References ...................................................................................................................................... 10
Chapter 2 Literature Review ..................................................................................................... 13
2.1 Physical properties of single crystal zirconium ....................................................................... 13
2.2 Deformation mechanisms in polycrystalline Zr and Zr alloys ................................................. 17
2.3 Crystallographic texture ........................................................................................................... 19
2.4 Intergranular (Type-2) stress .................................................................................................... 22
2.5 Neutron diffraction ................................................................................................................... 25
2.5.1 CW neutron diffraction for strain measurement at L-3, NRU ........................................ 26
2.5.2 TOF neutron diffraction for strain measurement at Engin-X, ISIS................................. 30
2.5.3 CW neutron diffraction for texture measurement at E-3, NRU ...................................... 34
2.6 Polycrystalline modeling ......................................................................................................... 36
2.6.1 Issues in polycrystalline modeling .................................................................................. 40
2.7 Relevant studies ....................................................................................................................... 43
2.7.1 Experimental lattice strain and texture data .................................................................... 43
2.7.2 Interpretations of lattice strain and texture evolution ..................................................... 45
References ...................................................................................................................................... 57

vi
Chapter 3 Evolution of Lattice Strains in Three Dimensions during In-situ Compression of
Textured Zircaloy-2 ............................................................................................................... 65
3.1 Introduction .............................................................................................................................. 65
3.2 Experimental procedure ........................................................................................................... 66
3.3 Results ...................................................................................................................................... 68
3.4 Discussion ................................................................................................................................ 75
3.5 Conclusion ............................................................................................................................... 82
References ...................................................................................................................................... 83
Chapter 4 Development of Lattice Strains in Textured Zircaloy-2 during Uni-axial
Deformation ............................................................................................................................ 85
4.1 Introduction .............................................................................................................................. 85
4.2 Material and experimental procedure ...................................................................................... 88
4.3 Results ...................................................................................................................................... 96
4.3.1 Evidence for tensile twinning ......................................................................................... 96
4.3.2 Macroscopic behavior ..................................................................................................... 98
4.3.3 Lattice strain evolution ................................................................................................. 101
4.4 Discussion .............................................................................................................................. 114
4.5 Conclusion ............................................................................................................................. 116
References .................................................................................................................................... 117
Chapter 5 Modeling Lattice Strain Evolution during Uni-axial Deformation in Textured
Zircaloy-2 .............................................................................................................................. 121
5.1 Introduction ............................................................................................................................ 121
5.2 Summary of experimental work ............................................................................................. 124
5.3 Simulations using the elasto-plastic self-consistent model .................................................... 127
5.4 Comparison of model results with experiment ...................................................................... 133
5.4.1 Macroscopic behavior ................................................................................................... 134
5.4.2 Lattice strain evolution ................................................................................................. 137
5.5 Discussion .............................................................................................................................. 150
5.5.1 Activities of the deformation modes ............................................................................. 150
5.5.2 Micro-yielding .............................................................................................................. 152

5.5.3 Roles of prism <a> and basal <a> slip .......................................................................... 153
5.5.4 Influence of latent hardening ........................................................................................ 154
5.5.5 Other possible deformation mechanisms ...................................................................... 157
5.6 Conclusion ............................................................................................................................. 158
References .................................................................................................................................... 159
Chapter 6 Evidence for Basal <a> slip in Zircaloy-2 at Room Temperature from
Polycrystalline Modeling ..................................................................................................... 161
6.1 Introduction ............................................................................................................................ 162
6.2 Background ............................................................................................................................ 165
6.2.1 Neutron diffraction measurements ................................................................................ 165
6.2.2 Elasto-plastic self-consistent model .............................................................................. 166
6.2.3 Major findings in the related previous work ................................................................. 167
6.3 Modeling procedure ............................................................................................................... 168
6.4 Modeling results..................................................................................................................... 171
6.4.1 Macroscopic behavior ................................................................................................... 171
6.4.2 Lattice strain development ............................................................................................ 173
6.4.3 Relative activities of slip systems ................................................................................. 180
6.5 Discussion .............................................................................................................................. 183
6.5.1 Effects of twinning ........................................................................................................ 183
6.5.2 Reasonable ranges of CRSS .......................................................................................... 184
6.5.3 Separation of { 1110 } and { 2110 } lattice strains ....................................................... 184
6.5.4 Possibility of pyramidal <a> slip .................................................................................. 185
6.6 Conclusion ............................................................................................................................. 186
References .................................................................................................................................... 187
Chapter 7 Texture Development during Deformation in Zircaloy-2 ................................... 189 7.1 Introduction ............................................................................................................................ 189
7.2 Experimental .......................................................................................................................... 193
7.2.1 Material and samples .................................................................................................... 193
7.2.2 In-situ tension and compression tests ............................................................................ 195
7.2.3 Ex-situ texture measurements ....................................................................................... 195
7.3 Results .................................................................................................................................... 196
vii

viii
7.3.1 Post-deformation textures ............................................................................................. 196
7.3.2 Development of texture coefficients ............................................................................. 200
7.4 Discussion .............................................................................................................................. 207
7.4.1 Similarities regarding texture development .................................................................. 207
7.4.2 ‘Strain-texture’ correlation ............................................................................................ 208
7.4.3 ‘Mechanism-texture’ correlation ................................................................................... 210
7.5 Summary ................................................................................................................................ 220
References .................................................................................................................................... 222
Chapter 8 Modeling Texture Evolution during Uni-axial Loading of Zircaloy-2 ............... 225 8.1 Introduction ............................................................................................................................ 225
8.2 Procedures .............................................................................................................................. 227
8.3 Modeling ................................................................................................................................ 229
8.4 Comparison with experiments ............................................................................................... 236
8.4.1 Macroscopic mechanical responses .............................................................................. 236
8.4.2 Development of texture ................................................................................................. 240
8.5 Discussion .............................................................................................................................. 249
8.5.1 Possible activation of pyr<a> and other types of pyr<c+a> slip ................................... 249
8.5.2 Influences of anisotropic latent hardening effects ........................................................ 251
8.5.3 Twinning activities ........................................................................................................ 252
8.6 Conclusion ............................................................................................................................. 253
References .................................................................................................................................... 254
Chapter 9 General Discussion .................................................................................................. 257 9.1 Introduction ............................................................................................................................ 257
9.2 Comparison of derived characteristics of deformation mechanisms ..................................... 260
9.2.1 Comparing EPSC and VPSC modeling results ............................................................. 260
9.2.2 Comparing derived CRSSs with the literature .............................................................. 263
References .................................................................................................................................... 265
Chapter 10 Conclusions and Future Work ............................................................................. 267 10.1 Conclusions .......................................................................................................................... 267
10.2 Future work .......................................................................................................................... 269

ix
Appendix A Thermal Residual Strains in Zircaloy-2 ........................................................... 271 References .................................................................................................................................... 278
Appendix B Study of In-situ Deformation of Textured Zircaloy-2 by Neutron Diffraction
..................................................................................................................................................... 279
B1 Introduction ............................................................................................................................ 279
B2 Experimental details ............................................................................................................... 282
B3 Results and discussion ............................................................................................................ 284
B4 Conclusions ............................................................................................................................ 290
References .................................................................................................................................... 291
Appendix C Texture Evolution during Compression in Zircaloy-2 ..................................... 293
C1 Introduction ............................................................................................................................ 294
C2 Experimental procedure ......................................................................................................... 296
C3 Self-consistent modeling ........................................................................................................ 299
C4 Results and Discussion ........................................................................................................... 301
C4.1 Macroscopic stress-strain response ............................................................................... 301
C4.2 Measured texture development ..................................................................................... 302
C4.3 Predicted final textures .................................................................................................. 304
C5 Conclusion .............................................................................................................................. 307
References .................................................................................................................................... 308
Appendix D Measured Pole Figures for the Deformed Samples .......................................... 311

List of Figures
Fig. 1-1 Recrystallized grains of the as-received Zircaloy-2 slab
Fig. 1-2 Rolling and recrystallization texture of Zircaloy-2 slab
Fig. 1-3 The relationships among the techniques, data sets and objectives
Fig. 1-4 The relationships among the constituent chapters and appendices
Fig. 2-1 Unit cell structure of zirconium
Fig. 2-2 Possible slip modes (a) and schematic of the twinning modes (b) in hcp zirconium
Fig. 2-3 A typical crystallographic texture of the calandria tubes for Pickering 1, 2 reactors
Fig. 2-4 Type 1 stress varies on a length scale comparable to the macroscopic dimension of the
structure; Type 2 stress varies on a length scale comparable to the grain size; Type 3 stress
varies on a length scale of grain subdivision (or tens of atom spacings).
Fig. 2-5 Bragg’s diffraction
Fig. 2-6 Schematic set-up of for the CW strain measurement on the L-3, NRU reactor
Fig. 2-7 L-3 beam line at the NRU reactor, Chalk River Laboratories
Fig. 2-8 A plot of collected neutron counts versus diffraction angle 2θ
Fig. 2-9 Schematic set-up of the in-situ loading lattice strain measurement
Fig. 2-10 Schematic set-up of for the TOF strain measurement on the Engin-X, ISIS
Fig. 2-11 A typical diffraction spectrum measured using time-of-flight neutron diffraction
Fig. 2-12 A peak obtained by TOF neutron diffraction showing the peak asymmetry
Fig. 2-13 Engin-X beam line at the ISIS, Rutherford Appleton Laboratory
Fig. 2-14 Schematic set-up for TOF lattice strain measurement
Fig. 2-15 E-3 beam line at the NRU reactor, Chalk River Laboratories
Fig. 2-16 Schematic pole figure measurement using CW neutron diffraction
Fig. 2-17 Application of the stress-strain concept to texture development for Zr alloys in tube
reduction (a1-a3), sheet rolling (b) and wire drawing (c) operations
Fig. 3-1 In-situ loading-unloading curve
Fig. 3-2 Lattice strain development of the compression tests: (a) TD/TD, (b) TD/TD (with respect
to strain), (c) ND/ND and (d) RD/RD
Fig. 3-3 Evolution of the peak intensity of { 0110 } and (0002) reflections for compression along (a)
TD and (b) RD
Fig. 3-4 The predicted lattice strain evolution for the reflections in the case TD/TD during uni-
axial compression, using (a) ‘Para-C’ with thermal strains, (b) ‘Para-C’ without thermal
strains, (c) ‘Para-T’ with thermal strains, and (d) ‘Para-T’ without thermal strains
x

Fig. 3-5 The predicted lattice strain evolution for the reflections in the case TD/TD during uni-
axial tension, using (a) ‘Para-C’ with thermal strains, (b) ‘Para-C’ without thermal strains,
(c) ‘Para-T’ with thermal strains, and (d) ‘Para-T’ without thermal strains
Fig. 4-1 Experimental pole figures of the Zircaloy-2: (a) slab {0002}, (b) slab { 0110 }, (c) after
compression along TD {0002} showing twinning inducing basal poles around TD, and (d)
after tension along TD {0002} showing no evidence for tensile twinning
Fig. 4-2 A typical diffraction spectrum with indexed diffraction peaks for compression test
Fig. 4-3 Evolution of the peak intensity of { 0110 } and {0002} for compression along (a) TD and
(b) RD, and (c) tension along ND
Fig. 4-4 Experimental macroscopic flow curves
Fig. 4-5 Experimental lattice strains for compression along TD: (a) TD/TD (b) TD/ND (c) TD/RD
Fig. 4-6 Experimental lattice strains for compression along RD:(a) RD/RD (b) RD/ND (c) RD/TD
Fig. 4-7 Experimental lattice strains for compression along ND: (a) ND/ND (b) ND/TD (c) ND/RD
Fig. 4-8 Experimental lattice strains for tension along TD: (a) TD/TD (b) TD/ND (c) TD/RD
Fig. 4-9 Experimental lattice strains for tension along RD: (a) RD/RD (b) RD/ND (c) RD/TD
Fig. 4-10 Experimental lattice strains for tension along ND: (a) ND/ND (b) ND/TD (c) ND/RD
Fig. 5-1 Modeling of the macroscopic flow curves is: (a) compression and tension along ND, (b)
compression and tension along TD and (c) compression and tension along RD
Fig. 5-2 Modeling the evolutions of lattice strains and relative activities during compression along
ND
Fig. 5-3 Modeling the evolutions of lattice strains and relative activities during compression along
TD
Fig. 5-4 Modeling the evolutions of lattice strains and relative activities during compression along
RD
Fig. 5-5 Modeling the evolutions of lattice strains and relative activities during tension along RD
Fig. 5-6 Modeling the evolutions of lattice strains and relative activities during tension along TD
Fig. 5-7 Modeling the evolutions of lattice strains and relative activities during tension along ND
Fig. 5-8 Lattice strains (a), relative activity (b) and absolute activity (c) during tension along ND
Fig. 5-9 Schematic load partitioning among the prism, pyramidal and basal grains
Fig. 5-10 Modeling of the lattice strain evolution during compression along TD without
considerations of latent hardening effects
Fig. 5-11 Modeling of the lattice strain evolution during compression along RD without
considerations of latent hardening effects
Fig. 6-1 Experimental and predicted flow curves for: (a) compression along ND, (b) tension along
xi

TD and (c) tension along RD
Fig. 6-2 Predicted and measured 3-D lattice strain evolution during compression along ND,
Case I: (a) lattice strains along ND, (b) lattice strains along TD and (c) lattice strains along
RD
Fig. 6-3 Predicted and measured 3-D lattice strain evolution during compression along ND,
Case II: (a) lattice strains along ND, (b) lattice strains along TD and (c) lattice strains
along RD
Fig. 6-4 Predicted and measured 3-D lattice strain evolution during compression along ND,
Case III: (a) lattice strains along ND, (b) lattice strains along TD and (c) lattice strains
along RD
Fig. 6-5 Predicted and measured 3-D lattice strain evolution during compression along ND,
Case IV: (a) lattice strains along ND, (b) lattice strains along TD and (c) lattice strains
along RD
Fig. 6-6 Predicted and measured 3-D lattice strain evolution during compression along ND,
Case V: (a) lattice strains along ND, (b) lattice strains along TD and (c) lattice strains
along RD
Fig. 6-7 Relative activities of slip systems as a function of applied true stress:
(a) Case I, (b) Case II, (c) Case III, (d) Case IV and (e) Case V
Fig. 6-8 Separation of { 1110 } and { 2110 } lattice strains using prism, basal and pyramidal <c+a> slip
Fig. 7-1 Recrystallized grains of non-deformed materials
Fig. 7-2 Experimental pole figures of the Zircaloy-2 slab: (a) (0002), (b) { 0110 } and (c) { 0211 }
Fig. 7-3 Definition of η and χ
Fig. 7-4 Measured pole figures for the deformed specimens: (a) Comp.ND { 0110 } (b) Comp.ND
(0002) (c) Comp.TD { 0110 } (d) Comp.TD (0002) (e) Tens.RD { 0110 } (f) Tens.RD (0002)
(g) Comp.RD { 0110 } (h) Comp.RD (0002) (i) Tens.TD { 0110 } (j) Tens.TD (0002) (k)
Tens.ND { 0110 } (l) Tens.ND (0002)
Fig. 7-5 Evolution of texture coefficient during compression along ND: (a) ND/ND, (b) ND/TD
and (c) ND/RD
Fig. 7-6 Evolution of texture coefficient during compression along TD: (a) TD/ND, (b) TD/TD and
(c) TD/RD
Fig. 7-7 Evolution of texture coefficient during compression along RD: (a) RD/ND, (b) RD/TD
and (c) RD/RD
Fig. 7-8 Evolution of texture coefficient during tension along ND (a) ND/ND, (b) ND/TD and (c)
ND/RD
xii

Fig. 7-9 Evolution of texture coefficient during tension along TD (a) TD/ND, (b) TD/TD and (c)
TD/RD
Fig. 7-10 Evolution of texture coefficient during tension along RD: (a) RD/ND, (b) RD/TD and (c)
RD/RD
Fig. 7-11 Microstructure of deformed materials: (a) EBSD observation of large tensile twins and (b)
TEM observation of fine tensile twin
Fig. 8-1 Experimental pole figures of the Zircaloy-2 slab: (a) (0002) (b) { 0110 }
Fig. 8-2 Experimental and calculated flow curves compression and tension along (a) ND (b) TD
and (c) RD
Fig. 8-3 Relative activities of the deformation systems for (a) Comp.ND (b) Comp.TD (c)
Comp.RD (d) Tens.ND (e) Tens.TD and (f) Tens.RD
Fig. 8-4 Development of texture coefficients for compression along ND (test direction/measured
direction): (a) ND/ND (b) ND/TD (c) ND/RD
Fig. 8-5 Development of texture coefficients for compression along TD: (a) TD/ND (b) TD/TD (c)
TD/RD
Fig. 8-6 Development of texture coefficients for compression along RD: (a) RD/ND (b) RD/TD (c)
RD/RD
Fig. 8-7 Development of texture coefficients for tension along ND: (a) ND/ND (b) ND/TD (c)
ND/RD
Fig. 8-8 Development of texture coefficients for tension along TD: (a) TD/ND (b) TD/TD (c)
TD/RD
Fig. 8-9 Development of texture coefficients for tension along RD: (a) RD/ND (b) RD/TD (c)
RD/RD
Fig. 8-10 Comparison of the predicted { 0110 } pole figures with experiments
Fig. 8-11 Comparison of the predicted (0002) pole figures with experiments
Fig. 8-12 Comparison of the flow curve for the tension along ND
Fig. A-1 Definition of η and χ in thermal residual strain measurements
Fig. A-2 Lattice spacings derived by experiments (‘exp’) and simulation (‘sim’) at various
measurement directions (η , χ ) as a function of temperature
Fig. B-1 Pole figures for the Zircaloy-2 plate
Fig. B-2 The loading frame mounted on the L-3 spectrometer at NRC, Chalk River
Fig. B-3 Schematic setup of the tensile samples: (a) parallel to the rod axis; (b) (c) perpendicular to
the rod axis
Fig. B-4 Development of lattice strains in TD samples
xiii

Fig. C-1 Tensile twinning in α–zirconium indicating the reorientation of the hcp structure and for
tension along ND (where most of the basal plane normals are concentrated), rotation of
the basal plane normals to the periphery of the pole figure
Fig. C-2 Sample positioning for compression tests along ND, (a). The sample can be tested such
that (b) Q1║RD and Q2║ND or (c) Q1║TD and Q2║ND.
Fig. C-3 Definition of η and χ
Fig. C-4 Experimental and calculated macroscopic stress-strain responses during (a) compression
along ND, (b) compression along TD, and (c) compression along RD.
Fig. C-5 Intensity development for the { 0110 }, {0002} and { 1110 }reflections during compression
along RD: (a) measured from RD, and (b) measured from ND.
Fig. C-6 Measured and calculated pole figures: (a) measured initial { 0110 }, (b) measured initial
{0002}, (c) measured initial { 1110 }, (d) measured final { 0110 }, (e) measured final {0002},
(f) measured final { 1110 }, (g) calculated final { 0110 }, (h) calculated final {0002} and (i)
calculated final { 1110 }.
Fig. C-7 Evolution of relative activities of the deformation modes
Fig. D-1 Measured pole figures for the deformed samples
xiv

xv
List of Tables
Table 2-1 CRSSs for slip modes in single crystal hcp Zr
Table 2-2 Deformation modes in α-Zr and Zircaloy polycrystal
Table 2-3 Studies on integranular constraints in hcp Zr alloys
Table 2-4 CRSS’s used for texture modeling of hcp Zr alloys
Table 3-1 Voce-hardening parameters for modeling the compression/tension tests
Table 4-1 A list of diffraction peaks for which lattice strains were measured
Table 4-2 Experimental Lankford coefficients
Table 4-3 Deviations of lattice strain from linearity in the plastic regime
Table 5-1 Critical resolved shear stresses and Voce hardening parameters used in modeling
Table 5-2 Latent hardening parameters used in modeling
Table 5-3 Experimental and calculated Lankford coefficients
Table 5-4 Lankford coefficients derived with or without considerations of latent hardening
Table 6-1 Modeling cases of deformation system combinations
Table 6-2 Critical resolved shear stresses and Voce hardening parameters used in modeling
Table 6-3 Experimental and calculated Lankford coefficients
Table 6-4 Reasonable ranges of initial CRSSs
Table 7-1 Development of experimental texture coefficients
Table 7-2 Similar cases as to the texture coefficient development
Table 7-3 Principal strains for the six loading cases
Table 7-4 Effects of individual deformation modes on texture formation
Table 7-5 Effects of individual deformation modes on texture formation
Table 7-6 Combined effects of two or more deformation modes on texture evolution
Table 7-7 Inferred minimum necessary set of deformation mechanisms
Table 8-1 Coarse and fine levels for the fitting parameters
Table 8-2 Critical resolved shear stresses and Voce hardening parameters
Table 8-3 Parameters describing latent hardening due to dislocation interactions
Table 8-4 Comparison of predicted Lankford coefficients with experiment
Table 9-1 Comparison of critical resolved shear stresses and Voce hardening parameters
Table 9-2 Comparison of latent atent hardening parameters
Table A-1 Residual bulk and lattice strains induced by the cooling process
Table C-1 Parameters describing the evolution of CRSS for each deformation mode

xvi
Glossary
2(3)-D Two (three)-dimensional
bas Basal <a> slip
bcc Body centered cubic
BLW Boiling Light Water reactor
CANDU CANada Deuterium Uranium pressurized heavy water reactor
Comp.XD Compression along XD (X=N, T, R)
CRL Chalk River Laboratories
CRSS Critical Resolved Shear Stress
ctw Compression twinning
CW Constant-Wavelength
EBSD Electron Back Satter Diffraction
Elastic anisotropy Variation in elastic properties of single crystals with direction
EPSC Elasto-Plastic Self-Consistent model
fcc Face centered cubic
GSAS General Structure Analysis System
Grain family Grain orientations with a particular {hkil} within a few degrees relative to a
nominal direction in the sample
Hard (soft)
orientation
Grain orientation which deforms on systems with a relatively high (low) CRSS
hcp Hexagonal close packed
HEM Homogeneous Effective Medium
In-situ test Mechanical test in the neutron spectrometer for diffraction measurements
Isotropic
(anisotropic)
latent hardening
Hardening on one slip system has the same (or different) hardening effects on the
other slip systems.
Latent hardening
(or LH)
Hardening on one slip system affects hardening on the other slip systems.
Micro-yield When the applied load corresponds to the critical resolved shear stress (CRSS) for
grains with particular orientations, these grains will begin to deform plastically
large scale macroscopic plasticity occurs in the specimen.
mrd Multiples of a Random Distribution
NRU National Research Universal reactor
ND Normal direction
ODF Orientation Distribution Function
PF Pole Figure
PHW Pressurized Heavy Water reactor
Plastic anisotropy Crystals do not deform homogeneously, but rather only by specific deformation
modes having different CRSSs.
pr Prism <a> slip
PTR Predominant Twin Reorientation scheme
pya Pyramidal <a> slip
pyca or pyr Pyramidal <c+a> slip
PWR Pressurized Water Reactor
Q The ratio of thickness to diameter reduction during tube reduction process
Q-vector Scattering vector (bisects incident and diffracted beams)
RD Rolling direction
R-ratio
Lankford coefficient, i.e. the ratio of the plastic strains in the two Poisson
directions during tension or compression.
Self-hardening Slip on each slip system is completely independent of the history of slip on other
slip systems.
Stiff (compliant)
orientation
Grain orientation exhibiting a high (low) elastic diffraction elastic constant.
TC Texture Coefficient
TD Transverse direction
TEM Transmission Electron Microscopy
Tens.XD Tension along XD (X=N, T, R)
TOF Time-Of-Flight
tt or ttw Tensile twinning
VPSC Visco-Plastic Self-Consistent model
XD-YD XD-YD plane (X or Y represents N, T or R)
XD/YD XD: test direction, YD: measurement direction (X or Y represents N, T or R)
n (in Bragg
diffraction)
Order of diffraction (n=1,2,…)
n (in VPSC) Stress component
aα Thermal expansion coefficient along the a-axis in an hcp unit cell
cα Thermal expansion coefficient along the c-axis in an hcp unit cell
xvii

Zrα Hexagonal close-packed phase in zirconium
Zrβ Body-centered cubic phase in zirconium
Cij Elastic constants
λ Wavelength
d Plane spacing
θ2 Diffraction angle (or take-off angle)
ε strain με Micro (10-6) strain
t Time of neutron flight χ Zenith angle
η Azimuth angle
τ Instantaneous CRSS
0τ Initial CRSS
0τ + 1τ Final back-extrapolated CRSS
0θ Initial hardening rate
1θ Asymptotic hardening rate
Γ accumulated plastic shear ssh ′/ Parameter describing the hardening due to the obstacles that dislocations in
system s' represent to the propagation of dislocations in system s accV Accumulated twin fraction
effV Effective twin fraction
1thA Threshold of grain fraction below which grain reorientation by twinning is
prevented 1thA + 2thA Threshold of grain fraction above which any further grain reorientation by
twinning is prevented effn Interaction parameter describing the strength of interaction between the inclusion
and HEM
xviii

Chapter 1
General Introduction
1.1 Applications of zirconium alloys in the nuclear industry
Zirconium and its alloys (e.g. Zr-Sn alloys Zircaloy-2 and Zircaloy-4) are widely used
in the nuclear industry because of their low neutron capture cross-section, good corrosion
resistance in hot water, and reasonable mechanical properties [ 1 ]. The nominal
composition of Zircaloy-2 is Zr, 1.2-1.7wt% Sn, 0.07-0.2wt% Fe, 0.05-0.15wt% Cr, 0.03-
0.08wt% Ni, 1400 wt ppm oxygen [2]. The sum of Fe, Ni and Cr must be within 0.18-
0.38%. The addition of Cr, Fe and Ni additives can improve the corrosion resistance of
Zr [3], while maintain the good mechanical properties. Ni is eliminated in Zircaloy-4;
the resultant decrease in the mechanical strength due to the absence of Ni is compensated
by the increase in Fe. Except for the better corrosion resistance, Zircaloy-4 is similar to
Zircaloy-2 in other properties. Zircaloy-2 and Zircaloy-4 have been accepted as the
standard for structural materials in various types of fission reactors [3].
Zircaloy-2 and Zircaloy-4 are usually fabricated into tubes. The tubes are a different
size, operate under different service conditions, require different combinations of strength
and ductility, and are usually fabricated by different techniques [4].
Tubes less than 30mm diameter and 2mm wall thickness are used as fuel cladding in
the Pressurized Heavy Water (PHW), Canada Deuterium Uranium Pressurized Heavy
Water (CANDU), and Boiling Light Water (BLW) reactors. They are fabricated by hot
extrusion, followed by several stages of cold working and annealing. The cold working
1

process is important in producing desired crystallographic texture, hydride orientation,
and mechanical properties.
Tubes greater than 60mm diameter and 1~2mm wall thickness are used to guide
coolant flow and control rods in pressurized water reactors (PWRs), and for adjuster rod
guides and calandria tubes in CANDU reactors. These types of tubes usually are stressed
only by a small pressure differential, and are usually seam-welded. A typical fabrication
schedule is: Ingot → Forged Bar → Rolled Sheet → Trim to Size → Form to Shape →
Weld → Weld Inspection → Level the Weld Bead → Heat Treat → Draw, Sink or
Expand to Final Size [4]. The weld and heat-affected zones must be recrystallized so that
the tubes have adequate ductility.
The in-core components (e.g. fuel cladding, calandria tube) are subject to the
irradiation environment of the reactor and therefore undergo deformation due to the creep
and growth mechanisms, which could cause serious problems [5]. In calandria tubes for
CANDU reactors, the axial elongation may cause stresses in the calandria vessel, ovality
may exacerbate pressure tube-to-calandria tube contact, and creep sag may lead to
contact with reactivity mechanisms [5].
Hence, an understanding of the deformation behaviour in the zirconium-alloy tubes is
critical to ensure the safe and reliable operation of nuclear reactors.
1.2 Intergranular stress, texture and deformation mechanisms
There are many factors influencing the deformation behaviour of Zr alloys. External
factors such as the tube operating temperature and stress play important roles. The
design of the tubes and mechanical properties of the material are also important. The
2

mechanical properties are mainly influenced by the alloying elements, microstructure,
texture and intergranular stresses. In particular, the plastic deformation is associated with
the microscopic deformation mechanisms operating at various combinations of external
loading and temperatures.
The deformation systems in the hexagonal close packed (hcp) materials are not as
symmetrically distributed, and are more restricted than in cubic materials [6]. Compared
to the 12 slip systems in fcc materials, and 48 systems in bcc materials, hcp materials
with the c/a ratio less than 1.633, such as Zr and its alloys, have only 3 primary slip
systems, i.e. ( 0110 )[ 0121 ], ( 1010 )[ 0112 ], ( 1001 )[ 2011 ], and only two of them are
mutually independent. The plastic deformation in Zr alloys requires the activation of slip
systems on other planes or twinning, in order to provide 5 independent deformation
systems necessary for a single crystal to undergo any arbitrary plastic strain. Twinning
and the slip on the planes other than the primary planes are substantially harder to
activate than the primary slip systems, making the material plastically anisotropic. The
plastic anisotropy, in combination with the thermal and elastic anisotropy, is an intrinsic
source of intergranular stress and texture, which, in turn, can dictate the initiation or
termination of certain deformation mechanisms. Thus, intergranular stresses, texture and
deformation mechanisms are mutually inter-dependent.
A good understanding of the relationships among intergranular stresses, texture and
deformation mechanisms calls for both extensive experimental data to provide a sound
basis for the study, and appropriate models which can simulate the deformation process
with proper descriptions of materials behaviour. It is only through a combination of
experiments and modeling that the complex relationships can be de-convoluted.
3

1.3 Description of the material
The source material used in this research is a 70mm thick warm-rolled and
recrystallized Zircaloy-2 slab. The composition is Zr, 1.43-1.45 wt% Sn, 0.13-0.14 wt%
Fe, 0.1 wt% Cr, 0.05 wt% Ni, 1260-1440 wt ppm O, 150-160 wt ppm C. The
manufacturing sequence is (1) forge at 1289K minimum to 5-5/8″ × 9-1/4″ × 26″, (2) β
quench (water) from 1289K minimum, (3) condition to 5-1/4″ minimum × 9″ × 26″, (4)
roll after preheating at 700K maximum along the length direction to obtain 50%
reduction, (5) condition to 2-1/2″ minimum thick × 9″ × length, (6) saw to final length.
Transmission electron microscopy showed the material to be fully recrystallized,
indicating that it had reached a temperature of at least 900K during processing [7], likely
as a result of adiabatic heating. The grains are equi-axed with an average size of ~20μm
(Fig. 1-1 [8]) and have a very low dislocation density, and the material has a typical
rolling and recrystallization texture [9], i.e. most {0002} normals are orientated along the
normal direction (ND) with a spread of ±50º towards the transverse direction (TD) and
±30º towards the rolling direction (RD); most { 0110 } normals are concentrated at ±30º
away from RD in the RD-TD plane and { 0211 } normals are in RD (Fig. 1-2 [10]). The
variation in texture across and through the thickness of the slab has been determined [10].
The results show that the major variation in intensity is through the thickness except on
the surface of the slab, but that the texture is fairly uniform across the width of the slab at
mid-thickness. This indicates that specimens for mechanical testing should be cut with
the center of their gauge length at mid-thickness, but that such specimens can safely be
taken from different locations relative to the width of the slab [10].
4

Fig. 1-1 Recrystallized grains of the as-received Zircaloy-2 slab [8]
2μm
RD
TD ND
Fig. 1-2 Rolling and recrystallization texture of Zircaloy-2 slab [10]: {0002}, }0110{ and }0211{
pole figures from left to right. (ND: normal direction, TD: transverse direction, RD: rolling direction).
1.4 This Research
1.4.1 Motivation
Studies of the mechanical behaviour of polycrystalline Zircaloy-2 are of general
interest. As a representative hcp metal it is well suited for scientific studies as it is
readily deformable, yet has a manageable number of plastic deformation systems.
5

The deformation of Zircaloy-2 is of practical interest to understand the manufacturing
and in-service properties (e.g. creep, fracture). For example, during the manufacturing (at
room temperature) of Zircaloy-2 tubes (e.g. calnadria tubes in CANDU reactors), the
brake-forming process can introduce intergranular stresses (Type-2 residual stresses) and
texture in the material. These would influence the material behaviour during service (e.g.
irradiation creep and growth [11]), which might ultimately be predicted by polycrystal
modeling.
A complete understanding of the development of intergranular constraints and texture
in Zircaloy-2 will allow an improved understanding of the plastic deformation of Zr
alloys in general, and the prediction of in-reactor deformation of tubes made by different
manufacturing routes. For instance, the calandria tube for Advanced CANDU Reactor
has different dimensional requirements than the existing one, and this demands a change
in the manufacturing route [12].
Currently, the understanding of the plastic deformation in Zircaloy-2 is far from
complete (reviewed in Chapter 2). This originates basically from the lack of
comprehensive experimental data sets and the insufficient understanding of deformation
mechanisms.
1.4.2 Objectives
This research aims to make a substantial improvement in understanding the material
behaviour of Zircaloy-2 under any loading condition, by expanding considerably on the
past work. The objectives of the research are:
(1) To provide a comprehensive data set suitable for deriving the parameters of
suitable models;
6

(2) To improve the predictions of the currently available models, both by refining the
values of parameters that have previously been reported and by obtaining estimates of the
parameters that have not previously been reported by ‘fitting’ the models to such an
extensive data set;
(3) To make some interpretation of the physical meaning of the parameters fitted;
(4) To evaluate the deficiencies of existing models and make recommendations as to
how to improve them.
1.4.3 Guide to the thesis
The research is to investigate two data sets, (1) lattice strain evolution and (2) texture
evolution, in terms of microscopic deformation mechanisms. Two techniques will be
used: (1) neutron diffraction and (2) polycrystalline modeling. The relationships among
the objectives, data sets and techniques are schematically shown in Fig. 1-3.
Lattice strain Texture
Neutron diffraction
Polycrystalline modeling
Deformation mechanisms Objectives
Comprehensive experimental
data sets
Techniques
Data sets
Fig. 1-3 The relationships among the techniques, data sets and objectives
This thesis is prepared in a manuscript form. Chapter 2 provides an overview of
relevant studies that lead to the current research. Chapters 3 to 8 are individual
7

manuscripts, each covering independent but coherent topics that fulfill the overall
research objectives. The chapters and appendices are inter-related as shown in Fig. 1-4.
Flow curves, R-ratios - Chapter 4
Lattice strain evolution - Chapter 4
Peak intensity evolution - Chapter 7
Texture evolution - Chapter 7, Appendix D
Thermal residual strains - Appendix A, Chapter 3
Neutron diffraction
EPSC modeling - Chapter 3, 5, 6
Appendix B
VPSC modeling - Chapter 8, Appendix C
In-situ tension and compression
Literature review - Chapter 2
General discussion and conclusions - Chapter 9, 10
Fig. 1-4 The relationships among the constituent chapters and appendices
Chapter 3 studies the lattice strain and evolution of some texture components during
compression. In particular, the lattice strain development inside the newly formed tensile
twins is provided, for the first time. Tensile twinning is inferred from the texture changes
and is then used to qualitatively interpret the basal internal strain development. Asymetry
in the yield stress and in the spread of the internal strain during compression and during
8

tension is noted. The reasons leading to this discrepancy are investigated with an elasto-
plastic self-consistent model.
Chapter 4 presents a comprehensive experimental study of lattice strain development,
which represents, by far, the most extensive data set of this kind yet to be published in Zr
alloys. This data set forms a sound basis to investigate the active deformation
mechanisms and to rigorously test plasticity models. Qualitative interpretations based on
the slab texture are offered to explain the lattice strain development.
Chapter 5 uses an elasto-plastic self-consistent model to interpret the lattice strain
data and macroscopic mechanical responses reported in Chapter 4. This is the first
attempt to fit with such an extensive data set. The model results are used to infer the
underlying deformation mechanisms and their interactions. The influences of prism <a>
slip, basal <a> slip, pyramidal <c+a> slip and tensile twinning modes are considered.
The critical resolved shear stresses and hardening parameters are derived by
simultaneously obtaining a ‘best-fit’ with the whole experimental data set.
Chapter 6 systematically studies the influence of different slip modes (especially
basal slip) on the lattice strain evolution, using an elasto-plastic self-consistent model, for
cases where twinning and texture evolution make a minimal contribution. Important
parameters for modeling are proposed which should benefit the modeling of other
materials similar to Zircaloy-2.
Chapter 7 presents a comprehensive data set of diffraction peak intensity evolution
and post-deformation textures for certain combinations of the sign and direction of
applied load. The texture formation is qualitatively correlated with the macroscopic
strains and compared with previous results reported in the literature. The texture
9

10
formation is also qualitatively correlated with microscopic deformation mechanisms,
based on a systematic study of the effects of individual deformation modes on texture
formation. A minimum necessary set of deformation modes is derived, to facilitate the
implementation of plasticity models for further quantitative interpretations.
Chapter 8 uses a visco-plastic self-consistent model to interpret the intensity
development and post-deformation textures reported in Chapter 7. In the model, the
influences of prism slip, basal slip, pyramidal <c+a> slip and tensile twinning are
considered. The model parameters are adjusted to obtain a simultaneous ‘best-fit’ with
the complete data set.
Chapter 9 is a general discussion giving an overview of the thesis. Model parameters
derived by the EPSC and VPSC models are compared. The model parameters are also
compared with those reported in the literature.
Chapter 10 summarizes the conclusions of the thesis, emphasizing the main new
contributions of the research, and proposes directions for future work.
Appendix A describes the measurements of thermal expansion coefficients in
polycrystalline Zircaloy-2, and the ‘stress-free’ lattice spacings at room temperature.
Appendix B is a manuscript presenting preliminary results of lattice strain evolution
during tension along one sample direction. Appendix C is a manuscript presenting
preliminary results of texture formation during compression along three sample
directions. Appendix D presents the measured pole figures not reported in the main
chapters.
References
[1] Canada Enters the Nuclear Age, Atomic Energy of Canada Limited (1997)

11
[2] S.R. MacEwen, J. Faber and A.P.L. Turner, Acta Metall. 31 (1983) 657-676
[3] K. L. Murty and I. Charit, Prog. Nucl. Energy 48 (2006) 325-359
[4] B.A. Cheadle, Zirconium in the Nuclear Industry, ASTM STP 633 (1977) 457-485
[5] G.J. Field, J. Nucl. Mater. 159 (1988) 3-11
[6] E. Tenckhoff, J. ASTM Inter. 2 (2005) 1-26
[7] D. Lee, J. Nucl. Mater. 37 (1970) 159-170
[8] I.A. Yakubtsov, unpublished data (2006)
[9] E. Tenckhoff and P.L. Rittenhouse, J. Nucl. Mater. 35 (1970) 14-23
[10] R.A. Holt, D. Dye and R.B. Rogge, Annual Report of the National Research Council (2004)
[11] R.A. Holt and A.R. Causey, J. Nucl. Mater. 150 (1987) 306-318
[12] J. Hopwood, Proc. 26th Annual Conference of the Canadian Nuclear Society, paper P23
(2005)

12
This page is blank.
Chapter 2
Literature Review
In most engineering applications, zirconium alloys are polycrystalline, i.e. aggregates of
anisotropic crystals with preferred orientations (texture) that originate from
transformation and/or deformation. During deformation, the constituent grains interact
with their neighbouring grains generating intergranular (Type-2) stresses. Neutron
diffraction and polycrystalline modeling are commonly used techniques to investigate
texture and intergranular constraints. This chapter reviews the plastic deformation
mechanisms of single crystal zirconium and polycrystal zirconium and its alloys, and the
development of texture and intergranular stresses. The research techniques, neutron
diffraction and polycrystalline modeling, are also reviewed. Relevant studies of single
phase zirconium and its alloys are summarized.
2.1 Physical properties of single crystal zirconium
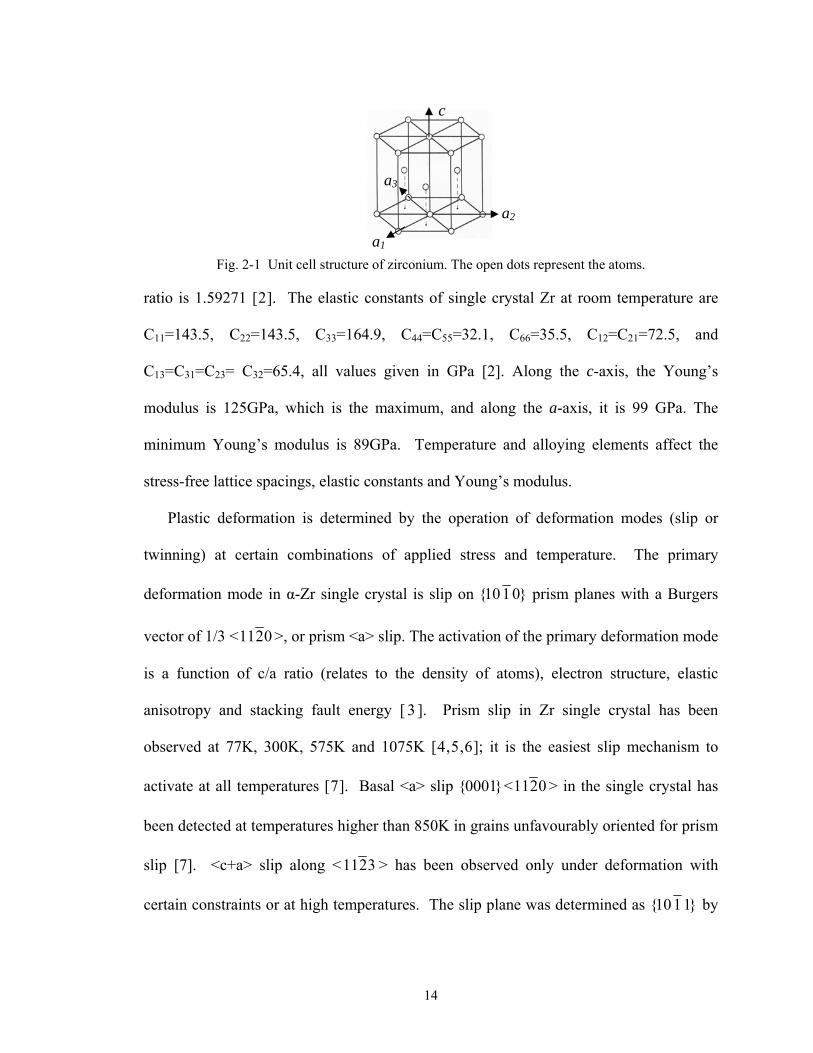
Zirconium (Zr) has the hexagonal close-packed (hcp) crystallographic structure, Fig.
2-1. Zr exhibits anisotropic thermal, elastic, and plastic properties, both at the single
crystal and polycrystal levels. The thermal expansion coefficients along the a- and c-axes
have been reported to be in the ranges of and
[
16107.50.5 −−×<< Kaα
16100.125.7 −−×<< Kcα 1], respectively. Nominal stress-free lattice spacings at room
temperature in the a- and c-axes are 3.23118 Å and 5.14634 Å, respectively, and the c/a
13
c
a3
a1
a2
Fig. 2-1 Unit cell structure of zirconium. The open dots represent the atoms.
ratio is 1.59271 [2]. The elastic constants of single crystal Zr at room temperature are
C11=143.5, C22=143.5, C33=164.9, C44=C55=32.1, C66=35.5, C12=C21=72.5, and
C13=C31=C23= C32=65.4, all values given in GPa [2]. Along the c-axis, the Young’s
modulus is 125GPa, which is the maximum, and along the a-axis, it is 99 GPa. The
minimum Young’s modulus is 89GPa. Temperature and alloying elements affect the
stress-free lattice spacings, elastic constants and Young’s modulus.
Plastic deformation is determined by the operation of deformation modes (slip or
twinning) at certain combinations of applied stress and temperature. The primary
deformation mode in α-Zr single crystal is slip on }0110{ prism planes with a Burgers
vector of 1/3 < 0211 >, or prism <a> slip. The activation of the primary deformation mode
is a function of c/a ratio (relates to the density of atoms), electron structure, elastic
anisotropy and stacking fault energy [ 3 ]. Prism slip in Zr single crystal has been
observed at 77K, 300K, 575K and 1075K [4,5,6]; it is the easiest slip mechanism to
activate at all temperatures [7]. Basal <a> slip <}0001{ 0211 > in the single crystal has
been detected at temperatures higher than 850K in grains unfavourably oriented for prism
slip [7]. <c+a> slip along < 3211 > has been observed only under deformation with
certain constraints or at high temperatures. The slip plane was determined as }1110{ by
14

Akhtar [7], and }1211{ by Tenckhoff [8]. Four twin planes were found to be active in a
single crystal, i.e. }1211{ , }2211{ , }3211{ and }2110{ , by Rapperport [5,6]. }1211{
twins were present at all the test temperatures (77K to 1075K), with }2110{ , }2211{ and
}3211{ appearing in a deceasing order of importance. During tensile testing of single
crystal Zr, at 77K the predominant twinning was on the plane }1211{ [9,10], while at
295K, it was on }2110{ [10]. During compression, below 800K the twinning plane was
}2211{ , while above 800K it was }1110{ [11].
Other slip modes may also be possible, but have not been observed experimentally.
These include pyramidal <a> slip }1110{ < 0211 >, prism <c+a> slip }0110{ < 3211 > and
pyramidal <c+a> slip }2211{ < 3211 >. The observed and possible slip and twinning
modes are shown in Fig. 2-2.
(a)
(b)
Fig. 2-2 Possible slip modes (a) and schematic of the twinning modes (b) in hcp zirconium [12]. The
angles shown in (b) represent the reorientation angles from the c-axis brought about by the respective
twinning modes.
15

Table 2-1. CRSSs for slip modes in single crystal hcp Zr (MPa)
Material Temperature Prism slip Basal slip References
High purity reactor grade
crystal Zr bar
77 K 10.0 > 41
[5,6]
300 K 6.5 > 24 575 K 2.0 > 12
1075 K 0.2 > 5 Crystal Zr bar
without H 300 K 8.0 [13] with H 60.5
99.8-99.99 wt % Zr
140 ppm O 300 K 3.8-6.1 13.2-25 [14] 1200 ppm O 53.2 138-167
Crystal Zr bar, 120 ppm O
[7,10,11]
1 kg/mm2
= 9.8 MPa
The occurrence of twinning not only accommodates plastic deformation by shear
strain (usually smaller than the slip shear), but also brings about local stress relaxation
(usually much more rapid than that, if any, due to slip), and reorients grains into
orientations favourable for the activation of slip. The twinning induced reorientations are
shown in Fig. 2-2b [15]. There is still a debate on the existence of a physical CRSS for
the activation of twinning. A hypothesis is that the nucleation of a twin requires a CRSS,
but only in the immediate vicinity of the nucleation site where local stresses mount up
due to dislocation pile-ups [13].
16

2.2 Deformation mechanisms in polycrystalline Zr and Zr alloys
In polycrystal Zr and its alloys, the primary deformation mode is prism slip
}0110{ < 0211 > (the same as in single crystal Zr). This slip mode contains only two
mutually independent deformation systems; thus other deformation systems must be
present to fulfill the von Mises compatibility criterion [ 16 ], i.e. five independent
deformation systems are required to accommodate an arbitrary plastic strain in a single
grain embedded in a polycrystal. At room temperature, compression along the c-axis is
usually accomplished by pyramidal <c+a> slip [17,18,19] in polycryatal Zr alloys, rather
than by }2211{ compression twinning which operates in single crystal Zr. It is noted that
during room-temperature deformation in Zr alloys, only }2110{ < 0111 > tensile twinning
was observed, and the other types of tensile or compression twinning (as listed in Fig. 2-
2b) have never been reported.
The experimental evidence for the slip and twinning modes in polycrystal Zr and its
alloys under various conditions, has been derived by slip trace methods [20] or electron
microscopy observations, Table 2-2 [19,21]. In particular, the presence of prism slip
[e.g. 13,14,22,23] and pyramidal <c+a> slip [e.g. 8,14,24], as well as tensile twinning
[e.g. 5,13,25,26] has been well documented.
Prism slip always activates first with increasing applied stress in the polycrystals. As
a higher stress is applied, the <a> dislocations accumulate, forming local stress
concentrations where it is possible for cross-slip to operate. Cross-slip of the <a>
dislocations is a likely mechanism for the initiation of basal slip and, in principle,
pyramidal <a> slip. McCabe et al. [27] suggested that the cross-slip of <a> dislocations
on prism planes may result in <a> slip on basal or pyramidal planes, during room-
17

Table 2-2. Deformation modes in α-Zr and Zircaloy polycrystal [19,21]
Type Plane Description Crystallographic description
Temperature and stress range
Slip prism a }0110{ < 1021 > all temperatures lowest stress system
Slip basal a }0001{ < 1021 > high temperatures
Slip pyramidal c+a }1110{ < 3211 > intermediate temperatures, high stress
Slip pyramidal c+a }1211{ < 3211 > high temperatures, high stress
Twin pyramidal c+a }2110{ < 0111 > intermediate temperature, c axis tension
Twin pyramidal c+a }1211{ < 2611 > low temperature, c axis tension
Twin pyramidal c+a }2211{ < 2311 > low-intermediate temperature, c axis compression
Twin pyramidal c+a }1110{ < 0121 > intermediate-high temperature, c axis compress
temperature compression of high-purity polycrystal Zr. Philippe et al. [28] also noticed
the cross-slip of <a> dislocations onto basal or pyramidal planes during cold rolling of
nuclear quality Zr. There is evidence for basal slip under certain circumstances. Slip
markings belonging to (or close to) basal traces have been discovered in 1) single crystal
Zr (99.8-99.9 wt%) in regions of stress concentration at room temperature [14], 2) single
crystal Zr at elevated temperatures [10], 3) commercial grade Zr near hydride particles at
elevated temperatures [22], 4) hydrides in Zircaloy-2 with ~17ppm H at temperatures
significantly below 573K [29], 5) irradiated Zircaloy at elevated temperatures [30], and
6) polycrystal Zr at elevated temperatures during kink formation [31]. However, there is
no direct evidence for basal slip in polycrystalline Zr alloys at room temperature. There
is no convincing published evidence for pyramidal <a> slip under any circumstances.
Pyramidal <a> slip was claimed to be found in a document cited by Philippe et al. [32],
but that document was not published. Fregonese et al. [33] claimed to have observed
pyramidal <a> slip at 623K, close to the grain boundaries. However, from the only
evidence they provided, i.e. the transmission electron microscopy picture – Fig. 4b in
18

[33], the dislocations are mainly in screw orientation, thus it is hard to determine what the
slip plane is.
The CRSSs for the activation of the deformation systems in Zr and its alloys will be
reviewed in Section 2.7, after the techniques used to derive them have been reviewed. As
strain accumulates after CRSS is reached in ploycrystals, a higher resolved shear stress is
required to keep the slip system operating because the dislocation movement is
increasingly hindered by obstacles produced by strain, such as other dislocations or pile-
ups at grain boundaries. Both the CRSS and hardening of a slip system are a function of
alloying elements, grain size, microstructure (e.g. dislocation pile-ups), temperature and
deformation history.
2.3 Crystallographic texture
Crystallographic orientation refers to the orientation of the planes or directions in a
crystal relative to an external coordinate system. The crystallographic orientations of
grains in polycrystals are rarely randomly distributed. In most materials, there is a
pattern in the orientations and a propensity for the occurrence of certain orientations,
referred to as crystallographic texture, or simply, texture. Crystallographic texture can be
altered by recrystallization, phase transformation and thermal- and/or mechanical
processing [34].
In general, texture affects material properties, including Young’s modulus, Poisson’s
ratio, strength and ductility [34], since the anisotropic single crystal properties result in
anisotropic properties on the macroscopic scale. In a nuclear reactor environment, for
example, texture can greatly influence fracture and dimensional stability of components
made of Zr alloys [35].
19

Texture can be represented by pole figures, inverse pole figures or orientation
distribution functions (ODFs) [36]. The most common method to represent a texture is
to present the 2-D distributions of crystallographic plane normals either in the sample
coordinate or in the crystal coordinate system. If the sample coordinate system is used,
the representation is called a pole figure; if the crystal coordinate system is used, the
representation is called an inverse pole figure. A pole figure shows the distribution of the
plane normal of one specific crystallographic plane (e.g. (0002) 1 ) in the sample
coordinate (e.g. normal, transverse, rolling directions). An inverse pole figure shows the
distribution of crystallographic plane normals (e.g. { 0110 }, { 0211 }, (0002)) with respect
to one sample direction (e.g. normal direction). In a pole figure or inverse pole figure,
the density of the plane normal(s) or texture coefficient is proportional to the volume
fraction of the grains with that orientation(s), and is often represented in units of
‘multiples of a random distribution’ (or ‘mrd’). The ODF is a representation to describe
the probability of occurrence of particular orientations in a 3-D Euler orientation space
[37]. To construct an acceptable ODF for an hcp material, usually three to five pole
figures are needed, which should include one prism plane, one pyramidal plane and one
basal plane.
As an example, Fig. 2-3 [38] shows a manufacturing induced crystallographic texture
of calandria tubes for CANDU Pickering 1 and 2 reactors. In the figure (in this case a
quarter of the full pole figure), the basal plane (0002) normals are highly concentrated
near the radial direction with a greater spread in the radial-tangential plane than that in
1 Since diffraction techniques are used to measure crystallographic texture, the pole figure is usually
designated by the diffracting plane used to make the measurement.
20

the radial-longitudinal plane. This kind of texture results in the highest yield strength in
the radial direction, and the lowest yield strength in the longitudinal direction.
Fig. 2-3 A typical crystallographic texture of the calandria tubes for Pickering 1, 2 reactors [38]. The
left figure schematically shows the three principal directions of calandria tube (L=longitudinal
direction, R=radial direction, T=tangential or circumferential direction); the right figure indicates a
high concentration of basal plane normals in the radial direction, and slightly more in the transverse
direction than that in the longitudinal direction.
Textures can be measured using X-ray diffraction, neutron diffraction, or electron
diffraction (e.g. scanning electron microscope) [34]. A summary of the measurement
details can be found in Refs. [34,39]. Lab X-rays are easier to obtain and typically have
a much higher flux than neutron sources [40]. However, they can only probe a very thin
layer at the surface (typically tens of μm). This often limits the sampling volume to such
an extent that the measured texture may not be representative of the bulk material.
Electrons can only penetrate an even thinner layer (typically tens of nm) [41]. They are
suitable for measuring microtexture (due to the high spatial resolution), but usually not
the bulk texture. Neutrons can penetrate several centimeters in many materials of
practical relevance [42], and thus they are ideal probe media for measuring the bulk
texture. In this research, neutron diffraction is used to determine the texture of bulk
Zircaloy-2 material.
21

2.4 Intergranular (Type-2) stress
Residual stresses are important because they can be either beneficial or detrimental to
the performance of a component depending on the combination of the sign of residual
stresses and the type of external loading. For example, much of the irradiation induced
deformation of Zircaloy-2 calandria tubes in CANDU reactors is attributed to the
relaxation of intergranular constraints (Type-2 stresses) which develop during
manufacturing as a result of the crystallographic anisotropy [43].
In general, stresses can be classified according to the scale on which one examines a
material [44]. Fig. 2-4 shows schematically three different scales, the macro-structure,
the grain and the grain subdivision. Type-1 stress (σ I) varies on the scale comparable to
the macroscopic dimension of the structure (e.g. mm). The stress is assumed to be
continuous over the whole structure. The internal forces correlated with this stress are in
σ II
σ III
σ I
Fig. 2-4 Type 1 stress varies on a length scale comparable to the macroscopic dimension of the
structure; Type 2 stress varies on a length scale comparable to the grain size; Type 3 stress varies on a
length scale of grain subdivision (or tens of atom spacings). Part of the figure is copied from Ref. [44]
22

balance in every cross-section. The bending moments induced by these forces are equal
to zero around all axes. Type-2 stress (σ II) varies on the scale comparable to the grain
size (e.g. μm). It is assumed to be continuous within the grain, but discontinuous from
grain to grain. Type-3 stress (σ III) varies on the scale of tens of atom spacings (e.g. nm).
It is approximately homogeneous on the scale of inter-atom distances, and can be
considered continuous within a grain subdivision, but it is discontinuous from one grain
subdivision to another within a grain. This study is mainly concerned with the second
order, or Type-2, or intergranular stresses.
Intergranular stresses in Zr alloy polycrystals arise from several sources. Usually such
stresses develop as a result of the combination of anisotropic single crystal properties, the
texture of the aggregate and the imposed external loading, whether thermal or mechanical
[45,46]. Cooling an hcp material from a high temperature (where residual stresses can
be assumed to have been relaxed by creep) generates intergranular stress originating from
the thermal anisotropy of the single crystal, since strain compatibility and stress balance
between neighboring grains must be maintained to overcome the mismatch in the thermal
strains. In contrast to engineering materials with cubic symmetry, thermal stresses have a
great impact on the macroscopic elasto-plastic response of hcp materials. For instance,
they can cause a yield stress differential in tension and compression and a different
elasto-plastic transition during deformation in tension and compression [47]. Applying a
mechanical load to the material also produces intergranular stresses, due to the elastic and
plastic anisotropies of the single crystal. When the applied load corresponds to CRSS for
grains with particular orientations, these grains will begin to deform plastically (or
‘micro-yield’) before large scale macroscopic plasticity occurs in the specimen. Other
23
grains whose CRSS has not yet been exceeded, will continue to respond to the load
elastically [48]. Thus, for example, if a compressive load is applied to a material without
bulk texture, the plastically ‘hard’ orientations (i.e., those grain orientations which will
deform on systems with a relatively high CRSS) parallel to the loading axis would tend to
accumulate high compressive stresses at the expense of the ‘soft’ orientations (i.e., those
which deform on systems with relatively low CRSS) which yield at lower compressive
stresses. Upon unloading, the high compressive stresses generated in these plastically
‘hard’ orientations result in compressive residual stresses, and the lower stresses in the
‘soft’ orientations results in tensile stresses in order to fulfill stress balance in the
unloaded component [48].
There are several methods to evaluate residual stresses: destructive or non-destructive
[46]. Hole-drilling [49] is a typical destructive method which is based on the surface
strain caused by relaxation of the residual stresses as holes are drilled. If the strains are
measured as a function of hole depth, some 3-D strain distribution can be obtained. Non-
destructive methods are mostly based on acoustic effects, magnetic effects or Bragg
diffraction using X-rays, neutrons, or electrons [46,50,51,52].
Destructive methods like hole-drilling and methods based on acoustic properties only
measure Type-1 stresses, but magnetic methods, and in particular, diffraction methods,
e.g. X-rays, thermal neutrons and electrons, can measure Type-1 and 2 stresses and also
provide information about Type-3 stresses. Neutron diffraction, which will be described
in the next section, is particularly well suited for the evaluation of Type-2 residual
stresses inside bulk materials, and for this reason, this method is used in the research.
24

2.5 Neutron diffraction
In this section, the experimental technique of neutron diffraction is reviewed, mostly
based on Refs. [34,40,44,53].
Neutrons used in the diffraction measurements are thermal neutrons; they have
wavelengths comparable to the lattice spacings of crystalline materials [54]. Thermal
neutrons have a unique character of deeply penetrating (typically several cm) into most
engineering materials (in contrast, X-rays from laboratory sources only penetrate tens of
μm and even ‘hard’ X-rays from synchrotron sources only penetrate a few mm). This
allows probing the material behavior inside the bulk without any destructive or time-
consuming sample preparation. Deep penetration into a material is crucial to the lattice
strain and texture measurement, as it allows the use of a relatively large sample. This
will not only make the mechanical test (e.g. 2 in-situ test) relatively easy, but also
significantly improve the measurement statistics by probing a relatively large number of
grains. Further, the material behaviour inside a bulk is a more likely representative of the
‘real’ material behaviour, compared to that measured near the sample surface. At the
‘near-surface’ locations, the material properties can be affected by sample preparation
(e.g. cutting) and the relaxation of the component of stress normal to the surface. Due to
the merit of deep penetration, neutron diffraction has become an attractive technique in
materials science [55]. In this research, it is used for both lattice strain and texture
measurements.
The principal of neutron diffraction, and indeed all diffraction techniques, is Bragg’s
law [56]: θλ sin2dn = , where λ is the wavelength, d is the plane spacing, θ is half the
diffraction angle, and n is the order of diffraction. Fig. 2-5 illustrates Bragg diffraction 2 Perform mechanical test in the neutron spectrometer for diffraction measurements.
25

for n=1 and n=2. The angle θ2 is the diffraction angle (or take-off angle). It is the angle
θ2 (not θ ) that is measured in neutron diffraction experiments. The scattering vector (or
‘Q-vector’) along which the spacing, d, is measured is normal to the diffraction plane.
The Q-vector bisects the incident and diffracted beams.
General descriptions on neutron diffraction techniques can be found in Ref. [44]. In
the present experimental work, two of the techniques are used: (1) constant-wavelength
(CW) neutron diffraction at the L-3 and E-3 beam lines, National Research Universal
(NRU) Reactor, Chalk River Laboratories, and (2) time-of-flight (TOF) neutron
diffraction at the Engin-X beam line, ISIS, Rutherford Appleton Laboratory.
Fig. 2-5 Bragg diffraction [53]. 2θ is the diffraction angle (or take-off angle) that is measured in the
experiment. d is the plane spacing. In a 1st order diffraction (n=1), the scattered rays 1’ and 2’ differ
in the path length by one wavelength. In a 2nd order diffraction (n=2), the scattered rays 1’ and 3’
differ in the path length by two wavelengths. The lattice strain is measured along the scattering
vector, or Q-vector, which bi-sects the incident beam (1,2,3) and the scattered beam (1’,2’,3’).
2.5.1 CW neutron diffraction for strain measurement at L-3, NRU
On the CW neutron beam line L-3, the neutrons are produced at a relatively steady
rate by the operation of NRU, and thermalized by a moderator making them useful for
diffraction experiments [44]. The single-wavelength beam is obtained by inserting a
Q-vector
2θ
1 1’
2’ 2
3 3’ d d
26

monochromator in the ‘white’ beam from the neutron source [ 57 ]. The single-
wavelength incident beam is collimated by söller slits, passes through an aperture
defining its width, and is diffracted by the polycrystalline sample with a take-off angle of
2θ; then the diffracted beam passes through another aperture, is collimated by another set
of söller slits, and finally reaches the detector (Fig. 2-6) [58,59]. A gauge volume is
defined by the two apertures. Only grain orientations inside the gauge volume and
satisfying Bragg’s law, can be detected. Typically there are thousands of such grains in a
gauge volume. The measured lattice strain is the average response over the diffracting
grains. A schematic instrumental set-up for CW lattice strain measurements at the L-3
beam line (Fig. 2-7 [60] ) is shown in Fig. 2-6.
single-wavelength
incident beam
collimator
aperture
aperture
collimator detector
gauge volume
scattering vector, Q
positioning table
sample
White incident beam
monochromator
Fig. 2-6 Schematic set-up of for the CW strain measurement on the L-3, NRU reactor.
27

Collimator Detector
Load frame
Fig. 2-7 L-3 beam line at the NRU reactor, Chalk River Laboratories
The elastic lattice strain is determined by the changes in plane spacing or diffraction
angle, i.e. 1sinsin
−=−
=hkil
ref
ref
refhkilhkil d
ddθθ
ε , where ‘hkil’ is the measured diffraction plane,
and ‘ref’ refers to the reference sample or state [55]. In the in-situ loading experiments
(CW, and TOF which will be described in the next sub-section), the reference state refers
to the state before significant loading is applied. The data gathered in the CW
measurements is in a form of neutron counts as a function of diffraction angle (which can
be converted to plane spacing via Bragg’s law). The measured peaks in scattered intensity
corresponding to Bragg diffraction can be fitted using a Gaussian fitting program. A
constant background intensity is also fitted. Fig. 2-8 shows an example of collected
neutron counts with respect to the diffraction angle 2θ (background is included). In the
figure, the dots represent the collected neutron counts, and the line is the Gaussian fit.
The position of the center of the Gaussian fit represents the average diffraction angle, 2θ,
28

satisfying Bragg’s law. A shift of the center reflects the changes in lattice spacing, and
thus is directly related to the lattice strain.
0
100
200
300
400
500
600
700
-94 -93 -92 -91 -90
Run 1 Monitor 100
neut
ron
coun
ts
Fig. 2-8 A plot of collected neutron counts versus diffraction angle 2θ. The dots are the collected
data, and the line is fitted with a Gaussian function. The center of the fitted line is the position of the
peak. The shift of the center line of a peak is used to calculate the lattice strain.
In a typical in-situ measurement, the sample is loaded in a frame which is placed on a
high precision positioning table. The frame can be rotated such that 1) the loading axis is
parallel to the scattering vector making available the measurement of lattice strain in the
loading direction, or 2) the loading axis is perpendicular to the scattering vector enabling
the determination of lattice strain in the Poisson directions, Fig. 2-9.
29

(a) (b) (c)
Fig. 2-9 Schematic set-up of the in-situ loading for lattice strain measurements. Example shows a
sample positioning for tensile tests. By rotating the loading frame and the sample, it is able to measure
the lattice strain (a) parallel to the loading axis; (b) (c) perpendicular to the loading axis (i.e. two
Poisson directions), for diffraction planes with the normal along with the scattering vector.
2.5.2 TOF neutron diffraction for strain measurement at Engin-X, ISIS
On the TOF neutron site Engin-X beam line [61,62,63], a ‘white’ incident beam that
contains a continuous spectrum of wavelengths is used. The beam is produced in pulses
by the collision of protons with tantalum [ 64 ] and then is moderated to achieve
wavelengths suitable for the diffraction measurements. In general, the pulsed beam is
collimated to impinge on a specimen some distance away, and is then diffracted towards
a detector set at a pre-selected diffraction angle. The time of neutron flight from the
moderator to a detector is proportional to the neutron wavelength, which is proportional
to the lattice spacing of the diffracting plane in the specimen. By measuring the changes
in the time of flight, one measures the changes in the plane spacing, i.e. lattice strain [65].
At Engin-X, the beam is collimated with söller slits and then passes through an
adjustable aperture, before it reaches the specimen; then the diffracted beam passes
through a radial collimator and reaches a bank of detectors, Fig. 2-10 [46]. A gauge
volume is defined by the aperture in the incident beam and the spatial resolution of the
30

divergent slits of the radial collimator in front of the detector banks. Different grain
orientations in the gauge volume diffract at different angles (due to the multiple
wavelengths of the incident beam) according to Bragg’s law. There are two detector
banks perpendicular to the incident beam at Engin-X, each covering a range of angles
[62]. Using the TOF technique, a spectrum of diffraction peaks can be measured
simultaneously in each element of the detector, and then combined to give an average
spectrum over the whole angular range of the detector (e.g. Fig. 2-11). Note that the
diffraction peak obtained in TOF is usually asymmetrical about the peak center (e.g. Fig.
2-12), while the CW peak is symmetrical [66].
white incident beam
slit scattering vector, Q2
detector detector bank
radial collimator
sample
gauge volume
scattering vector, Q1
bank
collimator
Fig. 2-10 Schematic set-up of for the TOF strain measurement on the Engin-X, ISIS.
31

Fig. 2-11 A typical diffraction spectrum measured using time-of-flight neutron diffraction
Fig. 2-12 A peak obtained by TOF neutron diffraction showing the peak asymmetry [44]
32

The elastic lattice strain is determined by changes in plane spacing, wavelength or the
time that has elapsed since the pulse of neutrons was produced (or time of neutron flight),
i.e. ref
refhkil
ref
refhkil
ref
refhkilhkil t
ttd
dd −=
−=
−=
λλλ
ε , where λ is the wavelength, and t is the
time of neutron flight [67]. The collected neutron counts by the TOF can be plotted with
respect to wavelength or plane spacing. The GSAS Rawplot program [68] can be used to
fit the entire spectrum of collected data; single peak fitting can also be applied, but
usually it is less efficient than the Rawplot.
In a typical in-situ TOF measurement, the loading axis is set horizontally at 45° to the
incident beam such that the lattice strain along the loading direction is measured in one
detector bank and the lattice strain in one Poisson direction is measured in the other
[69,70]. Installing another sample it is able to measure the lattice strain along the
loading direction and along the other Poisson direction. A schematic set-up of an in-situ
loading measurements at Engin-X beam line [69] (Fig. 2-13) is shown in Fig. 2-14. A
detailed description of the experimental arrangements typical for in-situ loading
experiments at this source can be found in Ref. [70].
Load frame
Beam directed from target
station
Detector arrays
Incident slit
Fig. 2-13 Engin-X beam line at the ISIS, Rutherford Appleton Laboratory
33

Fig. 2-14 Schematic set-up for TOF lattice strain measurement. Example shows a sample positioning
for compression tests along ND. The sample can be tested such that (a) Q1║RD and Q2║ND or (b)
Q1║TD and Q2║ND.
2.5.3 CW neutron diffraction for texture measurement at E-3, NRU
Crystallographic texture can be measured by CW or TOF neutron diffraction. Here
only the CW neutron diffraction at E-3 beam line at NRU (Fig. 2-15) [71], which is used
in this research for texture measurements, is reviewed. The basic set-up [72,73] of the
instruments for measuring pole figures at E-3 is similar to that for measuring lattice
strains at L-3. One difference is that in texture measurements, a specimen (usually cut
into a small coupon from the sample) is completely bathed in the neutron beam. The
söller slits are only used to collimate both incident and diffracted beams, but not used to
define a gauge volume. Another difference lies in setting up the specimen. In a pole
figure measurement, the specimen is mounted in an Eulerian cradle schematically shown
in Fig. 2-16a, in order to be rotated through χ (zenith angle, 0˚-90˚) and η (azimuth angle,
0˚-360˚). A spectrometer is also required to attain the desired diffraction angles for
measuring a set of pole figures (i.e. each pole figure corresponds to one diffraction angle).
34

Detector Incident slit
Eulerian cradle
Diffractometer
Fig. 2-15 E-3 beam line at the NRU reactor, Chalk River Laboratories
In the measurement [34], the sample is firstly rotated to a χ angle, then rotated
through η from 0˚-360˚ in a step size of typically 5˚; at each step, the diffraction intensity
is recorded. Then the sample is rotated to the next χ angle, with a step size of typically 5˚,
and again the sample is rotated through η while the intensity is measured. This process is
repeated until χ is scanned from 0˚ to 90˚. In this manner, all the sample directions (one
after another in a step size of typically 5˚ through χ and η) are brought into the diffraction
direction, i.e. the scattering vector. Thus, the intensity of one diffraction peak is measured
along ‘all’ the sample directions. The sampling grid is shown schematically in Fig. 2-16b.
The whole procedure is repeated for measuring each pole figure with a different
diffraction angle.
35

(a) (b)
Fig. 2-16 Schematic pole figure measurement using CW neutron diffraction: (a) the sample is
mounted in an Eulerian cradle which sits a diffractometer. The cradle allows the sample to be rotated
in χ and η such that all the sample directions can be brought into the scattering vector which bi-sects
the incident and diffracted beam. The diffractometer can rotate to a specified diffraction angle for
measuring the desired pole figure. The intensity is recorded at each of the measurement point
(represented by the dots in b), which is defined by χ and η. χ angles are from 0˚ to 90˚ with a step size
of 10˚, and η angles are from 0˚ to 360˚ with a step size of 10˚ (b). Note that in the real measurement
the step size is often set as 5˚ rather than 10˚. Part of (a) is copied from Ref. [73].
2.6 Polycrystalline modeling
Most engineering materials such as Zr alloys are polycrystalline. The mechanics of
polycrystal deformation is complex because of the interactions of the constituent crystals.
This is more evident in an hcp material comprising anisotropic single crystals and usually
exhibiting crystallographic texture as an aggregate. Polycrystalline models, which
represent the polycrystal as a collection of weighted grain orientations, have been
designed to represent the complex grain interactions, de-convolute the behaviour at the
single crystal level from the macroscopic behaviour and predict the behaviour at the
polycrystalline level. Polycrystalline models were developed over several generations, in
terms of the way they represent grain interactions.
36

The 1st generation of polycrystalline models includes the Taylor model [74] and the
Sachs model [75]. In the Taylor model (or upper-bound model), the local strain field is
assumed to be constant in space and, thus, equal to the global strain. The global stress is
obtained by averaging over all grains. Compatibility of the aggregate is identically
preserved, but in general intergranular stress equilibrium is violated. In the Sachs model
(or lower-bound model), the local stress field is assumed to be constant in space and
equal to the global stress tensor. As a consequence, each grain deforms uniformly.
Global strain results from averaging over the grains. Thus, the equilibrium condition is
identically fulfilled, but compatibility between grains is generally violated. The classical
simple Taylor model and Sachs model are rigid plastic models. The elastic lattice strains
cannot be directly calculated, but can be obtained by dividing the calculated stresses by
diffraction elastic constants [76]. The Sachs model can be easily extended to include the
elastic strain, while this is not trivial with an upper bound model [77].
The self-consistent scheme was introduced based on Eshelby’s inclusion theory [78].
In a self-consistent model, each grain is considered to be separately embedded in a
“homogeneous effective medium” (HEM) with the average properties of the polycrystal.
The stress and strain fields far from the inclusion are homogeneous and their values are
taken as the global ones [79]. The deformation and stress of each grain are obtained by
solving a separate boundary value problem. The material parameters for the HEM are
iterated until the properties of HEM equal those of the aggregate. Compatibility and
equilibrium conditions are fulfilled only between single grains and the surrounding HEM.
Self-consistent models are well suited for calculating intergranular strains.
The 2nd generation models of Kröner [80] and Budiansky-Wu [81] use fully elastic
37

coupling between the grains and the matrix, predicting only very low deformation
heterogeneity in the polycrystal.
The 3rd generation models are based on Hill [82] and Hutchinson’s theory [79]. In
the models, the coupling between the grains and the matrix is elastic-plastic, thus they
can predict a more realistic deformation heterogeneity in the polycrstal. The visco-elastic
[83 ], visco-plastic [84 ], elasto-plastic [85 ,86 ] self-consistent models are all of this
generation.
The above three generations of polycrystalline models are all ‘1-site’ models. These
consider the relationship of individual grains only to the matrix, which means that all
grains with the same crystallographic orientation behave in the same way. The
experimental reference for the ‘1-site’ models is ‘statistical’ measurement of elastic lattice
strains and peak intensities, which can be obtained by neutron diffraction. The
measurements in the grains at surface as measured by laboratory X-rays are not directly
relevant because they are not representative of the bulk polycrystal due to relaxation of
the normal component of stress [87].
The next generation is the ‘N-site’ models [88]. They consider the interaction of
neighbouring grains, taking into account their specific crystallographic orientations. In
these models all grains with the same crystallographic orientation do not necessarily
behave in the same way. The experimental reference is the measurement of lattice strains
in individual grains, which can be achieved using the high-penetration (i.e. ‘hard’), high-
flux X-rays collimated to ~1μm.
At present there are several commonly used elasto-plastic self-consistent (EPSC)
models and visco-plastic self-consistent (VPSC) models, all based on the Hutchinson’s
38

model. EPSC models include Turner et al. [85,86], Gloaguen et al. [89,90] and Clausen et
al. [ 91 ], and VPSC models include Lebensohn et al. [84], Rousselier et al. [ 92 ],
Lebensohn et al. [93], and Signorelli [94].
Polycrystalline models provide a method describing the material constitutive
behaviour which is derived from the averaged response of (typically) thousands of the
constituent ‘grains’. The model can be implemented in finite element programs through a
‘hybrid’ approach [95] (or ‘coupled’ approach), or interrogated by the finite element
program through a ‘look-up-table’ approach [ 96 ] (or ‘de-coupled’ approach). The
combination of polycrystalline modeling and finite element modeling is usually used to
simulate the non-uniform deformation of polycrystalline materials subject to complex
boundary conditions.
Alternatively, crystal plasticity models (e.g. based on dislocation movement) [97] or
‘N-site’ polycrystalline models, in combination with the finite element method, can be
used to derive the material behaviour by considering sets of interacting grains. This
combined model can provide the heterogeneous stress/strain distribution inside individual
grains and between different grains, which could be compared with ‘hard’ X-ray
measurements. The method is especially useful in modeling the occurrence and
propagation of twinning, which requires an accurate description of the stress/strain field
around the twins.
In this study, the Version 2002 of the EPSC code based on Turner et al. [85,86] is
used to model the internal strain evolution, and the Version 6 of the VPSC code based on
Lebensohn et al. [84] is used to model the texture evolution. The combination with the
finite element method will not be used in this research, because 1) the uni-axial
39

deformation of Zircaloy-2 in the research is considered uniform, and 2) the experimental
lattice strains are measured at the grain scale.
2.6.1 Issues in polycrystalline modeling
The input file for either EPSC or VPSC consists of single crystal data,
crystallographic texture and boundary conditions. The single crystal data comprises
elastic constants, thermal expansion coefficients and descriptions of slip and twinning
modes, for which the parameters (e.g. CRSSs and hardening parameters) are adjustable.
The input texture is represented by ‘discrete orientation file’ that normally consists of
~2000 grains (i.e. 10º × 10º × 10º mesh of the Euler space). A finer mesh (e.g. 5º × 5º ×
5º, ~15000 grains) may result in prohibitive computing time. The boundary conditions
can be either thermal loading or mechanical loading. In defining the mechanical loading,
either strain control or stress control is used. Strain (or stress) control means specifying
the macroscopic strain (or stress) in the model and calculating the stress (or strain)
response. The model calculations can generate results of the macro- (stresses, strains) and
microscopic behaviour (lattice strain from EPSC and texture from VPSC), and activities
of contributing deformation modes that are difficult to determine experimentally. The
lattice strain evolution can be plotted as a function of total strain or stress, but most often
in the literature, it is plotted against the stress.
The self-consistent polycrystalline models are based on the assumption of a
‘homogeneous’ effective medium surrounding individual grains. According to the
‘homogeneity’ assumption, grains in the same orientation in the model should behave in
the same manner, while in a physical polycrystal, each grain is very unlikely to interact
40

with the same kind of neighbouring grains. This is one limitation of the current self-
consistent models.
The measured lattice strain for one diffraction peak reflects an averaged response
over a set of grains in one family, i.e. grain orientations with a particular {hkil} within a
few degrees off a nominal direction in the sample. Note that grains in one orientation
have the same plane normal in one sample direction relative to the texture, but directions
of the plane normals in any direction other than the ‘measurement’ direction may be
different. For example, if }0110{ grains are ‘seen’ in RD, then perpendicular to RD, the
grains could be (0002), }0211{ or any other orientations perpendicular to the }0110{
plane normal. The experimental averaging is ‘statistics’ based; thus if a certain family
does not have sufficient number of grains, the measurement would become unreliable.
The measured grain family is not one orientation in the ODF space, but actually includes
many orientations. However, the calculation for a given ‘measurement’ orientation in the
model may not contain a sufficient number of the ODF orientations. Therefore, when
comparing the calculated lattice strains with the measured ones, those peaks with
relatively high texture coefficients (‘mrd’) should be more heavily weighted than those
with low texture coefficients.
The models represent hardening effects such as dislocation pile-ups at grain
boundaries and other obstacles, and intragranular stresses that physically exist inside bulk
grains using the parameters of an extended Voce hardening law [98]. As such they are
represented as being uniform within each crystal orientation. Such descriptions are an
empirical approximation and are not based on the real interactions of dislocations, but
rather only a simplified numerical treatment of these interactions. They are really only
41

applicable to monotonic loading, and as a consequence, during unloading, any reverse
plastic strain that might occur within individual grains is not accounted for, and therefore
the calculation of residual strains is likely to be less reliable than those calculated at load.
Both EPSC and VPSC have a pseudo twinning model – they treat twinning as a slip
mode that can move in only one direction (or ‘directional’ slip) [99], rather than real
twinning process that leads to not only the strain accommodation, but also local stress
relaxation. It will be shown that the incapability to correctly model twinning has resulted
in the relatively ‘poor’ agreement between predictions and experiments in this study,
when twinning is profuse (see Chapter 5). A realistic twinning model is needed to predict
the local stress relaxation [100], and essentially, to describe how such a relaxation is
brought about and how twins nucleate and propagate.
The EPSC model cannot predict the plastic behaviour without hardening [86]. This
restricts calculations with significant stress relaxation (induced by either twinning or
dislocation annihilation). Furthermore, including the grain rotations in EPSC requires a
complicated treatment and long computational time, in order to track the texture
evolution during deformation. Clausen [76] has implemented the grain rotation based on
some approximation, and Agnew’s group is currently improving this implementation
[101], but these models are not yet available for general use. The lack of the ability of
tracking grain reorientation highlights a potential limitation with the current EPSC model.
Currently using either EPSC or VPSC requires the determination of a large number of
parameters. This is a practical difficulty in performing the modeling, as there are a huge
number of combinations to test. The modeling becomes more difficult when one aims at
fitting a large set of experimental data by using a single set of parameters. It is safe to
42

say that perfect fitting to every objective is impossible given the deficiency of the current
models, especially in those cases associated with non-negligible twinning activities. One
needs to decide which objectives are more important than the others and expend efforts in
meeting the most important objectives, while assigning other objectives lower priority.
A better solution is to devise a robust numerical optimization method; however, such a
task would represent a research project in itself and will not be attempted here.
In this research, attention is paid with respect to the process of modeling and the
evaluation of the modeling results. The intrinsic limitations associated with the models
themselves, such as the ‘homogeneity’ assumption, the twinning model and hardening,
are not addressed.
2.7 Relevant studies
Complications in describing the anisotropic nature of Zr alloys, in general, arise from
(1) the highly anisotropic properties of the hcp single crystals, (2) the crystallographic
texture induced by the manufacturing process, and (3) the complex interactions of the
crystals when they are in the form of a polycrystalline aggregate. Neutron diffraction, in
combination with polycrystalline models, provides a viable means to de-convolute the
complexity of anisotropic deformation of polycrystalline Zr alloys. Here only the single
phase (hcp) zirconium and its alloys are considered.
2.7.1 Experimental lattice strain and texture data
Internal strains during uniaxial tension and compression in swaged and recrystallized
Zircaloy-2 with axisymmetric rod texture have previously been investigated [47,48,85,
43

102], Table 2-3 (see page 52). Rolled Zr, Zircaloy-2 and Zircaloy-4 with rolling textures
have also been studied in determining lattice strain evolution or, mostly, residual lattice
strains measured ex-situ (no in-situ residual lattice strain data available)
[86,89,90,103,104, 105], Table 2-3. The materials and deformation conditions are
briefly summarized in the table. Neutron diffraction (CW or TOF) in the majority of the
studies, and X-ray diffraction in a few, have been used to collect the experimental
internal strain data. However, most studies to date have only considered small strain
(<5%) deformation, one test direction (relative to the texture) and one or two
measurement directions (relative to the loading direction). There is little information
concerning how internal strains develop (1) in three dimensions under different applied
loads, and (2) in large strain (>5%) plastic deformation, in particular for materials with a
more general bulk texture than the rod-type.
Compared to the relative scarcity of lattice strain data, there is plenty of deformation
texture data. Deformation textures in α-phase Zr and its alloys made by various
manufacturing processes have been reported extensively in the literature, to list a few:
rolling Zircaloy-2 at 623K [19], cold rolling Zircaloy-2 [106], cross-rolling Zircaloy-2
[ 107 ], cold rolling thin strips of Zircaloy-4 [ 108 ], cold rolling Zr [ 109 ], uniaxial
stretching nuclear quality Zr sheet [110], uniaxial compressing crystal-bar Zr [111],
torsion of Zircaloy-4 at 1023K [112], plane strain channel-die compressing Zr-702 sheet
at room temperature [113], tube reducing Zircaloy [114,115,116,117,118], and tube
pilgering α-phase ZIRLO tube [119]. However, most of the research only reported the
texture after deformation, and the interpretations were qualitative. There is little
information concerning how texture develops during the process of deformation, which
44

might shed light on the activities of deformation modes, especially twinning. For Zr
alloys, there is little information published so far concerning the influence of texture
evolution on the build-up of intergranular strains.
2.7.2 Interpretations of lattice strain and texture evolution
A complication in studying material properties associated with Zr alloys is the
impossibility of growing moderate-sized single crystals of α-Zr due to a combination of
the allotropic phase transformation and the presence of alloying elements which partition
between the phases. As a consequence, it is impossible to make direct measurements of
the single crystal properties for alloys. In addition, the constraints and presence of grain
boundaries in the polycrystals may produce differences in the initiation and development
of active deformation mechanisms from those of unconstrained single crystals.
Qualitative interpretations of the lattice strain and texture evolution are useful, but to a
limited extent, for the understanding of plastic deformation. More recently, quantitative
(more or less) interpretations were made and developed with the development of
polycrystalline models, but to date, such interpretations are limited by relatively small
experimental data sets.
2.7.2.1 Qualitative interpretations
Lattice strain
Qualitative interpretation of the lattice strain evolution during in-situ loading has only
been reported by Pang et al. [48] based on the assumption of an initially random texture
in Zircaloy-2. The intergranular stresses were concluded to be generated from the ‘mis-
match’ between ‘hard’ and ‘soft’ grains, as discussed in Section 2.4.
45

Texture
Qualitative understanding of how texture evolves during cold working, which is in
terms of macroscopic plastic strain conditions, was developed as early as in 1960’s [e.g.
17]. Good summaries of such work were given by Källström [120], Tenckhoff [12,109],
and most recently, Tenckhoff [15] and Murty et al. [35]. The texture in the work mainly
referred to the distribution of basal plane normals, which have a much more pronounced
effect than the distribution of other plane normals, on the plastic anisotropy of the
material that is of significant technological concerns.
The principal basis of a qualitative empirical understanding (in terms of macroscopic
strain conditions) of how texture evolves during cold working is that 1) basal plane
normals tend to be aligned with the direction of maximum macroscopic compressive
strain [116], and 2) prism plane { 0110 } normals tend to be aligned with the direction at
0˚ and ±60º from the direction of maximum macroscopic tensile strain [e.g.
12,15,17,35,108,109,120,121]. Recrystallization maintains the orientation of the basal
normals but rotates the { 0110 } and { 0211 } normals 30° around the c-axis, bringing the
{ 0211 } normals into the positions that the { 0110 } normals occupy after cold-work, and
vice versa [108,122]. These qualitative principles have helped to understand the textures
observed during tube reduction, rolling and wire drawing. For example, tube reduction
with 3Q>>1 (or sheet rolling) produces a texture with the basal plane normals near the
radial (or normal) direction as the maximum compressive strain is along the radial (or
normal) direction. The basal normal maxima usually are tilted by ±20-40˚ towards the
tangential (or transverse) direction. The { 0110 } normals are tilted towards the axial (or
3 Q is the ratio of thickness reduction to diameter reduction during the tube reduction process.
46

rolling) direction and ±60º from the axial (or rolling) direction (i.e. the direction of
maximum tensile strain) in the axial (or rolling)-tangential (or transverse) plane. Tubing
deformed with Q<<1 attains a texture with the basal normals parallel to the tangential
direction along which the compressive strain is the largest. The { 0110 } normals are
aligned with the axial direction and ±60º from the axial direction in the axial-radial plane.
Tubing deformed with Q≈1 (or wire drawing) has a uniform distribution of the basal
normals in the radial-tangential plane as the compressive strain is the same in all
directions in the radial-tangential plane (see Fig. 2-17 [123,124]). The { 0110 } normals
are uniformly distributed at 0˚ and ±60º from the axial direction. General relations among
plastic strain path, tubing texture and mechanical anisotropy were established [120]. A
stable texture can be achieved by a certain degree of straining along a given strain path.
Once a final stable texture is formed, further deformation along the same path does not
change the character of the texture, but only its sharpness [12].
A qualitative understanding based on the microscopic deformation mechanisms was
also developed. Hobson [125] deformed single crystal Zr at different orientations by
drawing and rolling. The grain reorientations were traced after deformation of 20% strain,
below which the textures were not well established. He concluded that twinning is more
important in the early stages (~20% strain), and slip is more important in the final stages
(maximum strain 95%) of texture development. Tenckhoff [109] deformed large grain-
sized Zr polycrystal with a more or less random initial texture in sequential rolling steps.
He concluded that slip causes continuous, but relatively gradual grain reorientation
(usually <45˚), although the strain achieved can be great, while twinning causes abrupt,
but large grain rotations (usually >45˚), although the strain achieved is relatively small
47

Fig. 2-17 Application of the stress-strain concept to texture development for Zr alloys in tube
reduction (a1-a3), sheet rolling (b) and wire drawing (c) operations. [12] In (a) and (c), AD=axial
direction, RD=radial direction, TD=tangential direction. In (b) ND=normal direction, TD=transverse
direction, RD=rolling direction.
[109]. Twinning is also important as the reorientated grains may be favourable for the
activation of slip for further deformation.
The fact that ‘basal plane normals tend to be aligned with the direction of maximum
macroscopic compressive strain’, was interpreted by several workers to be a result of
twinning. Typically, Picklesimer [17] suggested that this was due to the }2211{
48

compression twinning. Cheadle et al. [116] suggested that it was a result of }2110{
tension and }2211{ compression twinning. Similarly, Tenckhoff [12,109] attributed it to
}2110{ and }1211{ tensile twinning, and }2211{ compression twinning. Tensile twinning
occurs when the c-axis is in tensile strain, or when the direction perpendicular to the c-
axis is in compressive strain. Compression twinning happens when the c-axis is in
compression [109].
The tilt of the maxima in the basal normal distribution at ±20-40˚ towards the
tangential (or transverse) direction during Q>>1 tube reduction (or rolling) was explained
by pyramidal <c+a> slip on the }1211{ or }1110{ plane; <c+a> slip was also invoked to
explain the compressive strain along the c-axis in Zr alloys [8,18,126]. The reorientation
of the { 0110 } normals towards 0˚ and ±60˚ from the direction of maximum tensile strain
was interpreted as a result of prism slip { 0110 }< 0211 > [12,19,109].
2.7.2.2 Quantitative interpretation
Quantitative interpretations of the development of lattice strain and texture are made
by a combination of experiments and polycyrstalline models. Matching the modeling
results with the experimental data is the only practical means to derive the active plastic
deformation modes and their associated CRSSs in polycrystals.
The upper-bound model or self-consistent polycrystalline models have been used to
interpret the lattice strain or texture development and hence deduce the active
deformation mechanisms during uni-axial tension, compression or rolling. The adjustable
modeling parameters are mainly the CRSSs and hardening parameters of deformation
modes. The lack of sufficient knowledge regarding the values of these parameters
constitutes a difficulty for performing polycrystalline modeling. This arises mainly
49

because there are a large number of fitting parameters and a small set of experimental
data to constrain all the parameters.
Since each deformation mode (slip and twinning) is characterized by several
parameters, choosing the minimum necessary set of deformation modes can greatly help
reduce the fitting parameters (and test combinations), and thus the difficulty of applying
models. Even introducing one more parameter dramatically expands the parametric
space and enhances the level of difficulty. For this reason, sometimes only the minimum
necessary set of deformation modes was selected in the literature, i.e. prism slip and
pyramidal <c+a> slip (or tensile twinning) which can accommodate the plastic
deformation along the c-axis. Basal slip has been included a few times, and has been
found to improve the ability to reproduce experimental macroscopic flow curves [48] and
bulk texture development [113, 127 , 128 ] caused by plastic deformation. Other
researchers [e.g. 110,129,130] have instead preferred to include pyramidal <a> slip as an
alternative to basal slip in order to achieve optimal agreement with their experimental
data reasoning that <a> dislocations would more easily cross-slip from the prism plane
}0110{ onto the geometrically close pyramidal plane }1110{ (activation of pyramidal <a>
slip) than is onto, the basal plane (activation of basal slip). Only Sanchez et al. [112]
used the VPSC model to investigate the effects of basal and pyramidal <a> slip. The
experiment was high temperature torsion. In their work, basal slip was concluded to be
more important than pyramidal <a> slip. A solid justification of choosing either basal or
pyramidal <a> slip at room temperature based entirely on modeling has not been found.
However, the absence of any experimental evidence that pyramidal <a> slip occurs under
any conditions (Section 2.2) seems to justify the exclusion of it in modeling.
50
Interactions between dislocations, and between dislocation and twin, have been
observed experimentally in Zr [e.g. 131, 132, 133] and its alloys [e.g. 134]. The work-
hardening due to dislocation interactions requires complex treatment in any plasticity
models. In some models (e.g. EPSC and VPSC), 4 self and 5 latent hardening parameters
are provided to empirically account for such hardening effects. Unfortunately, few studies
have considered these parameters due to the modeling complexity arising from the large
number of the inter-related parameters. In modeling lattice strain evolution, self-
hardening has been considered by some researchers (will be shown in Table 2-3), but
latent hardening has never been accounted for. The derived values of the self-hardening
parameters vary greatly, reflecting the ambiguity in the determination of this parameter.
In modeling texture evolution, effects of ‘slip-twinning’ interaction have been accounted
for (e.g. [ 135 ]), but the ‘slip-slip’ interaction and self-hardening have never been
considered.
The ambiguity in selecting appropriate deformation modes and the values of any
related parameters is mostly due to the lack of sufficient constraints imposed by limited
experimental data sets. Experimental data may include some or all of macroscopic stress-
strain curves, Lankford coefficients, and microscopic internal strains (in-situ at load and
residual), peak intensities, peak widths, and texture. The validity of the derived CRSSs
and hardening parameters is much dependent on the size of the experimental data set.
Although completely unambiguous parameters are impossible to obtain through the
‘inverse’ fitting approach, introducing more experimental data to constrain the fits brings
more confidence in the derived active deformation mechanisms.
4 Slip on each slip system is completely independent of the history of slip on other slip systems. 5 Hardening on one slip system affects hardening on the other slip systems.
51

52
Lattice strain
Performing the EPSC modeling of lattice strains, most of the researchers (see Table
2-3) only focused on fitting the ex-situ measured residual lattice strain for a few
diffraction peaks measured in one or two directions, for either tension, compression or
rolling. Note that fitting to the residual strains using the current EPSC model is
somewhat questionable due to the inability of the model to account for relaxation effects
during unloading (see Section 2.6.1). This implies that the derived single crystal
properties by modeling residual lattice strains are not fully reliable. A few of the
researchers aimed at fitting the macroscopic flow curves as well as lattice strains (see
Table 2-3). Only Pang et al. [48] fitted the in-situ at-load lattice strain evolution
measured in two directions during tension along one direction.
The CRSSs and hardening parameters used to simulate lattice strains in the literature
using EPSC or upper bound models are listed in Table 2-3.
Texture
In modeling texture evolution using VPSC, most often only the basal and/or prism
pole figures were quoted as the fitting objectives. Sometimes the flow curves were also
considered. However, the Lankford coefficients and the history of three dimensional
peak intensity development have never been treated as fitting objectives. None has
simultaneously fitted the texture evolution observed during tension and compression in
more than two directions.
The ratios of the CRSSs used to simulate textures in the literature using VPSC or
upper bound models are listed in Table 2-4 [28,35,84,99,111,112,127,128,130,135,136,
137,138,139].
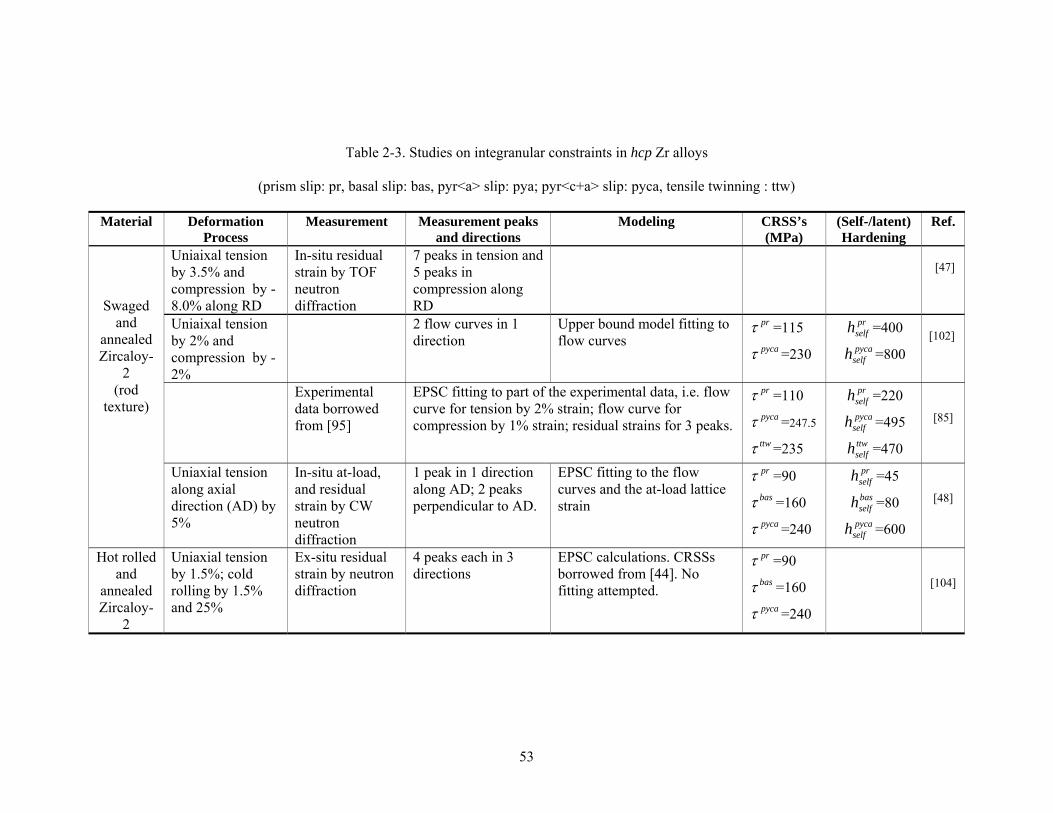
Table 2-3. Studies on integranular constraints in hcp Zr alloys
(prism slip: pr, basal slip: bas, pyr<a> slip: pya; pyr<c+a> slip: pyca, tensile twinning : ttw)
Material Deformation Process
Measurement Measurement peaks and directions
Modeling CRSS’s (MPa)
(Self-/latent) Hardening
Ref.
Swaged and
annealed Zircaloy-
2 (rod
texture)
Uniaixal tension by 3.5% and compression by -8.0% along RD
In-situ residual strain by TOF neutron diffraction
7 peaks in tension and 5 peaks in compression along RD
[47]
Uniaixal tension by 2% and compression by -2%
2 flow curves in 1 direction
Upper bound model fitting to flow curves
prτ =115 pycaτ =230
prselfh =400 pyca
selfh =800
[102]
Experimental data borrowed from [95]
EPSC fitting to part of the experimental data, i.e. flow curve for tension by 2% strain; flow curve for compression by 1% strain; residual strains for 3 peaks.
prτpycaτttwτ
=110
=247.5
=235
prselfh =220 pyca
selfh =495 ttwselfh =470
[85]
Uniaxial tension along axial direction (AD) by 5%
In-situ at-load, and residual strain by CW neutron diffraction
1 peak in 1 direction along AD; 2 peaks perpendicular to AD.
EPSC fitting to the flow curves and the at-load lattice strain
prτbasτpycaτ
=90
=160
=240
prselfh =45 basselfh =80
pycaselfh =600
[48]
Hot rolled and
annealed Zircaloy-
2
Uniaxial tension by 1.5%; cold rolling by 1.5% and 25%
Ex-situ residual strain by neutron diffraction
4 peaks each in 3 directions
EPSC calculations. CRSSs borrowed from [44]. No fitting attempted.
prτbasτpycaτ
=90
=160
=240
[104]
53

Table 2-3. Studies on integranular constraints in hcp Zr alloys (continued)
Material Deformation Process
Measurement Measurement peaks and directions
Modeling CRSS’s (MPa)
(Self-/latent) Hardening
Ref.
Rolled Zircaloy-
2
Uniaxial tension by 4% and compression by -3% along RD and TD.
2 flow curves each in 2 directions
EPSC fitting to 2 flow curve tested in one direction only (RD)
prτpycaτttwτ
=110
=200
=210
prselfh =1100 pyca
selfh =2000 ttwselfh =2100
[86]
Uniaxial tension at room temperature along RD by 1.5%
Ex-situ residual strain by CW neutron diffraction
5 peaks and 5 directions, with 1 peak in 1 direction
EPSC calculations. CRSSs borrowed from [86]. No fitting attempted.
prτpycaτttwτ
=110
=200
=210
[103] Cold rolling by
1.5% Ex-situ residual strain by CW neutron diffraction
5 peaks and 5 directions, with 1 peak in 1 direction
EPSC calculations. Only pycaτ adjusted.
prτpycaτttwτ =210
=110
=330
Cold rolled sheet
industrial grade Zr
702α
Uniaxial tension by 1% along TD and RD
Ex-situ residual strain by X-ray diffraction
2 peaks along each of the 3 directions
EPSC fitting to 2 flow curves prτ =118 pycaτttwτ =240
=190
[89]
Tensile test along RD by 2% along RD
Ex-situ residual strain by X-ray diffraction
2 peaks along each of the 3 directions
EPSC results compared to 1 flow curve. CRSSs borrowed from [89]. No fitting attempted.
prτ =118 pycaτttwτ =240
=190
[105]
Cold rolled
Zircaloy-4 sheet
Cold rolling by 47%
Ex-situ residual strain by X-ray diffraction
3 peaks in total; 2 peaks in each of the 2 directions.
Modified EPSC fitting to residual strains
prτ =95 pyaτ =237. 5pycaτ =285 ttwτ =190
prselfh =80
pyaselfh =140
=120 pycaselfh
ttwselfh =160
[90]
54

Table 2-4. CRSS’s used for texture modeling of hcp Zr alloys (MPa)
(prism slip: pr, basal slip: bas, pyr<a> slip: pya; pyr<c+a> slip: pyca, tensile twinning : ttw, compression twinning: ctw)
Material Deformation Process - Model CRSS’s ratio Self/latent
Hardening Ref.
Crystal Zr bar Uniaxial deformation – Upper bound prτ : : = 1 : 2 : 10 basτ pycaτ [111]
Zircaloy-4 Cold rolling - VPSC prτ : : = 1 : 2 : 2 ttwτ ctwτ [130]
Zircaloy-4 Cold rolling - VPSC prτ : : = 1 : 1.25 : 2.5 ttwτ ctwτ [84]
Rolled and heat treated Zr Cold rolling - VPSC prτ : : = 1 : 2 : 2 ttwτ ctwτ [136]
Zircaloy-4, thin strips
Cold rolling to transverse texture -VPSC prτ : ttwτ : ctwτ = 1 : 1.25 : 2.5 [99]
Cold rolling to Rolling texture - VPSC prτ : pycaτ : ttwτ = 1 : 4.0 : 1.5
Nuclear quality Zr Hot rolled and recyrstallized
Cold rolling - Upper bound
prτ : basτ : pycaτ = 1 : 5~6 : 9 [28] Zircaloy-4
Hot rolled and recyrstallized prτ : basτ : pycaτ : ttwτ = 1 : 3 : 7 : 9
Industrial grade Zr 702α
Channel die compression at 300K - VPSC
prτ : basτ : pyaτ : pycaτ : ttwτ = 1 : 1.3 : 4 : 4 : 2.5 [128]
prτ : basτ : pycaτ : ttwτ = 1 : 2 : 1.8 : 1.2 [127]
55

56
Table 2-4. CRSS’s used for texture modeling of hcp Zr alloys (continued)
Material Deformation Process - Model CRSS’s ratio Self/latent
Hardening Ref.
Zircaloy-4 Cold rolling - VPSC prτ : : = 1 : 2.3~4 : 1.25~1.5 pycaτ ttwτ [137]
Zircaloy-4 Torsion test at 1050 K - VPSC prτ : : : = 1 : 4 : 2 : 8 basτ pyaτ pycaτ [112]
Zirconium Cold rolling - VPSC prτ : : : : = 1 : 2.4 : 3 : 1.3 : 2.7
basτ pycaτ ttwτ ctwτ [138]
Zirconium Uniaxial tension and compression
at 300K - VPSC
prτ : : = 1: 12: 10 pycaτ ttwτ hpr/ttw=hbas/ttw=
hpyca/ttw=httw/ttw=10
[135]
Recrystallized Zircaloy-4 sheet
Uniaxial tension at 300K
- Lower bound
prτ : : = 1 : 100 : 100 basτ pycaτ [35]
Zircaloy-4 sheet Cold rolling - VPSC prτ : : = 1 : 4.0 : 1.5 pycaτ ttwτ [139]

References [1] J. Goldak, L.T. Lloyd and C.S. Barrett, Phys. Rev. 144 (1966) 478-484
[2] E.S. Fischer and C.J. Renken, Phys. Rev. A 135 (1964) 482-494
[3] P.G. Partridge, Metall. Rev. 118 (1967) 169-194
[4] E.J. Rapperport, Acta Metall. 3 (1955) 208
[5] E.J. Rapperport, Acta Metall. 7 (1959) 254-260
[6] E.J. Rapperport, Trans. TMS AIME 218 (1960) 869- 876
[7] A. Akhtar, Acta. Metall. 21 (1973) 1-11
[8] E. Tenckhoff, Z. Metallkde 63 (1972) 192-196
[9] R.E. Reed-Hill, W.H. Hartt and W.A. Slippy Trans Metall. Soc. AIME 242 (1968) 2211-2215
[10] A. Akhtar and E. Teghtsoonian, Acta. Metall. 19 (1971) 655-663
[11] A. Akhtar, J. Nucl. Mater. 47 (1973) 79-86
[12] E. Tenckhoff, “Deformation mechanisms, texture and anisotropy of zirconium and zircaloy”,
ASTM STP 966, ASTM International, West Conshohocken, PA (1988)
[13] D.G. Westlake, J. Nucl. Mater. 13 (1964) 113-115
[14] J.I. Dickson and G.B. Craig, J. Nucl. Mater. 40 (1971) 345-348
[15] E. Tenckhoff, J. ASTM Inter. 2 (2005) 1-26
[16] R. von Mises, Zeitschrift angewandte Mathematik Mechanik 8 (1928) 161-185
[17] M.L. Picklesimer, Electrochem Tech. 4 (1966) 289-300
[18] J.A. Jensen and W.A. Backofen, Can. Met. Quart. 11 (1972) 39-51
[19] R.G. Ballinger, G.E. Lucas and R.M. Pelloux, J. Nucl. Mater. 126 (1984) 53-69
[20] R.W. Cahn, Acta Metall. 1 (1953) 49-70
[21] R.G. Ballinger, J. Nucl. Mater. 97 (1981) 231-253
[22] J.E. Bailey, J. Nucl. Mater. 7 (1962) 300-310
[23] E. Tenckhoff, Zeitschrift fuer metallkunde 61 (1970) 64-71
[24] O.T. Woo, G.J.C. Carpenter and S.R. MacEwen, J. Nucl. Mater. 87 (1979) 70-80
57

58
[25] D.H. Baldwin and R.E. Reed-Hill, Trans. AIME 233 (1965) 248-249
[26] R.E. Reed-Hill, in Deformation Twinning, edited by R.E. Reed-Hill, J.P. Hirth and H.C.
Rogers, AIME (1964) 295-320
[27] R.J. McCabe, E.K. Cerreta, A. Misra, G.C. Kaschner and C.N. Tomé, Phil. Mag. 86 (2006)
3595-3611
[28] M.J. Philippe, M. Serghat, P. Van Houtte and C. Esling, Acta Metall. Mater. 43 (1995) 1619-
1630
[29] G.J.C. Carpenter, J.F. Watters and R.W. Gilbert, J. Nucl. Mater. 48 (1973) 267-276
[30] K. Pettersson, J. Nucl. Mater. 105 (1982) 341-344
[31] J.L. Martin and R.E. Reed-Hill, Trans. TMS AIME 230 (1964) 780-785
[32] M.J. Philippe, C. Esling and B. Hocheid, Textures and Microstructures 7 (1988) 265-301
[33] M. Fregonese, C. Régnard, L. Rouillon, T. Magnin, F. Lefebvre and C. Lemaignan,
Zirconium in the Nuclear Industry 12th International Symposium, edited by G. P. Sabol and G.D.
Moan, ASTM STP 1354 (2000) 377-396
[34] V. Randle and O. Engler, Introduction to Texture Analysis: macrotexture, microtexture and
orientation mapping, published by Gordon and Breach Science Publishers, Amsterdam, The
Netherlands (2000)
[35] K.L. Murty and I. Charit, Prog. Nucl. Engergy 48 (2006) 325-359
[36] H.J. Bunge, Texture Analysis in Materials Science, Butterworths Press, London, 1982
[37] H.J. Bunge, The 8th Int. Conf. Textur. Mater. J.S. Kallend and G.Gottstein, eds. (Warrendale,
PA: The Metallurgical Society) 69-78
[38] C.E. Ells, C.E. Coleman and C.K. Chow, Can. Metall. Quart. 24 (1985) 215-223
[39] U.F. Kocks, C.N. Tome and H.R. Wenk, Texture and Anisotropy: preferred orientations in
polycrystals and their effect on materials properties, (2000) Cambridge University Press,
Cambridge, UK

59
[40] B.D. Cullity, Elements of X-Ray Diffraction, 2nd ed., Addison-Wesley, Reading, MA (1978)
[41] C.J. Humphreys and E.G. Bithell, in ‘Electron diffraction techniques’, J.M. Cowley, ed.,
Oxford University Press, Oxford, UK (1992)
[42] C.G. Schull and E.O. Wollan, Rev. Mod. Phys. 67 (1995) 735-751
[43] R.A. Holt and A.R. Causey, J. Nucl. Mater. 150 (1987) 306-318
[ 44 ] M.T. Hutchings, P.J. Withers, T.M. Holden and T. Lorentzen, Introduction to the
characterization of residual stress by neutron diffraction, published by CRC press, Taylor &
Francis Group, Boca Raton, Florida, USA (2005)
[45] B.D. Cullity and S.R. Stock, Elements of X-Ray Diffraction, 3rd ed., Prentice Hall, NJ (2001)
[46] P.J. Withers and H.K.D.H. Bhadeshia, Mater. Sci. Tech. 17 (2001) 355-365
[47] S.R. MacEwen, N. Christodoulou and A. Salinas-Rodriguez, Metall. Trans. A 21 (1990)
1083-1095
[48] J.W.L. Pang, T.M. Holden, P.A. Turner and T.E. Mason, Acta Mater. 47 (1999) 373-383
[49] K. Sasaki, M. Kishida and T. Itoh, Exp. Mech. 37 (1997) 250-257
[50] G.A. Webster and R.C. Wimpory, J. Mater. Proc. Tech. 117 (2001) 395-399
[51] A. Allen, C. Andreani, M.T. Hutchings and C.G. Windsor, NDT Inter. (1989) 249-254
[52] G.A. Webster and R.C. Wimpory, Appl. Phys. A74 (2002) 1227-1229
[53] G.E. Bacon, Neutron Diffraction (1975) Clarendon Press, Oxford, UK
[54] W.M. Lomer and G.G. Low, in Thermal Neutron Scattering, P.A. Egelstaff, Ed., Academic
Press, New York (1965)
[55] A.J. Allen, M.T. Hutchings, C.G. Windsor and C. Andreani, Adv. Phys. 34 (1985) 445-473
[56] W.L. Bragg, Proc. Cambridge Phil. Soc. 17 (1914) 43–57
[57] http://neutron.nrc-cnrc.gc.ca/l3gen_e.html
[58] http://neutron.nrc-cnrc.gc.ca/l3tech_e.html
[59] A. Lodini, Radiation Phys. Chem. 61 (2001) 227-233

60
[60] R.B. Rogge, private communication (2005)
[61] L.E. Edwards, P.J. Withers and M.R. Daymond, 6th Int Conf Residual Stress, Oxford, IOM
Communications, Ltd., London Vol.2 (2000) 1116-1123
[62] J.A. Dann, M.R. Daymond, J.A.J. James, J.R. Santisteban and L. Edwards, Int. Colloquium
on Advanced Neutron Sources XVI, Forschung-szentrum Jülich GMBH, Eds. G. Mank and H.
Conrad, Dusseldorf-Neuss, (2003) 231-238
[63] M.R. Daymond and L. Edwards, Neutron News, 15 (2004) 24-29
[64] http://www.isis.rl.ac.uk/isis2001/highlights/TheISISneutron.htm
[65] C.G. Windsor, Pulsed Neutron Scattering, Cambridge University Press, Cambridge, UK
(1982)
[66] J.M. Carpenter, R.A. Robinson, A.D. Taylor and D.J. Picton, Nucl. Inst. Methods Phys. Res.
A 234 (1985) 542-551
[67] S.R. MacEwen, J. Faber Jr. and P.L. Turner, Acta Metall. 31 (1983) 657-676
[68] A.C. Larson and R.B. Von Dreele, General Structure Analysis System, Report No. LAUR
86-748 (1994)
[69] J.R. Santisteban, M.R. Daymond, L. Edwards and J.A. James, J. Appl. Cryst. 39 (2006) 812-
825
[70] M.R. Daymond and H.G. Priesmeyer, Acta Mater. 50 (2002) 1613-1626
[71] http://neutron.nrc-cnrc.gc.ca/e3gen_e.html
[72] H.J. Bunge and J. Tobisch, Z. Metallkde. 59 (1968) 371
[73] H.J. Bunge, Textu. Microstru. 10 (1989) 265-307
[74] G.I. Taylor, J. Inst. Metals 62 (1938) 307-324
[75] Z. Sachs, Ver. Dtsch. Ing. 72 (1928) 734-736
[76] B. Clausen: PhD Thesis, Risø-R-985(EN), Risø National Laboratory, Roskilde, Denmark,
1997

61
[77] R.J. Asaro and A. Needleman, Acta Metall. 33 (1985) 923-953
[78] J.D. Eshelby, Proc. Roy. Soc. London A 241 (1957) 376-396
[79] J.W. Hutchinson, Proc. Royal Society of London A 319 (1970) 247-272
[80] E. Kröner, Acta Metall. 9 (1961) 155-161
[81] B. Budiansky and T.T. Wu, Proc. 4th Congr. Appl. Mech. (1962) 1175-1185
[82] R. Hill, J. Mech. Phys. Solids 13 (1965) 89-98
[83] P.A. Turner and C.N. Tomé, J. Mech. Phys. Solids 41 (1993) 1191-1211
[84] R.A. Lebensohn and C. Tomé, Acta Metall. Mater. 41 (1993) 2611-2624
[85] P.A. Turner and C.N. Tomé, Acta Metall. Mater. 42 (1994) 4143-4153
[86] P.A. Turner, N. Christodoulou and C.N. Tomé, Int. J. Plast. 11 (1995) 251-265
[87] L. Margulies, T. Lorentzen, H.f. Poulsen and T. Leffers, Acta Mater. 50 (2002) 1771-1779
[88] A. Molinari, G.R. Canova and S. Ahzi, Acta Metall. 34 (1986) 2139-2149
[89] D. Gloaguen, M. François, R. Guillén and J. Royer, Acta Mater. 50 (2002) 871-880
[90] D. Gloaguen, T. Berchi, E. Girard, R. Guillén, Acta Mater. 55 (2007) 4369-4379
[91] B. Clausen, T. Lorentzen and T. Leffers, Acta Mater. 46 (1997) 3087-3098
[92] G. Rousselier and S. Leclercq, Int. J. Plast. 22 (2006) 685-712
[93] R.A. Lebensohn, P.A. Turner, J.W. Signorelli, G.R. Canova and C.N. Tomé, Modell. Simu.
Mater. Sci. Eng. 6 (1998) 447-465
[94] J.W. Signorelli, PhD. Thesis, Universidad Nacional de Rosario, Argentina (1999)
[95] A.J. Beaudoin, P.R. Dawson, K.K. Mathur and U.F. Kocks, Int. J. Plast. 11 (1995) 501-521
[96] R.G. Sauvé and D.R. Metzger, J. Press. Vessel Tech, ASME Trans. 117 (1995) 170-176
[97] I.J. Beyerlein and C.N. Tomé, Int. J. Plast. (2007), doi: 10.1016/j.ijplas.2007.07.017
[98] C.N. Tomé, G.R. Canova, U.F. Kocks, N. Christodoulou and J.J. Jonas, Acta Metall. 32
(1984) 1637-1653
[99] R.A. Lebensohn and C.N. Tomé, Mater. Sci. Eng. A 175 (1994) 71-82

62
[100] R.Y. Zhang, M.R. Daymond and R.A. Holt, Mater. Sci. Eng. A (2007), doi:10.1016/
j.msea.2007.04.021
[101] B. Clausen, private communication (2007)
[102] S.R. MacEwen, C.N. Tomé and J. Faber, Acta Metall. 37 (1989) 979-989
[103] C.N. Tomé, N. Christodoulou, P.A. Turner, M.A. Miller, C.H. Woo, J. Root and T.M.
Holden, J. Nucl. Mater. 227 (1996) 237-250
[104] T.M. Holden, J.H. Root, R.A. Holt and P.A. Turner, J. Nucl. Mater. 304 (2002) 73-82
[105] D. Gloaguen, M. François and R. Guillén, J. Appl. Cryst. 37 (2004) 934-940
[106] M. Kiran Kumar, C. Vanitha, I. Samajdar, G.K. Dey, R. Tewari, D. Srivastava and S.
Banerjee, Mater. Sci. Tech. 22 (2006) 331-342
[107] R.G. Ballinger, The anisotropic behaviour of Zircaloy-2, Garland, New York (1979)
[108] D. Charquet, E. Alheritiere and G. Blanc, Zirconium in the Nuclear Industry, ASTM STP
939 (1987) 663
[109] E. Tenckhoff, Metall. Trans. A 9 (1978) 1401-1412
[110] M.J. Philippe, F. Wagner and C. Esling, Proc. 8th Int. Conf. Textur. Mater., edited by J.S.
Kallend and G. Gottstein (1988) 837-842
[111] A. Salinas Rodríguez and J.J. Jonas, Metall. Trans. A 23 (1992) 271-293
[112] P. Sanchez, A. Pochettino, T. Chauveau, B. Bacroix, J. Nucl. Mater. 298 (2001) 329-339
[113] H. Francillette, B. Bacroix, M. Gaspérini and J.L. Béchade, Mater. Sci. Eng. A 234-236
(1997) 974-977
[114] B.A. Cheadle and C.E. Ells, Trans. TMS AIME 233 (1965) 1044-1052
[115] K.P. Steward and B.A. Cheadle, Trans. TMS AIME 239 (1967) 504-512
[116] B.A. Cheadle, C.E. Ells and W. Evans, J. Nucl. Mater. 23 (1967) 199-208
[117] E. Tenckhoff, Zeitschrift fuer metallkunde 61 (1970) 64-71
[118] E. Tenckhoff and P.L. Rittenhouse, Zeitschrift fuer Metallkunde 63 (1972) 83

63
[119] V.M. Allen, M. Preuss, J.D. Robson and R.J. Comstock, Mater. Sci. For. 495-497 (2005)
675-680
[120] K. Källström, Can. Metall. Quart. 11 (1972) 185-198
[121] M.L. Picklesimer, Electrochem. Tech. 4 (1966) 289-300
[122] E. Tenckhoff and P.L. Rittenhouse, J. Nucl. Mater. 35 (1970) 14-23
[123] D.O. Hobson, Application Related Phenomena in Zirconium and its Alloys, ASTM STP 458
(1969) 37-49
[124] E. Tenckhoff and P.L. Rittenhouse, ASTM STP 458 (1969) 50-67
[125] D.O. Hobson, Transactions of TMS AIM, Metall. Petro. Eng. 242 (1968) 1105-1110
[126] R.G. Ballinger and R.M. Pelloux, J. Nucl. Mater. 97 (1981) 231-253
[127] H. Francillette, B. Bacroix, M. Gaspérini and J.L. Béchade, Acta Mater. 46 (1998) 4131-
4142
[128] H. Francillette, O. Castelnau, B. Bacroix and J.L. Béchade, Mater. Sci. Forum 273-275
(1998) 523-528
[129] C.N. Tomé, private communication (2006)
[130] C.N. Tomé, R.A. Lebensohn and U.F. Kocks, Acta Metall. Mater. 39 (1991) 2667-2680
[131] L.M. Howe, J.L. Whitton and J.F. McGurn, Acta Metall. 10 (1962) 773-787
[132] G.C. Kaschner, C.N. Tomé, R.J. McCabe, A. Misra, S.C. Vogel and D.W. Brown, Mater.
Sci. Eng. A 463 (2007) 122-127
[133] G.C. Kaschner, C.N. Tomé, I.J. Beyerlein, S.C. Vogel, D.W. Brown and R.J. McCabe, Acta
Mater. 54 (2006) 2887-2896
[134] R.A. Holt, M. Griffiths and R.W. Glibert, J. Nucl. Mater. 149 (1987) 51-56
[135] C.N. Tomé, P.J. Maudlin, R.A. Lebensohn and G.C.Kaschner, Acta Mater. 49 (2001) 3085-
3096
[136] R.A. Lebensohn and C. Tomé, Textures and Microstructures 14-18 (1991) 959-964

64
[137] E. Girard, R. Guillén, P. Weisbecker and M. François, J. Nucl. Mater. 294 (2001) 330-338
[138] P. Sanchez and A. Pochettino, Mater. Sci. Forum 495-497 (2005) 1597-1602
[139] R.A. Lebensohn, M.I. Gonzalez, C.N. Tomé and A.A. Pochettino, J. Nucl. Mater. 229 (1996)
57-64

Chapter 3
Evolution of Lattice Strains in Three Dimensions during In-situ
Compression of Textured Zircaloy-2
The evolution of lattice strains in Zircaloy-2 was investigated in-situ by time-of-flight
neutron diffraction during uni-axial compression in three principal directions, normal,
transverse and rolling. The material is a warm-worked Zircaloy-2 slab with basal plane
normals mostly concentrated in ND. Lattice strains relative to the un-deformed sample
were measured by neutron diffraction during cyclic compression and unloading for three
test directions and three scattering vector directions. Intensity variations for various
diffraction crystallographic planes were monitored to assess the grain rotations.
Substantial tensile twinning was inferred from the evolution of (0002) lattice strains and
the intensity of prismatic and basal orientations. The spread of lattice strains in the test
direction (amongst different crystal orientations) is much greater in compression than in
tension. The sources leading to this asymmetry were ascribed, through simulations using
an elasto-plastic self-consistent model, to the compressive load, the occurrence of tensile
twinning and thermal residual strains.
3.1 Introduction
Zircaloy-2 is used in the core components for both heavy and light water reactors [1].
It has been well established that the deformation of Zircaloy-2 is significantly influenced
by the intergranular (Type-2) strain/stress [2]. Thus a complete understanding of the
evolution of Type-2 strain during deformation may greatly help engineers to design better
65

manufacturing routes which can enhance the performance of the components.
A series of studies on Type-2 stresses in rolled Zircaloy-2 polycrystals with rod
texture have been conducted by MacEwen et al. [1, 3, 4, 5], Christoudoulou [6], Turner et
al. [7, 8], Pang et al. [9], and Holden et al. [10]. However, most mechanical testing was
performed in only one direction up to ~±5% strain, while neutron diffraction was
performed in one or two directions. Thus, it is still unclear exactly how the material
behaves in three dimensions and/or during large strain deformation. Still less known are
the basic deformation mechanisms in the above-mentioned conditions, since the
mechanisms inferred from one or two test directions are not naturally applicable to the
other directions, especially when the texture deviates from the ideal rod-type.
Current research is aimed to make a more complete study of the lattice strain
evolution during uni-axial compression and tension, by expanding considerably on the
past work, with measurements taken in-situ over 10% strain for nine combinations of
three test directions and three measuring directions. This chapter reports the lattice strain
evolution in the test directions during compression, with the emphasis on the occurrence
of tensile twinning during compression and the source of a greater spread of lattice strains
in the test direction in compression than in tension.
3.2 Experimental procedure
The source material is a piece of warm-rolled Zircaloy-2 slab, with approximately
equiaxed grains ~20μm in diameter. The composition is Zr, 1.43-1.45 wt% Sn, 0.13-0.14
wt% Fe, 0.1 wt% Cr, 0.05 wt% Ni, 1260-1440 wt ppm O, 150-160 wt ppm C. Texture
measurements showed that most basal plane normals are orientated along the normal
66

direction (ND), with a spread of ±50º towards the transverse direction (TD) and ±30º
towards the rolling direction (RD). The { 0110 } normals cluster weakly at 30º away from
RD [11]. Six compression samples were machined from the slab in the three principal
directions, with two samples each being prepared for loading along the ND, along the RD
and along the TD. Each sample was machined to a right circular cylinder, 9mm in
diameter and 18mm tall.
Compression tests were performed in-situ on the Engin-X beam line at the ISIS
spallation neutron source facility. A hydraulic-driven stress rig was used; the set-up was
described in detail in Ref. [12]. In short, the loading axis is set horizontally at 45° to the
incident beam so that it is able to measure lattice strains in directions both parallel and
perpendicular to the axis in two detector banks which are aligned horizontally at
scattering angles of ±90°. Thus in order to measure lattice strains in three principal
directions, two sets of in-situ compression tests have to be performed. A hemi-spherical
joint interface in the stress-rig loading train was used to maintain uni-axial loading during
compression. The end surfaces of the sample were carefully lubricated to inhibit the
undesirable ‘barreling’ which may have occurred otherwise. The lubricant is Jet-lube
SS-30, which is applicable to temperatures of -54 to 982°C.
Most in-situ compression tests were conducted up to over -10% strain. However, it
should be noted that the measured lattice strains may become increasingly unreliable
above -8% strain because of the sample buckling. The tests were carried out under stress
control up to -280MPa, below which the sample deforms mostly elastically. Beyond that,
the tests were switched to position control. The engineering strains and the applied loads
were recorded every two seconds through LabView on a standard PC. During the elastic
67
deformation, neutron diffraction measurements were performed eight times at stress
levels of an interval of -40MPa until the stress reached -280MPa. At this point, position
control was used with three different step sizes in position, corresponding to approximate
strain increases of -0.2%, -0.5% and -1.0%, respectively. During each step, the sample
was relaxed for ~30 seconds after the peak load in the step was reached. Data collection
for neutron diffraction was performed at the ~90% of the peak load level to avoid the
room-temperature ‘creep’. The sample was then unloaded to -5MPa. In the next step, the
sample was again incrementally loaded, relaxed and then unloaded. In this way, a series
of lattice strain measurements were performed at increasing plastic strains. This in-situ
‘loading-unloading’ process is illustrated in Fig. 3-1. The counting time at each
measurement point is about 4min. A typical diffraction spectrum recorded includes
diffraction peaks { 0110 }, ( 0002 ), { 1110 }, { 2110 }, { 0211 }, { 3110 }, { 0220 }, { 2211 },
{ 1220 }, ( ), and {0004 2220 }, in an order of high to low lattice spacing. The collected
spectra were analyzed to derive the lattice strain and intensity for various diffraction
crystallographic planes using GSAS single peak fitting [13]. One should note that the
lattice strains reported are not absolute, but are referred to the thermal residual strains
(see Appendix A for the measurements) in the un-deformed sample. Hence the lattice
strains are the net results induced by the uni-axial compression only.
3.3 Results
‘XD/YD’ is defined as the case in which the test direction is in ‘XD’ and the
scattering vector is along with ‘YD’, where ‘XD’ and ‘YD’ can be any one of ND, TD
and RD. Fig. 3-2a, 1c and 1d) illustrate the evolution of elastic lattice strains with
68

B
M2
M1
D
C
A
Fig. 3-1 A ‘loading-unloading’ curve illustrating the in-situ compression tests. In-situ tension tests
are similar. In each of the cycles, the sample was loaded (A) to the maximum load, held and relaxed
(B,C) for ~30 seconds and neutron diffraction was performed at the stress level represented by the dot
‘M1’. Then the sample was unloaded (C) to -5MPa, and neutron diffraction was performed at the
stress level represented by the dot ‘M2’.
respect to the applied stress in the test direction, for the compression tests performed
along TD, ND and RD, respectively. Fig. 3-2b shows the lattice strain evolution with
increasing straining for TD/TD. Typical errors are also included in the figures. It is clear
that in the elastic deformation regime the difference between the lattice strains for
different planes becomes greater as higher stress is applied. This difference reflects the
discrepancy in diffraction elastic constants which is due partially to the elastic anisotropy
of the single crystal1. In the case TD/TD (Fig. 3-2a), the two of the elastically softest
1 Diffraction from planes whose normal exhibiting a high elastic or plastic modulus are elastically stiff, or plastically
stiff, and those exhibiting a low elastic or plastic modulus are elastically or plastically soft.
69

-500
-450
-400
-350
-300
-250
-200
-150
-100
-50
0-8000 -7000 -6000 -5000 -4000 -3000 -2000 -1000 0
Lattice Strain (με)
True
Stre
ss (M
Pa)
{10-10} EXP{0002} EXP{10-11} EXP{10-12} EXP{11-20} EXP{10-13} EXP{11-22} EXP{20-21} EXP
A
B
C
(a)
-7000
-6000
-5000
-4000
-3000
-2000
-1000
0-0.18 -0.16 -0.14 -0.12 -0.10 -0.08 -0.06 -0.04 -0.02 0.00
True Strain
Latti
ce S
train
(με)
{10-10} EXP {0002} EXP{10-11} EXP {10-12} EXP{11-20} EXP {10-13} EXP{11-22} EXP {20-21} EXP
(b)
Fig. 3-2 (to be continued)
70

-900
-800
-700
-600
-500
-400
-300
-200
-100
0-9000 -7000 -5000 -3000 -1000
Lattice Strain (με)
True
Stre
ss (M
Pa)
{10-10} EXP
{0002} EXP
{10-11} EXP
{10-12} EXP
{11-20} EXP
{10-13} EXP
{11-22} EXP
{20-21} EXP
(c)
-550
-500
-450
-400
-350
-300
-250
-200
-150
-100
-50
0-7000 -6000 -5000 -4000 -3000 -2000 -1000 0
Lattice Strain (με)
True
Stre
ss (M
Pa)
{10-10} EXP
{0002} EXP
{10-11} EXP
{10-12} EXP
{11-20} EXP
{10-13} EXP
{11-22} EXP
{20-21} EXP
(d) Fig. 3-2 Lattice strain development of the compression tests: (a) TD/TD, (b) TD/TD (with respect to
strain), (c) ND/ND and (d) RD/RD. For clarity, error bars are shown only for one diffraction peak in
(a)-(d). A complete set of error bars for all the measured diffraction peaks will be shown in Chapter 4.
71
orientations, { 0110 } and { 0211 }, show departure from linearity at -280MPa, while the
other orientations depart from linearity at higher stresses. This is consistent with the
well-established point of view that in Zircaloy-2, which has a c/a ratio less than 1.63, the
prismatic slip { 0110 }< 1021 > is activated at a much lower critical resolved shear stress
(CRSS) than other slip or twinning modes. In the plastic regime, the { 0110 } and { 0211 }
orientations remain the softest. In contrast, the stiffest orientations ( 0002 ) and { 3110 }
continue to be plastically stiff, while { 2110 } and { 2211 } show an approximately
continuous linear elastic response far into the plastic regime.
Compared to the other orientations, (0002) experiences much more dramatic changes
in lattice strain (reflecting a dramatic load redistribution). The lattice strain accumulates
at a very high rate from the applied stress of -310MPa to -377MPa, corresponding to the
plastic strain from -0.05% to -0.25%. Other orientations also accumulate lattice strains
during this period, but at a relatively lower rate. As higher stress is applied, it is clearly
observed that two dramatic changes in the ( 0002 ) lattice strain. The first one occurs at
-377MPa, starting from which the lattice strain decreases significantly rather than keeps
increasing as other orientations (although insignificant). The second dramatic change
takes place at -430MPa (-8.34% strain). This time the ( ) accumulates increasing
lattice strain once again. For the purpose of convenience for discussion, the (0002)
strain in the plastic regime will be broken into three parts as shown in Fig. 3-2a − Part A:
before -377MPa, Part B: -377 to -430MPa, and Part C: after -430MPa.
0002
A possible explanation for the two inflections of the (0002) lattice strain is that
{ 2110 }< 1110 > tensile twinning occurred in the Poisson direction. Fig. 3-3a compares
the evolution of the integrated peak intensity with increasing applied stress for { 0110 }
72

-500
-400
-300
-200
-100
00 60000 120000 180000
Intensity (Arb. Units)
True
Stre
ss (M
Pa)
{10-10} TD/TD{0002} TD/TD{10-10} TD/ND{0002} TD/ND
(a)
-600
-500
-400
-300
-200
-100
00 40000 80000 120000 160000
Intensity (Arb. Units)
True
Stre
ss (M
Pa)
{10-10} RD/RD{0002} RD/RD{10-10} RD/ND{0002} RD/ND
(b)
Fig. 3-3 Evolution of the peak intensity of { 0110 } and (0002) orientations for compression along (a)
TD and (b) RD.
and ( } orientations in TD/TD. It is apparent that the intensity remains
approximately constant until -377MPa for both orientations, the stress at which the first
dramatic change occurs. Beyond -377MPa, the (0002) intensity keeps increasing
significantly, coincident with a continuous reduction in the {
0002
0110 } intensity. As pointed
out by Ballinger et al. [14] and Oliver et al. [15], these changes in intensity may be caused
by the operation of tensile twinning, which usually results in a flip (strictly speaking, a
85.2° rotation here) of the basal and prism orientations. Observed in one Poisson
73

direction (TD/ND, Fig. 3-3a), the intensity change of { 0110 } is almost precisely in
opposition to that seen in the test direction, while the (0002) intensity shows an opposite
trend only at stresses beyond -430MPa. Two reasons are given to explain why the (0002)
intensity in TD/ND changes later. First, the slab texture shows that far more basal
normals are oriented in ND than those in TD, thus it is reasonable to argue that if only a
small fraction of basal normals are rotated from ND to TD, it could be difficult to discern
such a small reduction of basal normals in ND, while it can be easy to observe the
increase of the newly formed basal normals in TD. Secondly, tensile twinning causes a
grain reorientation of ~85°, not exactly 90°. Thus the reduction of the basal normals due
to twinning may not be entirely captured by measurements from ND without the
‘contamination’ of intensity errors. Considering these two points, it is likely that tensile
twinning initiates at -377MPa.
This explanation will be clearer after investigating the lattice strain development in
ND/ND and RD/RD (Fig. 3-2c and 2d). In ND/ND, at -520MPa the (0002) strain shows a
‘kink’, suggesting that after initially remaining elastic when macroscopic yield begins
and hence taking on more loads, these grains are finally yielding. This ‘kink’ can be
associated with the onset of <c+a> slip in these grains, which may reduce the incremental
straining of the (0002) grains, but does not cause a significant stress relaxation seen from
twinning. It is noticed that Part A of the (0002) strain in TD/TD is similar to the (0002)
curve in ND/ND before the ‘kink’. This implies that when the material is compressed in
TD, tensile twinning takes place before <c+a> slip, or coincidentally, at the same time as
<c+a> slip initiates. Thus it is reasonable to infer that CRSS for tensile twinning should
not be greater than that for <c+a> slip in the polycrystal Zircaloy-2.
74
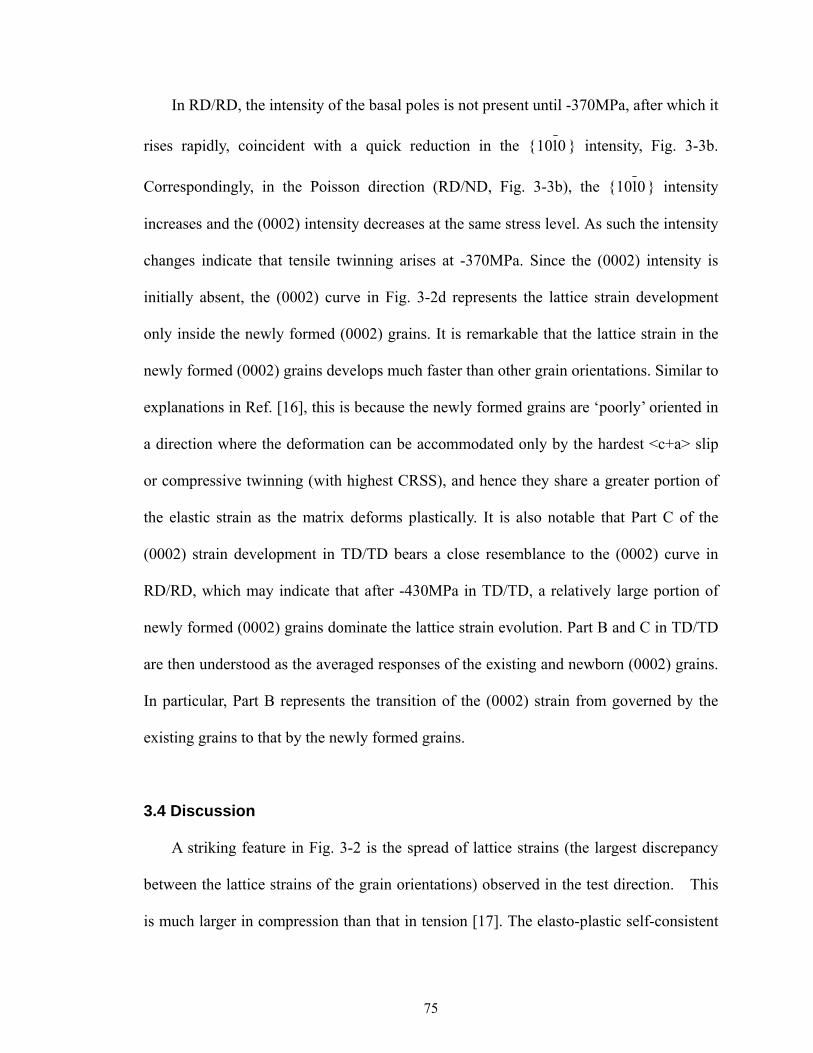
In RD/RD, the intensity of the basal poles is not present until -370MPa, after which it
rises rapidly, coincident with a quick reduction in the { 0110 } intensity, Fig. 3-3b.
Correspondingly, in the Poisson direction (RD/ND, Fig. 3-3b), the { 0110 } intensity
increases and the (0002) intensity decreases at the same stress level. As such the intensity
changes indicate that tensile twinning arises at -370MPa. Since the (0002) intensity is
initially absent, the (0002) curve in Fig. 3-2d represents the lattice strain development
only inside the newly formed (0002) grains. It is remarkable that the lattice strain in the
newly formed (0002) grains develops much faster than other grain orientations. Similar to
explanations in Ref. [16], this is because the newly formed grains are ‘poorly’ oriented in
a direction where the deformation can be accommodated only by the hardest <c+a> slip
or compressive twinning (with highest CRSS), and hence they share a greater portion of
the elastic strain as the matrix deforms plastically. It is also notable that Part C of the
(0002) strain development in TD/TD bears a close resemblance to the (0002) curve in
RD/RD, which may indicate that after -430MPa in TD/TD, a relatively large portion of
newly formed (0002) grains dominate the lattice strain evolution. Part B and C in TD/TD
are then understood as the averaged responses of the existing and newborn (0002) grains.
In particular, Part B represents the transition of the (0002) strain from governed by the
existing grains to that by the newly formed grains.
3.4 Discussion
A striking feature in Fig. 3-2 is the spread of lattice strains (the largest discrepancy
between the lattice strains of the grain orientations) observed in the test direction. This
is much larger in compression than that in tension [17]. The elasto-plastic self-consistent
75

model (EPSC) [7] was used in this preliminary study to investigate such an asymmetry,
with the consideration of slip modes only. Extended Voce hardening law was used in
the model:
)]/exp(1)[( 10110ssssss τθθτττ Γ−−Γ++= (3.1)
where is the instantaneous CRSS, and are the initial and final
back-extrapolated CRSS, respectively. and are the initial and asymptotic
hardening rates, and is the accumulated plastic shear in the grain.
sτ s0τ
s0θ
ss10 ττ +
s1θ
Γ
Most input parameters are the same as presented in Ref. [17]; differences only lie in
the Voce hardening parameters (Eq. 3.1) for prismatic slip { 0110 }< 0211 > (pr), basal slip
{0001}< 0211 > (bas) and pyramidal slip { 1110 }< 3211 > (pyca). Two parameters sets
(listed in Table 3-1), ‘Para-C’ and ‘Para-T’, were chosen to fit the flow curves of
compression and tension in three directions, respectively.
Table 3-1. Voce-hardening parameters for modeling the compression/tension tests
0τ (GPa) 1τ (GPa) 0θ 1θ
Comp. Tens. Comp. Tens. Comp. Tens. Comp. Tens.
Prism slip 0.110 0.090 0.001 0.001 10 10 0.08 0.130
Basal slip 0.170 0.240 0.001 0.001 10 10 0.08 0.130
Pyramidal slip 0.375 0.245 0.001 0.007 10 10 0.55 0.146
In order to simulate the lattice strain development, the deformation process was
modeled including the constraints generated by cooling the sample from 898K to 298K,
prior to loading to the desired macroscopic strain, then partially unloading to the exact
strain state at which neutron diffraction measurements were performed, and finally fully
76

unloading. Thermal lattice strains were then subtracted from the final ones, yielding
compression (or tension) induced only lattice strains that can be directly compared to the
experiment.
Fig. 3-4a shows the comparisons between the calculated and the experimental lattice
strain evolution during compression for TD/TD. It is apparent that before tensile
twinning initiates (at -377MPa), the (0002) lattice strain evolution is well captured by the
prediction. Beyond that, the calculation deviates from the experiment, since no twinning
deformation modes were considered in the modeling. For the next stiffest orientations,
{ 3110 } and { 2110 }, the development of lattice strain is well reproduced by the model in
the plastic regime, even at the high stress levels. The model also qualitatively captures
the general trends for { 1110 }, { 0211 } and { 1220 }, but it misses the evolution of the
{ 2211 } lattice strain. It should be emphasized that the predicted spread of ~3200με
(lattice strain difference between { 0110 } and (0002) at -377MPa) agrees well with the
experimental one (~3500με).
The effects of the CRSS value, 0τ , and the work-hardening parameter, 1θ , on the spread
were evaluated, since these two parameters are the most important factors governing the
lattice strain evolution. From a series of calculations using various 0τ and 1θ for the
prismatic, basal and pyramidal slip modes, it was found that CRSS for pyramidal slip
( ) has the dominant effect on the spread. This is especially true if is lowered
to 245MPa (using ‘Para-T’), which was found to be appropriate for modeling the tension
tests [17], the spread will be reduced to ~2100με, Fig. 3-4c.
pyca0τ
pyca0τ
Based on the simulations, it appears that pyramidal slip is more difficult to activate in
compression to accommodate the strain along c-axis (apparent CRSS of 375MPa) than
77

-450
-400
-350
-300
-250
-200
-150
-100
-50
0-8000 -7000 -6000 -5000 -4000 -3000 -2000 -1000 0
True
Stre
ss (M
Pa)
{10-10} EXP
{0002} EXP
{10-11} EXP
{10-12} EXP
{10-10} CAL
{0002} CAL
{10-11} CAL
{10-12} CAL
-450
-400
-350
-300
-250
-200
-150
-100
-50
0-8000 -7000 -6000 -5000 -4000 -3000 -2000 -1000 0
True
Stre
ss (M
Pa)
{11-20} EXP
{10-13} EXP
{11-22} EXP
{20-21} EXP
{11-20} CAL
{10-13} CAL
{11-22} CAL
{20-21} CAL
(a)
-450
-400
-350
-300
-250
-200
-150
-100
-50
0
True
Stre
ss (M
Pa)
{10-10} EXP
{0002} EXP
{10-11} EXP
{10-12} EXP
{10-10} CAL
{0002} CAL
{10-11} CAL
{10-12} CAL
-450
-400
-350
-300
-250
-200
-150
-100
-50
0
True
Stre
ss (M
Pa)
{11-20} EXP
{10-13} EXP
{11-22} EXP
{20-21} EXP
{11-20} CAL
{10-13} CAL
{11-22} CAL
{20-21} CAL
(b)
-450
-400
-350
-300
-250
-200
-150
-100
-50
0
True
Stre
ss (M
Pa)
{10-10} EXP
{0002} EXP
{10-11} EXP
{10-12} EXP
{10-10} CAL
{0002} CAL
{10-11} CAL
{10-12} CAL
-450
-400
-350
-300
-250
-200
-150
-100
-50
0
True
Stre
ss (M
Pa)
{11-20} EXP
{10-13} EXP
{11-22} EXP
{20-21} EXP
{11-20} CAL
{10-13} CAL
{11-22} CAL
{20-21} CAL
(c)
-500
-450
-400
-350
-300
-250
-200
-150
-100
-50
0
Lattice Strain (με)
True
Stre
ss (M
Pa)
{10-10} EXP
{0002} EXP
{10-11} EXP
{10-12} EXP
{10-10} CAL
{0002} CAL
{10-11} CAL
{10-12} CAL
-500
-450
-400
-350
-300
-250
-200
-150
-100
-50
0
Lattice Strain (με)
True
Stre
ss (M
Pa)
{11-20} EXP
{10-13} EXP
{11-22} EXP
{20-21} EXP
{11-20} CAL
{10-13} CAL
{11-22} CAL
{20-21} CAL
(d)
Fig. 3-4 The predicted lattice strain evolution in TD/TD during uni-axial compression, using (a)
‘Para-C’ with thermal strains, (b) ‘Para-C’ without thermal strains, (c) ‘Para-T’ with thermal strains,
and (d) ‘Para-T’ without thermal strains.
78

that in tension (apparent CRSS of 245MPa). This supposition is supported by
Christodoulou’s investigation [6], which suggests that pyramidal slip is easier to initiate
when under tension than under compression. The apparent asymmetry in initiating
pyramidal slip was also experimentally observed by Rittenhouse et. al [18] and Jones et.
al [19].
The CRSS value of a slip mode is much dependent on the temperature, grain size,
grain shape, strain rate and alloying elements. Since these factors do not vary (or vary
little) for tension from those for compression (at least in the first few percentage of strain),
they are unlikely to be the origins leading to the asymmetry of . Jones and
Hutchinson [19] and Lowden and Hutchinson [20] suggested another important factor,
the stress state, to explain such asymmetry. The dependence of the stress state on
was assumed to be due to the normal component of the hydrostatic stress, and was
ascribed to the dilatation necessary to move the <c+a> dislocations over the humps in the
{
pyca0τ
pyca0τ
1110 } planes, i.e. in tension along c-axis the dislocations are extended (i.e. separated by
stacking fault into dislocation partials) and cannot cross-slip (CRSS is low), while in
compression along c-axis the dislocations are not extended and can cross-slip (CRSS is
high) [19]. Although this finding was achieved through the studies on Ti-6Al-4V, it may
also be applicable to zirconium alloys, since both kinds of material have the same hcp
structure, close c/a ratios, similar electron structure, elastic anisotropy and stacking fault
energy [21].
Assuming that the stress state introduces asymmetry to the CRSS for pyramidal slip,
the asymmetry in the spread of lattice strain between tension and compression arises from
two sources. The first one is self-evident: the sign of the hydrostatic stress is negative in
79

compression and positive in tension. The second origin is due to the thermal residual
stress introduced by the cooling process during manufacturing the slab, which
superimposes with the mechanically induced stress to determine the final stress state in
the grain.
The relative contributions to the spread difference from thermal strains and from
mechanical loading were investigated by EPSC simulations without any pre-existing
thermal constraints. Results for compression and tension obtained using both parameter
sets, 'Para-C' and 'Para-T', are presented and compared in Fig. 3-4 and 3-5. The spreads,
i.e., the lattice strain differences between { 0110 } and (0002) at -377MPa or 377MPa for
each case, are extracted and compared. It should be noted that the (0002) strains were not
measured in the tension tests. Thus it is unknown how accurately the model predicts
them. However, in Ref. [17] the ‘Para-T’ was found to be a reasonable parameter set for
the lattice strain predictions for the prismatic, basal and pyramidal orientations in all three
directions. It is therefore believed that, by using ‘Para-T’, the (0002) strains can be
reproduced, at least, qualitatively.
It is clear in Fig. 3-4 and 3-5 that when thermal strains are not considered (thus the
effect is caused by mechanical loading only), the increase in can lead to a gain of
~1500με in the spread (1730με in tension and 1460με in compression), supporting the
point that a greater can cause a larger spread. It is also apparent that whether
is high or low, with the consideration of thermal strains, the spread will be decreased in
tension by ~1000με and expanded in compression by ~500με, giving rise to a difference
of ~1500με in the spreads. As a result, it is suggested that thermal strains and the
mechanical loading contribute ~50% each to the total spread discrepancy (~3000με)
pyca0τ
pyca0τ
pyca0τ
80

0
50
100
150
200
250
300
350
400
450
500
True
Stre
ss (M
Pa)
{10-10} EXP
{10-10} CAL
{0002} CAL
{10-11} CAL
{10-12} CAL
0
50
100
150
200
250
300
350
400
450
500
True
Stre
ss (M
Pa)
{11-20} EXP
{11-22} EXP
{20-21} EXP
{11-20} CAL
{10-13} CAL
{11-22} CAL
{20-21} CAL
(a)
0
50
100
150
200
250
300
350
400
450
True
Stre
ss (M
Pa)
{10-10} EXP
{10-10} CAL
{0002} CAL
{10-11} CAL
{10-12} CAL
0
50
100
150
200
250
300
350
400
450
True
Stre
ss (M
Pa)
{11-20} EXP
{11-22} EXP
{20-21} EXP
{11-20} CAL
{10-13} CAL
{11-22} CAL
{20-21} CAL
(b)
0
50
100
150
200
250
300
350
400
450
True
Stre
ss (M
Pa)
{10-10} EXP
{10-10} CAL
{0002} CAL
{10-11} CAL
{10-12} CAL
0
50
100
150
200
250
300
350
400
450
True
Stre
ss (M
Pa)
{11-20} EXP
{11-22} EXP
{20-21} EXP
{11-20} CAL
{10-13} CAL
{11-22} CAL
{20-21} CAL
(c)
0
50
100
150
200
250
300
350
400
450
0 1000 2000 3000 4000 5000 6000 7000 8000Lattice Strain (με)
True
Stre
ss (M
Pa)
{10-10} EXP
{10-10} CAL
{0002} CAL
{10-11} CAL
{10-12} CAL
0
50
100
150
200
250
300
350
400
450
0 1000 2000 3000 4000 5000 6000 7000 8000Lattice Strain (με)
True
Stre
ss (M
Pa)
{11-20} EXP
{11-22} EXP
{20-21} EXP
{11-20} CAL
{10-13} CAL
{11-22} CAL
{20-21} CAL
(d)
Fig. 3-5 The predicted lattice strain evolution in TD/TD during uni-axial tension, using (a) ‘Para-C’
with thermal strains, (b) ‘Para-C’ without thermal strains, (c) ‘Para-T’ with thermal strains, and (d)
‘Para-T’ without thermal strains.
81
between compression (3212με) and tension (121με).
One should be reminded that no attempts have been made to model the twinning,
thus the derived CRSS are not physically correct. Specifically, actually represents
some component of tensile twinning. It is then suggested that tensile twinning also
contributes to the spread asymmetry. More rigorous studies should also include the
twinning deformation modes.
pyca0τ
3.5 Conclusion
Compression tests for Zircaoly-2 with moderate bulk texture were performed in-situ
to a large strain of over -10%. Both lattice strains and intensity changes were recorded in
three directions during deformation. Experimental results suggest that ‘hard’
orientations, (0002), and even { 3110 } and { 2110 }, will share most compressive load and
yield at higher macroscopic stresses than the softer orientations. Substantial tensile
twinning during the compression along RD and TD was inferred from the evolution of
(0002) lattice strains and the intensity of both { 0110 } and (0002) orientations. The
lattice strain in newly formed twins was measured for the first time in any Zr alloy. This
measurement will provide a benchmark for the development of polycrystalline models
that provide a realistic representation of twinning by incorporating the relaxation of
stresses in parent grains and newly formed twins.
Possible mechanisms leading to the two inflections of the (0002) strain in the plastic
regime in TD/TD are the initiation of tensile twinning and the rapid build-up of elastic
strains in the newborn grains, respectively. The spread of lattice strains in the test
direction was found to be larger in compression than in tension. The sources of this
82

asymmetry were investigated through preliminary simulations using EPSC with
considerations of slip modes only, and they were ascribed to the asymmetry of CRSS of
pyramidal slip relative to the normal stress on the slip plane, and/or the occurrence of
tensile twinning in addition to asymmetry of the thermal residual strains.
References [1] S.R. MacEwen, J. Faber and P.A. Turner, Acta Metall. 31 (1983) 657-676
[2] R.A. Holt and A.R. Causey, J. Nucl. Mater. 150 (1987) 306-318
[3] S.R. MacEwen, N. Christodoulou and A. Salinas-Rodriguez, Metall. Trans. A 21 (1990)
1083-1095
[4] S.R. MacEwen, C.N. Tomé and J. Faber, Acta Metall. 37 (1989) 979-989
[5] S.R. MacEwen, N. Christodoulou, C.N. Tomé, J. Jackman, T.M. Holden, J. Faber, Jr. and R.L.
Hitterman, in J.S. Kallend and G. Gottstein (eds.), Proc. 8th Int. Conf. on Texture of Materials, The
Metallurgical Society, Warrendale, PA, (1988) 825-836
[6] N. Christodoulou, Acta Metall. 37 (1989) 529-539
[7] P.A. Turner and C.N. Tomé, Acta Metall. 42 (1994) 4143-4153
[8] P.A. Turner, N. Christodoulou and C.N. Tomé, Int. J. Plast. 11 (1995) 251-265
[9] J.W.L. Pang, T.M. Holden, P.A. Turner and T.E. Mason, Acta Mater. 47 (1999) 373-383
[10] T.M. Holden, J.H. Root, R.A. Holt and P.A. Turner, J. Nucl. Mater. 304 (2002) 73-82
[11] R.A. Holt, D. Dye and R.B. Rogge, Annual Report of National Research Council (2004)
[12] M.R. Daymond and H.G. Priesmeyer, Acta Mater. 50 (2002) 1613-1626
[13] A.C. Larson and R.B. Von Dreele, General Structure Analysis System, Report No. LAUR
86-748 (1994)
[14] R.G. Ballinger, G.E. Lucas, and R.M. Pelloux, J. Nucl. Mater. 126 (1984) 53-69
[15] E.C. Oliver, M.R. Daymond and P.J. Withers, Proc. 7th Int. Conf. on Residual Stress, Mater.
83

84
Sci. Forum 490-491 (2005) 98-105
[16] D.W. Brown, S.R. Agnew, M.A.M. Bourke, T.M. Holden, S.C. Vogel and C.N. Tomé, Mater.
Sci. Eng. A 399 (2005) 1-12
[17] F. Xu, R.A. Holt, R.B. Rogge and M.R. Daymond, Proc. 26th Annual Canadian Nuclear
Society Conference, Paper T72 (2005), Appendix B.
[18] P.L. Rittenhouse and M.L. Picklesimer, Electrochem. Technol. 4 (1966) 322-329
[19] I.P. Jones and W.B. Hutchinson, Acta Metall. 29 (1981) 951-967
[20] M.A.W. Lowden and W.B. Hutchinson, Metall. Trans. A 6 (1975) 441-448
[21] P.G. Partridge, Metall. Rev. 118 (1967) 169-194

Chapter 4
Development of Lattice Strains in Textured Zircaloy-2 during Uni-axial Deformation
Lattice strains can greatly affect the mechanical performance of Zircaloy-2 and the study
of their development provides insight into the operating deformation mechanisms. In
this study, neutron diffraction was used to track the development of lattice strains in three
dimensions in samples cut from a rolled Zircaloy-2 slab. The samples were subject to
room temperature compression or tension in-situ in the neutron diffractometer with
loading along each of the three principal directions of the slab. The recorded intensity
changes for various crystallographic planes provided information on the grain
reorientations during deformation. Strong evidence was found for tensile twinning in
tensile tests in the plate normal direction and in compression tests in the transverse and
rolling directions. No evidence of compression twinning was found. This provides an
extensive data set with which to develop and test models for plastic deformation and
texture development in polycrystalline Zircaloy-2.
4.1 Introduction
Zircaloy-2 and its sister alloy, Zircaloy-4, have extensive applications in the nuclear
industry for the production of core components (e.g. pressure tube and calandria tube) in
heavy water reactors (e.g. CANDU) and fuel cladding in both heavy and light water
reactors [1]. Excessive deformation of the material during operation in the reactor
environment may lead to serious problems, such as pressure tube to calandria tube
85

contact in CANDU reactors. Such undesirable deformation is usually correlated with
the evolution of lattice strains (or stresses) [2]. Thus, an understanding of the lattice
strain evolution in the material prior to service has practical significance. Also, the study
of the development of lattice strains during deformation provides information about the
active slip and twinning mechanisms.
Zircaloy-2 is a zirconium-based alloy. At room temperature and under its typical
operating conditions, the alloy has a hexagonal close-packed (hcp) structure and exhibits
anisotropy in its thermal, elastic and plastic properties. The thermal expansion coefficient
in the lattice c-direction is nearly twice that in the a-direction. The elastic constants for
this material are usually assumed to be identical to those of zirconium single crystal [1].
This elastic anisotropy is responsible for the observed difference between diffraction
elastic constants for various diffraction peaks [ 3 ]. During plastic deformation of
zirconium and its alloys, it is already known [4 ,5 ,6 ,7 ,8 ,9 ] that prism <a> slip
{ 0110 }< 0211 > is the most easily activated mode, followed by pyramidal <c+a> slip
{ 1110 }< 3211 > or tensile twinning { 2110 }< 1110 >, and then by compression twinning
{ 2211 }< 3211 >. While prism <a> slip can only accommodate strains along the
a-direction, pyramidal <c+a> slip and twinning can accommodate strains along both the
a- and c-directions. The presence of basal <a> slip {0001}< 0211 > as a deformation
mechanism at room temperature is still a matter of some debate in the literature
[10,11,12,13,14,15,16,17,18,19], and some researchers claimed to have found evidence
for the presence of pyramidal <a> slip instead, as has been discussed in Section 2.2 in
Chapter 2.
Intergranular stresses in Zircaloy-2 polycrystals arise from several sources. Usually
86

such stresses develop as a result of the combination of anisotropic single crystal
properties, the texture of the aggregate and the imposed external loading, whether thermal
or mechanical. Cooling the material from a high temperature generates intergranular
stresses originating from the thermal and elastic anisotropy of the single crystal, since
strain compatibility and stress balance between neighboring grains must be maintained to
overcome the mismatch in the thermal strains. In contrast to engineering materials with
cubic symmetry, thermal stresses have a great impact on the macroscopic elasto-plastic
response of this material. For instance, they can cause the yield stress differential in
tension and compression and a different elasto-plastic transition during deformation [20].
Applying a mechanical load to the material also produces internal stresses, due to the
elastic and plastic anisotropies of the single crystal. When the applied load corresponds to
the critical resolved shear stress (CRSS) for grains with particular orientations, these
grains will begin to deform plastically (or ‘micro-yield’) before large scale macroscopic
plasticity occurs in the specimen. Other grains whose CRSS has not yet been exceeded,
will continue to respond to the load elastically [11]. Thus, for example, if a compressive
load is applied to a material without bulk texture, the plastically ‘hard’ orientations (i.e.,
those grain orientations which will deform on systems with a relatively high CRSS)
parallel to the loading axis would tend to accumulate high compressive stresses at the
expense of the ‘soft’ orientations (i.e., those which deform on systems with relatively low
CRSS) which yield at lower compressive stresses [20]. Upon unloading, the high
compressive stresses generated in these plastically ‘hard’ orientations result in
compressive residual stresses, and the lower stresses in the ‘soft’ orientations results in
tensile stresses in order to fulfill stress balance in the unloaded component.
87

The evolution of intergranular strains/stresses under mechanical loading is even more
complicated in Zircaloy-2 when a strong bulk texture is present. Internal stresses in
clock-rolled or swaged and recrystallized Zircaloy-2 with axisymmetric rod texture have
been investigated in publications [1,11,20,21,22,23,24,25,26]. Neutron diffraction
techniques (constant wavelength or time-of-flight) in combination with Taylor or
self-consistent models have been used to interpret the lattice strain development and
hence deduce the active deformation mechanisms during uni-axial tension or
compression. However, most studies to date have only considered small strain (<5%)
deformation, one loading direction (relative to the texture) and one or two measurement
directions (relative to the loading direction). There is little information considering how
lattice strains develop in three dimensions under different applied loads, in particular for
materials with a more general bulk texture than the rod-type.
This chapter reports the lattice strain evolution in samples cut from moderately
textured rolled Zircaloy-2 plate. Measurements were made with applied loads along
each of the three principal plate directions (i.e., rolling, transverse and normal) under
both uni-axial compression and tension to strains greater than ~±12%. For each loading
case, strains were measured in all three principal plate directions. This is by far the most
extensive data set of this type yet to be published for any zirconium alloy, or indeed any
hcp alloy, and should provide a sound basis for future investigations of the active plastic
deformation mechanisms and texture development by polycrystalline modeling.
4.2 Material and experimental procedure
The material used in this study was a piece of Zircaloy-2 plate with dimensions of
88

220mm wide × 70mm thick manufactured by warm rolling. The composition is Zr,
1.43-1.45 wt% Sn, 0.13-0.14 wt% Fe, 0.1 wt% Cr, 0.05 wt% Ni, 1260-1440 wt ppm O,
150-160 wt ppm C. Texture measurements [27] have shown that most basal plane
normals are orientated along the normal direction (ND), with a spread of ±50° towards
the transverse direction (TD) and ±30° towards the rolling direction (RD). The { 0211 }
normals are concentrated in RD, while { 0110 } normals cluster weakly at ~30° away from
RD. Fig. 4-1a,b) presents the pole figures for the ( 0002 } and { 0110 } peaks prior to
deformation. The basal plane texture varies significantly through the thickness of the
slab but was found to be uniform for ~20mm at mid-thickness over most of the width of
the slab, and samples for ND loading (ND sample) were thus cut with their gauge-lengths
centered at mid-thickness [27].
Cylindrical compression samples 9mm diameter × 18mm long were machined from
the plate in the three principal directions. Dogbone-shaped tensile samples of 6.35mm ×
6.35mm gauge cross section were cut from the plate. The lengths of the samples were
chosen to guarantee an appropriate gauge length to ensure a uniform texture within the
irradiated volume and to avoid interference of the neutron beam with the loading
hardware. The length of tensile ND samples (loading axis parallel to ND) was 67.4mm,
and that for tensile RD and TD samples (loading axis parallel to RD and TD, respectively)
was 104.8mm. The variability in material property between the samples cut in the same
direction will be reflected by the difference in the 0.2% yield stress, which will be shown
in Fig. 4-5 – Fig. 4-10.
In-situ compression tests were performed using the time-of-flight technique at the
Engin-X beamline [28] at ISIS, Rutherford Appleton Laboratory, UK. A description of
89

(a) (b)
(c) (d)
Fig. 4-1 Experimental pole figures of the Zircaloy-2: (a) slab (0002), (b) slab { 0110 }, (c) after
compression along TD (0002) showing twinning inducing basal orientations around TD, and (d) after
tension along TD (0002) showing no evidence for tensile twinning. North/south pole is RD, west/east
pole is TD, and the center is ND. Solid contours indicate multiples above random, and dotted
contours indicate multiples below random.
the experimental arrangements typical for in-situ loading experiments at this source can
be found in Ref. [29]. In brief, the loading axis is set horizontally at 45° to the incident
beam providing measurements of lattice strains in directions both parallel and
perpendicular to the loading axis, with multiple peaks collected in the two detector banks
which are aligned horizontally at scattering angles of ±90°. Thus, to measure lattice
strains in three principal directions, two sets of in-situ compression tests have to be
performed. The sample was mounted in the computer controlled hydraulic load frame,
with a holding stress of -5MPa. This small stress does not have a practical influence on
90

the lattice strain development but does help to hold the sample tightly and to eliminate
misalignment. During each test, an extensometer was attached to the mid-length of the
sample to determine accumulated macroscopic strain. All lattice strains measured by
neutron diffraction are reported relative to the starting situation, and thus do not take into
account any initial thermal strains arising due to fabrication, although it will be important
to take these into account in any modeling. The tests were carried out under stress
control up to -280MPa, below which the sample deforms elastically. Beyond that, the
tests were switched to position control. This approach is typically taken to deal with the
tendency of materials such as Zircaloy-2 to undergo significant room temperature
relaxation, or ‘creep’ under constant load. After each incremental load, the sample was
allowed to relax from the peak load reached. Data collection for neutron diffraction was
then performed at ~90% of the peak load level. The sample was then unloaded back to
-5MPa.
In-situ tension tests were carried out on the L-3 neutron spectrometer at NRU reactor,
Chalk River Laboratories, Canada. For measurements of most peaks, monochromation
of the incident beam was achieved using a (331) reflection of a Ge single crystal. The
wavelength of the incident beam was calibrated against lattice reflections from a Si
powder reference sample and found to be 1.929Å. A computer controlled screw-driven
load frame was used to produce uniform tension in the middle (or irradiated) part of
tensile samples. The frame was placed on a high precision positioning table which
allows the sample to be centered accurately in the measurement position. Universal joints
were used for the tensile tests to ensure uni-axiality of loading. Nine sets of
measurements were performed, with three sets for each of the three tensile loading
91

directions; i.e. for each loading direction, measurements were taken in one case with the
scattering vector lying parallel to the loading axis and in two cases with the scattering
vectors perpendicular to loading axis (i.e. two Poisson directions). During each tensile
test, an extensometer was attached to the gauge length of the sample to determine the
accumulated macroscopic strain.
In a typical in-situ tension test, the sample was first loaded incrementally in the
elastic regime. Neutron diffraction measurements were performed at various load levels
with an interval of 0.25-0.5% strain. Diffraction data were collected sequentially for the
}1220{ , }0220{ , }2112{ , }0112{ and (0004) (or (0002)) peaks. Above the elastic
regime, relaxation due to room temperature ‘creep’ deformation of the samples occurred,
i.e., the macroscopic strain increased significantly while the sample was held at constant
load during the period required to acquire the necessary data over all peaks. To
circumvent this problem, after the macroscopic yielding the sample was unloaded to
facilitate neutron diffraction measurements. During each unloading stage, the sample
was firstly unloaded to ~90% of the specified load, and then fully unloaded. Diffraction
measurements were performed at the ~90% over all peaks. No necking was observed in
any of the tensile samples after deformation.
As already mentioned during the in-situ compression tests, position control, instead
of strain control, is used. In the plastic regime, the compression sample was relaxed for
~30 seconds (instead of being unloaded as in the tension tests) after the maximum load in
each position step was reached, and then the neutron data was collected.
Fig. 4-2 shows a typical recorded diffraction spectrum for the planes with
inter-planar spacings greater than 1.2Å ((0002), { 3110 }, { 2110 }, { 2211 }, { 1110 },
92

Fig. 4-2 A typical diffraction spectrum with indexed diffraction peaks for compression test
{ 1220 }, { 0211 } and { 0110 }, from high to low order, i.e. the large to small angle with
respect to the a-axis), obtained during in-situ compression tests. At a time-of-flight
neutron source (i.e. ISIS), the lattice strains for many peaks are measured simultaneously
in a particular direction in the sample, thus the relative uncertainties in lattice strain are
principally dependent on the intensity of individual peaks, due to variation in the incident
beam intensity with wavelength, structure factor, texture, etc.
For a given count time, peaks with higher scattered intensity have better counting
statistics and thus smaller uncertainties will be seen in the figures. In contrast, at a
constant-wavelength neutron source (i.e. NRU), lattice strains are measured diffraction
peak by diffraction peak with different data accumulation times; those peaks with lower
93

intrinsic scattering were usually measured using longer count times to improve statistics.
The average lattice strains are found by the shift in position of the diffraction peak. The
distribution of strains, as evidenced by changes in peak width is not discussed. It should
be noted however that the measured lattice strains are the averaged response of a group of
grains in the neutron beam with a particular diffraction angle such that they diffract into
the detector. Thus a low intensity observed for a particular diffraction peak may often
be due to the fact that there are simply fewer grains in that particular orientation (due to
texture), and hence that a poorer statistical sampling of strains will be obtained even if
longer count times are used. The uncertainties indicated in the reported data are those
reported by the peak fitting packages: GSAS Rawplot [30] for the ISIS data sets using an
appropriate peak shape for pulsed sources [31], and an algorithm developed by the Chalk
River Laboratories [32] for the NRU data sets, using a Gaussian peak shape.
For convenience, in this chapter ‘Comp.XD/YD’ (or ‘Tens.XD/YD’) is referred to
the case in which the sample is compressed (or pulled) along ‘XD’ and the scattering
vector (Q-vector) for the neutron diffraction measurement is parallel to ‘YD’ (‘XD’ and
‘YD’ could be any one of TD, RD and ND.). For example, ‘Comp.TD/ND’ refers to the
case in which the sample is compressed along TD, while lattice strains are measured in
ND.
The observed lattice strains (although not widths) of the ( 0004 }, { 0220 } and
{ 2220 } peaks will be the same as those of the ( }, {0002 0110 }, and { 1110 }, respectively.
However, since (0004 ), { 0220 } and { 2220 } peaks have much lower intensity than their
lower order counterparts in the TOF neutron diffraction measurements, only results from
1st order peaks are reported. Due to constraints on the monochromator, some 2nd order
94

peaks were measured at NRU. Due to the texture, a few peaks have very low intensity
for certain sample orientations, and hence their lattice strains are omitted. In the
constant-wavelength measurements, only four peaks were measured for each tension test,
due to available experimental time. To summarize, lattice strains are reported for the
diffraction peaks as listed in Table 4-1.
Table 4-1. A list of diffraction peaks for which lattice strains were measured
{ 0110 } (0002) { 1110 } { 2110 } { 0211 } { 3110 } { 2211 } { 1220 }
Comp.ND/ND √ √ √ √ √ √ √ √
Comp.ND/TD √ √ √ √ √ √ √ √
Comp.ND/RD √ ― √ √ √ ― √ √
Comp.TD/ND √ √ √ √ √ √ √ √
Comp.TD/TD √ √ √ √ √ √ √ √
Comp.TD/RD √ ― √ √ √ ― √ √
Comp.RD/ND √ √ √ √ √ √ √ √
Comp.RD/TD √ √ √ √ √ √ √ √
Comp.RD/RD √ √ √ √ √ √ √ √
Tens.ND/ND ― √ ― ― √ ― √ √
Tens.ND/TD { 0220 } (0004) ― ― √ ― ― √
Tens.ND/RD { 0220 } √ * ― ― √ ― ― √
Tens.TD/ND ― (0004) ― ― √ ― √ √
Tens.TD/TD { 0220 } ― ― ― √ ― √ √
Tens.TD/RD { 0220 } ― ― ― √ ― √ √
Tens.RD/ND ― (0004) ― ― √ ― √ √
Tens.RD/TD { 0220 } √ ― ― √ ― ― √
Tens.RD/RD { 0220 } ― ― ― √ ― √ √
* Note: The (0002) peak in Tens.ND/RD was measured using a neutron beam of 1.470 Å , diffracted
by the (115) plane of a Ge single crystal.
95

4.3 Results
It is noted that due to differences in the neutron facilities, slightly different strain
rates were used in the tension tests compared to the compression tests. Since it is well
known that strain rate can affect the macroscopic flow curve, the curves for the tension
tests in the plastic region have been adjusted to be at equivalent strain rates to those used
in the compression tests. This adjustment was based on sets of accumulated data, both
tests carried out at the neutron source and off-line, which were fit to a 4th-order
polynomial curve. It was assumed that the strain rate exponent (0.025-0.030) would be
the same for tension and for compression along a specific direction and at a specific
strain. The experimental lattice strains reported here for the tension tests have then all
been corrected by assuming a change in the measured elastic strain corresponding to the
change in stress in the flow curve, and the measured diffraction elastic constants. This
typically led to around a 11% change in the reported lattice strains within the
macroscopically plastic regime, with a maximum of 14%.
4.3.1 Evidence for tensile twinning
The activation of tensile twinning { 2110 }< 1110 > can cause a reorientation of 85.2°
of the c-axis, resulting in nearly opposite changes in the intensity of basal normals and
prism normals observed in the loading direction and one (or two) Poisson directions.
Fig. 4-3 shows strong evidence for the activation of tensile twinning during compression
along TD and RD, and tension along ND. A family of grains refers to grain orientations
having their {hkil} normals aligned so that they diffract in the same direction, and these
normals will be termed as “{hkil} orientations” or “{hkil} grains”. In Comp.TD/TD, it
96

is apparent that the intensity remains approximately constant until -377MPa for both
(0002) and { 0110 }. Beyond -377MPa, the (0002) intensity keeps increasing significantly,
coincident with a continuous reduction in the { 0110 } intensity. Observed in one
Poisson direction (TD/ND, Fig. 4-3a), the development of { 0110 } intensity is almost
precisely opposite to that seen in the test direction, while the (0002) intensity shows an
opposite trend only at stresses beyond -430MPa. Two reasons are suggested explaining
why the (0002) intensity in TD/ND changes later. Firstly, the slab texture shows that far
more basal normals are oriented in ND than those in TD, thus it is reasonable to argue
that if only a small fraction of basal normals are rotated from ND to TD, it could be
difficult to discern such a small reduction of basal normals in ND, while it can be easy to
observe the increase of the newly formed basal normals in TD. Secondly, tensile
twinning causes a grain reorientation slightly less than 90°. Thus the reduction of the
basal normals due to twinning may not be entirely captured by measurements from ND
without the ‘contamination’ of intensity errors. Considering these two points, it is
deduced that tensile twinning initiates at -377MPa. Similarly, it is derived that tensile
twinning occurs at -370MPa in the ND-RD plane in Comp.RD (Fig. 4-3b), and at
430MPa in both ND-RD and ND-TD planes in Tens.ND (Fig. 4-3c).
The measured (0002) pole figures for Comp.TD, Comp.RD and Tens.ND samples
verify the activation of tensile twinning. For example, twinning is evidenced by the
appearance of basal normals around TD and the reduction in the basal intensity around
ND after compression along TD (Fig. 4-1c), while no evidence for tensile twinning is
found in the sample after tension along the same direction (Fig. 4-1d).
97

4.3.2 Macroscopic behavior
Experimental macroscopic strain-stress curves are shown in Fig. 4-4. Note that the
curves for the tension tests have been corrected for the respective strain rate equivalent to
that used in the compression tests. The differences in yield stress, elasto-plastic transition
and work-hardening behavior can be seen. These basically reflect the influence of the
prior thermo-mechanical processing and resultant texture and intergranular strains.
-500
-400
-300
-200
-100
00 60000 120000 180000
Intensity (Arb. Units)
True
Stre
ss (M
Pa)
{10-10} TD/TD{0002} TD/TD{10-10} TD/ND{0002} TD/ND
(a)
-600
-500
-400
-300
-200
-100
00 40000 80000 120000 160000
Intensity (Arb. Units)
True
Stre
ss (M
Pa)
{10-10} RD/RD{0002} RD/RD{10-10} RD/ND{0002} RD/ND
(b)
Fig. 4-3 (to be continued)
98

0
100
200
300
400
500
6000 50 100 150 200 250 300 350 400
Intensity (Arb. Units)
True
Stre
ss [M
Pa]
{11-20} ND/ND
{11-20} ND/TD{11-20} ND/RD
{0004} ND/ND{0004} ND/TD
{0002} ND/RD
(c)
Fig. 4-3 Evolution of the peak intensity of { 0110 } and (0002) for compression along (a) TD and (b)
RD, and (c) tension along ND
Fig. 4-4 Experimental macroscopic flow curves
99

The yield stress when the material is deformed along ND is significantly higher than
that deformed along TD or RD. Such a discrepancy is obviously a result of the
pre-existing texture in the slab. Further, the yield stress in Comp.ND is higher than that
in Tens.ND, indicating that the macroscopic yielding during compression and tension
along ND is dictated by different deformation mechanisms and/or the influence of
thermal stresses. In addition, the TD tensile sample exhibits slightly higher yield stress
than that in the RD tensile sample, whereas during compression these two samples have
similar yield stresses. Again, different deformation mechanisms are likely responsible for
this observation.
In the tensile tests the elasto-plastic transition is most rapid in the ND sample,
followed by the TD sample and then by the RD, while during compression a reversed
trend in the transition is observed. The pre-existing residual thermal stresses help
explain in part the changes in the transition [21], but the occurrence of tensile twinning in
Tens.ND and Comp.RD is more likely the primary reason, since it brings about
instantaneous grain reorientation and a resultant significant stress relaxation. Clear
evidence of twinning activities is highlighted by the “B-lip” (Tens.ND) and “S-shape”
(Comp.RD) in the flow curves at very low plastic strains.
In the plastic region, the strain hardening rate is much higher in Comp.ND and
Comp.RD than that in the other loading cases. Interestingly, at strains larger than 5%,
the hardening rate in Comp.ND is very similar to that in Comp.RD. While this might be
a coincidence, there is still a possibility that similar deformation mechanisms are active in
the two cases at large strains. In Comp.RD, tensile twinning has reoriented many basal
normals, originally parallel to ND, towards RD at the beginning of plastic deformation.
100

Further reduction in straining along RD may be accommodated by <c+a> slip along the
c-axis, in a similar fashion to the case for Comp.ND.
For each sample, the Lankford coefficient (R-ratio) after testing was measured, as
tabulated in Table 4-2. This parameter is defined as the ratio of contractions (or
expansions) in two given Poisson directions after a sample is pulled (or compressed).
The contractions (or expansions) were measured by a digital caliper. The comparison
reveals a much higher macroscopic anisotropy in plasticity for the TD sample than for the
RD and ND samples. The general trend of the changes in R-ratio across the six loading
cases can be qualitatively explained as a result of initial texture and single crystal
anisotropy. Since it is more difficult for plastic deformation to proceed along the c-axis
(due to high CRSSs for <c+a> slip or twinning) than along the a-axis, and since there are
more c-axes along ND (than TD and followed by RD), it is natural to expect less plastic
deformation in ND, followed by TD and RD in sequence. The measured R-ratios verify
this expectation. Quantitative interpretations involve intergranular constraints and
various slip/twinning mechanism interactions, which will be discussed in Chapter 5.
Table 4-2. Experimental Lankford coefficients
Tens. ND Tens. TD Tens. RD Comp. ND Comp. TD Comp. RD
TDRD εε : NDRD εε : NDTD εε : TDRD εε : NDRD εε : NDTD εε :
Exp. 1.13 3.46 2.61 1.01 2.29 1.42
4.3.3 Lattice strain evolution
4.3.3.1 Compression along TD
Fig. 4-5 illustrates the evolution of lattice strains with respect to applied true stress
for TD parallel to the compressive axis and the two plate directions perpendicular to the
101
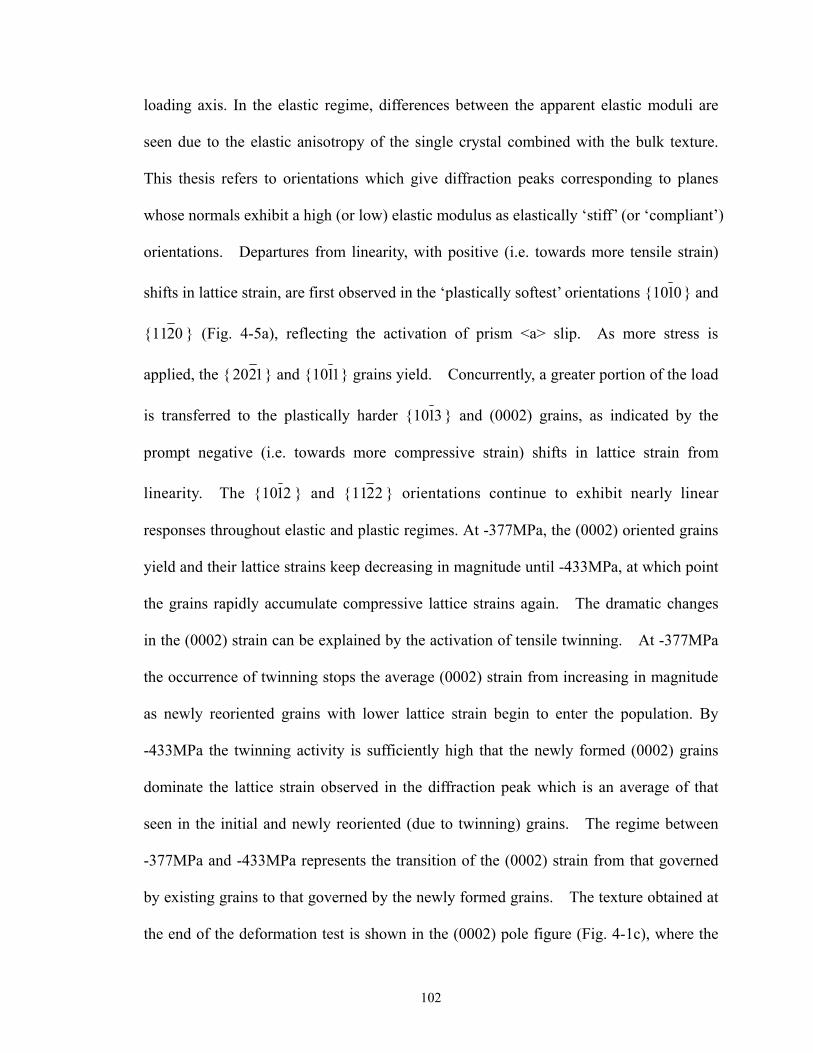
loading axis. In the elastic regime, differences between the apparent elastic moduli are
seen due to the elastic anisotropy of the single crystal combined with the bulk texture.
This thesis refers to orientations which give diffraction peaks corresponding to planes
whose normals exhibit a high (or low) elastic modulus as elastically ‘stiff’ (or ‘compliant’)
orientations. Departures from linearity, with positive (i.e. towards more tensile strain)
shifts in lattice strain, are first observed in the ‘plastically softest’ orientations { 0110 } and
{ 0211 } (Fig. 4-5a), reflecting the activation of prism <a> slip. As more stress is
applied, the { 1220 } and { 1110 } grains yield. Concurrently, a greater portion of the load
is transferred to the plastically harder { 3110 } and (0002) grains, as indicated by the
prompt negative (i.e. towards more compressive strain) shifts in lattice strain from
linearity. The { 2110 } and { 2211 } orientations continue to exhibit nearly linear
responses throughout elastic and plastic regimes. At -377MPa, the (0002) oriented grains
yield and their lattice strains keep decreasing in magnitude until -433MPa, at which point
the grains rapidly accumulate compressive lattice strains again. The dramatic changes
in the (0002) strain can be explained by the activation of tensile twinning. At -377MPa
the occurrence of twinning stops the average (0002) strain from increasing in magnitude
as newly reoriented grains with lower lattice strain begin to enter the population. By
-433MPa the twinning activity is sufficiently high that the newly formed (0002) grains
dominate the lattice strain observed in the diffraction peak which is an average of that
seen in the initial and newly reoriented (due to twinning) grains. The regime between
-377MPa and -433MPa represents the transition of the (0002) strain from that governed
by existing grains to that governed by the newly formed grains. The texture obtained at
the end of the deformation test is shown in the (0002) pole figure (Fig. 4-1c), where the
102

0.0.2% yield stress 2% yield stress
(a)
00.2% yield stress .2% yield stress
(b)
0.0.2% yield stress 2% yield stress
(c) Fig. 4-5 Experimental lattice strains for compression along TD: (a) TD/TD (b) TD/ND (c) TD/RD.
The slight difference in the 0.2% yield stress between the two TD samples (i.e. a, b vs. c) reflects the
material variability. This will also be seen in Fig. 4-6 – Fig. 4-10.
103

signature of twinning can be clearly seen.
In TD/ND (Fig. 4-5b), the low-order grains { 1110 }, { 1220 }and { 0211 } develop the
largest strains in the plastic regime. These grains in the axial direction are actually
high-order grains (e.g. prism grains in the Poisson direction are the (0002) grains in the
axial direction) which develop large compressive strains. During compression these
low-order grains in ND cannot expand as much as the surrounding medium and hence
develop tensile strains. To balance the positive shift in these grains, the high-order grains
( ), {0002 3110 } and { 2110 } accumulate lattice strains with small negative shifts. This
relatively smaller magnitude is correlated with the large amount of the high-order grains
oriented along ND.
In the TD/RD case (Fig. 4-5c), although the behaviour of the { 0110 } grains is similar
to that seen in TD/ND, the { 1110 } grains behave in a quite different way; they
accumulate more compressive strain. Another striking difference i th ths wi e { 221 },
{
1
2110 } and { 3110 } grains. In contrast to the smooth development shown in TD/ND,
these grains in TD/RD experience a very dramatic change in lattice strain in the plastic
regime at -377MPa. At the same stress level the { 0211 } lattice strain goes through a
significant change complementary to the changes with { 2211 }, { 21 } and {10 3110 }
grains. In fact, the { 0211 } strain decreases slightly between -320MPa and -377MPa,
while it continues increasing in TD/ND. A possible origin is the grain rotation triggered
by tensile twinning in ND or by non-uniform macroscopic deformation in the ND-RD
plane. This is correlated with the bulk texture which determines that the macroscopic
deformation proceeds more easily in RD and with more difficulty in ND. Thus the
104

sample after large-strain deformation is expected to have an elliptical cross section, with
the shorter axis along ND and longer axis along RD. The transformation of the cross
section from circular to elliptical one may have resulted in grain rotations. Other possible
reasons for these observed responses include strong interactions between deformation
modes and texture development with deformation.
4.3.3.2 Compression along RD
Lattice strain evolution with applied true stress for the RD compression tests is given
in Fig. 4-6. In RD/RD, the evolution of lattice strains in the plastic regime is generally
similar to that shown for TD/TD. This is because only a very few plastically hard grains
(e.g. (0002) and { 3110 }) are oriented along either RD or TD. However, there are even
fewer hard grains in RD than in TD, and this produces somewhat different lattice strain
evolution for the { 2110 }, { 2211 } and { 1110 } grains. For example in RD/RD, the
{ 2110 } and { 2211 } grains are among the hardest in the plastic regime, while they show
approximately linear responses in TD/TD. { 1110 } grains also show a different lattice
strain development; in RD/RD, they respond to the applied stress almost linearly whilst in
TD/TD they act as plastically soft grains. A more striking difference is seen for the (0002)
lattice strain in RD/RD, where reliable (0002) strains can be measured only after
-370MPa: below this the strains are very scattered due to the very low intensity of (0002)
and hence are omitted from the plot. The (0002) plane spacing prior to deformation was
obtained by extrapolating the measured plane spacings in the elastic region to the zero
stress. It is admitted this reference spacing is not accurate as large errors are involved in
the measurements in the elastic regime, but this is the most reasonable estimate. The
rapidly increasing strains in (0002) grains in RD/RD after -370MPa are the net response
105

0.2% yield stress 0.2% yield stress
(a)
0.0.2% yield stress 2% yield stress
(b)
00.2% yield stress .2% yield stress
(c)
Fig. 4-6 Experimental lattice strains for compression along RD:
(a) RD/RD (b) RD/ND (c) RD/TD
106

of grains newly formed due to tensile twinning.
In the two directions perpendicular to the loading axis, the development of lattice
strains is more complicated. The (0002) lattice strain evolves in a similar way in both
Poisson directions in the plastic regime, i.e. the lattice strain rises quickly first and then
decreases gradually. Such a trend is also observed for the { 2110 } grains in RD/ND and
{ 3110 } in RD/TD. Interestingly, however, the { 3110 } strains in RD/ND and { 2110 }
strains in RD/TD show linear responses with respect to the applied stress. Other peaks
presenting almost linear responses include { 1110 } and { 1220 } in RD/TD and { 2211 } in
both RD/ND and RD/TD. The lower-order grains (e.g. { 1110 } and { 0211 } in RD/ND
and { 0110 } and { 0211 } in RD/TD), on the other hand, experience a rapid decrease in
lattice strain first and then a steady increase after -370MPa. The complex evolution of
lattice strains in RD/ND and RD/TD is similar to that seen in TD/RD, and could be due to
interactions between deformation modes and/or texture evolution.
4.3.3.3 Compression along ND
Fig. 4-7 shows the lattice strain evolution with respect to the applied true stress when
samples were compressed along ND. The material yields at a higher applied stress than
during compression along TD and RD, consistent with there being many more plastically
hard (0002) grains oriented along ND. It should be noted that in the test designated
ND/TD the yield stress was higher than that seen in the test designated ND/RD by
~70MPa; this could be due to the texture variation between the two samples.
Parallel to the loading axis (ND/ND), the most striking evolution is of the (0002)
lattice strain, which develops rapidly to a very large magnitude (over 8000με) and shows
no saturation at high stress levels. In the TD/TD case, the (0002) lattice strain also rises
107
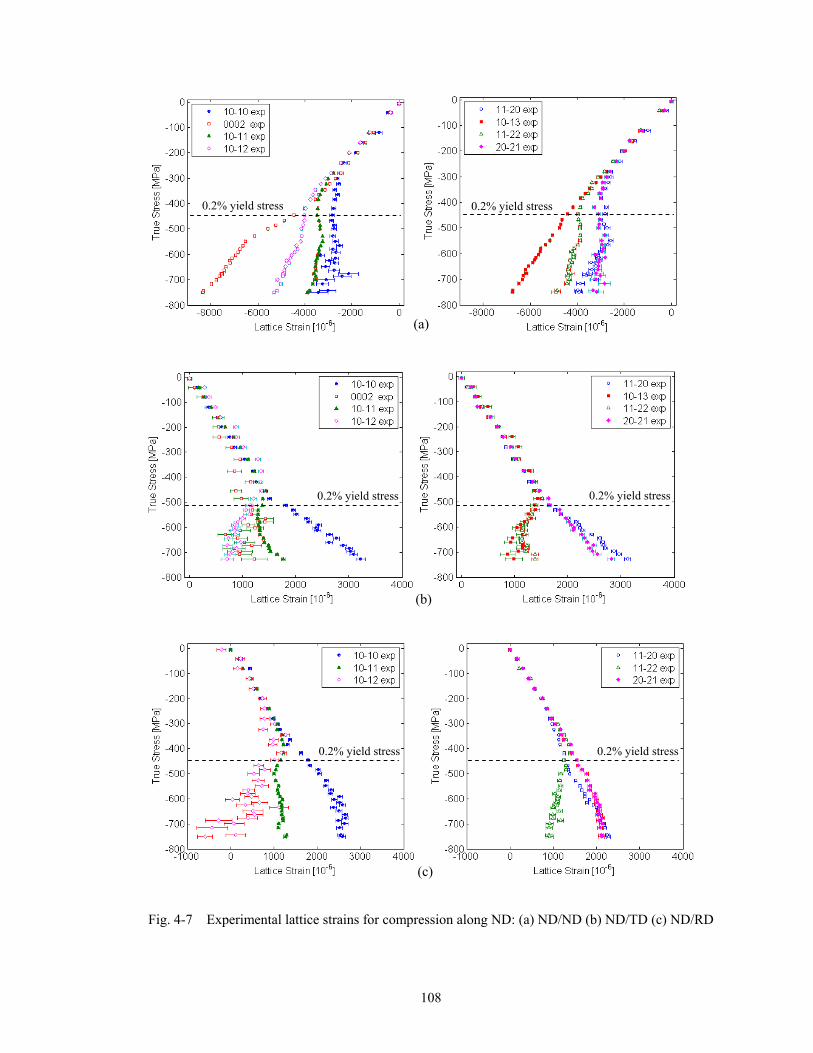
0. 0.2% yield stress 2% yield stress
(a)
0.2% yield stress 0.2% yield stress
(b)
00.2% yield stress .2% yield stress
(c)
Fig. 4-7 Experimental lattice strains for compression along ND: (a) ND/ND (b) ND/TD (c) ND/RD
108

quickly after plastic deformation begins, but at higher stresses it falls sharply due to the
occurrence of twinning induced stress relaxation. Thus the steady increase in the (0002)
lattice strain in ND/ND suggests that any tensile twinning occurring in the Poisson
directions, if it is occurring must be at such a low level as not to affect the average
ND/ND strains. The inflection of the (0002) strain at -520MPa is probably linked to the
onset of pyramidal <c+a> slip in this grain family. Except for this difference, the lattice
strains of the other peaks develop in ND/ND in a qualitatively similar way to that seen in
TD/TD. Slight differences can be noticed for { 3110 }, { 2110 } and { 2211 } grains; i.e.
they act as relatively plastically harder grains in T D wh being rel ly plastically
softer in ND/ND; since in the latter case there are many more relatively hard (0002)
grains to bear the compressive load. Similar differences in the trend of the development
of {
D/T ile ative
3110 }, { 2110 }, { 1110 } and { 2211 } strains are also noticeable between ND/TD and
TD/N
The
D.
lattice strains for the low-order grains in ND/TD, e.g. { 0211 } and { 1220 }
orie D/TD creasntations, evolve in a similar fashion as in TD/ND, although in N they in e
at a higher rate and no saturation occurs even at high stress levels, due to the absence of
tensile twinning. The general lattice strain developments in ND/RD are similar to those
seen in TD/RD, except for the changes being much less dramatic in the former. It should
be noted that in ND/RD the low-order grains { 0110 }, { 0211 } and { 1220 } exhibit almost
perfectly linear responses to the applied stress, th th stic and tic regimes.
It should be emphasized that, although there exist some similarities in the latt
in bo e ela plas
ice
strain evolution for certain diffraction peaks between compression along ND and along
TD, generally a higher stress has to be applied when compressing along ND in order to
109

generate commensurate lattice strains for a given diffraction peak. In addition the lattice
strains develop in totally different ways for compression along ND compared to
compression along RD. This can be attributed to the occurrence of tensile twinning in
compression along RD, but not in compression along ND.
4.3.3.4 Tension along TD
Tension along TD yielded lattice strain evolution as a function of applied true stress
as shown in Fig. 4-8. Along the loading direction (TD/TD), only very small shifts from
linearity are observed for the measured diffraction peaks in the plastic regime. In contrast,
large shifts are found in the Poisson directions (TD/ND and TD/RD). In TD/ND, only
the (0004) strain exhibits a negative departure from linearity. In TD/RD, the shifts are
small for { 1220 } and }0220{ , but are very large for { 2211 } and { 0211 } with reversed
sign. Both (0004) in TD/ND and { 2211 } in TD/RD acc late nega lattice strains in
the plastic regime and no obvious inflections are found, even at high applied stresses.
This suggests that no significant pyramidal <c+a> slip or tensile twinning occurs during
the tension. Interestingly, the {
umu tive
2211 } strains clearly demonstrate reversed shifts in
TD/ND and in TD/RD, which aga sults from the difference in the distribution of basal
nromals along ND and RD. The texture obtained at the end of the deformation test is
shown in the (0002) pole figure, Fig. 4-1d.
4.3.3.5 Tension along RD
in re
on for the tension tests along RD are given as a function of
appl
Lattice strain evoluti
ied true stress in Fig. 4-9. It is clear that generally lattice strains deviate from
linearity at a lower applied stress compared to those during tension along TD and along
ND (Section 4.3.3.6). In RD/RD, the { 2211 } strain was not measured in the plastic
110

0.2% yield stress
111
0.2% yield stress
0.2% yield stress
0.2% yield stress
0.2% yield stress
0.2% yield stress
Fig. 4-8 Experimental lattice strains for tension along TD:
(a) TD/TD (b) TD/ND (c) TD/RD
Fig. 4-9 Experimental lattice strains for tension along RD:
(a) RD/RD (b) RD/ND (c) RD/TD
(a)
(b)
(c) (c)
(a)
(b)

1220 } strain develops in a simregim Te due to lack of experimental time. he { ilar
fashion a ilarity is al {s shown in TD/TD. This sim so found for the prism grains ( 0211 }
and { 0220 }). When the measurement was taken in ND, the (0004) grains build up
negativ ttice strains as they do in TD/ND. In contrast, other grains (i.e. {e la 0211 },
{ 1220 } and { 2211 }) yield and accumulate positive shifts in lattice strain. S
behavior can be found in TD/ND with a higher rate of lattice strain development. For
RD/TD, the overall trend of the lattice strain development is not very different from that
in RD/ND; however, in RD/TD magnitude of the basal strain is much greater than that in
RD/ND, while the opposite is true for the {
imilar
2211 }, { 1220 } and { 0211 } peaks. This can
be understood by considering that more low-order grains are oriented in TD than in ND
and these can accommodate the negative macroscopic plastic strain by activating <a> slip.
The contractions in ND and TD lead to the build-up of negative lattice strains for the
basal grains. Since more basal grains are oriented along ND, they provide more
resistance to the contraction and thus the magnitude of the basal strain in RD/ND is
smaller. In RD/ND, it is possible that the (0002) strain develops with a larger gradient
beyond 400MPa, which would reflect the activity of pyramidal <c+a> slip.
4.3.3.6 Tension along ND
The lattice strains are plotted against applied true stress in Fig. 4-10 for the tension
tests along ND. Due to time limitations, the lattice strains in the elastic regime in
ND/TD were not measured. In the ND/ND and ND/RD cases, deviations of the gradient
of lattice strain from linearity for all diffraction peaks occur at higher stresses than those
found during the tension along TD and along RD, since most grains are not favorably
oriented for the activation of <a> slip. In the loading direction, the trends observed in
112

(a)
(b)
(c)
Fig. 4-10 Experim D/TD (c) ND/RD
0.2% yield stress
0.2% yield stress
0.2% yield stress
ental lattice strains for tension along ND: (a) ND/ND (b) N
113

}, { 1220 } and { 02112211ND/ND are comparable with TD/TD for the { } strains. In
ND/ND the development of the (0002) strain has two inflections: one at 400MPa and the
other at 450MPa. The first inflection may be caused by the occurrence of tensile twinning
and/or pyramidal <c+a> slip, while the second one may be due to accumulated hardening
of the twinning and/or <c+a> slip. In the two Poisson directions, the basal orientations
build up negative lattice strains quickly right after the deformation enters the plastic
regime, with the build-up more rapid in ND/RD. This is similar to the comparison of the
basal strain development observed between RD/ND and RD/TD. In the meantime, the
prism orientation { 0211 } accumulates positive shifts from linearity. However, { 1220 }
shows a nearly linear response in ND/RD, while it accumulates around the same amount
of positive strain shift as the prism orientations do in ND/TD.
4.4 Discussion
ent during compression and tension in three
dire
ce strain (deviation from linearity appears
onc
nt that when measurements were taken parallel to the
The experimental lattice strain developm
ctions can be summarized as the following.
Table 4-3 summarizes the deviations in latti
e plastic deformation begins) of the prism and basal orientations for each case. It
should be remembered that the deviations listed in the table only refer to those seen at
low plastic strains (<2.5%); at higher strains things are more complicated, especially once
tensile twinning is activated.
From Table 4-3, it is evide
loading direction, the deviation of the basal strain from elastic linear response is always
negative irrespective of the sense of applied stress, while the deviations of the prism
114

strains under compressive loading are positive while in tension they are negative. When
measurements were taken in the Poisson directions, generally in compression (except
Comp.TD/ND) the lattice strains deviate positively for prism orientations and negatively
for basal orientations, in perfect opposition to the behavior in tension.
During plastic deformation in the tension tests, in the principal Poisson direction
along which fewer basal grains are oriented, the basal strain develops more rapidly than
in the other Poisson direction. Since fewer basal grains are available to provide resistance
accumulate negative intergranular strains in order to maintain stress balance. Therefore, it
can be deduced that the unmeasured (0002) strains in Tens.TD/RD would also
accumulate negative strains, with a speed faster and magnitudes greater than the { 2211 }
strain. It is also very possible that the unmeasured { 3110 } and { 2110 } peaks de p
compressive intergranular strains in Tens.TD/RD and T D/TD, w they develop to
velo
ens.R hile
Tabl 4-3. Deviations of lattice strain from linearity in the plastic regime for prism and basal
e
orientations (‘+’ for positive deviation, ‘―’ for negative deviation, ‘0’ for nearly no deviation and ‘/’
for data unavailable)
) { 0220} { 0211 } ( 0002 } ( 0004 ) { 0110 } { 0211Comp.ND/ND + + ― Tens.ND/ND / ― ―
Comp.ND/TD ― ― + Tens.ND/TD + + ―
Comp.ND/RD ― ― + Tens.ND/RD + + ―
Comp.TD/ND + + 0 Tens.TD/ND + + ―
Comp.TD/TD + + ― Tens.TD/TD ― ― /
Comp.TD/RD 0 ― + Tens.TD/RD + + /
Comp.RD/ND ― ― + Tens.RD/ND + + ―
Comp.RD/TD ― ― + Tens.RD/TD + + ―
Comp.RD/RD + + ― Tens.RD/RD ― ― /
115

12202211the contraction, the lower-order peaks (e.g. { } o evenr { }) are more likely to
Tens.TD/ND ND.
he s in and particu r pe dat eported an be i rpreted to
t by imple rect in ctio e qu itative interpreta on of the
f spe fic def ation des tice in development requires the
of a lycrys ne model. T pres ted here is considerably more
an those ever previous us odel to
experiment thus represents a far stronger test of the applicability of these models than the
lar cha
onstrate however that either appropriately weighted multi-peak averaging
[34] or m
tensile ones or nearly zero in and Tens.RD/
While t tra in la ak intensity a r c nte
some exten s di spe n, a mor ant ti
influence o ci orm mo on the lat stra
application po talli he data set en
extensive th ly ed to test such models. Matching m
smaller data sets tested to date, it thus also presents particu llenges for such
modeling.
It is noted that there are few diffraction peaks that show negligible lattice strain
development in Table 4-3. Further, the peaks which do show low strains vary with
texture and direction of measurement even for the same sense of the applied load. This
has consequences for the measurement of Type I (or macroscopic) stress by the use of
measurements on a single diffraction peak. The choice of a diffraction peak on which
negligible lattice strains develop has historically been a requirement for successful Type I
stress measurement at monochromatic neutron or X-ray facilities [33]. The results
reported dem
ore advanced modeling techniques are required to interpret the relationship
between applied stress and lattice strain for Zircaloy-2 and similar hcp alloys.
4.5 Conclusion
Large strain in-situ compression and tension tests have been performed on samples
116
117
for several
ystallographic planes in all measurement directions. This provides a comprehensive
ich to test polycrystalline models. The recorded intensity changes of
the
from a Zircaloy-2 polycrystal with moderate bulk texture during neutron diffraction. The
tests were conducted in three directions relative to the parent slab. For each test, lattice
spacings and intensity changes were measured in the three principal plate directions for
each test direction. A comprehensive data set of lattice strain was developed
cr
data set against wh
prism and basal orientations revealed substantial tensile twinning in compression
along TD and along RD, and in tension along ND. Evolution of lattice strain is
significantly influenced by the crystallite elastic and plastic anisotropy, the bulk texture
and tensile twinning.
References [1] S.R. MacEwen, J. Faber and A.P.L. Turner, Acta Metall. 31 (1983) 657-676
[2] R.A. Holt and A.R. Causey, J. Nucl. Mater. 150 (1987) 306-318
[3] B. Clausen, T. Lorentzen and T. Leffers, Acta Mater. 46 (1998) 3087-3098
[4] A. Akhtar, Acta. Metall. 21 (1973) 1-11
[5] A. Akhtar, J. Nucl. Mater. 47 (1973) 79-86
[6] P.G. Partridge, Metall. Rev. 12 (1967) 169-194
[7] E. Tenckhoff, ASTM STP 966, ASTM International, West Conshohocken, PA (1988)
[8] R.G. Ballinger and R.M. Pelloux, J. Nucl. Mater. 97 (1981) 231-253
69
Cryst. 31 (1998) 262-269
[11] J.W.L. Pang, T.M. Holden, P.A. Turner and T.E. Mason, Acta Mater. 47 (1999) 373-383
[12] H. Francillette, B. Bacroix, M. Gasperini and J.L. Bechade, Acta Mater. 46 (1998)
[9] R.G. Ballinger, G.E. Lucas and R.M. Pelloux, J. Nucl. Mater. 126 (1984) 53-
[10] H.R. Wenk, S. Matthies, J. Donovan and D. Chateigner, J. Appl.

118
001)
rsson, J. Nucl. Mater. 105 (1982) 341-344
9
. Kiran Kumar, C. Vanitha, I. Samajdar, G.K. Dey, R. Tewari, D. Srivastava and S.
0)
Jackman, T.M. Holden, J. Faber, Jr. and
,
29-539
rner, N. Christodoulou and C.N. Tomé, Int. J. Plast. 11 (1995) 251-265
(2002) 73-82
0 (2002) 1613-1626
4131-4142
[13] O. Castelnau, H. Francillette, B. Bacroix and R.A. Lebensohn, J. Nucl. Mater. 297 (2
14-26
[14] J.L. Martin and R.E. Reed-Hill, Trans. TMS AIME 230 (1964) 780-785
[15] M.J. Philippe, M. Serghat, P. Van Houtte and C. Esting, Acta Metall. Mater. 43 (1995)
1619-1630
[16] D. Gloaguen, M. Francois, R. Guillen and J. Royer, Acta Mater. 50 (2002) 871-880
[17] K. Pette
[18] P. Sanchez, A. Pochettino, T. Chauveau and B. Bacroix, J. Nucl. Mater. 298 (2001) 329-33
[19] M
Banerjee, Mater. Sci. Tech. 22 (2006) 331-342
[20] S.R. MacEwen, N. Christodoulou and A. Salinas-Rodriguez, Metall. Trans. A 21 (199
1083-1095
[21] S.R. MacEwen, C. Tomé and J. Faber, Acta Metall. 37 (1989) 979-989
[22] S.R. MacEwen, N. Christodoulou, C.N. Tomé, J.
R.L. Hitterman, in J.S. Kallend and G. Gottstein (eds.), Proc. 8th Int. Conf. on Texture of Materials
The Metallurgical Society, Warrendale, PA, (1988) 825-836
[23] N. Christodoulou, Acta Metall. 37 (1989) 5
[24] P.A. Turner and C.N. Tomé, Acta Metall. Mater. 42 (1994) 4143-4153
[25] P.A. Tu
[26] T.M. Holden, J.H. Root, R.A. Holt and P.A. Turner, J. Nucl. Mater. 304
[27] R.A. Holt, D. Dye and R.B. Rogge, Annual Report of the National Research Council (2004)
[28] J.R. Santisteban, M.R. Daymond, L. Edwards and J.A. James, J. Appl. Cryst. 39 (2006)
812-825
[29] M.R. Daymond and H.G. Priesmeyer, Acta Mater. 5

119
stem, Report No.
ction
4
Stress Using
ond, J. App. Phy. 96 (2004) 4263-4272
[30] A.C. Larson and R.B. Von Dreele (1994) General Structure Analysis Sy
LAUR 86-748.
[31] S. Ikeda and J.M. Carpenter, Nuclear Instruments and Methods in Physics Research Se
A: Accelerators, Spectrometers, Detectors and Associated Equipment 239 (1985) 536-544
[32] J.R. Cho, D. Dye, K.T. Conlon, M.R. Daymond and R.C. Reed, Acta Mater. 50 (2002)
4847-486
[33] M.T. Hutchings and A.D. Krawitz, Measurement of Residual and Applied
Neutron Diffraction. Kluwer Academic Publishers, Dordrecht/Boston/London, (1992)
[34] M.R. Daym

120
This page is blank.

Chapter 5
Modeling Lattice Strain Evolution during Uni-axial Deformation in Textured Zircaloy-2
An elasto-plastic self-consistent model was used to interpret the experimental lattice
strain evolution previously reported for testing in three directions relative to a thick
polycrystalline Zircaloy-2 slab. The model results were used to infer the underlying
deformation mechanisms. The influences of prism <a> slip, basal <a> slip, pyramidal
<c+a> slip and tensile twinning modes were considered. The critical resolved shear
stresses and hardening parameters for each mode were obtained by simultaneously
obtaining a best fit with the macroscopic flow curves, Lankford coefficients and lattice
elastic strain development for all measured diffraction peaks, for the combination of three
measurement directions, three loading directions, and two mechanical loading senses (i.e.
compression and tension). In particular, the effects of dislocation interactions during
deformation leading to hardening between deformation modes were considered. Tensile
twinning was inferred from the intensity changes of the diffraction peaks and its activity
was qualitatively reproduced by the simulations for compression along the plate rolling
and transverse directions and tension along the plate normal direction.
5.1 Introduction
With excellent mechanical and corrosion-resistant properties combined with good
neutronic properties, Zircaloy-2, and the very similar alloy Zircaloy-4, have extensive
applications in the nuclear industry, with particular application in the reactor core.
121

These alloys are predominantly (>98%) zirconium, with a hexagonal close-packed (hcp)
structure that exhibits anisotropy in its thermal, elastic and plastic properties. In
common with other polycrystalline metals, the elastic and plastic anisotropy are
responsible for striking differences in the local stress-strain response of the differently
oriented grains within the polycrystal aggregate. The ‘intergranular stresses’ that are
generated between differently oriented grains in the polycrystal are complex in origin, but
can be interpreted with the aid of polycrystalline models [1]. Such models lead to an
understanding of the relative contributions of different micromechanical deformation
modes to the macroscopic strain. This has practical significance, since it can be used
directly in predicting lifetime of reactor components, and in the assessment of optimized
processing routes.
The differences in stress experienced by differently oriented grains in a Zircaloy
polycrystal arise from several sources, basically all due to the combination of an
anisotropic single crystal that is constrained within the polycrystal aggregate, which itself
may be anisotropic if the material is textured. Firstly, this can be due to thermal
anisotropy; as the material cools after a thermal treatment that relaxes the stresses, the
differing thermal strain must be accommodated in the context of strain compatibility and
stress balance. Then, during loading of a sample, differences in the elastic properties of
the grains lead to distribution of the load between the grains, in a manner analogous to
composite load sharing. Subsequent plastic flow will also be anisotropic due to a
combination of the differences in Schmid factor, differences in critical resolved shear
stresses (CRSS) for different deformation modes, and the differences in stress in the grain
(due to elastic anisotropy). This plastic anisotropy causes further redistribution of the
122

applied load between grains of different orientations. For example, the stress in a
particular grain during elastic loading of a polycrystal arises from a combination of
thermal misfit stress and the stress due to the applied load and the elastic anisotropy of
the grain with that orientation. When the stress experienced by the grain corresponds to
the CRSS for a given slip system, the grain will begin to deform plastically (potentially
before macroscopic plasticity occurs in the specimen; ‘micro-yield’), while other grains
are still elastic.
A difficulty in studying material properties of Zircaloys and many other modern
alloys is the near impossibility of growing even moderate size single crystals and, as a
result, of making direct measurements of the single crystal properties. In addition, the
constraints and presence of grain boundaries in Zircaloy polycrystals are likely to
produce differences in the single crystal properties of the aggregate from those of
un-constrained single crystals. At present, matching the modeling results by using
polycrystalline plasticity models with the experimental data is the only practical means to
derive the single crystal properties (including the relative contributions of deformation
systems during deformation) in a textured polcyrstal. The modeling also allows
predictions of materials response under complex stress states, or the accident conditions.
Broadly two classes of the polycrystal plasticity models have been popular in recent years,
finite element crystal plasticity models, elasto-plastic self consistent models. The latter
is used in this chapter.
In this chapter, the lattice strain evolution will be modeled for the samples cut from a
moderately textured Zircaloy-2 slab. An extensive set of experimental measurements of
lattice strain evolution have been made by neutron diffraction and were reported in
123

Chapter 4. In brief, compression and tension tests were carried out in-situ during
neutron diffraction along each of the three principal slab directions (i.e., rolling,
transverse and normal) to over 10% strain. For each loading case, lattice strains were
measured in all three principal directions. Based on the results obtained from an
elasto-plastic self-consistent model, the lattice strain evolution is interpreted by exploring
the contributions of different deformation mechanisms. In the modeling process, prism
<a> slip, basal <a> slip, pyr<c+a> slip and tensile twinning modes were considered. The
CRSSs and hardening parameters for each mode are derived through simultaneous fitting
to the macroscopic flow curves, Lankford coefficients and lattice strain development for
all diffraction peaks for all 18 combinations of measurement and loading directions.
This is the first attempt to derive such model parameters by fitting to such an
extensive data set. Due to the use of the large data set it was possible to ascertain that
the effects of dislocation interactions on hardening between deformation modes play an
important role in determining both internal and macroscopic strains; to date little
attention has been paid to this subject.
5.2 Summary of experimental work
Only a brief summary of the experimental method and observations is given here.
Due to the large quantity of data collected, the model is compared with various subsets of
the entire data set (see Chapter 4).
The Zircaloy-2 slab from which the specimens were machined was warm rolled after
preheating to ~700K, cooled to room temperature. Transmission electron microscopy
showed the material to be fully recrystallized, indicating that it had reached a temperature
124

of at least 900K during processing [2], likely as a result of adiabatic heating. The grains
are equi-axed with an average size of ~20μm, and the material has a typical rolling and
recrystallization texture, i.e. most (0002) poles are orientated along ND with a spread of
±50º towards TD and ±30º towards RD; most { 0110 } grains are orientated at ±30º away
from RD in the RD-TD plane [3]. In hcp materials the proportion of basal poles in a
particular direction in the sample has a major impact on the deformation response. Thus
the texture of the slab is ideal for studying the three dimensional lattice strain evolution,
as it provides three clearly distinct levels of basal intensity in the principal directions.
Further, the recrystallization process has removed most of the dislocations induced by
warm rolling which may otherwise bring about another level of complexity in
interpreting the lattice strain evolution during subsequent loading.
The data presented in Chapter 4 were obtained by neutron diffraction measurements
with the gauge volume centered at the mid-height (or mid-length) of the specimens where
the deformation can be reasonably assumed uniform. Lattice strains were calculated by
the shift of the peaks, i.e.
1sinsin
−=−
=hkil
ref
ref
refhkilhkil d
ddθθ
ε (5.1)
where, hkilε is the lattice strain of grain family {hkil}; and are the plane
spacings before and after deformation, respectively;
refd
ref
hkild
θ and hkilθ are half the
diffraction angles before and after deformation, respectively.
Plotted lattice strains are calculated with respect to the start of each test, and
therefore represent the increment produced by loading only. Note that the lattice strain
is the averaged response over all the grain orientations that satisfy the Bragg’s law for a
125

particular {hkil} in the gauge volume.
The experimental results are briefly summarized as the following:
(1) On the microscopic scale, { 0110 } and { 0211 } grains parallel to the applied load
always yield first as the applied load is increased, and (0002) grains yield last, or in some
cases never yield.
(2) In the plastic regime but at low strains (<2.5%), when measurements were taken
parallel to the loading direction, the deviation of the basal orientation strains from elastic
linear response is always negative irrespective of the sense of applied stress; the
deviations of the prism plane strains are positive compared to the elastic response under
compressive loading, while they are negative in tension. When measurements were made
in the Poisson directions, generally under compressive loading the lattice strains deviate
positively from the elastic linear response for prism orientations and negatively for basal
orientations, in perfect opposition to the behavior in tension.
(3) Both the flow curves and the development of lattice strains are assymetrical, i.e.,
there is a significant strength differential between tension and compression and there are
substantially larger deviations in lattice strain amongst different crystallographic
orientations in the test direction for compression than for tension. The reverse is true for
the Poisson directions.
(4) Strong evidence was found for tensile twinning in tensile tests in the plate normal
direction and also for tests where compressive loading was applied in the transverse and
rolling directions. The texture changes in these specimens were consistent with the
occurrence of tensile twinning [4] and the presence of tensile twins was confirmed by
transmission electron microscopy and scanning electron microscopy/electron backscatter
126

diffraction [5]. No evidence of compression twinning was found.
(5) Despite the similarity of lattice strain development in TD and RD directions,
there exist obvious differences of the development in these two directions that highlight
the necessity of performing measurements and modeling in all the three directions, rather
than one or two directions.
5.3 Simulations using the elasto-plastic self-consistent model
An elasto-plastic self-consistent polycrystalline model (EPSC) [6 ] was used to
simulate the macroscopic flow curves, Lankford coefficients and the lattice strain
evolution as a function of applied stress. It was thus used to infer the activities of
various deformation modes.
In the EPSC model, each grain is assumed to be an ellipsoidal elasto-plastic inclusion
embedded in a homogeneous effective medium (HEM); the HEM is treated as a textured
anisotropic elasto-plastic aggregate. The interaction between the grain and HEM is
carried out by an elasto-plastic Eshelby approach. The model iterates to a solution
where the HEM represents the average response of the grain population used. The grain
population is chosen to represent the measured texture. A full description of the model
can be found in Ref. [6].
In the model, the evolution of CRSS of individual deformation modes is described
with an empirical Voce hardening law [7]:
)]/exp(1)[( 10110ssssss τθθτττ Γ−−Γ++= (5.2)
where is the instantaneous CRSS, and are the initial and final
back-extrapolated CRSS, respectively. and are the initial and asymptotic
sτ s0τ
s0θ
ss10 ττ +
s1θ
127

hardening rates, and is the accumulated plastic shear in the grain. The model also
allows for the possibility of ‘self’ and ‘latent’ hardening by defining coupling coefficients
which empirically account for the obstacles to deformation the mode s’ represent
for deformation of mode s [
Γ
ssh ′/
8]:
∑′
′′ΔΓ
=Δs
ssss
s hdd γττ / (5.3)
Twinning in the model is treated as a uni-directional slip system in the sense that a
CRSS is assigned to it, and in addition induces a shear strain representing the twinning.
It can provide some degree of stress relaxation, although typically such relaxation is not
sufficient to match that observed experimentally [8].
The lattice strain calculated by EPSC for comparison with the neutron diffraction
measurements is the averaged response of a grain family, i.e. all grains with a particular
{hkil} within a few degrees relative to a nominal direction in the sample. Thus the results
can be directly compared to the neutron diffraction measurements. Note that EPSC does
not include texture development and in particular, the twinning model does not account
for the reorientation and local stress relaxation due to twinning.
The deformation process was first modeled as the sample being cooled from 898K to
298K, representing initial thermal strains. The macroscopic and internal stress/strain
states at 298K then served as the initial condition for the subsequent mechanical loading.
Appropriate boundary conditions were applied to model the mechanical loading process
until the desired macroscopic strain state was reached where neutron diffraction
measurements were performed. Finally the sample was fully unloaded. The thermal
macroscopic strains and internal strains (see Appendix A) are subtracted from the final
ones to yield mechanical deformation-induced macroscopic strains and internal strains
128

that can be directly compared with experimental diffraction strains.
In the EPSC calculations, the elastic constants of Zircaloy-2 were assumed to be
identical to those of pure zirconium, as determined by Fisher and Renken [ 9 ];
C11=143.5GPa, C33=164.9GPa, C12=72.5GPa, C13= 65.4GPa, and C44= 32.1GPa. The
thermal expansion coefficients were determined by a heating-cooling experiment as
and [3]. These are reasonably consistent with
values reported for single crystal Zr [
16103.5 −−×= Kaα16101.10 −−×= Kcα
10]. The grain shape was assumed to be spherical.
The orientation distribution was calculated from the measured pole figures and then
represented by a 10°×10°×10°grid in Euler space, resulting in 1944 orientation-
weighted grains to describe the bulk texture.
The plastic deformation can be correlated with the activities of various deformation
modes, which in turn are governed by the elastic and plastic anisotropy, grain orientations,
and the external loading. In the modeling, the Voce hardening parameters 0τ , 1τ , 0θ
and 1θ were taken as adjustable fitting parameters. The typical values of the latent
hardening coefficients hs/s’ used are 1.0, i.e. that the shear strain accumulated in a
particular deformation mode affects the yield surface of all deformation modes equally.
This study shows that some hs/s’ values have considerable effects on the modeling results,
and thus they were also treated as fitting parameters
The validity of the fitting parameters obtained from comparison with experimental
data will be much dependent on the number of parameters which can be varied and the
size of the fitted data set. In the case of a large number of fitting parameters, only one
diffraction data set is unlikely to pose sufficient constraints, i.e. many parameter
combinations may lead to similar results. Fitting to a larger data set is obviously more
129

difficult, but it does introduce more constraints and thus can significantly reduce the
number of suitable parameter combinations – even narrow down to one ’best’ solution in
some cases. This study aims to use a single set of material parameters to describe the
entire deformation either under tension or compression in any of the three principal
directions of the material plate. This has not been attempted before.
Therefore, an inverse approach was used, i.e., adjusting the parameters in an iterative
manner to simultaneously improve the fit to all the macroscopic flow curves and lattice
strain developments. The judgment of good fit was done by observation. The data sets
include 6 flow curves and 18 sets of lattice strain development, with each set consisting
of lattice strain evolutions for 4-8 diffraction peaks. Parameters derived through such a
process are obviously more reliable than those derived through fitting to only one or two
test and/or measurement directions, although given the manual nature of the approach
they cannot be considered necessarily the true ‘best fit’, and further, may not be a unique
solution to the data.
Based on the review of the deformation modes in polycrystal single phase Zr alloys
(see Section 2.2 in Chapter 2), deformation modes prism <a> slip { 0110 }< 0211 > (pr),
basal <a> slip {0001}< 0211 > (bas), pyr<c+a> slip { 1110 }< 3211 > (pyr) and
{ 2110 }< 1110 > tensile twinning (tt) were taken into account. Considering the large
number of combinations of 36 free fitting parameters (4 Voce hardening parameters and 5
latent hardening parameters for each of four deformation modes) and the large number of
objectives, several measures were taken to make exploration of the parameters feasible.
First, linear hardening of the deformation mechanisms was assumed ( 01 =τ and
10 θθ = ), thus reducing the number of Voce hardening parameters to 8. Secondly,
130

although the experiments and simulations were conducted to over ±12% strain, only the
macroscopic and internal strains in the first ±~5% strain were compared, where texture
changes (except those due to twinning) are relatively insignificant. Thirdly, the lattice
strains of the peaks with relatively high intensity were given more emphasis due to their
lower uncertainties. Finally, each of the 20 latent hardening parameters was tested
individually against its effects on the macroscopic responses and lattice strain
developments for all the loading cases; hence the sensitivity of the results to each hs/s’
could be evaluated. The influence of the pyramidal slip on other modes was found to
only be significant during compression along ND. Adjusting any of the latent hardening
parameters , hpyr/pyr, hpr/pyr, hbas/pyr and htt/pyr from the default value 1.0 led to
significantly worse agreement between the model and the experiment, hence these
parameters were left as 1.0. Adjusting the following parameters can help enhance the
agreement, and thus they were treated as fitting parameters: , hpr/pr, hbas/pr, ,
hpr/bas, hbas/bas, hpr/tt and hbas/tt. As a result, the initial 36 fitting parameters reduced to 16.
For further simplicity, the 16 parameters were split into two groups: the Voce hardening
group and the latent hardening group. Since the Voce hardening parameters play the
most significant role, the latent hardening parameters were adjusted only after the Voce
hardening ones had been optimized.
pyrselfh
prselfh
bas θ
basselfh
Orthogonal tables for , , , , , , and were
generated to yield candidate combinations. The approximate ranges for each parameter
were chosen according to the published polycrystal data [6,
pr0τ
≤ pr0τ
bas0τ
≤
pyr0τ
tt0τ
≤ τ
pr1θ
≤bas
1θpyr
1tt
1θ
≤
11,12,13,14,15,16,17,18,
19,20,21,22] as follows: 90 120MPa, 120 240MPa, 240≤ 340MPa, 0pyr
0τ
131

180 280MPa, and all values between 0 and 1. The macroscopic yield
strengths during compression and tension tests along three directions were used as the
primary fitting criterion. Subsequent exploration of the sensitivity of the simulation
results to each parameter demonstrated that was the most important in controlling
macroscopic yielding and (0002) lattice strain development during tension along ND,
reflecting the fact that a large number of grains are well oriented for tensile twinning in
this case. was thus determined as ~240MPa by matching the material responses
(specifically for macroscopic yielding) during tension along ND. Similarly, it was
found that only during compression along ND it is necessary for the pyr<c+a> slip mode
to be appreciably active, and thus fitting the (0002) lattice strain evolution during
compression along ND provides information on (~320MPa). Other candidate
combinations were tested against the flow curves and neutron diffraction data, and the
‘best-fit’ is listed in Table 5-1.
≤≤ tt0τ
τ
1θ
tt0τ
tt0
pyr0τ
Table 5-1. Critical resolved shear stresses and Voce hardening parameters used in modeling
0τ (GPa) 1τ (GPa) 0θ 1θ
prism <a> slip 0.100 0. 0.020 0.020
basal <a> slip 0.160 0. 0.020 0.020
pyr<c+a> slip 0.320 0. 0.400 0.400
tensile twinning 0.240 0. 0.100 0.100
Latent hardening parameters were found to have strong effects on both the Lankford
coefficients and lattice strain development, especially during compression along TD and
along RD. The range of the parameters considered was from -5 to 10, where a negative
132

parameter would represent a softening effect and a value of zero would indicate no
interaction. The importance of these parameters will be discussed in Section 5.5.4. The
8 latent hardening parameters were adjusted to match the experimental results, and the
‘best-fit’ set is listed in Table 5-2.
Table 5-2. Latent hardening parameters used in modeling
(‘1’ represents isotropic latent hardening)
hself hpr/s’ hbas/s’ hpyr/s’ htt/s’
prism <a> slip 5. 5. 5. 1. 1.
basal <a> slip 5. 1. 5. 1. 1.
pyr. <c+a> slip 1. 1. 1. 1. 1.
Tensile twinning 1. 5. 5. 1. 1.
5.4 Comparison of model results with experiment
The model data can be compared directly to several experimental parameters, which
are considered systematically in the sub-sections below. It is noted that agreement
between model and experiment is sometimes not as good as earlier comparisons in the
literature that have been reported for hcp materials. This is because only a single set of
material parameters is used to simultaneously fit to a very large data set, which is much
larger than has been attempted before. Typically such comparisons between model and
diffraction data have considered fitting to between 1 and 3 diffraction data sets, whereas
here 18 data sets are considered. If a reduced number of data sets are considered,
considerably improved agreement between model and experiment can be obtained for our
data, comparable to that previously obtained. However, the use of the extensive
experimental data set means that, firstly, the parameters obtained are much more likely to
be representative of the ‘actual material’, at least within the limitations of the model to
describe the material. Secondly, the use of the extensive data set has allowed, for the
133

first time, to consider systematically the potential contribution of anisotropic interaction
between slip systems on the hardening behavior. While the importance of this has long
been recognized (e.g. [18]), previous lattice strain data sets have not allowed
unambiguous determination of the contribution of such effects. Finally, the data set
provides a more rigorous test of the polycrystal model, highlighting discrepancies with
the experimental predictions which otherwise may be missed due to use of multiple
fitting parameters.
5.4.1 Macroscopic behavior
The predicted macroscopic flow curves for both tension and compression along three
directions are compared to experimental data in Fig. 5-1. It is apparent that in the elastic
regime, the slope of the stress versus strain in each case is very well reproduced,
suggesting that the elastic constants used in the modeling are quite reasonable and the
texture has been well represented. The model also predicts well the apparent asymmetry
(or symmetry) in the macroscopic yield strength between Comp.ND and Tens.ND, and
between Comp.RD and Tens.RD (or between Comp.TD and Tens.TD). Such (a)symmetry
is governed by the pre-existing thermal residual strains and initial CRSSs of the
deformation modes. In particular, the higher yield stress for compression in ND than for
tension in ND is related to the higher CRSS for pyr<c+a> slip than for tensile twinning.
As well, calculations produce similar changes in the curvature of the elastic-plastic
transition, i.e. in compression tests the curvature in Comp.RD is greater than that in
Comp.TD and Comp.ND, while in the tension the curvature in Tens.ND is larger than that
in Tens.TD and Tens.RD. These changes in curvature should be controlled by the thermal
strains and the activation sequence of the deformation modes, which are determined
134

(a) (b)
(c)
Fig. 5-1 Modeling of the macroscopic flow curves is: (a) compression and tension along ND, (b)
compression and tension along TD and (c) compression and tension along RD
by their initial CRSSs, the grain orientations relative to the external loading and the
hardening. On the basis of the good agreement in the yield strengths and the curvatures,
it is believed the initial CRSSs of individual deformation modes as listed in Table 5-1 to
be approximately correct.
In the plastic regime, the model predicts the flow curves with varying success.
Before ~±8% strain, either in tension or in compression, the experimental results are
reasonably well predicted. During compression along RD, the hardening rate increases
significantly after -2% strain, but the predictions underestimate the significant stress
135

increase. A probable reason for this unsuccessful prediction is due to inadequacies in
the description of the interactions among the deformation modes and in particular the
barrier effects of twin boundaries on dislocation motion. It is noted that, in the elastic
and plastic regimes, nearly symmetrical flow curves are observed between Comp.TD and
Tens.TD, but such symmetry is not observed either between Comp.ND and Tens.ND, or
between Comp.RD and Tens.RD. The symmetrical responses between tension and
compression along TD may indicate similar relative activities of the deformation modes
(as will be revealed by the modeling of relative activities in Section 5.4.2.2). However,
this symmetry does not mean that the lattice strains should develop in a similar fashion in
Comp.TD and Tens.TD (will be discussed in Section 5.4.2.5). Another point of note is
the failure to predict the significant stress relaxation at the beginning of the plastic
deformation during tension along ND. The reason is probably the inadequate
description of twinning in the model, which is unable to cope with the substantial
twinning induced stress relaxation that occurred in this case.
From the calculations the relative contractions or expansions (during tension or
compression) in two Poisson directions were also derived, which are represented in terms
of the Lankford coefficient (or R-ratio) R= YDXD εε : (‘XD’ stands for the direction with
relatively larger contraction or expansion and ‘YD’ is the other Poisson direction). The
measured (after testing) and calculated R-ratios are listed in Table 5-3. Note that since
two compression samples were tested for each test direction with different amounts of
total strain, the experimental R-ratios in the table refer to those measured on the sample
with the total strain close to that used in the calculation. It is shown in the table that both
the magnitudes of R-ratios and the general trend across each case are well reproduced.
136

Table 5-3. Experimental and calculated Lankford coefficients
Tens. ND Tens. TD Tens. RD Comp. ND Comp. TD Comp. RD
TDRD εε : NDRD εε : NDTD εε : TDRD εε : NDRD εε : NDTD εε :
Cal. 1.05 3.08 2.78 1.04 2.04 1.69
Exp. 1.13 3.46 2.61 1.01 2.29 1.42
5.4.2 Lattice strain evolution
This section compares the calculated evolution of lattice strain to the previously
reported experimental data. The lattice strain evolution for most diffraction peaks is
characterized by several inflections, reflecting the changes in the load sharing among
different orientations as different deformation modes activate. Each inflection in the
lattice strain evolution can be correlated with the changes in the relative activities of the
deformation modes during deformation. A family of grains are grain orientations
having their {hkil} normals aligned so that they diffract in the same direction, and these
normals are termed as ‘{hkil} orientations’ or ‘{hkil} grains’. Note that the equivalent
averages were extracted from the model. Orientations which give diffraction peaks
corresponding to planes whose normals exhibit a high (or low) elastic modulus will be
termed elastically ‘stiff’ (or ‘compliant’) orientations, while those that deform at applied
stresses corresponding to the activation of slip systems having a high (or low) CRSS in
the plastic regime will be termed plastically ‘hard’ (or ‘soft’) orientations. Here, ‘XD/YD’
is defined as the case of loading axis parallel to ‘XD’ measurement parallel to ‘YD’, e.g.,
‘TD/ND’ refers to loading along TD and measurement along ND.
5.4.2.1 Compression along ND
Fig. 5-2a-c compare the lattice strain development to the experiments for
137
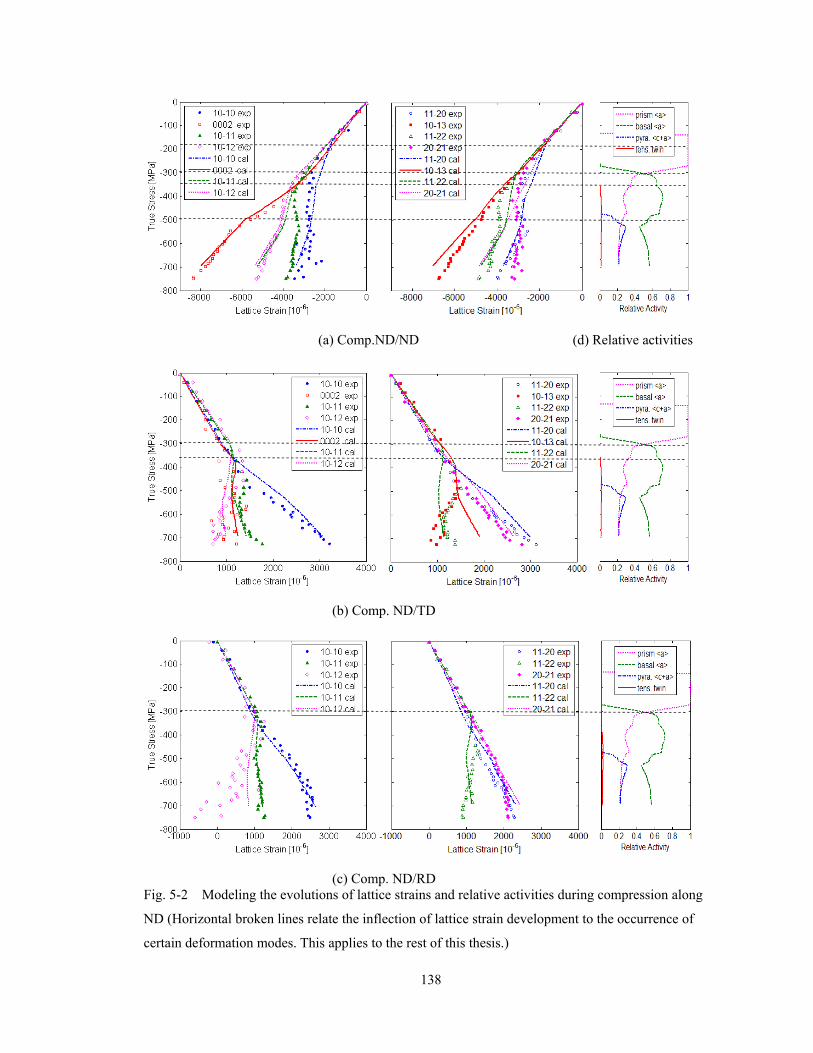
(a) Comp.ND/ND (d) Relative activities
(b) Comp. ND/TD
(c) Comp. ND/RD Fig. 5-2 Modeling the evolutions of lattice strains and relative activities during compression along
ND (Horizontal broken lines relate the inflection of lattice strain development to the occurrence of
certain deformation modes. This applies to the rest of this thesis.)
138

compression along ND. In the loading axis (Fig. 5-2a), the simulation is in reasonable
agreement with the experiment in terms of both trends and magnitudes, except for the
{ 1110 } and { 1220 } orientations whose lattice strains are overestimated in the plastic
regime. For { 0110 }, (0002), { 2110 } and { 0211 }, the lattice strains are very well
predicted. Several important inflections are also captured: e.g. the micro-yielding in the
{ 0110 } and { 0211 } grains at -180MPa, the yielding in the { 2211 } grains at -300MPa,
the departure from linearity for { 1110 } and { 2110 } at -360MPa, and the yielding of the
hardest (0002) grains at -500MPa. Plotting the corresponding evolution of the relative
activities of the deformation modes (Fig. 5-2d), it is clear that the first inflection is
induced by the activation of prism <a> slip, the second is a result of the significant
activity of basal <a> slip, the third takes place because of the changes in the relative
activities of the prism and the basal slip, and the final one is caused by the appearance of
pyr<c+a> slip. Recalling the flow curve (Fig. 5-1a), it is found that the fourth inflection
coincides with significant macroscopic yielding. Thus pyr<c+a> slip is very likely the
major mechanism governing the phenomenological strain-stress relationship. It is noted
that tensile twinning during the deformation is almost negligible, which is consistent with
the related conclusions drawn in Chapter 3. Note that the activity shown is relative, and
thus always sums to one. The average number of slip systems operating in a grain will
change as deformation progresses, starting from a very small number (as only a few
grains deform plastically), and reaching a value of around 3.3 once large scale plasticity
is occurring.
In the two Poisson directions, reasonable agreement between predictions and
experiments is also achieved (Fig. 5-2b and 5-2c). One should remember that in ND/TD
139

the comparison can be made only after considering that the sample measured
concurrently in ND and TD has a yield strength ~70MPa higher than the sample
measured concurrently in ND and RD. The inflections at -300MPa with the { 1110 },
{ 2110 } and { 2211 } curves in ND/TD and ND/RD are interpreted as the strong activity of
basal slip. Since tensile twinning is negligible, the inflections with the { 3110 } and (0002)
strains at -360MPa in ND/TD are ascribed to the dramatic changes in the activities of the
prism and basal slip.
5.4.2.2 Compression along TD
Predicted lattice strains for compression along TD are compared with experimental
results in Fig. 5-3. Along the loading axis (Fig. 5-3a), the prism orientations yield first
at -230MPa. Such yielding is correctly reproduced by the model, and corresponds to the
dominant activity of prism <a> slip. Significant load partitioning takes place later at
-320MPa, and is associated with the noted increase in the basal slip activity. Tensile
twinning was considered in Chapter 3 as the major mechanism causing the two
inflections of the (0002) strain (i.e. one at -377MPa and the other at -430MPa). The
simulation predicts well the significant activity of tensile twinning at stresses over
-377MPa. However, it fails to capture the two rapid changes in the (0002) strain,
although at -377MPa the strain is predicted to be relaxed by a small amount. A similar
failure to reproduce the inflection at -377MPa is found for the { 0211 } response. This
inflection is believed to be a result of the requirement for stress balance to the rapid
decrease in the (0002) strain. Perpendicular to the loading axis (Fig. 5-3b and 3c), the
calculated strain development below -377MPa is in reasonable agreement with the
experiment. Beyond that, in TD/ND, the { 0110 }, { 1110 }, { 0211 }, { 3110 } and { 1220 }
140

(a) Comp. TD/TD (d) Relative activities
(b) Comp. TD/ND
(c) Comp. TD/RD
Fig. 5-3 Modeling the evolutions of lattice strains and relative activities during compression along
TD
141

strains are predicted reasonably, while for other peaks the agreement is far from
satisfactory; in TD/RD, the model only predicts well for the low-order peaks { 0110 },
{ 0211 } and { 1220 }. The reduced agreement after -377MPa is attributed to the
inadequacies of the twinning model in the EPSC program. The inflections at -320MPa
and -377MPa in the Poisson directions can again be connected with the occurrence of
basal slip and tensile twinning, respectively. There is also a very slight inflection in the
predicted prism strains at -260MPa in TD/ND and at –220MPa in TD/RD, indicating the
occurrence of micro-yielding which is induced by the prism slip, although such yielding
is not clearly observed experimentally. Correspondingly, the harder grains { 2110 } and
{ 3110 } share a greater portion of the load due to the relatively small volume fractions of
these grains that are present.
5.4.2.3 Compression along RD
Compression along RD produces three inflections in the lattice strains in RD/RD, Fig.
5-4a. Again the first inflection, i.e. the deviation from linearity of the prism strains at
-250MPa, is well predicted and can be ascribed to the occurrence of prism slip. The
second inflection at -340MPa is with the { 1110 }, { 2110 } and { 2211 } curves, which may
be caused by basal <a> slip, rather than by tensile twinning since the twinning activity is
still very low at this stress level. A third inflection appears at -370MPa in the (0002),
{ 1110 } and { 2211 } curves. With the (0002) response, the inflection is caused by the
tensile twinning inducing stress relaxation. With the other two curves, the inflection is,
however, believed to be a result of the considerable basal slip activity. The model does
predict strong twinning activity after -370MPa. For the lattice strain evolution, with the
exception of the basal poles, the calculation is in good agreement with the experiment,
142

(a) Comp. RD/RD (d) Relative activities
(b) Comp. RD/TD
(c) Comp. RD/ND
Fig. 5-4 Modeling the evolutions of lattice strains and relative activities during compression along
RD
143

although the magnitudes of the { 1110 } and { 1220 } strains are overestimated in the model.
In RD/TD (Fig. 5-4b), the model predicts well the { 0110 }, { 1110 }, { 0211 }, { 2211 } and
{ 1220 } peaks before significant twins appear. After that, only the general trends in the
lattice strain development can be said to be captured. Surprisingly, the { 2211 } and
{ 1220 } strains are very well reproduced even after the twinning occurs. In RD/ND (Fig.
5-4c), good agreement can be found in the elastic regime; beyond that only the general
trends are predicted. However, the { 3110 } strain is well reproduced in both elastic and
plastic regimes, which may be due to its relatively lower uncertainties and the small
influence of twinning on its strain development. Since the development of { 2211 } and
{ 1220 } strains in RD/TD and the { 3110 } strain in RD/ND are reproduced very well, it is
deduced that the dramatic changes in lattice strain with most orientations in the Poisson
directions are not likely due to grain reorientations caused by the changes in the shape of
the cross section. Micro-yielding in the prism grains in RD/TD and RD/ND is
suggested by the model as occurring at -250MPa, corresponding to inflections for most of
the diffraction peak strains. In RD/ND, inflections in the prism and { 3110 } strains at
-360MPa are caused by basal slip, while the inflections for most peaks at -400MPa result
from interactions among the <a> dislocations, as will be clear in Section 5.5.4.
However, the inflection of the (0002) curve at this stress level is most likely induced by
tensile twinning. Similar explanations can be applied to the inflections in RD/TD, i.e. that
inflections occurring in most peaks at -400MPa are due to dislocation interactions, and
the inflection in the (0002) strain at -320MPa is caused by the twinning.
5.4.2.4 Tension along RD
As shown in Fig. 5-5, tension along RD is mostly accommodated by prism and basal
144

(a) Tens.RD/RD (d) Relative activity
(b) Tens.RD/ND
(c) Tens.RD/TD
Fig. 5-5 Modeling the evolutions of lattice strains and relative activities during tension along RD
145
slip. Very little <c+a> slip is predicted at high stresses over 420MPa, and almost no
tensile twinning is predicted. Apparently, prism <a> slip is responsible for the first
evidence of load repartitioning in the loading direction (Fig. 5-5a) at 180MPa in { 2211 },
as revealed by the modeling. The model predicts a slightly later onset for the low-order
orientations { 0220 }, { 0211 } and { 1220 } yielding at 200MPa. The earlier load
partitioning to { 2211 } grains is because of insufficient resistance provided by the low
number of hard grains (e.g. { 2211 } in this case). As the simulation shows, once the
applied stress is increased to 270MPa, basal slip becomes quite active and the { 2211 }
grains yield and thus the { 2211 } strain is reduced. In the Poisson directions (Fig. 5-5b
and 5c), the development of the lattice strain in the basal orientations is reasonably well
captured, while the strains of the lower-order orientations are under-predicted at stresses
higher than 330MPa, although, the positive shifts of the lattice strains are correctly
reproduced. Prism <a> slip controls micro-yielding (at 180MPa in RD/ND and 190MPa
in RD/TD) of the { 0220 }, { 0211 } and { 1220 } grains, while the basal slip plays an
important role at a higher stress (270MPa) in the dramatic load redistribution between the
basal and the lower-order orientations. In RD/TD, the (0002) grains are predicted to yield
at 430MPa, corresponding to the commencement of <c+a> slip, although experimental
evidence for this is not apparent.
5.4.2.5 Tension along TD
Compared to the tensile deformation along RD, tension along TD also activates
mostly prism <a> and basal <a> slip, but a little more tensile twinning, Fig. 5-6d, due to
the slightly different distribution of basal poles. The lattice strain evolution in TD/TD is
similar to that in RD/RD, although the inflections appear at higher stresses due to the
146

(a) Tens.TD/TD (d) Relative activity
(b) Tens.TD/ND
(c) Tens.TD/RD
Fig. 5-6 Modeling the evolutions of lattice strains and relative activities during tension along TD
147

bulk texture. The prediction agrees reasonably well with the experiment, Fig. 5-6a.
Perpendicular to the loading direction (Fig. 5-6b and 6c), the (0002) strain in TD/ND and
{ 1220 } strain in TD/RD are very well reproduced, while for other peaks only the general
trends are roughly captured. In TD/TD and TD/ND, inflections are found at 245MPa and
300MPa, and again due to the operation of prism <a> slip and basal <a> slip, respectively.
In TD/RD, only the inflection at 300MPa is observed. The role of tensile twinning is
not revealed because the basal lattice strain was not measured due to beam time
limitations.
5.4.2.6 Tension along ND
As revealed by the simulation (Fig. 5-7), tension along ND differs from tension along
TD and along RD in that it causes very different relative activities of deformation modes,
with prism <a> slip dominating only under 370MPa. Beyond that basal <a> slip and
tensile twinning (especially tensile twinning) become the dominant mechanisms,
although the absolute activity of prism slip keeps increasing due to the increasing total
activity, Fig. 5-8. In Tens.ND/ND (Fig. 5-7a), the model well captures the lattice strain
evolution at stresses below 450MPa. The first inflection at 290MPa in the { 0211 } curve
(or the micro-yielding of the { 0211 } grains) is caused by prism slip. Later, at 370MPa,
the (0002) strain stops increasing due to the operation of tensile twinning. The { 2211 }
curve shows an inflection at 400MPa that is caused by the considerable basal slip activity.
Starting from 450MPa, all the peaks begin to accumulate positive lattice strains at a
higher rate. The inflections at this stress level are captured by the model but the
increasing rates with the (0002) and { 2211 } strains are underestimated. The inflections
at 450MPa are triggered by different mechanisms: with the (0002) curve the inflection is
148

(a) Tens.ND/ND (d) Relative activity
(b) Tens.ND/TD
(c) Tens.ND/RD
Fig. 5-7 Modeling the evolutions of lattice strains and relative activities during tension along ND
149

(b) (c) (a)
Fig. 5-8 Lattice strains (a), relative activity (b) and absolute activity (c) during tension
along ND
probably induced by the hardening of tensile twinning, while for others it is ascribed to
the hardening of the prism and basal slip.
In ND/RD and ND/TD (Fig. 5-7b and 7c, respectively), the lattice strain evolution is
well predicted except for the { 1220 } in ND/TD. Inflections at two stress levels are
observed: at 350MPa in ND/TD and 400MPa in ND/RD with the prism orientations, and
440MPa in both ND/TD and ND/RD with the basal orientations. The inflection at the
low stress level is caused by prism slip. At 440MPa, the inflection (the rapid build up in
the lattice strain of the basal orientation) is believed to be a direct response to the load
partitioning that is caused by the yielding in some of the pyramidal orientations. Thus,
this inflection is also related to the significant activity of basal slip.
5.5 Discussion
5.5.1 Activities of the deformation modes
Comparing the simulations for compression along the three directions, it can be seen
that the agreement between model and experiment roughly varies according to the
150

relative activity of tensile twinning, i.e. that simulations for compression along ND are
the most successful (where only negligible twinning takes place), followed by those
along TD and along RD, in a sequence of increasing relative activities of tensile twinning.
It can therefore be concluded that while the model deals well with the complexities of
multiple slip modes, there is still room for the improvement in the handling of twinning
in the model. It is also seen that the agreement in the loading direction is generally
better than that in the Poisson directions; this is a common observation in such tests and
some possible reasons are discussed in [23].
The trend of the predicted relative activities is reasonable. Prism <a> slip is always
the primary mode, while basal <a> slip is the next. Compression along ND activates
significant pyr<c+a> slip, while compression along TD and RD triggers very little
pyr<c+a> slip. In contrast, the twinning activity is barely present during compression
along ND, but is significant when compression is along TD and RD. During tension
along ND, tensile twinning is highly active, while it is a much smaller contribution to the
deformation during tension along TD, and is almost negligible for tension along RD.
However, in Tens.ND one would expect an over-prediction of the level of tensile
twinning activity (i.e. the ~40% of the total deformation predicted to be accommodated
by twinning, Fig. 5-7, at the early stages of its activation is likely too high). There are
two reasons for this. First, the model does not account for relaxation in the parent
orientations once twinning occurs [24], hence the shear stress on the twin planes of
suitably oriented grains will remain high and continued twinning will be predicted.
Second, the model does not represent the change in orientation associated with twinning,
i.e., the provision with the twinned crystals of regions that are now favourably oriented
151

for slip. This highlights a significant deficiency in the current version of EPSC.
In Section 5.4.2, most of the inflections in the lattice strain development were
correlated to the activities of individual deformation modes. However, the initial stage
of the operation of a deformation mode is usually predicated to occur at a slightly smaller
magnitude of applied stress than the actually observed lattice strain inflection. Here an
explanation for such a difference is offered. It is emphasized that the measured and
calculated lattice strain is the average response of a grain family whose orientation satisfy
the Bragg’s law. In neutron diffraction measurements, the diffraction angle usually
subtends a few degrees off the nominal orientation (roughly ±6.5° at ISIS and ±0.5° at
CRL) in order to obtain improved counting statistics. Thus, in reality, even in one grain
family, the response of individual grains will be different. Those grains having more
favorable orientation to deform will respond earlier to the applied stress. Since such
grains may account for only a small portion in the whole family, they may not exert
enough influence on the averaged response (i.e. the measured lattice strain). It is
therefore reasonable to model a small amount of activity at a stress level where there is
no observed inflection in lattice strain, i.e., at a stress level where the absolute activity is
too small to cause an inflection, see Fig. 5-8 as an example (note that in Fig. 5-8b, it is
relative activity that is plotted, which is by definition 100% when only one slip system is
operating).
5.5.2 Micro-yielding
From the modeling results shown in Section 5.4.2, it can be seen that micro-yielding
in the prism grains does not necessarily happen at the same stress in the three directions
when the material is deformed. For example, during tension along RD, the prism grains
152

yield at 180MPa in RD/ND, while they yield at 190MPa in RD/TD and at 200MPa in
RD/RD. Of course, the grains which are ‘prism’ in the three plate directions belong to
different specific grains in the polycrystal. Thus in different directions, the number of
the prism grains and the constraints imposed on them are different. Thus the
micro-yielding in the grains does not necessarily occur at the same applied stress,
although generally such differences are not very large. Similar explanations are
applicable to the different micro-yielding in the three directions for the pyramidal
orientations (e.g. { 2211 }), caused by basal slip.
5.5.3 Roles of prism <a> and basal <a> slip
The simulations also show that prism <a> slip usually controls the micro-yielding in
the prism and { 1220 } grains, while basal <a> slip has a strong influence on the yielding
of the pyramidal { 1110 }, { 2110 }, { 3110 } and { 2211 } grains. The occurrence of prism
slip and basal slip usually lead to a typical pattern of load partitioning as schematically
shown in Fig. 5-9. In region A in the figure, prism <a> slip causes micro-yielding in the
prism grains, thus more load is shed onto the pyramidal and/or basal grains. However, the
Lattice Strain
basal
‘A’
‘B’
prism grains
pyramidal grains
grains
Com
pres
sive
Tru
e St
ress
Fig. 5-9 Schematic load partitioning among the prism, pyramidal and basal grains
153

first inflection can occur in the lattice strain of the prism grains, or in the strain of the
pyramidal and/or basal grains, depending on the relative elastic moduli and the relative
numbers of grains present (i.e., the texture). In region B, basal <a> slip takes place and
causes micro-yielding in the pyramidal grains. Thus much more load needs to be shared
by the grains oriented with the basal pole parallel to the applied load, and a dramatic load
repartitioning can be observed between the basal and the other orientations. In the rolling
direction where very few basal grains are distributed, the less hard grains (relative to the
basal grains) such as { 3110 }, { 2110 } and { 2211 } grains take the role of the basal grains.
5.5.4 Influence of latent hardening
Interactions between dislocations on the prism planes [e.g. 25], and between twins
and prism slip [e.g. 26], have been observed experimentally in the high purity single
α-phase Zr. The work-hardening due to dislocation interactions requires complex
treatment in any plasticity models. Current EPSC model provides latent hardening
parameters (see Equation 5.3) to empirically account for such hardening effects.
Unfortunately, few studies have considered them due to the modeling complexity arising
from the large number of the parameters that are introduced, as well as the requirement of
a very large experimental data set in order to provide unambiguous values for the
parameters.
Latent hardening has been included in present simulations to improve the agreement
between the model and experiment. In this study, it was found that the parameters hpr/pr,
hbas/pr, hpr/bas, hbas/bas, hpr/tt and hbas/tt play a very important role in the modeling results,
indicating there are strong interactions among the <a> dislocations (e.g. prism <a> and
154

basal <a>) and the barrier effects that the twinned volumes pose onto <a> dislocations:
such interactions have a far greater influence in compression along TD and along RD
than along ND. The calculated effect of pyr<c+a> slip on other slip systems was found
negligible except in the case of compression along ND. In other cases, the model
predicts that <c+a> slip is almost inactive.
The importance of considering anisotropic latent hardening can be recognized after
comparing the modeling results without taking it into account to those shown in Section
5.4.2. Fig. 5-10a,b present the lattice strain simulations for compression along TD,
assuming isotropic latent hardening. In contrast to the lattice strain evolution shown in
Fig. 5-3b,c, the { 2110 }, { 2211 } and { 3110 } lattice strains in TD/ND do not turn to
increase beyond -400MPa, resulting in poorer agreement with the experiment. Even
worse agreement is found if anisotropic latent hardening is not incorporated for the cases
RD/ND and RD/TD (Fig. 5-11a and 11b, respectively): the lattice strains for all the peaks
develop in a completely different manner from the experiments beyond -370MPa. In
comparison, the agreement shown in Fig. 5-4b and 4c is significantly improved. Latent
hardening also has a strong effect on the calculated Lankford coefficients. As shown in
Table 5-4, the predicted coefficients for compression along RD and TD clearly differ
greatly from the experimental values when appropriate latent hardening parameters are
not used.
In Chapter 3, it was found that during compression, when the measurement is taken
in the Poisson directions, the spread of lattice strains are much smaller than that measured
in the loading direction. The opposite is true in tension. Interestingly, when anisotropic
latent hardening is accounted for in the modeling, the calculated spreads in the Poisson
155

(a) Comp.TD/ND
(b) Comp.TD/RD Fig. 5-10 Modeling of the lattice strain evolution during compression
along TD without considerations of latent hardening effects
(a) Comp.RD/ND
(b) Comp.RD/TD
Fig. 5-11 Modeling of the lattice strain evolution during compression
along RD without considerations of latent hardening effects
156

Table 5-4. Lankford coefficients derived with or without considerations of
anisotropic latent hardening
Tens.ND Tens.TD Tens.RD Comp.ND Comp.TD Comp.RD
TDRD εε :
NDRD εε :
NDTD εε :
TDRD εε : NDRD εε : NDTD εε :
Cal. iso-LH 1.05 3.07 2.68 1.05 4.09 2.71
Cal. aniso-LH 1.05 3.08 2.78 1.04 2.04 1.69
Experimental 1.13 3.46 2.61 1.01 2.29 1.42
* ‘iso-LH’: considering isotropic latent hardening effects (i.e. all h values are 1.0)
‘aniso-LH’: considering anisotropic latent hardening effects (h-values are listed in Table 5-2).
directions for compression along RD and TD are much smaller than those calculated with
isotropic latent hardening. Thus it is reasonable to suggest that latent hardening
contributes in part to the discrepancy in spread. As the comparison shows, latent
hardening also contributes in part to the dramatic lattice strain changes in the Poisson
directions, i.e. the inflections at -377MPa for compression along TD and at -370MPa for
compression along RD.
5.5.5 Other possible deformation mechanisms
This chapter has assumed the presence of prism <a> slip, basal <a> slip, pyr<c+a>
slip and tensile twinning. The derived CRSSs for the deformation modes, however, may
not be the correct physical ones if they have represented some components of other
possible modes. For example, there is no published microstructural evidence (see Section
2.2, Chapter 2) of the existence of pyramidal <a> slip, { 1110 }< 0211 >, at room
temperature, nor is it necessary to invoke pyramidal <a> slip to satisfactorily fit the
current data. However, the possibility of its existence cannot be ruled out based on the
157

model, since a systematic study on the effects of slip modes on lattice strain evolution
will be shown that the influence of pyramidal <a> may be effectively represented by a
combination of prism <a> and basal <a> slip (will be discussed in Chapter 6).
Interestingly, Agnew et. al have reached a similar conclusion in studying the plastic
deformation of an hcp Mg alloy [27], though in Mg alloys basal <a> slip, instead of
prism <a> slip, is the primary deformation mode. Further, since twinning is a
competing mode with the <c+a> slip in accommodating the strain along c-axis, CRSS for
twinning as derived in this chapter may also represent some component of <c+a> slip.
5.6 Conclusion
An elasto-plastic self-consistent polycrystalline plasticity model was used to interpret
the development of lattice strain in a Zircaloy-2 polycrystal with moderate rolling texture.
The parameters for modeling were derived by fitting to the macroscopic flow curves and
lattice strain evolution, where the lattice strains were measured using neutron diffraction
in the three principal plate directions, with loading also carried out in the three plate
directions. In particular, the effect of dislocation interactions between slip modes was
found to be important and was accounted for in the model. In the simulations basal slip
usually controls a significant load partitioning event during the elasto-plastic transition
and its initiation coincides with macroscopic yielding during deformation along TD and
RD. In tension along ND, tensile twinning takes this role. In compression along ND,
pyr<c+a> slip coincides with macroscopic yielding, while basal slip still takes a role in
the load partitioning. Although the model requires tensile twinning activity to help
account for the strength differential and asymmetrical lattice strain development, the
158

159
calculated lattice strain relaxation in the basal orientations is insufficient, demonstrating
the need for improvements to the twinning model.
References
[1] U.F. Kocks, C.N. Tomé and H.-R. Wenk, Texture and Anisotrpy, Preferred Orientations in
Polycrystals and their Effects on Materials Properties, Cambridge University Press (2000)
[2] D. Lee, J. Nucl. Mater. 37 (1970) 159-170
[3] F. Xu, R.A. Holt, R.B. Rogge and M.R. Daymond, Proc. 26th Annual Canadian Nuclear
Society Conference, Paper T72 (2005), Appendix B
[4] F. Xu, R.A. Holt, D. Durance and M.R. Daymond, Proc. 27th Annual Canadian Nuclear
Society Conference, Paper T42 (2006), Appendix C
[5] I.A. Yakubtsov, unpublished data, Queen’s university (2006)
[6] P.A. Turner and C.N. Tomé, Acta Metall. 42 (1994) 4143-4153
[7] C.N. Tomé, G.R. Canova, U.F. Kocks, N. Christodoulou and J.J. Jonas, Acta Metall. 32 (1984)
1637-1653
[8] C.N. Tomé and E.C. Oliver, The EPSC User’s Manual (2002)
[9] E.S. Fischer and C.J. Renken, Phys. Rev. A135 (1964) 482-494
[10] J. Goldak, L.T. Lloyd and C.S. Barret, Phys. Rev. 144 (1966) 478-484
[11] J.W.L. Pang, T.M. Holden, P.A. Turner and T.E. Mason, Acta Mater. 47 (1999) 373-383
[12] S.R. MacEwen, C. Tomé and J. Faber, Acta Metall. 37 (1989) 979-989
[13] S.R. MacEwen, N. Christodoulou, C. N. Tomé, J. Jackman, T.M. Holden, in J.S. Kallend and
G. Gottstein (eds.), Proc. 8th Int. Conf. on Texture of Materials, The Metallurgical Society,
Warrendale, PA, (1988) 825-836
[14] N. Christodoulou, Acta Metall. 37 (1989) 529-539
[15] P.A. Turner, N. Christodoulou and C.N. Tomé, Int. J. Plast. 11 (1995) 251-265

160
[16] T.M. Holden, J.H. Root, R.A. Holt and P.A. Turner, J. Nucl. Mater. 304 (2002) 73-82
[17] O. Castelnau, H. Francillette, B. Bacroix and R.A. Lebensohn, J. Nucl. Mater. 297 (2000)
14-26
[18] H. Francillette, B. Bacroix, M. Gasperini and J.L. Bechade, Acta Mater. 46 (1998)
4131-4142
[19] C. N. Tomé, N. Christodoulou, P.A. Turner, M.A. Miller, C.H. Woo, J. Root and T.M.
Holden, J. Nucl. Mater. 227 (1996) 237-250
[20] D. Gloaguen, M. François, R. Guillén and J. Royer, Acta Mater. 50 (2002) 871-880
[21] D. Gloaguen, M. François and R. Guillén, J. Appl. Cryst. 37 (2004) 934-940
[22] D. Gloaguen, T. Berchi, E. Girard and R. Guillén, Acta Mater. 55 (2007) 4369-4379
[23] E.C. Oliver, M.R. Daymond and P.J. Withers, Acta Mater. 52 (2004) 1937-1951
[24] R. Zhang, M.R. Daymond and R.A. Holt, Mater. Sci. Eng. A (2007), doi:10.1016/j.msea.
2007.04. 021, in press.
[25] L.M. Howe, J.L. Whitton and J.F. McGurn, Acta Metall. 10 (1962) 773-787
[26] G.C. Kaschner, C.N. Tomé, R.J. McCabe, A. Misra, S.C. Vogel and D.W. Brown, Mater. Sci.
Eng. A 463 (2007) 122-127
[27] S.R. Agnew, D.W. Brown and C.N. Tomé, Acta Mater. 54 (2006) 4841-4852

Chapter 6
Evidence for Basal <a> slip in Zircaloy-2 at Room Temperature from Polycrystalline Modeling
Polycrystalline modeling has been used to interpret the evolution of lattice strain and
texture in zirconium based alloys. Challenges in matching model and experimental
results have mainly arisen from an insufficient knowledge of intrinsic deformation
mechanisms (slip and twinning). Specifically, there is little concrete evidence that basal
<a> slip occurs during room-temperature deformation or whether pyramidal <a> slip is
an alternate mechanism. Also, the critical resolved shear stresses (CRSSs) for slip and
twinning modes relevant to polycrystals are not well established.
This study developed an understanding of the contribution of basal <a> slip to
deformation by applying an elasto-plastic self-consistent model to an extensive
experimental database, obtained by neutron diffraction measurements on textured
Zircaloy-2. By considering a variety of slip mode combinations, the roles of each slip
mode in lattice strain development were investigated. Parameters for the model were
obtained by best fitting to a large experimental database, including both macroscopic data
(flow curves and Lankford coefficients) and microscopic internal strain data. Based on
optimized agreement between model and experimental data it was concluded that there
was evidence that basal slip does occur, while the effects which might be attributed to
pyramidal <a> slip can be represented by the influence of other combinations of slip
modes. Reasonable ranges of initial CRSSs for each slip mode were proposed, which
should benefit the modeling of similar materials (e.g. Zircaloy-4).
161

6.1 Introduction
Zirconium and its alloys are characterized by pronounced mechanical anisotropy,
which originates from the anisotropic single crystal hcp structure and bulk
crystallographic texture. This anisotropy is manifest in the thermal expansion
coefficients, elastic moduli, and plastic properties, i.e. different critical resolved shear
stresses (CRSSs), and hardening behavior for different slip and twinning modes. The
plastic deformation mechanisms observed in Zr and its various alloys [1] include slip in
<a> direction: }0110{ < 0211 > prism slip (pr), {0001}< 0211 > basal slip (bas) and
}1110{ < 0211 > pyramidal slip (pya); slip in <c+a> direction: }1110{ < 3211 > 1st-order
pyramidal slip (pyca) and }1211{ < 3211 > 2nd-order pyramidal slip; tensile twinning:
}2110{ < 1110 > (tt) and }1211{ < 6211 >; and compression twinning: }2211{ < 3211 >
and }1110{ < 2110 >. Prism slip is the most easily activated (i.e. has the lowest CRSS)
and is always present when a polycrystal is deformed regardless of deformation
conditions. Other deformation modes are activated only under specific circumstances,
i.e. combinations of temperature and stress sense relative to the bulk texture. For
example, tensile twinning is activated only when the <c>-axis of a particular crystal is
placed under tension.
There is general agreement in the literature that deformation of Zr and its alloys
at room temperature is accommodated by prism <a> slip, 1st-order pyramidal <c+a> slip
and }2110{ < 1110 > tensile twinning. The experimental evidence, derived from
single-trace methods [2] or transmission electron microscopy (TEM) observations, has
been well documented for the presence of prism slip [3,4,5] and pyramidal <c+a> slip
162

[6,7,8], as well as tensile twinning [4,9,10]. Prism slip always activates first with
increasing applied stress. As a higher stress is applied, the <a> dislocations accumulate,
forming local stress concentrations where it is possible for cross-slip to operate.
Cross-slip of the <a> dislocations is a likely mechanism for the initiation of basal slip
and/or pyramidal <a> slip. McCabe et al. [
11] suggested that the cross-slip of <a>
dislocations on prism planes may result in <a> slip on basal or pyramidal planes, during
room-temperature compression of high-purity polycrystal Zr. Philippe et al. [12] also
noticed the cross-slip of <a> dislocations onto basal or pyramidal planes during cold
rolling of nuclear quality Zr. However, there is little conclusive experimental evidence
of the presence of basal and pyramidal <a> slip to date, principally due to the difficulty in
unambiguously identifying the slip plane by TEM observations. Slip markings
belonging to (or close to) basal traces have been discovered in 1) single crystal Zr
(99.8-99.9 wt%) in regions of stress concentration at room temperature[13], 2) single
crystal Zr at elevated temperatures [14], 3) commercial grade Zr near hydride particles
[5], 4) hydrides in Zircaloy-2 with ~17ppm H at temperatures significantly below 573K
[15], 5) irradiated Zircaloy [16] and 6) polycrystal Zr at elevated temperatures during
kink formation [17]. In brief, there is no direct evidence for basal slip in polycrystal Zr
alloys at room temperature, but there is evidence for basal slip under other circumstances.
There is no convincing published evidence for pyramidal <a> slip under any
circumstances. Pyramidal <a> slip was claimed to be found in a document cited by
Philippe et al. [18], but that document was not published. Fregonese et al. [19] claimed
to have observed pyramidal <a> slip at 623K, close to the grain boundaries. However,
from the only evidence they provided, i.e. the transmission electron microscopy picture –
163
Fig. 4b in [19], the dislocations are mainly in screw orientation, thus it is hard to
dete
perimental data, though none of them
had
a single crystal due to the interactions of the dislocations with grain
ilable elsewhere
rmine what the slip plane is.
The inclusion of basal slip in the polycrystalline modeling (e.g. elasto-plastic [20]
and visco-plastic self-consistent [21] models) has been found to improve the ability to
reproduce experimental macroscopic flow curves [22] and bulk texture development
[23,24,25] caused by plastic deformation. However, other researchers [16,26,27,28]
have instead preferred to include pyramidal <a> slip as an alternative to basal slip in
order to achieve optimal agreement with their ex
observed pyramidal <a> slip experimentally.
The lack of sufficient knowledge regarding values of CRSSs appropriate for
deformation modes also constitutes a difficulty for performing polycrystalline modeling.
Practically, CRSSs must be derived indirectly through polycrystalline modeling using an
‘inverse approach’ [29], since the manufacture of single crystals of many alloys to allow
measurement of the CRSSs is either very difficult or in some cases impossible. Further,
the observed CRSSs required for model fitting in a polycrystal will be different from
those found in
boundaries.
This chapter aims to provide a better understanding of the influence of basal slip and
its contribution to polycrystalline plasticity. Through in-situ tension and compression
tests in neutron spectrometers, an extensive experimental data set was obtained. The data
include both stress-strain curves and internal lattice strain development along the three
principal directions of a textured Zircaloy-2 slab. This data set, which has been reported
in full in Chapter 4, represents a far more extensive data set than that ava
164

in th
provided, which may be helpful for the modeling of similar
aterials (e.g. Zircaloy-4).
6.2.1
e literature, and hence a more exacting test of polycrystal models.
This chapter considers a variety of combinations of deformation modes, using a
previously published elasto-plastic self-consistent model (EPSC [20]). The model
results are compared to the experimental flow curves, the Lankford coefficients (also
referred to as R-ratios), and internal lattice strain development. In particular, the
influence of basal slip is illustrated. Reasonable ranges of CRSSs for the commonly
selected slip modes are also
m
6.2 Background
Neutron diffraction measurements
In-situ neutron diffraction measurements were performed at different sites, using the
time-of-flight technique for the compression tests at the ISIS neutron source, Rutherford
Appleton Laboratory, UK, and using the constant-wavelength technique for the tensile
tests at NRU reactor, Chalk River Laboratories, Canada. The tensile test data have been
corrected to a strain rate equivalent to that used in the compression tests (Chapter 4), for
the purpose of direct comparisons. The experimental set-up for each of the neutron
diffraction techniques is described in Refs. [30] and [22]. For the time-of-flight
measurement, the sample is placed horizontally at 45° to the (horizontal) incident white
beam, with two detector banks sitting at scattering angles of ±90° . This allows a
concurrent measurement of lattice spacings in the loading direction and one of the two
Poisson directions. Two tests are needed to obtain the lattice strain development in three
principal directions. In a constant-wavelength test, only one detector is used. The
sample is positioned so that the scattering vector is parallel to either the loading direction
165

or either of the two Poisson directions. Three samples are needed for a
three-dimensional lattice strain measurement. In a neutron measurement, an
‘orientation’ comprises a family of grains with a particular plane normal lying within a
few degrees off the nominal orientation (roughly ±6.5° at ISIS and ±0.5° at NRU)
corresponding to the crystals contributing to one measurement. Note that the measured
ttice strain is the average lattice strain for an ‘orientation’.
6.2.2
orientations. A more detailed description of the model can be found
else
la
Elasto-plastic self-consistent model
The EPSC model is an Eshelby equivalent inclusion model, which deals with
interactions between Eshelby inclusions and an infinite homogeneous effective medium
(HEM) that is subject to an external load. Each inclusion represents a particular grain
orientation. The inclusions, the HEM and the interactions between them are both
elastically and plastically anisotropic and the properties of the HEM are the weighted
average properties of all the inclusions. A solution is obtained by iteration until the
response of the HEM correctly represents the overall response of the polycrystal. The
polycrystal can be textured, with grain populations being grouped into different families
according to their
where [20].
The model generates the macroscopic flow history, and as well, it produces the lattice
strain evolution for each ‘orientation’. These can be averaged for a specified family of
grains corresponding to the ‘orientations’ for which the lattice strains are measured by
neutron diffraction. This allows direct comparison with neutron diffraction data. In
addition, the model offers insights on the relative activities of individual deformation
modes and the absolute average activity of all the slip and twinning modes. The model
166

has been applied to a wide variety of materials of fcc (e.g. [30,31]), and also hcp (e.g.
[32,
rmation mode s is
represented by an extended empirical Voce hardening exp
allow
for the obstacles to deformation the mode s’ represent
for deformation of mode s [34]:
33]) structures when twinning does not make a significant contribution.
In each grain orientation, the individual deformation mode (including both slip and
twinning) is assigned with an initial CRSS, which develops as the deformation proceeds.
This hardening behavior (i.e. the development of CRSS) of each defo
ression [34]:
)]p( 1ssssss τ− /ex1)[( 0110 θθτττ Γ−Γ++= (6.1)
where sτ is the instantaneous CRSS, and ss1τ+ are the initial and final
back-extrapolated CRSS, respectively. s0θ and s
1θ are the initial and asymptotic
hardening rates, and Γ is the accumulated plastic shear in the grain. The model also
s for the possibility of ‘self’ and ‘latent’ hardening by defining coupling coefficients
ssh ′/ which empirically account
s0τ 0τ
∑′
′′ΔΓ
=Δs
ssss
s hdd γττ / (6.2)
6.2.3
Major findings in the related previous work
Chapter 5 demonstrated that a moderately strong bulk texture led to very different
deformation mechanisms operating dependent on the sense of the applied loading. It
was found that tensile twinning occurred in specimens deformed in tension along the
normal direction (Tens.ND), or in compression along the rolling direction (Comp.RD)
and transverse direction (Comp.TD) of the slab, while twinning was negligible in the
other three deformation conditions, i.e. compression along the normal direction
167
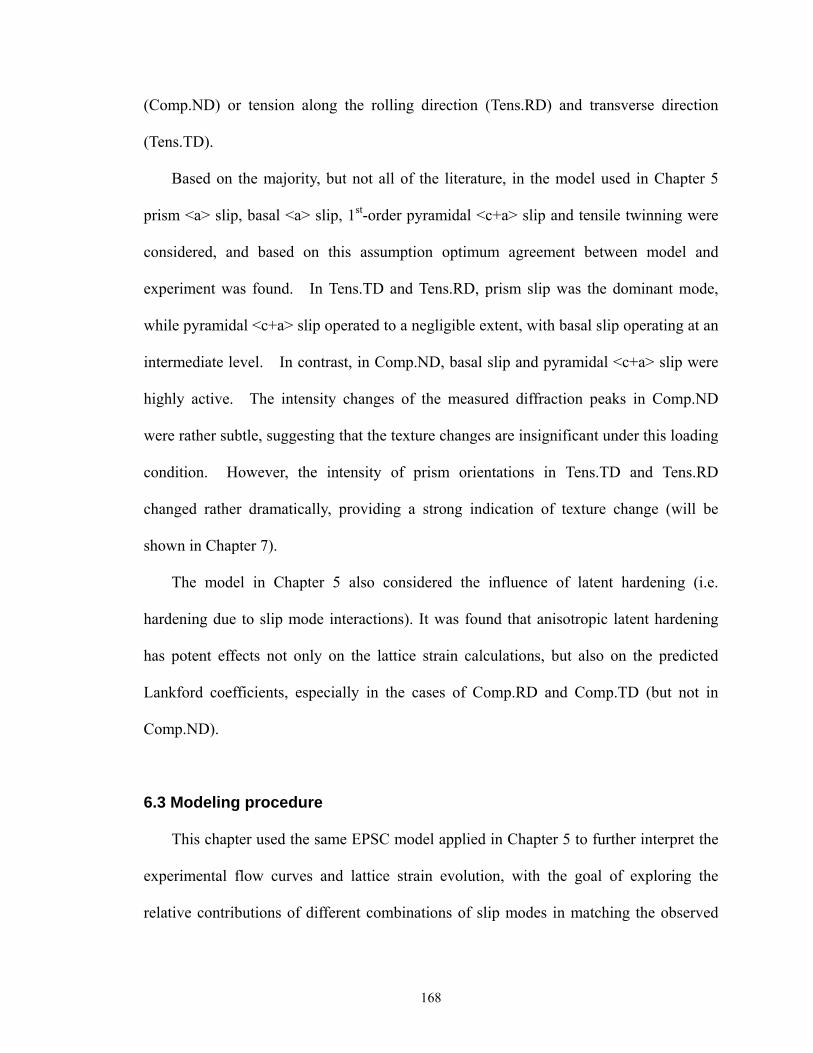
(Comp.ND) or tension along the rolling direction (Tens.RD) and transverse direction
(Ten
, providing a strong indication of texture change (will be
show
ficients, especially in the cases of Comp.RD and Comp.TD (but not in
omp.ND).
6.3
s.TD).
Based on the majority, but not all of the literature, in the model used in Chapter 5
prism <a> slip, basal <a> slip, 1st-order pyramidal <c+a> slip and tensile twinning were
considered, and based on this assumption optimum agreement between model and
experiment was found. In Tens.TD and Tens.RD, prism slip was the dominant mode,
while pyramidal <c+a> slip operated to a negligible extent, with basal slip operating at an
intermediate level. In contrast, in Comp.ND, basal slip and pyramidal <c+a> slip were
highly active. The intensity changes of the measured diffraction peaks in Comp.ND
were rather subtle, suggesting that the texture changes are insignificant under this loading
condition. However, the intensity of prism orientations in Tens.TD and Tens.RD
changed rather dramatically
n in Chapter 7).
The model in Chapter 5 also considered the influence of latent hardening (i.e.
hardening due to slip mode interactions). It was found that anisotropic latent hardening
has potent effects not only on the lattice strain calculations, but also on the predicted
Lankford coef
C
Modeling procedure
This chapter used the same EPSC model applied in Chapter 5 to further interpret the
experimental flow curves and lattice strain evolution, with the goal of exploring the
relative contributions of different combinations of slip modes in matching the observed
168

experimental data. Texture measurements [35] indicated that in the Zircaloy-2 slab
(from which tension and compression specimens were prepared), most basal grains are
initially oriented towards ND, with a few towards TD and very few towards RD. The
measured slab texture was represented using a population of 1944 suitably weighted
grains as described in Chapter 5. The principal difference between the modeling work
described in Chapter 5 and here, is that in this work the anisotropic latent hardening (i.e.
hardening due to slip mode interactions) is not considered for simplicity, since the earlier
modeling in Chapter 5 has shown that the anisotropic latent hardening has only a
marginal influence on the calculated lattice strains and R-ratios for Comp.ND.
Comp.ND is also the only loading condition that was exp
lored in which no twinning of
VI is the
ombination used in Chapter 5 that demonstrates the effect of tensile twinning.
defo co
Case prism ip basal <a> slip pyr <a> slip pyr <c p tensil twin
any types or not much texture development was observed.
To illustrate the roles of basal and pyramidal <a> slip on lattice strain evolution, five
cases with different slip mode combinations (Table 6-1) are considered. The purpose of
considering Case IV (which is not physically realistic, since prism slip is absent) is to
display the effects of prism slip by comparison with Cases III and V. Case
c
Table 6-1. Modeling cases of rmation mode mbinations
<a> sl +a> sli e I √ √ II √
√ V √ √ √ √
√ √ √
√ √ III √ √ √ IV √ √
VI √
* Case ‘VI’ was used in Chapter 5.
169

In each of the five cases (I-V), the initial CRSS and Vo rameters (i.e.
0
ce hardening pa
τ and 0θ ; linear hardening is selected for simplicity, thus 1τ = 1θ .=0 and 0θ ) are
deri
TD
ved for each slip mode in an approach described as follows.
First, the criterion is defined to test the suitability of the parameters used in the EPSC
model. On the macroscopic scale, modeling results are required to simultaneously
capture the macroscopic responses (flow curves and Lankford coefficients) for Comp.ND,
Tens.TD and Tens.RD, during which twinning is negligible. On the microscopic scale,
the results should capture the experimental lattice strain evolution during Comp.ND, both
parallel and perpendicular to the applied load (i.e. three measured data sets). One
reason of choosing only the Comp.ND data set is because the EPSC model a) does not
account for significant texture evolution (which was observed in Tens.TD and Tens.RD)
and has limited capabilities in dealing with twinning induced stress relaxation (which was
observed in the remaining data sets). Another reason is that in Comp.ND secondary slip
(slip other than the prism slip) is much more active compared to that in the loading along
or RD, since only a few orientations are favorably deformed by prism slip.
Second, compared to the values used in Chapter 5 and reported in the literature, a
wide exploratory range of initial CRSSs ( 0τ ) is set for each slip mode, in order to ensure
that any reasonable parameter combinations are not overlooked. This approach means
that a much wider data-space is explored than would be considered by, for example,
simply starting with ‘good estimates’ and carrying out a least-squares optim The
range idered in hapter are as s (in GP
ization.
s cons this c follow a): 0.06 0.16,
0.05
≤≤ pr0τ
≤≤ bas0τ 0.35, 0.05 ≤≤ pya
0τ 0.35 and 0.10 ≤≤ pyca0τ 0.40.
Finally, a large orthogonal ‘grid’ of CRSS combination within the set ranges is
170

constructed, with an initial step of 0.05GPa for each slip mode. The result obtained
using the input parameters for each ‘grid point’ is then tested for agreement with the
experimental data sets. Those ‘grid points’ resulting in reasonable agreement with
experiments are then selected as the starting points for the next round of ‘optimization’,
at which a finer step of 0.01GPa is applied, and a new grid of data points is obtained.
The ‘best fit’ parameter combinations are determined, Table 6-2.
Table 6-2. Crit d s es [G oce har aram in m
Case I Case II Case III Case IV Case V Case VI
ical resolve hear stress Pa] and V dening p eters used odeling
0τ 0θ 0τ 0θ 0τ 0θ 0τ 0θ 0τ 0θ 0τ 0θ prism <a> 0. 0.001 0. 0. 0. 08 0.08 0.01 10 06 - - 0.10 0.06 0.10 02
basal <a> - - - - 0.16 0. 0. 0.001
0. 0. 0. 0. 0. 0.
pyr<c+a> 0.18 0.80 0.32 0.60 0.32 0.80 0.34 0.80 0.33 0.80 0.32 0.40
tens. twin. - - - - - - - - - - 0.24 0.10
001 0.17 0.001 15 0.16 0.02
pyr <a> - - 12 01 - - 12 05 14 05 - -
6.4 Modeling results
6.4.1 Macroscopic behavior
The calculated macroscopic flow curves for each of the five cases are depicted in Fig.
6-1, superimposed on their experimental counterparts. For most cases the agreement
between the model and experiment is reasonable, with the exception of Cases I and IV
where no basal slip or prism slip is considered. Table 6-3 tabulates experimental and
calculated Lankford coefficients, which are defined as the ratio of contractions (or
expansions) in two Poisson directions after a specimen is pulled (or compressed). The
comparison shows good agreement with experiment if basal slip is included (Cases III,
IV and V); without it (Cases I and II) the R-ratios are too high to be correct for Tens.TD
171
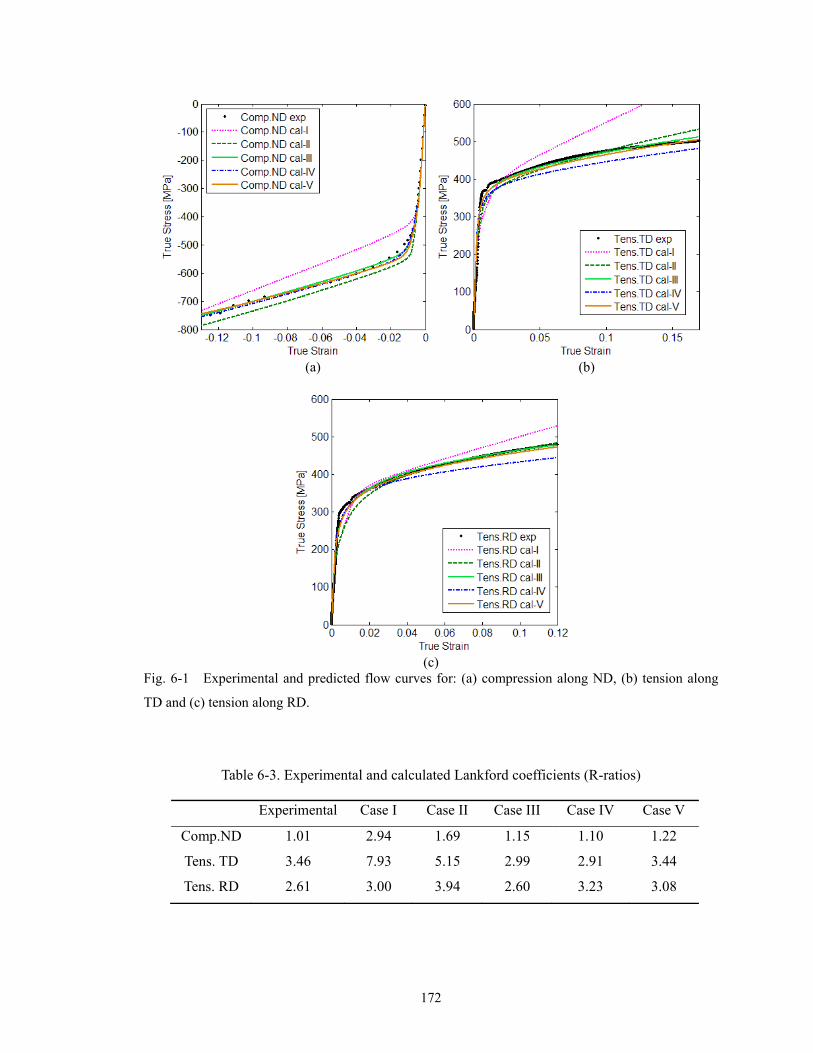
(a) (b)
(c)
Fig. 6-1 Experimental and predicted flow curves for: (a) compression along ND, (b) tension along
TD and (c) tension along RD.
Table 6-3. Experimental and calculated Lankford coefficients (R-ratios)
Experimental Case I Case II Case III Case IV Case V
Comp.ND 1.01 2.94 1.69 1.15 1.10 1.22
Tens. TD 3.46 7.93 5.15 2.99 2.91 3.44
Tens. RD 2.61 3.00 3.94 2.60 3.23 3.08
172

and Tens.RD. This is generally understood by considering the initial texture and
Schmid factors. Schmid factors are highest for basal slip in the high-order pyramidal
orientations ({ 2110 }, { 3110 } and { 2211 }), most of which are initially orientated close
to ND. Thus basal slip can effect substantial deformation along ND (the plastically
hardest direction), resulting in lower R-ratios compared to the cases where no basal slip is
included during tension along RD and TD. This is clearer in tension along TD, where
the two Poisson directions are the ‘softest’ (RD) and the ‘hardest’ (ND). The
insignificant differences in calculated flow curves and R-ratios across Cases III-V reflect
the fact that reproducing only the macroscopic behavior is not sufficient to reveal
intrinsic deformation mechanisms microscopically.
6.4.2 Lattice strain development
This section compares the predicted lattice strain development using different
combinations of slip modes (Cases I-V) to the experimental data in three directions,
which were obtained during compression along ND. The lattice strain data for some of
the diffraction peaks will be omitted for brevity (one should note that, by doing this, none
of the measured peaks was actually overlooked): 1) { 0211 } and { 1220 } (similar to that
for { 0110 }) in all the three directions, 2) { 2211 } in ND and TD (similar to that for
{ 1110 } ) and 3) (0002), { 3110 } and { 2110 } in RD (for their low intensity and
resultant large experimental errors).
6.4.2.1 Case I
In Case I (‘pr+pyca’), the general trend of lattice strains of the low-order peaks (e.g.
{ 0110 }, { 0211 } and { 1220 }) in the loading direction (Fig. 6-2a) is roughly acceptable.
This suggests that the CRSS of prism slip and its hardening are within reasonable ranges,
173

(a) (b)
(c)
Fig. 6-2 Predicted and measured 3-D lattice strain evolution during compression along ND,
Case I: (a) lattice strains along ND, (b) lattice strains along TD and (c) lattice strains along RD.
The sample was tested such that Q1║ND (a) and Q2║TD (b) or Q1║ND and Q2║RD (c).
174

as the yielding and hardening of the low-order orientations are mainly controlled by
prism slip (Schmid factor is high). For other pyramidal orientations and the basal
orientation, the agreement between the model and experiment is unacceptable. In the
two Poisson directions (Fig. 6-2b and 2c), it is obvious that even the general trend in the
lattice strain development is missed for all the plotted diffraction peaks. This poor
agreement cannot be improved by simply tuning the model parameters (within the ranges
given in Section 3). Thus it is inferred that considering only prism <a> slip and
pyramidal <c+a> slip is not sufficient to reproduce the experimental lattice strain data.
6.4.2.2 Case II
In Case II (‘pr+pya+pyca’), predicted lattice strains in the loading direction (Fig.
6-3a) are acceptable. In particular, the difference between { 1110 } and { 2110 } lattice
strains in the plastic regime is captured by the model, which was not successfully
reproduced in Chapter 5. However, the model fails to reproduce the lattice strain
development for all the diffraction peaks in the Poisson directions (Fig. 6-3b and 3c).
Again, simply adjusting the model parameters does not help improve the agreement.
6.4.2.3 Case III
If pyramidal <a> slip is replaced with basal slip (Case III, ‘pr+bas+pyca’), the
agreement between the model and experiment in the two Poisson directions is much
improved (Fig. 6-4b and 4c), compared to Cases I and II. However, it is noted that the
predicted (0002) strain in TD still deviates from the experimental data during plastic
deformation, as in the previous two cases. This deviation is induced by the exclusion
(on purpose) of tensile twinning in modeling, which, although negligible, has a strong
effect in reproducing the basal strain in TD. This will be clearer when comparing
175

(a) (b)
(c)
Fig. 6-3 Predicted and measured 3-D lattice strain evolution during compression along ND,
Case II: (a) lattice strains along ND, (b) lattice strains along TD and (c) lattice strains along RD.
176

(a) (b)
(c)
Fig. 6-4 Predicted and measured 3-D lattice strain evolution during compression along ND,
Case III: (a) lattice strains along ND, (b) lattice strains along TD and (c) lattice strains along RD.
177

Cases III and VI. The higher yield strength shown in Fig. 6-4b than that in Fig. 6-4a and
4c is due to the texture variation in the two specimens (see Chapter 4) used for the
compression testing along ND. In the loading direction (Fig. 6-4a), the model results
are acceptable, but the difference between { 1110 } and { 2110 } strains is hard to discern.
As shown in Case III, basal slip brings about micro-yielding of the high-order pyramidal
orientations: this is consistent with the relatively high Schmid factors in these orientations.
Once these pyramidal orientations yield, load is transferred to the lower-order grains,
such as { 0110 }, { 0211 }, { 1220 } and { 1110 }, and thus their lattice strains keep
increasing. Case III shows that basal slip is necessary in the modeling.
6.4.2.4 Case IV
Case IV (‘bas+pya+pyca’) is unrealistic and was only designed to illustrate the
effects of prism and pyramidal <a> slip. Fig. 6-5 clearly shows that the lattice strain
development in all the three directions is not much different from that in Case III, except
for prism orientations (e.g. { 0110 }) in the loading direction, and { 2211 } in RD. Two
points are derived. First, without prism slip, the micro-yielding of the prism grains
cannot be reproduced (even using other model parameters), resulting in rapidly increasing
lattice strains in these grains during plastic deformation. Therefore, prism slip should
not be ignored, and cannot be substituted by pyramidal <a> slip. Secondly, pyramidal
<a> slip is not an essential deformation mode for modeling, since without it the lattice
strains (especially those of pyramidal grains) still can be reproduced as shown in Case III.
6.4.2.5 Case V
In Case V (‘pr+bas+pya+pyca’) all the commonly used slip modes are considered.
More parameters are needed to be tuned, and thus more effort was spent compared to the
178

(a) (b)
(c)
Fig. 6-5 Predicted and measured 3-D lattice strain evolution during compression along ND,
Case IV: (a) lattice strains along ND, (b) lattice strains along TD and (c) lattice strains along RD.
179

previous four cases. However, this effort does not lead to noticeably better agreement
than Case III in all the three directions (Fig. 6-6), except that the separation of { 1110 }
and { 2110 } strains is a little improved in the loading direction. It is then deduced,
again, that pyramidal <a> slip is not indispensable for modeling; its effect can be
represented by other slip modes.
6.4.3 Relative activities of slip modes
Fig. 6-7 presents how the slip modes compete with each other during deformation in
each of the five cases, based on which, a clearer understanding of basal and pyramidal
<a> slip is apparent. It is shown that prism slip (or pyramidal <a> slip in Case IV)
initiates first, followed by basal or pyramidal <a> slip, and then by pyramidal <c+a> slip.
This corresponds to the sequence of micro-yielding in the prism, the lower-order
pyramidal, the higher-order pyramidal, and the basal orientations. It appears that the
micro-yielding of the basal orientation (or the initiation of pyramidal <c+a> slip) is
responsible for the macroscopic yielding of the material. This is clear when comparing
the evolution of relative activities (Fig. 6-7) and the corresponding flow curves (Fig. 6-1).
The relative activity of pyramidal <c+a> slip develops in a similar pattern in Fig.
6-7c (Case III) and 7d (Case IV). This happens to basal slip as well, but with lower
activity in Case IV, because in Case IV its role has been partially assumed by pyramidal
<a> slip.
Fig. 6-7c and 7e reveal a close similarity in the activity of pyramidal <c+a> slip
between Cases III (Fig. 6-7c) and V (Fig. 6-7e). More interestingly, the total amount of
relative activities of prism slip and pyramidal <a> slip in Case V is commensurate with
180

(a) (b)
(c)
Fig. 6-6 Predicted and measured 3-D lattice strain evolution during compression along ND,
Case V: (a) lattice strains along ND, (b) lattice strains along TD and (c) lattice strains along RD.
181
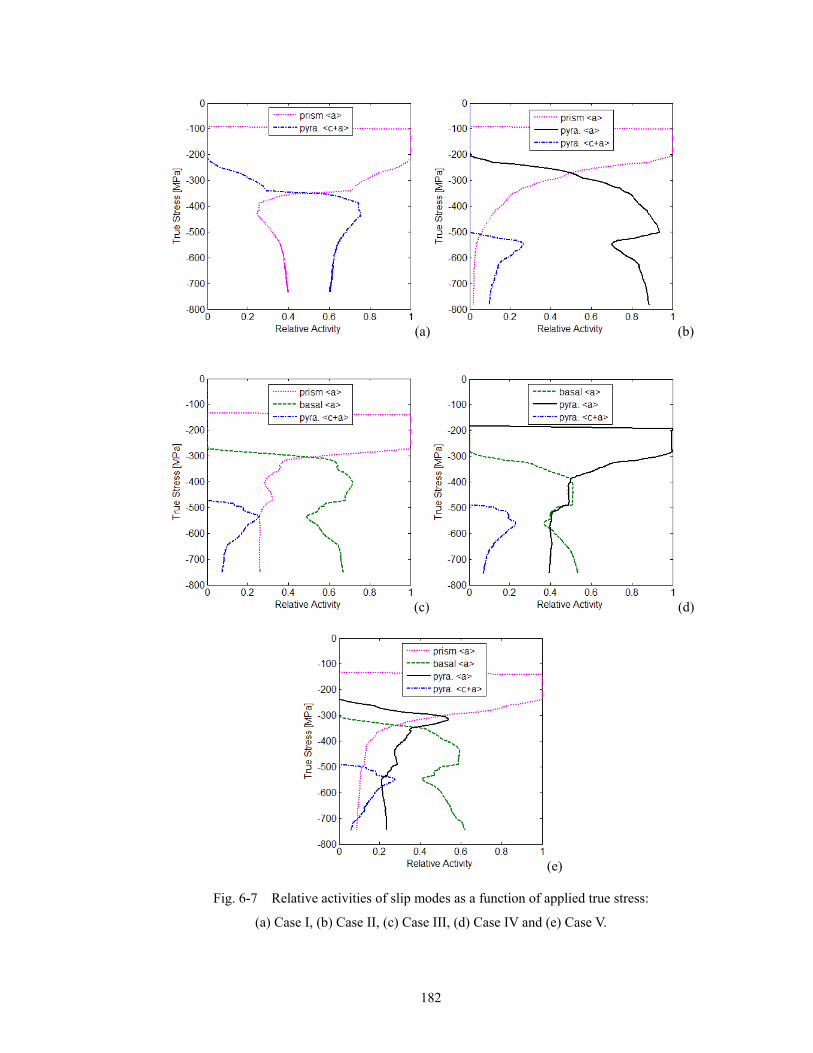
(a) (b)
(c) (d)
(e)
Fig. 6-7 Relative activities of slip modes as a function of applied true stress:
(a) Case I, (b) Case II, (c) Case III, (d) Case IV and (e) Case V.
182

the activity of prism slip in Case III. Basal slip is roughly the same active in both cases,
although part of its role in Case III may have been taken by pyramidal <a> slip in Case V.
In other words, pyramidal <a> slip can be assumed as a combination of prism and basal
slip.
6.5 Discussion
6.5.1 Effects of twinning
Twins, of either tensile or compressive types, can bring about remarkable stress
relaxation in the (0002) orientation. To maintain stress equilibrium as well as strain
compatibility, orientations other than (0002) would also experience changes in their
internal stress state, but the resultant effects are largely dependent on the volume of twins.
Twins can also affect the subsequent plastic deformation after their formation, by
facilitating or impeding the movement of dislocations. In this chapter, twinning modes
were deliberately ignored in the modeling, in order to avoid another level of complexity.
Since twinning is not likely to occur significantly in these specimens, because of its low
Schmid factor, it will not contribute significantly to the results reported here.
Specifically, the validity of disregarding twinning modes in Comp.ND is justified by the
following:
1) TEM experiments have shown no tension or compression twins of any type in the
specimens compressed along ND [36].
2) Texture measurements and intensity analyses suggested that the texture changes little
during compression along ND (Appendix C). If twinning activity was significant, the
texture and intensities would have changed dramatically.
183

6.5.2 Reasonable ranges of CRSS
Reasonable CRSSs of the deformation modes should meet the following
requirements:
1) Reproduce macroscopic flow curves for Comp.ND, Tens.TD and Tens.RD.
2) Predict Lankford coefficients for the above-mentioned three deformation conditions.
3) Predict the relative activity of prism slip (except for Case IV), i.e., prism slip should
be the most active mode in any conditions, at least during the early stage of plastic
deformation.
4) Capture the main features of the lattice strain development (at least in the loading
direction for some cases) during Comp.ND, i.e., the micro-yielding orientations
should follow a sequence of the prism initially, then the pyramidal, and the basal
finally.
Being tested against the above constraints, the wide ranges of initial CRSSs given in
Section 6.3 have been dramatically narrowed down to those listed in Table 6-4, and the
best sets for each case are tabulated in Table 6-2.
Table 6-4. Reasonable ranges of initial CRSSs ([min-max] in GPa)
Case I Case II Case III Case IV Case V
Prism <a> [0.08-0.11] [0.08-0.10] [0.09-0.11] - [0.09-0.10]
Basal <a> - - [0.14-0.17] [0.14-0.18] [0.16-0.18]
Pyr <a> - [0.11-0.13] - [0.11-0.13] [0.14-0.16]
Pyr <c+a> [0.14-0.19] [0.28-0.32] [0.32-0.36] [0.34-0.36] [0.30-0.33]
6.5.3 Separation of { 1110 } and { 2110 } lattice strains
In Chapter 5, it was speculated that the failure to separate predicted { 1110 } and
184

{ 2110 } lattice strains in the loading direction during Comp.ND resulted from the
omission of pyramidal <a> slip in the modeling. This chapter shows that the separation
is present not only in Case II (with pyramidal <a>, Fig. 6-3), but also in Case I (without
pyramidal <a>, Fig. 6-2). Further studies have shown that even in Case III
(‘pr+bas+pyca’), it was possible to separate lattice strains of the two pyramidal peaks.
Fig. 6-8 shows an example of the separation, with initial CRSSs being =0.11GPa,
=0.34GPa and =0.24GPa. Thus it may be deduced that this separation can be
fulfilled either by other slip modes (e.g. pyramidal <c+a> slip) than pyramidal <a> slip,
or by pyramidal <a> slip only, which probably has been practically represented by others
in modeling.
pr0τ
bas0τ
pyca0τ
6.5.4 Possibility of pyramidal <a> slip
In the published papers (e.g. [18,27,28] ) which do not consider basal slip, the
Fig. 6-8 Separation of { 1110 } and { 2110 } lattice strains using prism, basal and
pyramidal <c+a> slip.
185

186
deformation (tension or compression) typically proceeds in the direction along which
only a few high-order pyramidal or basal grains are orientated. This probably explains
why their modeling results are reasonable even without basal slip, since low-order
pyramidal orientations present small Schmid factors for basal slip, but large factors for
pyramidal <a> slip.
It would be difficult to prove the necessity of including pyramidal <a> slip using the
current EPSC model and our present experimental lattice strain data (due to the notable
texture changes in the cases other than Comp.ND). The fact that satisfactory agreement of
the model with experimental results can be obtained without pyramidal <a> slip and the
complete absence of evidence that it exists in Zr and its alloys suggests that one should be
extremely cautious about introducing pyramidal <a> slip into any model.
6.6 Conclusion
This chapter illustrated the necessity of including basal slip in the EPSC modeling of
the room-temperature deformation in polycrystalline Zircaloy-2 by considering extensive
combinations of slip modes. Based on the fitting to our neutron diffraction data, it is
believed that 1) basal slip is very active during plastic deformation, and should be
considered in the EPSC modeling; 2) pyramidal <a> slip can reasonably be neglected,
especially if one wants to simplify the modeling process by using fewer modeling
parameters and that 3) a combination of prism slip, basal slip and pyramidal <c+a> slip is
the smallest set of deformation modes necessary for modeling. Reasonable ranges of
initial CRSS for each slip mode have been proposed, which can serve as reference
starting values for the EPSC modeling of Zr alloys with similar chemical compositions.

References [1] R.G. Ballinger, G.E. Lucas and R.M. Pelloux, J. Nucl. Mater. 126 (1984) 53-69
[2] R.W. Cahn, Acta Metall. 1 (1953) 49-70
[3] E.J. Rapperport, Acta Metall. 3 (1955) 208
[4] E.J. Rapperport, Acta Metall. 7 (1959) 254-260
[5] J.E. Bailey, J. Nucl. Mater. 7 (1962) 300-310
[6] A. Akhtar, J. Nucl. Mater. 47 (1973) 79-84
[7] J.A. Jensen and W.A. Backofen, Can. Met. Quart. 11 (1972) 39-51
[8] E.Tenckhoff, Zeitschrift fur Metallkunde 63 (1972) 192-197
[9] D.H. Baldwin and R.E. Reed-Hill, Trans. AIME 233(1965) 248-249
[10] R.E. Reed-Hill, in Deformation Twinning, edited by R.E. Reed-Hill, J.P. Hirth and H.C..
Rogers, AIME (1964) 295
[11] R.J. McCabe, E.K. Cerreta, A. Misra, G.C. Kaschner and C.N. Tomé, Phil. Mag. 86 (2006)
3595-3611
[12] M.J. Philippe, M. Serghat, P. Van Houtte and C. Esling, Acta Metall. Mater. 43 (1995)
1619-1630
[13] J.I. Dickson and G.B. Craig, J. Nucl. Mater. 40 (1971) 346-348
[14] A. Akhtar, Acta Metall. 21 (1973) 1-11
[15] G.J.C. Carpenter, J.F. Watters and R.W. Gilbert, J. Nucl. Mater. 48 (1973) 267-276
[16] K. Pettersson, J. Nucl. Mater. 105 (1982) 341-344
[17] J.L. Martin and R.E. Reed-Hill, Trans. TMS AIME 230 (1964) 780-785
[18] M.J. Philippe, C. Esling and B. Hocheid, Textures and Microstructures 7 (1988) 265-301
[19] M. Fregonese, C. Régnard, L. Rouillon, T. Magnin, F. Lefebvre and C. Lemaignan,
Zirconium in the Nuclear Industry 12th International Symposium, edited by G. P. Sabol and G.D.
Moan, ASTM STP 1354 (2000) 377-396
[20] P.A. Turner and C.N. Tomé, Acta Metall. 42 (1994) 4143-4153
187

188
[21] R.A. Lebensohn and C.N. Tomé, Acta Metall. Mater. 41 (1993) 2611-2624
[22] J.W.L. Pang, T.M. Holden, P.A. Turner and T.E. Mason, Acta Mater. 47 (1999) 373-383
[23] H. Francillette, B. Bacroix, M. Gaspérini and J.L. Béchade, Mater. Sci. Eng. A 234-236
(1997) 974-977
[24] H. Francillette, B. Bacroix, M. Gaspérini and J.L. Béchade, Acta Mater. 46 (1998)
4131-4142
[25] H. Francillette, O. Castelnau, B. Bacroix and J.L. Béchade, Mater. Sci. Forum 273-275
(1998) 523-528
[26] C.N. Tomé, private communication (2006)
[27] M.J. Philippe, F. Wagner and C. Esling, Proc. 8th Int. Conf. Textu. Mater. (ICOTOM-8),
edited by J.S. Kallend and G. Gottstein, The Metallurgical Society (1988) 837-840
[28] C.N. Tomé, R.A. Lebensohn and U.F. Kocks, Acta Metall. Mater. 39 (1991) 2667-2680
[29] S.R. Agnew, D.W. Brown and C.N. Tomé, Acta Mater. 54 (2006) 4841-4852
[30] M.R. Daymond and H.G. Priesmeyer, Acta Mater. 50 (2002) 1613-1626
[31] B. Clausen, T. Lorentzen, M.A.M. Bourke and M.R. Daymond, Mater. Sci. Eng. A259 (1999)
17-24
[32] J.R. Cho, D. Dye, K.T. Conlon, M.R. Daymond and R.C. Reed, Acta Mater. 50 (2002)
4847-4864
[33] P.A. Turner, N. Christodoulou and C.N. Tomé, Int. J. Plasticity 11 (1995) 251-265
[34] C.N. Tomé, G.R. Canova, U.F. Kocks, N. Christodoulou and J.J. Jonas, Acta Metall. 32
(1984) 1637-1653
[35] R.A. Holt, D. Dye and R.B. Rogge, Annual Report of the National Research Council (2004)
[36] I. Yakubtsov, unpublished data (2006)

Chapter 7
Texture Development during Deformation in Zircaloy-2
Texture development in zirconium reactor components can greatly affect their in-service
performance, in particular influencing hydride cracking, dimensional stability and
fracture. Thus, understanding texture evolution in terms of contributing micromechanical
deformation mechanisms contributes to improved engineering design of the components.
The development of intergranular strain in Zircaloy-2 specimens subject to uni-axial
loading along different test directions, during in-situ neutron diffraction measurements
was discussed in Chapters 3 to 6. In this chapter, the evolution of different peak
intensities as a result of texture development during deformation as well as
post-deformation textures are presented. A qualitative interpretation of the observed
texture formation is offered, based on theoretical modeling of deformation of an initially
random texture. The inferred minimum necessary number of deformation mechanisms to
interpret the post-deformation textures in Zircaloy-2 are prism slip, basal slip, pyramidal
<c+a> slip and tensile twinning, the occurrence of which are supported by transmission
and scanning electron microscopy observations. This minimum set of deformation
mechanisms helps reduce the number of modeling parameters to facilitate
implementation of plasticity models for a more quantitative interpretation (Chapter 8).
7.1 Introduction
Zirconium alloys are widely used in nuclear reactors due to their low neutron capture
189
cross-section, excellent corrosion-resistance in hot water, and good mechanical properties.
The in-service behavior (e.g. delayed hydride cracking, dimensional stability and fracture)
of Zr alloys strongly depends on the crystallographic texture (both macro- and
microscopic) of the components, due to complex interactions between texture evolution
and intergranular stress evolution (i.e. the stresses that develop among different grain
orientations). Thus, it is necessary to understand the development of texture and
intergranular stresses in order to control the anisotropy of mechanical properties and to
predict the behavior of the material made by a new manufacturing route (e.g. the
calandria tubes for the Advanced CANDU Reactor [1]). This demands sufficient
knowledge of how texture develops during deformation and what deformation
mechanisms (e.g. slip and twinning) are responsible for this development.
Deformation textures in α-phase Zr and its alloys made by various manufacturing
processes have been reported extensively in the literature, e.g. rolling textures
[2,3,4,5,6], uniaxial tension or compression textures [7,8], plane strain compression
texture [9], and tube reduction textures [10,11,12,13,14,15]. The principal basis of a
qualitative empirical understanding (in terms of macroscopic strain conditions) of how
texture evolves during cold working is that 1) basal plane normals tend to be aligned with
the direction of maximum macroscopic compressive strain [12], and 2) prism plane
{ 0110 } normals tend to be aligned with the direction at 0˚ and ±60º from the direction of
maximum macroscopic tensile strain [e.g. 6, 16 , 17 , 18 , 19 , 20 , 21 , 22 , 23 ].
Recrystallization maintains the orientation of the basal normals but rotates t
he { 010 } and
{
1
0211 } normals 30° around the c-axis, bringing the { 0211 } normals into the positions that
the { 0110 } normals occupy after cold work [5,24]. These qualitative principles have
190

helped to understand the textures observed during tube reduction, rolling and wire
drawing. For example, tube reduction with 1Q>>1 (or sheet rolling) produces a texture
of with the basal plane normals near the radial (or normal) direction as the maximum
compressive strain is along the radial (or normal) direction. The basal normal maxima
usually are tilted by ±20-40˚ towards the tangential (or transverse) direction. The { 0110 }
normals are tilted towards the axial (or rolling) direction and the direction at ±60º with
the axial (or rolling) direction (i.e. the direction of maximum tensile strain) in the axial
(or rolling)-tangential (or transverse) plane. Tubing deformed with Q<<1 attains a texture
with the basal normals parallel to the tangential direction along which the compressive
strain is the largest. The {
0110 } normals are aligned with the axial direction and the
direction at ±60º with the axial direction in the axial-radial plane. Tubing deformed
with Q≈1 (or wire drawing) has a uniform distribution of the basal normals in all
directions in the radial-tangential plane as the compressive strain is the same in the radial
and tangential directions (see Fig. 2-18 [25,26]). The { 0110 } normals are uniformly
distributed at 0˚ and ±60º from the axial direction. General relations among plastic strain
path, tubing texture and mechanical anisotropy were established [17]. A stable texture
can be achieved by a certain degree of straining along a given strain path. Once a final
stable texture is formed, further deformation along the same path does not change the
character of the texture, but only its sharpness [18].
Qualitative understanding based on the microscopic deformation mechanisms was
also developed. Slip causes continuous, but relatively gradual grain reorientation,
although the strain achieved can be great, while twinning causes abrupt, but large grain
1 Q is the ratio of thickness reduction to diameter reduction during the tube reduction process.
191
rotations, although the strain achieved is relatively small [6]. Twinning is also
important as the reorientated grains may be favorable for the activation of slip for further
deformation.
The fact that ‘basal plane normals tend to be aligned with the direction of maximum
compressive strain’, was interpreted to be a result of twinning, either of tensile [6,12,18]
or compression [6,12,16,18] type. Tensile twinning occurs when the <c> axis is in
tensile strain, or when the direction perpendicular to the <c> axis is in compressive strain.
Compression twinning happens when the <c> axis is in compression [6]. The tilt of the
maxima in the basal normal distribution at ±20-40˚ towards the tangential (or transverse)
direction during Q>>1 tube reduction (or rolling) was explained by pyramidal <c+a> slip
on the }1211{ or }1110{ plane; <c+a> slip was also invoked to explain the compressive
strain along the <c> axis in Zr alloys [27,28,29]. The reorientation of the { 0110 }
normals towards the 0˚ and ±60˚ with the direction of maximum tensile strain was
interpreted as a result ip { of prism sl 0110 }< 0211 > [2,6,18].
This chapter presents the intensity development for different crystallographic planes
observed in three dimensions during in-situ tension or compression along the three
principal directions (normal, transverse and rolling) of a rolled Zircaloy-2 slab and the
pole figures for each sample after deformation (i.e. post-deformation texture).
Qualitative explanations for the intensity and texture development will be offered, based
on a systematic study of the effects on texture formation of individual deformation modes
(slip and twinning) that have commonly been reported.
192

7.2 Experimental
7.2.1 Material and samples
The composition of the Zircaloy-2 used in this research is Zr, 1.43-1.45 wt% Sn,
0.13-0.14 wt% Fe, 0.1 wt% Cr, 0.05 wt% Ni, 1260-1440 wt ppm O, 150-160 wt ppm C.
The source material is a 70mm thick warm-rolled Zircaloy-2 slab. The manufacturing
sequence is (1) forge at 1289K minimum to 5-5/8″ × 9-1/4″ × 26″, (2) β quench (water)
from 1289K minimum, (3) condition to 5-1/4″ minimum × 9″ × 26″, (4) roll after
preheating at 700K maximum along the length direction to obtain 50% reduction, (5)
condition to 2-1/2″ minimum thick × 9″ × length, (6) saw to final length. Transmission
electron microscopy showed the material to be fully recrystallized, indicating that it had
reached a temperature of at least 900K during processing [30], likely as a result of
adiabatic heating. The grains are equi-axed with an average size of ~20μm (Fig. 7-1
[31]) and have a very low dislocation density, and the material has a typical rolling and
recrystallization texture [24], i.e. most (0002) normals are orientated along ND with a
spread of ±50º towards TD and ±30º towards RD; most { 0110 } normals are orientated at
±30º away from RD in the RD-TD plane and { 1021 } normals are concentrated in the
rolling direction (Fig. 7-2 [31]).
Nine samples for tension tests and six samples for compression tests were machined
from the slab at the mid-thickness (to ensure uniform texture in the gauge length [31]) in
the three principal directions, with three (or two) samples each being prepared for tension
(or compression) along ND, along RD and along TD. Tension samples were machined
into dog-bone shape with a cross-section of ~6.35mm × 6.35mm) and compression
samples into right circular cylinders (9mm in diameter and 18mm long), Chapter 4. The
193

2μm
Fig. 7-1 Recrystallized grains of non-deformed materials
(a) (b) (c)
RD
ND TD
Fig. 7-2 Experimental pole figures of the Zircaloy-2 slab: (a) (0002), (b) { 0110 } and (c) { 0211 }
(ND=normal direction, TD=transverse direction, RD=rolling direction)
post-deformation texture measurements were performed on 1) specimens from the
deformed tensile samples cut 6mm long centered at the mid-gauge length, and 2) the
compressed samples as deformed.
194

7.2.2 In-situ tension and compression tests
In-situ tension and compression tests were performed on the L-3 beam line at the
National Research Universal (NRU) Reactor, Chalk River Laboratories, and the Engin-X
beam line at the ISIS facility, Rutherford Appleton Laboratory, respectively. Detailed
experimental procedures were described in Chapter 4.
In a typical in-situ tension test at L-3, the sample was bathed in a monochromated
neutron beam and oriented such that one of the three principal directions was parallel to
the scattering vector corresponding to a specific plane normal according to Bragg’s law.
Neutron counts recorded in a multi-detector centered at the Bragg angle were fitted to a
Gaussian function to derive the position and integrated intensity of the diffraction peaks.
A series of such data was obtained during loading and unloading cycles and the changes
in the peak position (lattice strain) and peak intensity were monitored with increasing
stress and strain. During compression at Engin-X the loading axis was set horizontally
at 45° to the incident beam so that lattice strains and peak intensities in vectors both
parallel and perpendicular to the axis in two detector banks corresponding to scattering
aligned horizontally at scattering angles of ±90°. Peak intensities were obtained by
fitting the recorded spectra using GSAS Rawplot [32].
For a given peak and scattering geometry, the fitted intensity (i.e. integrated intensity)
is proportional to the volume fraction of scattering unit cells, i.e. the proportion of grains
satisfying Bragg’s law within the scattering volume [33].
7.2.3 Ex-situ texture measurements
Two prism { 0110 } and { 0211 }, two pyramidal { 1110 } and { 2110 } pole figures (PFs)
and one basal (0002) PF were measured for each of the deformed tensile samples, and
195

one prism { 0110 }, one pyramidal { 1110 } and one basal (0002) PF were measured for
each of the compressed samples, in an Eulerian cradle at the E-3 beam line in the NRU
reactor. Measurements were performed in an increment of 5º over the complete
hemisphere defined by the azimuth, η, and the zenith, χ, of the goniometer (η from 0º to
360º and χ from 0º to 90º, see Chapter 2 and Fig. 7-3). Background intensity was also
measured over the complete hemisphere to correct the diffracted intensities for
anisotropic absorption due to the non-spherical shape of the sample.
η Incident beam
196
χ Scattering vector Diffracted beam
Fig. 7-3 Definition of η and χ
7.3 Results
7.3.1 Post-deformation textures
The measured post-deformation textures provide a view of the distributions of
texture components in the Euler space. The textures are represented by the { 0110 } and
(0002) PFs in this chapter, which are of the greatest interest and are most frequently
reported in the literature. The other measured pole figures will be presented in
Appendix D. In the pole figures the north and south correspond to RD, the west and
east to TD, and the center to ND. The texture coefficient (or, TC), ‘mrd’, stands for
‘multiples of a random distribution’, representing the strength of a texture component
relative to a random texture. In general, the deformation brought about only the changes
in the position of the texture, not much in the strength (except due to twinning).
Fig. 7-4 a,b) present the measured { 0110 } and (0002) PFs of the samples compressed
to ~13% strain along ND (Comp.ND). Only minor changes in texture are observed.
The { 0110 } maximum is slightly strengthened from 1.75mrd to 2.0mrd, and the 1.0mrd
contour expands towards the PF periphery (from χ=±55º to 65º). The (0002) component
near ND is also reinforced to a limited extent and the 1.0mrd contour is squeezed towards
ND in the RD-ND plane.
In contrast, compression along TD (Comp.TD) up to ~17% strain, Fig. 7-4 c,d)
produces a pronounced { 0110 } maximum in RD, with magnitude of 2.25mrd. Four new
{ 0110 } lobes at the PF rim with ~1.5mrd are formed at 30º from TD in the RD-TD plane.
Weakening of the { 0110 } component near TD is observed, accompanied by a slight
reinforcement near ND, which is illustrated by contraction of the 0.5mrd contour. The
(0002) maximum is tilted towards TD by ~±20º and the 1.0mrd contour expands to
intersect the periphery of the PF near TD. New (0002) lobes appear around TD, with a
spread of 20º towards ND in the ND-TD plane, and 20º towards RD in the TD-RD plane.
The texture after tension along RD (Tens.RD) up to ~12% strain, Fig. 7-4 e,f) bears a
close resemblance to the texture after compression along TD (Fig. 7-4 c,d), if the { 0110 }
components in ND and (0002) components in TD in the latter are disregarded.
During compression along RD (Comp.RD), up to ~12% strain, Fig. 7-4 g,h),
relatively strong { 0110 } components appear near TD, with a spread of 20º towards RD in
the TD-RD plane and up to 60º towards ND in the TD-ND plane. The { 0110 } normals
in these two concentrations are reoriented from the four ‘valleys’ of the ‘X-shaped’
depleted region (Fig. 7-4 e). The concentrations at 30º from RD in the RD-TD plane
197

(a) (c) (e)
‘lobe’
(b) (d) (f)
(g) (i) (k)
(h) (j) (l)
ig. 7-4 Measured pole or the deformed specime p.ND { 0110F figures f ns: (a) Com } (b) Com p.ND
(0002) (c) Comp.TD { 0110 } (d) Comp.TD (0002) (e) Tens.RD { 0110 } (f) T s.RD (0002) (g)
Comp.RD {
en
0110 } (h) C .RD (0002) (i) Tens.TD {omp 0110 } (j) Tens.T 0002) (k) Tens.ND {D ( 0110 }
(l) Tens.ND (0002)
198

0110remain intact, but the strength is increased. The { } normals are depleted in RD,
ens.TD, up to ~17% strain, Fig. 7-4 c,d) is
roughly similar to that for Comp.RD, if ignoring the appearance of {
corresponding to the appearance of prism normals in ND. The (0002) maximum near the
center is reduced to 2.5mrd from 3.5mrd prior to deformation. The (0002) maximum
near ND does not split as in Comp.TD. The spread at the PF center is reduced from
χ=±65º to 45º in the ND-TD plane, while it grows in the ND-RD plane from χ=±30º to
45º, resulting in an almost circular central distribution. New (0002) lobes appear around
RD, with a spread of 20º towards ND in the ND-RD plane, and 30º towards TD in the
TD-RD plane.
The texture after tension along TD (T
0110 } in ND and
strain) results in a completely different
texture (Fig. 7-4 a,b) from any of those discussed above. The {
(0002) in RD during Comp.RD. A distinct feature is found in the (0002) PF center that
the split-up towards TD (χ=±20º in the ND-TD plane) is observed in Tens.TD, while it
does not appear in Comp.RD.
Tension along ND (Tens.ND, up to ~13%
0110 } maximum has
New {
moved from the PF periphery by 30º towards ND (i.e. χ=60º), close to the ND-RD plane.
0110
TD and 15º in RD.
} concentrations appear at χ=±30º in the ND-TD plane, with a spread of 20º in
These new { 0110 } normals may come from the area around RD
the and/or the area around TD, where prism concentrations are slightly decreased. In
contrast, new (0002) normals are found around RD and TD. In the central part of the
(0002) PF, not only the strength is reduced, but also the spread is expanded towards TD,
resulting in two new lobes appearing at χ=±45º.
199

7.3.2 Development of texture coefficients
ts for the diffraction peaks measured during
in-s
The development of texture coefficien
itu loading reflects the grain reorientation or texture evolution during the process of
deformation. This may shed light on the changes in activity of particular slip or twinning
modes that could not be inferred only from post-deformation textures. Thus this
information complements the post-deformation texture data. Here, ‘XD/YD’ is defined
as the case of loading axis parallel to ‘XD’ and measurement parallel to ‘YD’; e.g.,
‘TD/ND’ refers to loading along TD and measurement along ND.
During the compression tests the peaks measured are { 0211 }, { 1220}, {0110 },
{ 11 }, {10 2211 }, { 2110 }, { 3110 } and ( 0002 ), and during te n tes picall ey
in de on two m or tions, on two pyramidal orientations and the basal
orientation.
For a given
nsio ts ty y th
clu e or pris ienta e or
peak, the intensity relative to its initial value is proportional to the relative
cha
s in the development of TCs are summarized in Table 7-1. It is
seen
nges in the volume fraction, or TCs (mrd) in a texture. For the purpose of direct
comparison, the intensity was normalized to the initial TC in units of ‘mrd’. The
changes in TCs are presented in Fig. 7-5 to Fig. 7-10. It is clearly seen from the figures
that the changes in TCs do not develop at a constant rate during straining. Before
~0.4% strain, no changes in TC are observed. This strain level corresponds to the
initiation of macroscopic plastic deformation (elastic strain varies from ~0.35% to ~0.5%,
depending on the loading direction). Texture immediately starts changing once plastic
deformation initiates.
The qualitative trend
that TCs of { 3110 } and (0002) follow a similar pattern during compression, and so
200

(a)
Text
ure
coef
ficie
nt (m
rd)
Text
ure
coef
ficie
nt (m
rd)
(b)
Text
ure
coef
ficie
nt (m
rd)
Text
ure
coef
ficie
nt (m
rd)
(c)
Text
ure
coef
ficie
nt (m
rd)
Text
ure
coef
ficie
nt (m
rd)
Fig. 7-5 Evolution of texture coefficient during compression along ND: (a) ND/ND, (b) ND/TD and (c) ND/RD
201

(a)
Text
ure
coef
ficie
nt (m
rd)
Text
ure
coef
ficie
nt (m
rd)
(b)
Text
ure
coef
ficie
nt (m
rd)
Text
ure
coef
ficie
nt (m
rd)
(c)
Text
ure
coef
ficie
nt (m
rd)
Text
ure
coef
ficie
nt (m
rd)
Fig. 7-6 Evolution of texture coefficient during compression along TD: (a) TD/ND, (b) TD/TD and (c) TD/RD
202

(a)
Text
ure
coef
ficie
nt (m
rd)
Text
ure
coef
ficie
nt (m
rd)
(b)
Text
ure
coef
ficie
nt (m
rd)
Text
ure
coef
ficie
nt (m
rd)
(c)
Text
ure
coef
ficie
nt (m
rd)
Text
ure
coef
ficie
nt (m
rd)
Fig. 7-7 Evolution of texture coefficient during compression along RD: (a) RD/ND, (b) RD/TD and (c) RD/RD
203

a)
Text
ure
coef
ficie
nt (m
rd)
Text
ure
coef
ficie
nt (m
rd)
a)
b)
Text
ure
coef
ficie
nt (m
rd)
Text
ure
coef
ficie
nt (m
rd)
b)
c)
Text
ure
coef
ficie
nt (m
rd)
Text
ure
coef
ficie
nt (m
rd)
c)
Fig. 7-8 Evolution of texture coefficient during tension along ND (a) ND/ND, (b) ND/TD and (c) ND/RD
Fig. 7-9 Evolution of texture coefficient during tension along TD (a) TD/ND, (b) TD/TD and (c) TD/RD
204

Text
ure
coef
ficie
nt (m
rd)
a)
Text
ure
coef
ficie
nt (m
rd)
b)
Text
ure
coef
ficie
nt (m
rd)
c)
Fig. 7-10 Evolution of texture coefficient during tension along RD: (a) RD/ND, (b) RD/TD and (c) RD/RD
205
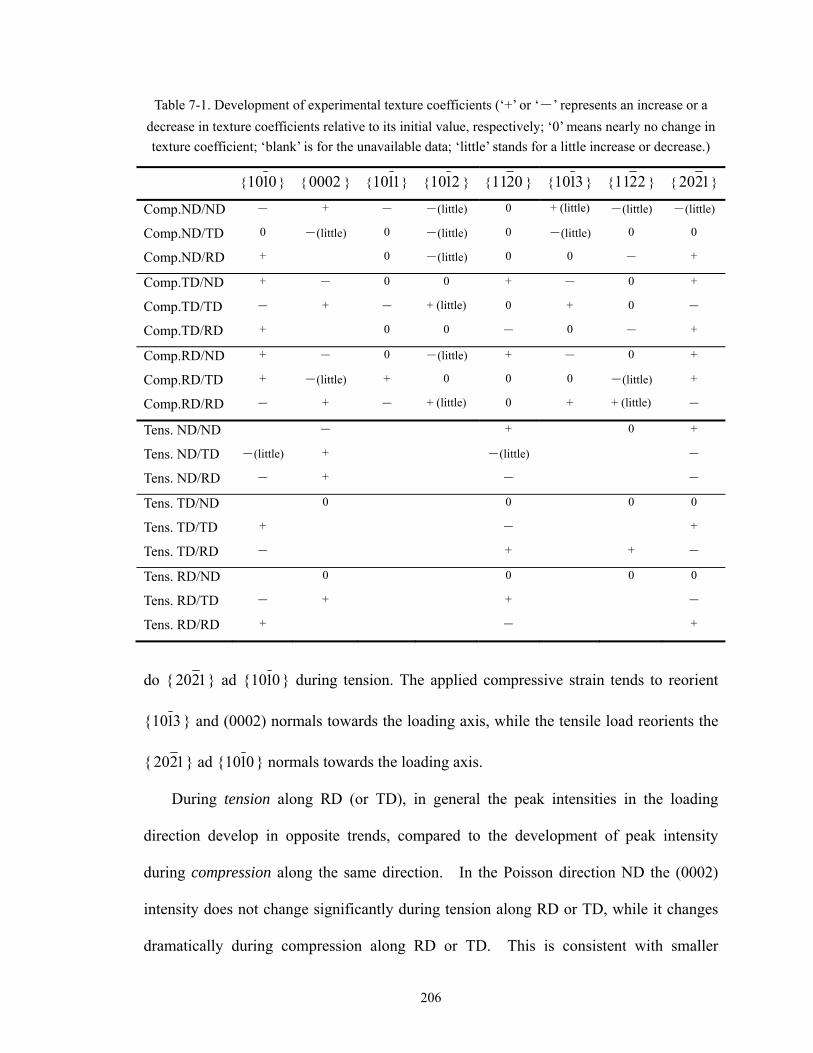
Table 7-1. Development of experimental texture coefficients (‘+’ or ‘―’ represents an increase or a decrease in texture coefficients relative to its initial value, respectively; ‘0’ means nearly no change in texture coefficient; ‘blank’ is for the unavailable data; ‘little’ stands for a little increase or decrease.)
{ } { 22110110 } { } {0002 1110 } { 2110 } { 3110} { 0211 } { 1220 }
Comp.ND/ND ― + ― ―(little) 0 + (little) ―(little) ―(little)
Comp.ND/TD 0 ―(little) 0 ―(little) 0 ―(little) 0 0
Comp.ND/RD + 0 ―(little) 0 0 ― +
Comp.TD/ND + ― 0 0 + ― 0 +
Comp.TD/TD ― + ― + (little) 0 + 0 ―
Comp.TD/RD + 0 0 ― 0 ― +
p.RD/ND + ― 0 ― le) + ― 0 + Com (litt
Comp.RD/TD +
Comp.RD/RD ― + + (little) ―
Tens. ND/ND ― + 0 +
+ ―(little) + 0 0 0 ―(little)
+ ― + (little) 0
Ten
Ten
Ten
s. ND/TD ―(little) + ―(little) ―
s. ND/RD ― + ― ―
s. TD/ND 0 0 0 0
Ten
Ten
Ten
s. TD/TD + ― +
s. TD/RD ― + + ―
s. RD/ND 0 0 0 0
Tens. RD/TD ― + + ―
Tens. RD/RD + ― +
do { 1220 } ad { 0110 } during tension. The applied compressive strain tends to reorient
{ 3110 } and (0002) normals towards the loading axis, while the tensile load reorients the
{ 1220 } ad { 0110 } normals towards the loading axis.
During tension along RD (or TD), in general the peak intensities in the loading
direction develop in opposite trends, compared to the development of peak intensity
during compression along the same direction. In the Poisson direction ND the (0002)
intensity does not change significantly during tension along RD or TD, while it changes
dramatically during compression along RD or TD. This is consistent with smaller
206

Poisson’s strain in ND during the tension, and thus the larger R-ratios (i.e. the ratio of the
macroscopic strains in the two Poisson’s directions – also referred as Lankford
coefficients) than those during the compression, i.e. R Tens.RD > R Comp.RD (2.61 vs 1.42)
and R Tens.TD > R Comp.TD (3.46 vs 2.29), Table 4-2 (Chapter 4).
7.4 Discussion
In this section, the measured post-deformation textures and intensities are
qualitatively pic strains, and with the m
de hapt
results in the literature, in terms of the ‘strain-texture’ correlation, and the
‘mechanism-texture’ correlation.
In order to establish the ‘mechanism-texture’ relationship, a theoretical study of the
effects of each individual deformation mode is needed, which will provide a basis for the
qualitative understanding of texture formation (under certain conditions), and for the
derivation of the minimum necessary deformation modes to facilitate a further
quantitative interpretation (will be presented in Chapter 8).
7.4.1 Similarities regarding texture development
The measured textures show certain similar basic features (i.e. the positions of the
relatively strong and weak concentrations) between Comp.RD and Tens.TD, and between
Comp.TD and Tens.RD. Further, more similarities as to TC evolution are revealed from
Fig. 7-5 to Fig. 7-10 and Table 7-1, and are summarized in Table 7-2. These may
suggest similar deformation mechanisms occurring among certain loading conditions.
correlated with the macrosco
ormation mechanisms (the focus of this c
icroscopic
er). These are compared to the related f
207

Comparable cases belonging to Group 1 suggest that the tensile deformation along
ND is always accommodated by the same (or similar) deformation mechanisms whether
this deformation is due to an applied tensile load along ND or due to Poisson’s expansion
from a compressive load perpendicular to ND. Groups 2-6 suggest that tensile (or
compressive) straining along RD and along TD, either being the loading direction or the
Poisson’s direction, are very likely accommodated by similar deformation mechanisms.
Note that Comp.ND is not present in any of the groups, which may reflect a unique active
deformation mechanism operating in this loading case, i.e. com ssive straining along
ND as the loading direction ction is accommodated by
Table 7-2. Similar cases as to the texture coefficient development
Group .TD/N Co .RD/ND Tens. D
pre
and along ND as the Poisson’s dire
different mechanisms.
1 Comp D mp ND/N
2 Comp.TD/TD mp. Te . ND T D
3 Com mp.
4 Tens. TD TD ns. R
5 Tens. TD/ND ns. RD/ND
6 Tens. T D ns. R
Co RD/RD ns /TD ens. ND/R
p.TD/RD Co RD/TD
/ Te D/RD
Te
D/R Te D/TD
7.4.2 ‘Strain-textu ’ cor
-3 presents the macros ic s nditi s for th six l ases It
p.TD and T ns.RD possess qualitative similar strain conditions, and so
and ns.TD These rectly c rrespond to the similarities regarding the
e development between Comp.TD and Tens.RD, and Comp.RD and
omp and T ns.ND present un , and unique texture
in-te ure’ correlation is not new; in fact, it has been recognized since the
re relation
Table 7 cop train co on e oading c .
is seen that Com e
do Comp.RD Te . di o
intensity and textur
Tens.TD. C .ND e ique strain conditions
development.
The ‘stra xt
208
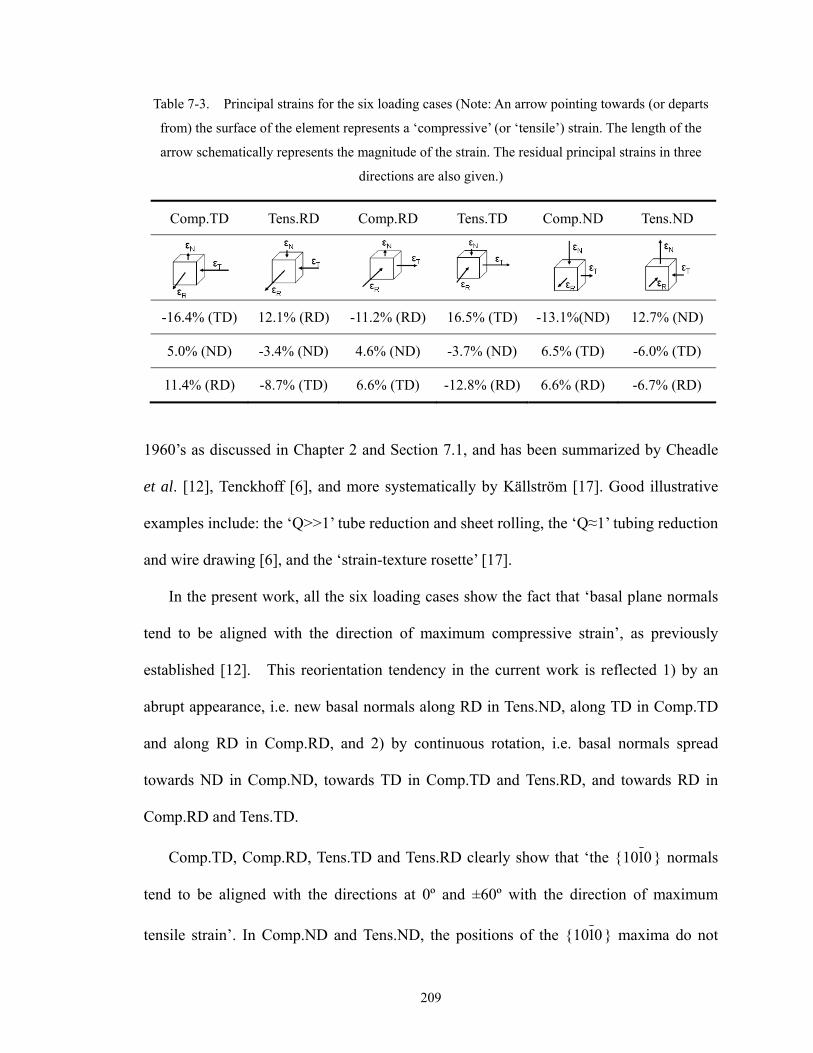
Table 7-3. Principal strains for the six loading cases (Note: An arrow pointing towards (or departs
m) the surface of t
arrow schematically represents the magnitude of the strain. The residual principal strains in three
Co Comp.ND Tens.ND
fro he element represents a ‘compressive’ (or ‘tensile’) strain. The length of the
directions are also given.)
mp.TD Tens.RD Comp.RD Tens.TD
-16.4% (TD) 12.1% (RD) -11.2% (RD) 16.5% (TD) -13.1%(ND) 12.7% (ND)
5.0% (ND) -3.4% (ND) 4.6% (ND) -3.7% (ND) 6.5% (TD) -6.0% (TD)
11.4% (RD) -8.7% (TD) 6.6% (TD) -12.8% (RD) 6.6% (RD) -6.7% (RD)
1960’s as discussed in Chapter 2 and Section 7.1, and has been summarized by Cheadle
et al. [12], Tenckhoff [6], and more systematically by Källström [17]. Good illustrative
examples include: the ‘Q>>1’ tube reduction and sheet rolling, the ‘Q≈1’ tubing reduction
and wire drawing [6], and the ‘strain-texture rosette’ [17].
In the present work, all the six loading cases show the fact that ‘basal plane normals
with the direction of maximum compressive strain’, as previously
esta
tend to be aligned
blished [12]. This reorientation tendency in the current work is reflected 1) by an
abrupt appearance, i.e. new basal normals along RD in Tens.ND, along TD in Comp.TD
and along RD in Comp.RD, and 2) by continuous rotation, i.e. basal normals spread
towards ND in Comp.ND, towards TD in Comp.TD and Tens.RD, and towards RD in
Comp.RD and Tens.TD.
Comp.TD, Comp.RD, Tens.TD and Tens.RD clearly show that ‘the { 0110 } normals
tend to be aligned with the directions at 0º and ±60º with the direction of maximum
0110tensile strain’. In Comp.ND and Tens.ND, the positions of the { } maxima do not
209

change significantly, because the tensile strains in the Poisson directions are
approximately the same (R Comp.ND = 1.01 and R Tens.ND = 1.13, Chapter 4).
In Tens.RD the compressive Poisson strain along TD is 8.7%, which is much smaller
TD in Comp.TD. Despite this large
diffe
f
strai
sed so that each of the deformation modes could be activated and
exerts influence e experiments,
tension o ss ain cti d.
At r p con here are everal commonly selected
deformat es terp plastic d ormation, qualitatively or
quantitatively with polycrystalline models. These modes are prism <a> slip
than the ~17% compressive applied strain along
rence in the compressive strain, Tens.RD and Comp.TD still share qualitative
similarities in terms of TC development (for most peaks) and post-deformation texture.
The TC development of the measured peaks also shows a gradual and steady pattern after
1~2% total strain. No abrupt change is observed after 2% strain. These may indicate
that the basic feature of a texture is usually determined at a relatively low percentage o
n (by ‘low’ here it means ~2% strain), and at higher strains the basic feature remains
intact as long as the loading path does not change, although the strength of specific
texture components may vary. This is consistent with related previous findings [6,18].
7.4.3 ‘Mechanism-texture’ correlation
7.4.3.1 Effects of individual deformation modes on texture evolution
A visco-plastic self-consistent polycrystalline model, VPSC [ 34 ] was used to
illustrate the effects of deformation modes (individual or combined effects) on texture
evolution. Details of the model can be found in [34,35]. A random texture comprising
1000 orientations was u
s on the texture formation. To be comparable to th
r compre ion to 15% str along one dire on was applie
oom tem erature in zir ium alloys, t s
ion mod for the in retation of ef
210
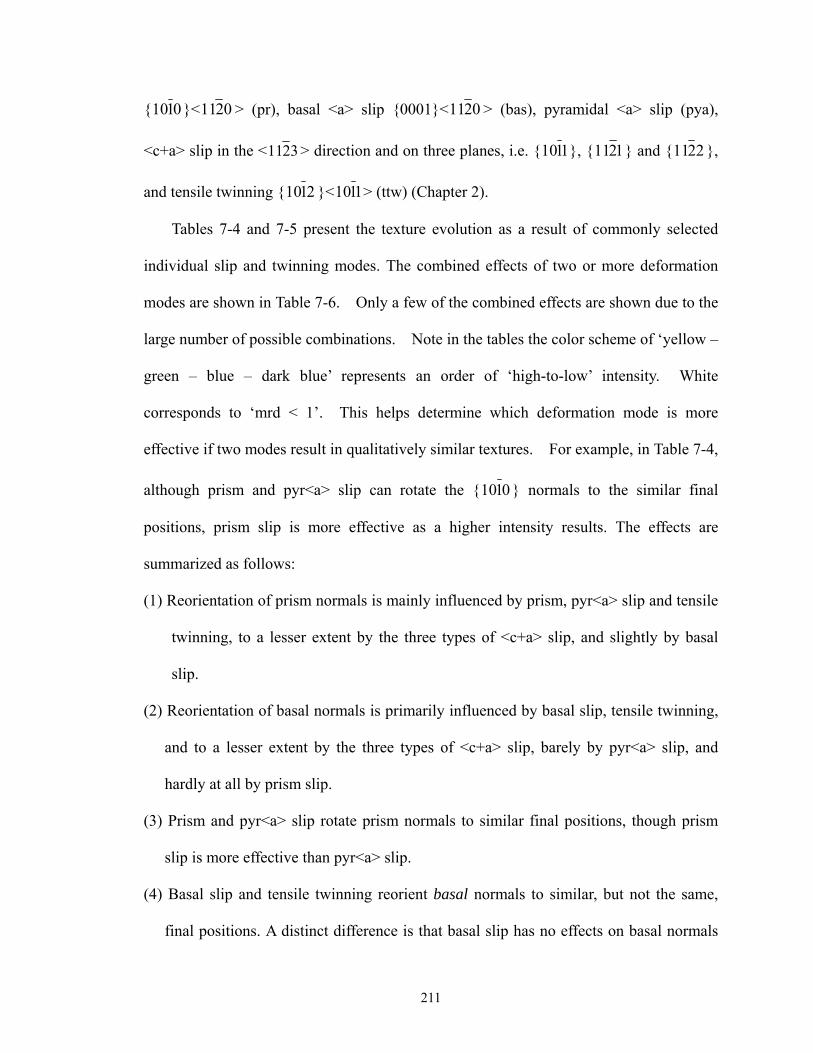
}< 020110 0211 > ( 11{ pr) slip, basal <a> {0001}< > (bas ramidal <a
<c+a> slip in the <
), py > slip (pya),
} and { 2211}, { 1211> direction and on three planes, i.e. { 11103211 },
and 2110 }<tensile twinning { 1110 > (ttw) (Chapter 2).
Tables 7-4 and 7-5 present the texture evolution as a result of commonly selected
individual slip and twinning modes. The combined effects of two or more deformation
modes are shown in Table 7-6. Only a few of the combined effects are shown due to the
large number of possible combinations. Note in the tables the color scheme of ‘yellow –
green – blue – dark blue’ represents an order of ‘high-to-low’ intensity. White
corr
e ,
although prism
esponds to ‘mrd < 1’. This helps determine which deformation mode is more
ffective if two modes result in qualitatively similar textures. For example, in Table 7-4
and pyr<a> slip can rotate the { 0110 } normals to the similar final
ffective as a higher inpositions, prism slip is more e tensity results. The effects are
sum foll
(1) Reorientation of prism normals is mainly influenced by prism, pyr<a> slip and tensile
twinning, to a lesser extent by the three types of <c+a> slip, and slightly by basal
(2) n ma ily y ten ,
se s , yr d
hardly at all by prism slip.
(3) Prism and pyr<a> slip rotate prism normals to similar final positions, though prism
slip is more effective than pyr<a> slip.
(4) Basal slip and tensile twinning reorient basal normals to similar, but not the same,
final positions. A distinct difference is that basal slip has no effects on basal normals
marized as ows:
slip.
Reorientatio of basal nor ls is primar influenced b basal slip, sile twinning
and to a les r extent by the three type of <c+a> slip barely by p <a> slip, an
211

located either parallel or normal to the loading axis because the Schmid factor is zero.
(5) The three types of <c+a> slip rotate prism normals to similar final positions. They
also rotate basal normals to similar positions.
(6) The effects on texture formation of individual deformation modes can be
superimposed, i.e. the resultant texture by the operation of multiple deformation
modes can be viewed as an addition of contributions from each individual mode.
tivi
strains mild Under these
con
It has shown that Comp.TD and Tens.RD share similar post-deformation textures and
strain conditions. This suggests that these cases share certain deformation mechanisms.
This also applies to Comp.RD and Tens.TD. The uniqueness of Comp.ND and Tens.ND
may suggest unique sets of deformation mechanisms.
Note that the combined effects are very dependent on the relative ac ty of each
contributing deformation mode, which is influenced by its CRSS and interactions with
other modes.
It should be emphasized that the above ‘mechanism–texture’ correlation is likely only
applicable to small applied and relatively or moderate textures.
ditions there always exist planes favourably oriented for the activation of each
individual mode, and the reorientation of one plane is independent from others. The
initial basal pole figure of the Zircaloy-2 slab has a significant spread in the ND-TD and
ND-RD planes, and the maximum is ~3.3mrd. Thus it is reasonable to assume that the
‘mechanism–texture’ correlation can be applied. Further study would be needed to
determine the extent (e.g. maximum strain, maximum initial strength of the texture
components) to which the superposition of texture contributed by individual deformation
modes is applicable.
7.4.3.2 Deformation mechanisms
212

Table 7-4. Effects of individual deformation modes on texture formation (half pole figure is xis. The color scheme d white corresponds
to ‘m
presented due to symmetry; →: tension along the east pole; TA: tensile a‘yellow-green-blue-dark blue’ represents a ‘high-to-low’ order of intensity, an
rd < 1’. This scheme applies to Tables 7-4, 7-5 and 7-6)
Deformation mode
Pole figures after tension
{Effects on texture formation
0110 } (0002)
prism <a> slip
> { 0110 }< 0211
(1) Rotate { 0110 } towards 0º and 60º from TA. (2) Have no effects on (0002).
basal <a> slip
{ 0001}< 0211 >
(1) Rotate { 0110 } towards TA (weak effect). (2) Rotate (0002) away from TA; form a band at ~75º from TA.
(3) Have no effects on { 0110 } and (0002) at ~0º and ~90º from TA.
pyramidal
> sl<a ip
{ 1110 }< 0211 >
(1) Have similar effects as prism slip on { 0110 }.
for ery weak (0002) band at ~90º from TA. (2) Rotate (0002) away from TA (weak effect);
m a v
<c+a> slip pyramidal
{ 1110 }< 3211
>
(1) Rotate { 0110 } awa m TAy fro ;
form a weak { 0110 } band at ~90º from TA. ) towards TA. (2) Rotate (0002
<c+a> slip pyramidal
{ 1211 }< 3211 >
Have similar (but weaker) effects as 1st pyr<c+a>
onto { 0110 } and (0002).
pyramidal <c+a> slip
{ 2211 }< 3211 >
Have similar effects as 1 pyr<c+a> onto {st 0110 } and (0002).
tensile twinning
{
2110 }< 1110 >
(1) Rotate { 0110 } towards TA;
have no effects onto { 0110 } at ~90º; o bas
(2) Rotate (0002) ~90º away from TA; similar t al slip (but with stronger effects)
form a band at ~90º from TA.
213

Table 7-5. Effects of individual deformation modes on texture formation (half pole figure is
Dem {
presented due to symmetry; ← : compression along the east pole; CA: compression axis)
formation echanism
Pole figures after compression
} (0002) Effects on texture formation
0110
prism <a> slip
(1) Rotate { 0110 } normals towards 30º and 90º
{ 010 }<1 0211 >
from CA. (2) Have no effects on (0002) normals.
basal <a> slip
{ 0001}< 0211 >
(1) Rotate { 0110 } away from CA;
(3) Have no effects on
form a weak band at ~90º from CA. (2) Rotate (0002) towards CA.
{ 0110 } and (0002) at both 0º and 90º from CA.
slip
(1) Have similar effects as prism slip on {pyramidal <a>
{ 110 }<1 0211 >
0110 } normals. (2) Rotate (0002) towards CA (very weak effects, if not completely neglected).
<c+apyramidal
> slip
{ 11 }<10 3211 >
(1) Rotate { 0110 } towards CA. (2) Rotate (0002) away from CA (weak effect); form
a weak band at ~90º from CA.
pyramidal
> slip
Have similar effects as 1st pyr<c+a> onto
<c+a
{ 121 }<1 3211 >
{ 0110 } and (0002).
>
ramidal
c+a> slip py<
{ 2211 }< 3211
Have similar effects as 1st pyr<c+a> onto
{ 0110 } and (0002).
tensile twinning
{ 2 }<110 1110 >
(1) Rotate { 0110 } away from CA; form a band at 90º from CA; similar to basal slip (but with stronger effects). (2) Rotate (0002) towards CA.
214

Table 7-6. Combined effects of two or more deformation modes on texture evolution (half pole
Deformation Mechanism
Pole figures after tension
figure is presented due to symmetry; → : tension along the east pole; TA: tensile axis)
{ 0110 } (0002) {
Deformation mechanism
Pole figures after tension
0110 } (0002)
+
+
prism slip
basal slip
prism silp
tensile twinning
prism slip
+ pyr<a> slip
1st <c+a> slip
prism slip +
basal slip +
prism slip
+ 1st <c+a> slip
prism slip +
basal slip +
tensile tw inning
echanisms; 2) tensile strains along ND are accommodated by similar deformation
mechanisms, whether ND is the loading direction or the Poi
ading along TD or RD), an D is
e lo ing ection must activate unique deformation mechanisms, compared to cases
when the ND is under compression in the that 1)
e de mation mechanisms in Tens.TD f the deformation
mechanisms occurring in Comp.ND, a aini
directions are tensile along RD and TD; 2) certain mechanisms are shared by Tens.ND,
Comp.RD and Comp.TD, since for compression along RD or TD, there is tensile strain
From the TC development, one can conclude that: 1) tensile strains along RD and TD
(whether in the loading or Poisson direction) are accommodated by similar deformation
m
sson direction (with
compressive lo d 3) compressive strains along ND when N
th ad dir
Poisson direction. Further, it appears
th for and Tens.RD are a sub-set o
s in Comp.ND, the str ng along the Poisson
215

along ND.
on the influences of individu n
7.4.2.1, the deformation mechanisms necessary for the texture formation are inferred,
Ta For example, the six-fold symmetry about ND of t
Based al deformation mechanisms shown in Sectio
ble 7-7. he { 0110 } PF in Comp.TD
.RD s formed due to prism slip, or fective
in reorienting prism normals), since these slip modes can create the {
and Tens i less likely by pyr<a> slip (i.e. less ef
0110 } components
fo e 30º and 90º from the comp ax 0º from the tensile axis.
Lobes are present in the measured pole figures, Fig.7-4c,e,g,i), rather than the bands
sh able 7-5, because
e PF for eformation, Fig. 7-2.
One may derive from Table 7-7 th rve elopment may be
, pyr<a>, basal, . Pyr<a>
slip is not one of the m um necessary slip is less
effective in forming the texture than prism or basal slip, 2) its effect on {
rming at th ression is, or 0º and 6
own in Table 7-4 or T there are no prism normals in the central part of
th be e d
at the obse d texture dev
accommodated by prism pyr<c+a> slip and tensile twinning
inim mechanisms, since 1) the pyr<a>
0110 } normals
can sal
slip. The difference amongst the three types of <c+a> slip is difficult to discern, thus
o o s, the sma rmation
modes comprises prism, basal, one <c+a> slip
modes have been partially confirmed by lectron
icroscope (TEM, SEM) observations, i.e. large numbers of <a> dislocations, large and
s twins (Fig. 7-11), and small n ar grain
und es [
Note that in Ten.RD and Tens.TD onl are needed. The
be fulfilled by prism slip, and 3) its effect on (0002) normals can be realized by ba
nly one type f <c+a> slip is needed. Thu llest set of necessary defo
and tensile twinning. These deformation
the transmission and scanning e
m
mall tensile umbers of <c+a> dislocations ne
bo ari 31].
y prism and basal slip
216

Table 7 nferred minimum necessary set of d ode
ode1’ and/or ‘mode2’ are activated being more likely to happen than
‘mode e reasons for the inferred deformation mo
Principal
s
Deformation mod rom
in the pole figur
-7. I eformation mechanisms (Note: ‘mode1/m 2’
, with ‘mode1’represents that ‘m
2’; th des are given in Italian font.)
trains
es inferred f changes
es of { 0110 } and (0002)
0110
Co
mp.ND
(1) { } intensity near ND is weake m is
strengthened tt/bas/pr/pya
Basal slip or tensile twinning can
ned, but the intensity around the PF ri
→
push { 0110 } normals away from compression
to ppen. axis; Prism or pyr<a> slip is also likely ha
(2) More (0002) normals cluster near ND → bas/tt
Basal slip tensile twinnin can ro te (0002) normals towards compression axis.
) Basic feature of the (0002) PF nea
c+a>
If <c+a> ip had not bee activated, the spread towards the (0002) PF rim would
have been much smaller.
intensity development does not
Minimum necessary mode
or g ta
(3
<
rly unchanged → a balance between bas/tt and
sl n
(4) The support the activation of tensile twinning.
s: bas, <c+a>
Comp.TD
(1) Most { 0110
Tens.RD
0110 } normals clust r in RD ane d new { } lobes formed at ±60º from RD
in the TD-RD plane → pr/pya
Prism or pyr<a> slip rotates { 0110 } normals towards 30º and 90º from
(2) (0002) normals in the center reoriented to ND and RD (the center becomes wider
sho tate)
Bas pyr (0002) n rds compre om
tensile axis.)
) New (0002) normals formed in TD and
compression axis (0º and 60º from tensile axis).
and rter compared to the initial s → bas/pya
al or <a> slip rotates ormals towa ssion axis (away fr
(3 new { 0110 } formed around ND (Comp.TD)
→ tt
Tensile twin ng swaps (00 ) and {ni 02 0110 } normals.
(4) (0002) normals at the center split t → Not yet understood, maybe
herited from the initial rolling texture, or due to basal slip, as it has no effects on
(0002) at 90º from the loading axis.
Minimum necessary mod omp.TD)
owards TD
in
es: pr, bas, tt (C
217

Table 7-7 (continue
omp.RD
d)
0110(1) Relatively strong { } lobes in TD form and the lobes at ±60º from TD in the TD-RD plane strengthened → pr/pya
Prism or pyr<a> slip rotates {
ed
C 0110 } normals towards 30º and 90º from compression axis (i.e. 0º and 60º from tensile axis).
close to a circle) → bas/pya (2) (0002) normals in the center reoriented towards ND and TD (the center becomes
Basal or pyr<a> slip rotates (0002) normals towards compression axis (away from tensile axis.)
(3) New (0002) normals formed in RD and new {
Tens.TD
0110 } formed around ND (Comp.RD) → tt
Tensile twinning swaps (0002) and { } normals. 0110 Minimum necessary modes: pr, bas, tt (Comp.RD)
Tens.ND
(1) { 0110 } maxima at the PF rim tilted to χ=60º close to ND-RD palne → pr/pya/tt Prism or pyr<a> slip brings prism normals to 60º from the tensile axis. There is also a likelihood that tensile twinning has swapped the prism normals from the rim to the
tilted.
Basal or pyr<a> slip rotates (0002) normals towards compression axis (away from
(3) (0002) normals appear around RD and TD; {
center, resulting in a decrease in intensity around the rim which makes the maxima look
(2) (0002) normals in the center spread towards TD → bas/pya
tensile axis.)
0110 } normals appear around ND → tt
Tensile twinning swaps (0002) and { 0110 } normals. Minimum necessary modes: pr, bas, tt
Pois
way
TD, and along RD, because the deformation along RD and TD is mainly accommodated
son’s contraction along ND can be accommodated by basal slip. Although basal slip
has no effects on the basal normals (or called grain ‘A’) exactly parallel to ND (due to
Schmid factor=0), it can rotate those basal grains initially tilted a from ND (called
grains ‘B’). The contraction in ND can be realized by the basal slip inducing deformation
in grains ‘B’ which surround grains ‘A’.
Prism slip is much easier to activate than other slip or twinning mode (Chapter 2).
This qualitatively explains the large R-ratios observed in compression and tension along
218

(a) (b)
the Poisson directions are RD and TD (deformation
mainly requires pr
rism {
0.2 μm
Fig. 7-11 Microstructure of deformed materials: (a) EBSD observation of large tensile twins and (b)
TEM observation of fine tensile twin. [31]
by prism slip, while the deformation along the Poisson direction (ND) requires twinning
or <c+a> slip or basal slip (either of which is harder to activate than prism slip). In
tension or compression along ND,
ism slip), thus the R-ratios are small (Table 4-2, Chapter 4).
7.4.3.3 Comparison with ‘mechanism-texture’ correlations in the literature
This work supports the previous interpretation [2,6,18], i.e. prism slip, to explain the
0110fact that ‘p } normals tend to be aligned with the directions at 0º and ±60º with
on of maximum ten
The fact that ‘basal plane normals tend to be aligned with the direction of maximum
compressiv as a result of tensile or compression twinning
[6,12,18,36
suggested t l slip. Tensile twinning causes
the abrupt s
the directi sile strain’.
e strain’ was interpreted
]. The current work only partially supports this interpretation. Rather, it is
hat the mechanism is tensile twinning or basa
appearance of basal plane normals, while basal slip induces the continuou
219

rotation (se
evidence.
existence in e Chapter 2 or Chapter 6) suggests that very likely it
occurs in zirconium the inclusion of basal slip in
odeling h
te apter 8) or lattice strain (Chapter 6).
The cu of either compression twinning or
pyr<a> ip
room temp
or . Pyr<a> slip also has never been discovered, in any alloys or any
deformation conditions (Chapter 2 and Chapter 6), although it seems that this mechanism
could in p i tion nd has been included in the
modeling [7
texture.
.5 Summary
In-situ tension and compression tests were performed on samples cut from a
mod ately principal directions relative to the texture.
The peak
post-defo
R is roug
peak inten , te
compression along RD are roughly similar. Compression along ND, tension along TD
e Section 7.4.1). The existence of tensile twinning has solid experimental
As for basal slip, although no direct experimental evidence is reported, its
certain conditions (se
alloys at room temperature. Further,
m as resulted in better agreement between the model and experiment, with
xture (will be shown in Chregards to
rrent work does not suggest the existence
sl . Compression twinning has never been observed in zirconium alloys at
erature, and in particular, it was not found in any of our deformed specimens
SEM studiesby TEM
r nciple rotate the basal normals (Sec 7.4.2.1), a
,37,38] to help improve the agreement between model and experiment as for
7
er textured Zircaloy-2 slab in three
intensity (or texture coefficient) development during deformation and
rmation textures were reported in this chapter. It was found that tension along
D hly similar to compression along TD, in terms of post-deformation texture,
sity development and principal strain. Likewise nsion along TD and
220

and tension ation mechanisms;
tension along ND, compression along TD and along RD may also share a common set.
he effect co ere
vestigated
Q e
to the exper
In parti seen that:
(1) The ac ms to macroscopic
principal st
(2) Small or large amount of deformation (either along the loading or along Poisson
directions during tension and compression) along the direction with which many soft
grains are aligned (e.g. RD or TD) is mainly accommodated by prism slip.
(3) Small amount of Poisson’s contraction along the hardest direction with which most
basal grains are aligned (i.e. ND) can be accommodated by basal slip. However, a large
contraction in ND (either in the loading or Poisson direction) requires the activation of
the <c+a> slip.
(4) Small or large amount of extension (either applied or Poisson) along the basal pole
direction must activate tensile twinning, which can then reorient grains into stable
orientations favoring the subsequent activation of prism slip.
(5) Both slip and twinning are important in forming the texture in the initial plastic stages,
as well as in the larger strain plastic stages.
(6) The smallest set of deformations that are necessary for the post-deformation texture
interpretations consists of prism, basal, one <c+a> slip (any one) and tensile twinning.
along RD may share a common or similar set of deform
T s of mmonly selected deformation modes in zirconium alloys w
in with the aid of texture modeling performed on an initially random texture.
explanations based on the study of individual deformation modes were givenualitativ
imental texture development.
cular, it was
tivation of deformation mechanis are directly related
rains and textures.
221

222
Pyr<a> and the other two types of <c+a> slip can be ignored if one wishes to simplify the
modeling of texture evolution.
References
[1] J. Hopwood, Proc. 26th Annual Conference of the Canadian Nuclear Society, paper P23 (2005)
[2] R.G. Ballinger, G.E. Lucas and R.M. Pelloux, J. Nucl. Mater. 126 (1984) 53-69
[3] M. Kiran Kumar, C. Vanitha, I. Samajdar, G.K. Dey, R. Tewari, D. Srivastava and S. Banerjee,
Mater. Sci. Tech. 22 (2006) 331-342
anc, Zirconium in the nuclear industry, ASTM STP 939
987) 663-672
A 234-236 (1997)
974-
AIME 239 (1967) 504-512
[12] B.A. Cheadle, C.E. Ells and W. Evans, J. Nucl. Mater. 23 (1967) 199-208
[13] E. Tenckhoff, Zeitschrift fuer metallkunde 61 (1970) 64-71
[4] R.G. Ballinger, “The anisotropic behaviour of Zircaloy-2”, Garland, New York (1979)
[5] D. Charquet, E. Alheritiere and G. Bl
(1
[6] E. Tenckhoff, Metall. Trans. A 9 (1978) 1401-1412
[7] M.J. Philippe, F. Wagner and C. Esling, in J.S. Kallend and G. Gottstein (eds.), Proc. 8th Int.
Conf. on Texture of Materials, The Metallurgical Society, Warrendale, PA, (1988) 837-842
[8] A. Salinas Rodríguez and J.J. Jonas, Metall. Trans. A 23 (1992) 271-293
[9] H. Francillette, B. Bacroix, M. Gaspérini and J.L. Béchade, Mater. Sci. Eng.
977
[10] B.A. Cheadle and C.E. Ells, Trans. TMS AIME 233 (1965) 1044-1052
[11] K.P. Steward and B.A. Cheadle, Trans. TMS
[14] E. Tenckhoff and P.L. Rittenhouse, Zeitschrift fuer Metallkunde 63 (1972) 83-88
[15] V.M. Allen, M. Preuss, J.D. Robson and R.J. Comstock, Mater. Sci. Forum 495-497 (2005)
675-680
[16] M.L. Picklesimer, Electrochem. Tech. 4 (1966) 289-300

223
[18] E. Tenckhoff, ASTM STP 966, ASTM International, West Conshohocken, PA (1988)
[19] E. Tenckhoff, J. ASTM Inter. 2 (2005) 1-26
[20] K. L. Murty and I. Charit, Prog. Nucl. Engergy 48 (2006) 325-359
[21] J.H. Keeler, W.R. Hibbard and B.F. Decker, Trans. Met. Soc. AIME 197 (1953) 932-936
[22] J.H. Keeler and A.H. Geisler, Trans. Met. Soc. AIME 203 (1955) 57-60
[17] K. Källström, Can. Metall. Quart. 11 (1972) 185-198
[23]
[26] E. Tenckhoff and P.L. Rittenhouse, ASTM STP. 458 (1969) 50-67
[27] J.A. Jensen and W.A. Backofen, Can. Met. Quart. 11 (1972) 39-51
[28] E. Tenckhoff, Zeitschrift fur Metallkunde 63 (1972) 192-197
ee, J. Nucl. Mater. 37 (1970) 159-170
1] I.A. Yakubtsov, unpublished data (2006)
and R.B. Von Dreele, General Structure Analysis System, Report No. LAUR
(199
[37] M.J. Philippe, C. Esling and B. Hocheid, Textures and Microstructures 7 (1988) 265-301
[38] C.N. Tomé, R.A. Lebensohn and U.F. Kocks, Acta Metall. Mater. 39 (1991) 2667-2680
D. Charquet, E. Alheritiere and G. Blanc, Zirconium in the nuclear industry, ASTM STP 939
(1987) 663-672
[24] E. Tenckhoff and P.L. Rittenhouse, J. Nucl. Mater. 35 (1970) 14-23
[25] D.O. Hobson, ASTM STP. 458 (1969) 37-49
[29] R.G. Ballinger and R.M. Pelloux, J. Nucl. Mater. 97 (1981) 231-253
[30] D. L
[3
[32] A.C. Larson
4) 86-748.
[33] C.G. Windsor, Pulsed neutron scattering. London: Taylor and Francis (1981)
[34] R.A. Lebensohn and C.N. Tomé, Acta metal. Mater. 41 (1993) 2611-2624
[35] R.A. Lebensohn and C.N. Tomé, Mater. Sci. Eng. A 175 (1994) 71-82
[36] M.L. Picklesimer and Electrochem. Tech. 4 (1966) 289-300

224
This page is blank.

Chapter 8
Modeling Texture Evolution during Uni-axial Loading of Zircaloy-2
Texture is an important factor in engineering design of structural components in nuclear
reactors, especially for hcp materials. An understanding was developed concerning the
texture evolution in Zircaloy-2 using a visco-plastic self-consistent model, based on an
extensive data set achieved through in-situ and ex-situ neutron diffraction measurements.
In the model, the influences of prism slip, basal slip, pyramidal <c+a> slip and tensile
twinning were considered. The model parameters were adjusted to obtain a
simultaneous ‘best-fit’ to the flow curves, Lankford coefficients, development of texture
coefficients in three dimensions and texture development, for specimens compressed or
pulled in three principal directions relative to the slab texture. The texture formation
was found to be directly related to the activation of different deformation mechanisms.
Pyramidal <a> slip was unnecessary in the modeling. Accounting for interactions
between deformation systems was found to be critical to correctly predicting texture
development and flow curves. This study provides further understanding on the plastic
deformation of Zircaloy-2.
8.1 Introduction
Zircaloy-2 has a stable α-phase (hcp) at room temperature [ 1 ] and is highly
anisotropic in its thermal, elastic and plastic properties, both at the single crystal and
polycrystal levels. The anisotropy at the single crystal level can lead to the formation of
225

texture in the polycrystal during manufacturing. Texture development in zirconium
reactor components can greatly affect their in-service performance, in particular
influencing delayed hydride cracking, dimensional stability and fracture. Thus studies on
texture evolution are of practical significance. This introduces the study of texture
development during deformation of a warm rolled Zircaloy-2 slab.
The understanding of operating deformation mechanisms in Zircaloy-2 is incomplete.
At room temperature, it is well known that prism <a> slip { 0110 }< 0211 > is the primary
deformation mode, while pyramidal <c+a> slip < 3211 > on the { 1110 } or { 1211 } plane,
and/or tensile twinning { 2110 }< 1110 > must occur to accommodate the plastic
deformation along the c-axis [2]. The inclusion of basal <a> slip {0001}< 0211 > in
polycrystalline modeling has been shown to help improve the agreement between the
model and experiment for texture modeling [e.g. 3 ,4 ,5 ,6], but there is no direct
experimental evidence for basal slip in polycrystal Zr alloys at room temperature,
although under other circumstances it may occur. Other possible slip modes include
pyramidal <a> slip { 1110 }< 0211 > and pyramidal <c+a> slip { 2211 }< 3211 > (see
Chapter 2).
In this chapter the texture development is linked with active deformation
mechanisms. Such a link is rather difficult to establish based entirely upon experiments,
such as transmission electron microscopy (TEM) analysis and slip trace analysis [7].
There has been limited success in modeling texture development for hcp materials in
general and Zr alloys in particular (due to twinning that is usually present). The
obstacles mainly arise from limited experimental data that fails to provide adequate
constraints on the parameters used in the model, and the large number of undetermined
226

model parameters (e.g. CRSSs and hardening parameters).
8.2 Procedures
The source material is a piece of 70mm thick Zircaloy-2 slab. The composition is Zr,
1.43-1.45 wt% Sn, 0.13-0.14 wt% Fe, 0.1 wt% Cr, 0.05 wt% Ni, 1260-1440 wt ppm O,
150-160 wt ppm C. The slab was warm rolled at ~700K, which induced recrystallization,
and cooled to room temperature. The grains are nearly equi-axed with an average size
of ~20μm and have a very low dislocation density. As manufactured, most basal plane
normals are orientated along the normal direction (ND), with a spread of ±50° towards
the transverse direction (TD) and ±30° towards the rolling direction (RD). The { 0110 }
normals are moderately concentrated ±30° away from RD [8], Fig. 8-1.
(a) (b)
RD
ND TD
Fig. 8-1 Experimental pole figures of the Zircaloy-2 slab [8]: (a) (0002) (b) { 0110 }
Specimens were cut from the slab in three principal directions relative to the slab
texture. Nine specimens were prepared for tension and six for compression, three and
two being along ND, TD and RD, respectively. In-situ neutron diffraction
measurements were performed for the nine tension tests at the L-3 beam line, the
National Research Universal (NRU) reactor, Chalk River Laboratories (constant
227

wavelength source) and for the compression tests at the Engin-X beam line, ISIS,
Rutherford Appleton Laboratory (time-of-flight source), respectively. The experimental
details and measured internal strains were reported in Chapter 4. EBSD studies by
scanning electron microscopy have revealed relatively large tensile twins, and TEM
observations have shown a significant number of fine tensile twins in the specimens
compressed along RD, compressed along TD and pulled along ND, Chapter 7. No
evidence of any type of compression twins was found. Here the texture development
is concerned, which was tracked by analyzing the development of intensity of the various
crystallographic planes used to measure the lattice strain during deformation. Pole
figures (PFs) were subsequently measured for the deformed specimens at the E-3 beam
line at the NRU reactor. The complete experimental intensity (or texture coefficient)
and texture data were presented in Chapter 7.
The texture development is interpreted in terms of active slip and twinning modes
usin
mac
g a visco-plastic self-consistent (VPSC) model [9]. This complements the previous
analysis using an elasto-plastic self-consistent (EPSC) model [10] for interpretation of
the internal strain development (Chapter 5). The active deformation modes with their
CRSSs, hardening and interaction parameters are identified to simulate the experiments.
The importance is stressed of simultaneously arriving at acceptable fit to both
roscopic responses (e.g. flow curves and Lankford coefficients1) and microscopic
behavior (i.e. texture coefficient development and post-deformation texture). The
Lankford coefficients and the history of peak intensity (or texture coefficient) changes
have never previously been treated as fitting constraints in texture modeling. Most
1 Lankford coefficient (or R-ratio) is defined as the ratio of the plastic strains in the two Poisson directions
during tension or compression. This coefficient directly reflects the plastic anisotropy of a material.
228

previous texture modeling work only considered the final texture and/or flow curves for
specimens deformed in one or two directions. The significance of considering anisotropic
latent hardening due to interactions between deformation modes (‘slip-slip’ and
‘slip-twinning’) is also stressed. This has been realized previously [e.g. 3,11]; however,
in practice, such hardening effects have seldom been studied, because the data sets used
have been too small to constrain a large number of parameters leading to ambiguity as to
the uniqueness of the parameters so obtained. The anisotropic barrier effect of twinning
on slip/twinning was accounted for by several workers [e.g.12], but that of ‘slip-slip’
interaction has never been considered. The large experimental data set allows to
constrain a large number of parameters, lending confidence to the derived characteristics
of the active deformation mechanisms.
8.3 Modeling
C model, each grain is treated as a visco-plastic ellipsoidal inclusion
emb
s se
In the VPS
edded in, and interacting with, a homogeneous effective medium (HEM) that
represents the polycrystal aggregate. The strength of interaction between the inclusion
and HEM is represented by the interaction parameter effn [13] (no equivalent parameter
is present in the EPSC code used). This parameter wa t to 10 (which is hardwired in
VPSC) in the calculations, representing a compromise between the rigid upper-bound
approximation and softer approximations such as the tangent self-consistent model [14].
Each of the deformation modes was assumed to be fairly rate insensitive, i.e. stress
exponent, n (the inverse of the strain rate sensitivity), was set to 20 [14]. Choosing the
n-value was constrained by two facts: (1) n must not be greater than 20 in VPSC in order
229

to maintain the validity of the basic formula in the model [9], and (2) the strain rate
exponent during the external loading is around 0.025-0.030 (i.e. n ~30-40) (see Chapter
4).
The model allows for the hardening of individual deformation systems, described
(8-1)
where is the instantaneous CRSS, and a l
troducing coupling
coef
with an extended Voce hardening law [15]:
( 110ssss θτττ Γ++= )]/exp(1)[ 10
ss τθ Γ−−
sτ
trap
s0τ
s0
ss10 ττ +
s1θ are
ar
re the initial and fina
back-ex olated CRSSs, respectively, θ and the initial and asymptotic
hardening rates, and Γ is the accumulated plastic sh in the grain.
The model also allows for ‘self’ and ‘latent’ hardening by in
e
ficients ssh ′/ which empirically account for the obstacles that dislocations in system
s' represent to the propagation of dislocations in system s [9]:
∑′
′′ ssss
s dτ / ΔΓ
=Δs
hd
γτ (8-2)
The occurrence of twinning not only significantly changes the texture by reorienting
the
escribed with
Van
twinned volumes relative to the matrix, but also introduces effective barriers for the
propagation of dislocations and for the activation of other twins [9,16]. This barrier
effect on slip and twinning systems are described empirically by Eq. (8-2).
The contribution of twinning to texture development in VPSC can be d
Houtte’s model, the predominant twin reorientation (PTR) scheme, and the volume
fraction transfer scheme [17]. Embedded in the code of VPSC Version 6, the PTR
scheme is used. Within each grain, the twinned volume fraction is monitored with
respect to the shear strain. The sum over all twin systems of a certain kind and over all
230

grains represents the accumulated twin fraction accV in the aggregate. After each
strain step, the grains are polled randomly to check whether or not the volume fraction of
the predominant twinning system exceeds a threshold value. If so, the entire grain is
reoriented to a new orientation reflective of this reoriented crystallite and is then added to
a quantity ‘effective twinned fraction ( effV )’. This polling process continues until either
all the grains are checked in a random order or effV exceeds accV [16]. The twinned
grains are prohibited to undergo a second reorientation by twinning. The threshold value
typically starts at 10-25% ( 1thA ) and rapidly stabilizes at 50-60% ( 1thA + 2thA ) of grain
volume [16]. In this work, 1 and 2thA were treated as fitting pa eters.
The initial texture of the Zircaloy-2 slab is represented by an aggregate
thA ram
of 15456
disc
minimum necessary deformation mechanisms
to f
rete orientations (5° × 5° × 5° grid in the Euler space). Each is represented by a
spherical inclusion. The boundary condition was set to uni-axial compression or tension,
and the incremental strain step was 0.001.
In Chapter 7 it was concluded that the
it the texture data are prism slip (pr), basal slip (bas), pyr<c+a> slip (pyca) and tensile
twinning (ttw). Pyr<a> slip (pya) has been considered in the texture modeling
previously, and thus its influence was considered in this work. For simplicity four slip
and twinning modes are considered: prism slip, basal slip, pyr<c+a> slip on the plane
}1110{ and tensile twinning. The influence of pyr<a> slip and other types of <c+a> slip
e discussed in Section 8.5.1. The Voce hardening parameters, 0τ , 1τ , 0θ and
θ , and the latent hardening parameters, for each of the four modes were at as tting
ameters. Due to the large number of fitting parameters, testing the validity of all the
parameter combinations against the experimental data is impractical. An ideal way is to
will b
par
1 tre ed fi
231

use a numerical optimization method to automatically find the best set. However such a
method has its own computational demands and complications (e.g. avoiding false
minima) and such a task would represent a Ph.D. project in itself and will not be
attempted here. For the current work, the parameter set was determined through
iterative ‘manual’ fitting of the experimental data. This task was in part fulfilled by
taking advantage of the initial texture, which allows the hardening parameters of
particular deformation modes to be tuned in a relatively independent manner.
The ranges ([min-max] GPa) of 0τ given in Chapter 6 for each of the slip modes are
considered: [0.09-0.11] for prism s , [0.14-0.17] for basal slip, and [0.32-0.36] for
pyr<c+a> slip. The range of 0
lip
τ for tensile twinning was selected as [0.18-0.28] GPa.
The parameters were incremented in coarse and subsequently fine steps for each of the
CRSSs and hardening parameters, Table 8-1.
Since testing each combination of the parameters at both coarse and fine levels (or
even at the coarse level) would place unrealistic demands on computational time (~1013
combinations for the coarse level alone), the parameters were divided into five sets, i.e.
0τ -set, 1τ -set, θ -set ( 0θ and 1θ ), thA -set ( 1thA and 2thA ) and h-set (all the latent
rdeni para eters), nd te ed each set at the co level first. This strategy
considerably reduced the number of test combinations. The six loading cases were also
divided into two groups according to the experimental evidence (see Chapter 7), i.e. the
‘slip-group’ in which only negligible twinning occurs, i.e. Comp.ND, Tens.TD and
Tens.RD, and the ‘twinning-group’ in which a certain amount of twinning occurs, i.e.
Tens.ND, Comp.TD and Comp.RD.
First, a set of parameters shown
ha ng m a st arse
in Table 5-1 in Chapter 5, except the 0τ -set
232

par and ameters, were borrowed, and all the h values were assigned to 1.0. 1thA
1thA + 2thA were arbitrarily set to 0.1 and 0.5 (according to Refs. [9,12,16]), respectively.
The 0τ -se
of
t was then tested at the coarse level to roughly capture the experimental yield
stress each of the six loading cases.
Second, only the slip-group loadin θg cases were considered. The -set was tested at
ations
the
the
coarse level to roughly capture the hardening behavior of the flow curves.
Third, again only the slip-group was considered. Reasonable combin for
0τ -set and for the θ -set as obtained above, plus 1τ -set parameters, were tuned at the
coarse level to roughly capture the experimental Lankford coefficients.
Fourth, only the twinning-group was considered. Twinning related parameters other
evel
ere tu t the
cess was performed on an initial texture represen
than
agai
fine
grai
the h values were adjusted to roughly reproduce the post-deformation textures.
Fifth, all the loading cases were considered. The h-set was tested at the coarse l
ned a
ted by 1944
nst the experimental Lankford coefficients, and then the flow curves.
Next, the above five fitting steps were repeated, but the parameters w
level. After that, these fitting steps were repeated again, but tested against all the
flow curves, Lankford coefficients, post-deformation textures and the texture coefficient
development in three directions. A ‘good-fit’ parameter set was then derived to fit the
experimental data.
All the above fitting pro
ns (i.e. 10° × 10° × 10° grid in the Euler space) rather than by 15456 grains, merely to
avoid the prohibitive computational time. This is an issue given the large number of
modeling runs required to define the optimum material parameters. After the ‘good-fit’
parameter set using the 1944-grain texture was obtained, the parameter set was ‘tuned’
233
using the 15456-grain texture to obtain the ‘best-fit’ with experiment.
The ‘best-fit’ parameters are listed in Table 8-2 and Table 8-3. It is emphasized that
this
ris
stress-strain, texture, and
acti
single set of parameters fits the complete experimental data set. The ‘good-fit’
parameter set differs from the ‘best-fit’ set only in tt0
θ and tt1
θ (for the ‘good-fit’,
ttθ =0.20 and ttθ =0.05). Note that, in principal, other parameter sets may exist giving
e to comparable agreement between model and experiment.
VPSC modeling can directly yield results of macroscopic
0 1
vities of individual deformation modes. The intensity (or grain volume fraction) data
cannot be out put directly. In order to extract this piece information that can be directly
compared with the texture coefficient development (Chapter 7), the texture data are
applied (out put by the VPSC modeling at an interval of 1% strain) in the EPSC code and
ran quick, very small strain elastic calculations. This is because the EPSC model can
calculate responses of individual grain family, e.g. lattice strain and volume fraction in a
particular sample direction. Other tools (e.g. the Preferred Orientation Package of Los
Alamos, or popLA [18]) can also be used to obtain the volume fraction information.
The spread angle in the extraction was set to 15° to avoid the scarcity of the number of
grain orientations that may be brought about by using smaller angles. The relative
experimental texture coefficients can be directly compared to the relative calculated
volume fraction for each diffraction peak, in that both of them reflect the changes in the
proportion of the grain volume fractions that diffract. Presented in this chapter, both
experimental intensity and calculated volume fraction data are normalized to the
pre-deformation texture in each of the three principal directions, i.e. normalized to the
initial texture coefficient (‘mrd’, see Chapter 7) for each diffraction peak.
234

Table 8-1 Coarse and fine levels for the fitting parameters
Parame he fine level ter Coarse levels Step size at t
pr0τ (GPa) 0.09, 0 0.0.10, 0.11 05
bas0τ (GPa) 0.14, 0.15, 0.16, 0.17
6
5, 0.20
0.005
pyca0τ (GPa) 0.32, 0.33, 0.34, 0.35, 0.3 0.005
ttw0τ (GPa) 0.18, 0.23, 0.28 0.01
pr1τ (GPa) 0, 0.05, 0.10, 0.1 0.01
bas1τ (GPa) 0, 0.05, 0.10, 0.15, 0.20 two fine levels: 0.01 and 0.001
pyca1τ (GPa) 0, 0.05, 0.10, 0.15, 0.20 0.01
ttw1τ (GPa) 0, 0.05, 0.10, 0.15, 0.20 0.01
pr0θ 0, 0.5, 1.0 0.10
bas0θ 0, 0.5, 1.0 two fine levels: 0.10 and 0.01
ne levels: 0.10 and 0.01
pyca0θ 0, 0.5, 1.0 0.10
ttw0θ 0, 0.5, 1.0 0.10
prθ1 0, 0.5, 1.0 two fi
bas1θ 0, 0.5, 1.0 two fine levels: 0.10 and 0.01
pyca1θ 0, 0.5, 1.0 two fine levels: 0.10 and 0.01
ttw1θ 0, 0.5, 1.0 two fine levels: 0.10 and 0.01
1thA 0.10, 0.15, 0.20, 0.25 (No fine level)
1thA +
h
2thA 0.50, 0.55, 0.60 (No fine level)
s/pr(s=pr/bas/pyca) 0 -5, 1, 5, 10, 15, 2 1.0
h
s/bas(s=pr/bas/pyca) -5, 1, 5, 10, 15, 20 1.0
hs/pyca(s=pr/bas/pyca) -5, 1, 5, 10, 15, 20 1.0
hs/ttw(s=pr/bas/pyca) 1, 5, 10, 15, 20 1.0
235

236
Table 8-2. Critical resolved shear stresses and Voce hardening parameters
(GPa) 1τ (GPa) 0θ 1θ 0τ
prism <a> slip 0.08 0.100 0.030 0.50
basal <a 0.01 0.00
t
5 0.60
> slip 0.155 0.001
pyr<c+a> slip 0.320 0.130 0.80 0.40
ensile twinning 0.220 0.020 0.15 0.08
1th =0.1A 1thA + 2thA =
Table 8-3. Parameters d rdening due to dislocation interactions
(‘1’ means isotropic hardening)
escribing latent ha
System s hs/pr hs/bas hs/pyca hs/ttw
prism <a> slip . 12. 2. 1. 1
basal <a> slip 1.
t
1. 1. 1.
pyr<c+a> slip 1. 1. 2. 1.
ensile twinning 1. 1. 1. 2.
8.4 Comparison with experiments
Fig. 8-2 displays the calculated macroscopic flow curves superimposed with the
8.4.1 Macroscopic mechanical responses
experimental data, for compression and tension tests along three directions. The
experimental data represent the averaged stress and strain states corresponding to the
neutron diffraction measurements. Note that the starting points in the calculated curves
do not overlap the experimental ones, since the current VPSC model excludes elasticity,
and the basic formula in the model do not allow for a ‘zero’ stress. This inability also
leads to the failure in reproducing the elastic-plastic transition region. In the
fully-plastic region (>~1.5% total strain), the model reasonably captures the flow curve
for each loading case.
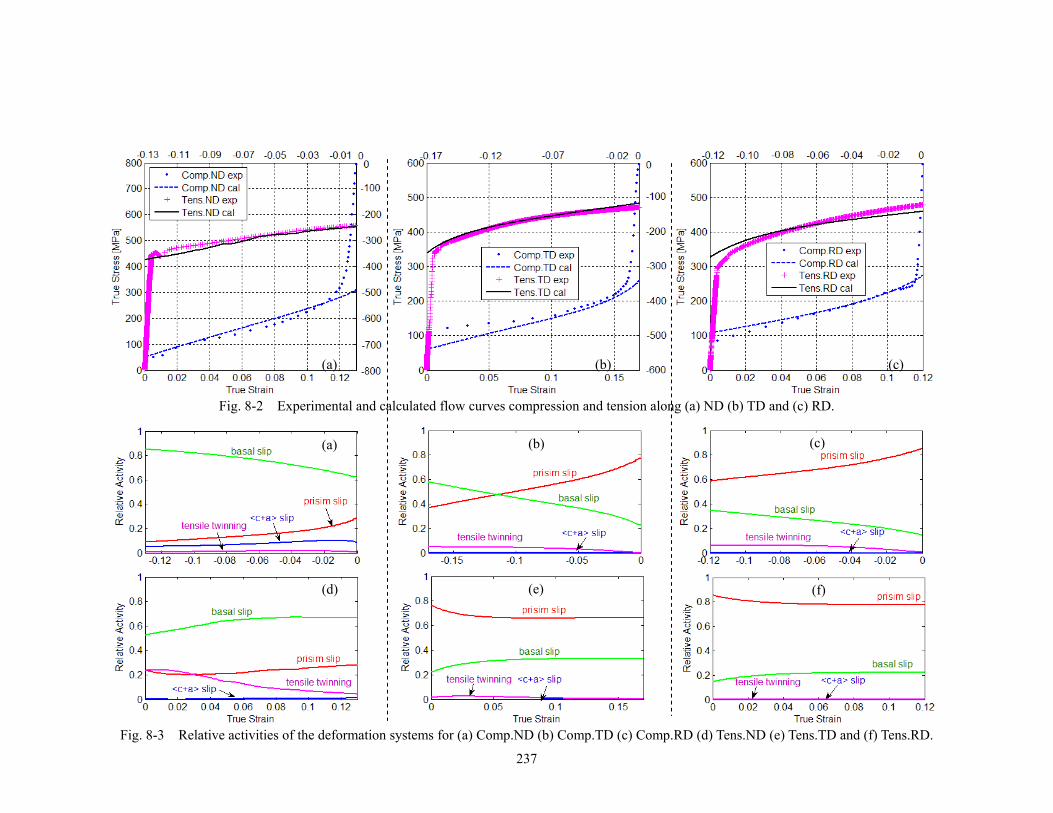
237
Fig. 8-2 Experimental and calculated flow curves compression and tension along (a) ND (b) TD and (c) RD.
(a) (b) (c)
(a)
(d)
(b)
(e)
(c)
(f)
Fig. 8-3 Relative activities of the deformation systems for (a) Comp.ND (b) Comp.TD (c) Comp.RD (d) Tens.ND (e) Tens.TD and (f) Tens.RD.

The fact that the highest yield stress occurs for loading along ND (with most c-axes),
the lowest for loading along RD (with nearly no c-axes), and an intermediate value for
loading along TD can be explained qualitatively in terms of texture. Deformation along
ND and, less so, TD requires the acti n of either <c+a> slip or twinning to deform
along the c-axis. Deformation along RD requires mainly <a> slip which is much easier to
activate.
Examining the calculated rela activities (i.e. relative plastic strains
accommodated) of individual defo ion systems (Fig. 8-3) offers a clearer
understanding of the macroscopic responses.
The modeling shows significant pyr<c+a> slip activity in Comp.ND2, while in
Tens.ND, tensile twinning is abundant. The sum of the relative activities of prism and
basal slip in Comp.ND is largely simil t in Tens.ND. Thus the higher yield stress
in Comp.ND than that in Tens.ND is at ted to the higher CRSS for pyr<c+a> slip than
that for twinning. The higher hardening rate in Comp.ND than that in Tens.ND is due to
the quicker hardening of the <c+a> slip than the other modes (i.e.
vatio
tive
rmat
ar to
tribu
hat
1θ is much higher for
pyr<c+a> than that for the other modes
Negligible twinning and <c+a> slip are predicted in Tens.TD and Tens.RD; instead,
tension along these two directions is m y a modated by prism
a higher relative activity of basal slip in .TD. The higher yield stress for Tens.TD is
explained by the higher CRSS for basal slip than that for prism slip, and the lower
hardening rate in Tens.TD is possibly due to the slower hardening of basal slip as
compared to prism slip (as indicated by the
, Table 8-2).
ainl
Tens
ccom and basal slip, with
1θ values shown in Table 8-2).
2 Comp.ND (or Tens.ND) represents compressi (or tension) along ND, and so on for the other directions. on
238

The flow curves for the compression and tension tests along TD are nearly identical
(with reversed signs of course). However, they can be explained in terms of different
deformation mechanisms operating (see Fig. 8-3); this also indicates that simply
reproducing the flow curves is likely to result in misleading interpretations. In
Comp.TD, the non-negligible twinning activity introduces obstacles to prism slip,
reducing the prism slip activity at large strains. A qualitatively similar hardening rate in
e applied to the flow curves observed in
com
Table 8-4. Comparison of predicted Lankford coefficients with experiments (Note: ‘Cal.’ represents
‘best-fit’ parameters given in Tables 8-2 and 8-3.)
Tens.ND Tens.TD Tens.RD Comp.ND Comp.TD Comp.RD
Comp.TD and Tens.TD occurs because Tens.TD has a higher activity of prism slip
(hardens more quickly than basal slip), but Comp.TD has more twins (present obstacles
to prism slip). Similar explanations can b
pression and tension along RD.
The ‘best-fit’ model reproduces the Lankford coefficients (or the degree of
macroscopic plastic anisotropy) well, with the highest in Tens.TD, followed by that in
Tens.RD, Comp.TD, Comp.RD and Tens.ND or Comp.ND (Table 8-4, ‘best’).
the model results. The ‘best’-‘pr+bas+pyca+ttw’ set represents the coefficients calculated using the
TDRD εε : NDRD εε : NDTD εε : TDRD εε : NDRD εε : NDTD εε :
Experimental 1.13 3.46 2.61 1.01 2.29 1.42
Cal. –VPSC ‘best’ 1.01 3.05 2.74 1.32 2.16 1.58
Cal. –VPSC * 1.05 7.50 4.48 2.18 9.94 4.54
Cal. –VPSC * 1.02 2.98 2.80 1.25 2.30 2.02
Cal.–EPSC(Chap5) 1.05 3.08 2.78 1.04 2.04
‘pr+bas+pyca+ttw’
‘pr+pya+pyca+ttw’
‘Iso-LH’ **
1.69
* will be discussed in Section 8.5. ** Iso-LH: isotropic latent hardening, i.e. all h=1.
239

8.4.2
ed specimens (using the model parameters labeled
as t
ntrations
of the texture components and major changes associated with tensile twinning.
H
assumption of the unif ]. According to the
homogeneity’ ass e nt d h
, even
inte with the same kind of neighbourin
erently, resulting in more spread in the final positions for one orientation
vely mild texture, as apposed to the predictions. In the tables, calculated
in deformation modes inactive are also shown, which can contribute to
Development of texture
Fig. 8-4 to Fig. 8-9 compare the calculated and experimental development of the
texture coefficients in three dimensions for all the measured crystallographic planes. In
general the figures show agreement between the model and experiments which is
acceptable for each of loading cases. The developing trends for all the crystallographic
planes, especially for those showing gradual and monotonic changes in texture coefficient,
are well captured. However, the agreement is less satisfactory for some of the basal and
prism planes in the cases where significant twinning is involved, e.g. (0002) in
Comp.RD/ND and Tens.ND/ND.
Predicted textures for the deform
he ‘best’ in Table 8-2 and Table 8-3) are compared with their experimental
counterparts in Fig. 8-10 and Fig. 8-11. In general, the model qualitatively captures the
main features of the PFs, i.e. the positions of the maximum and minimum conce
owever, the predicted textures are sharper in most cases. This is partially due to the
orm response of the HEM in the model [19
‘ umption, grains in th same orie ation shoul behave in t e same
manner. In a physical polycrystal, however with the same orientation, each grain is
very unlikely to ract g grains, thus it should be
reoriented diff
and thus relati
PFs with certa
understanding the texture formation.
240

241
(a)
(b)
(c) Fig. 8-4 Development of texture coefficients for compression along ND (test direction/measured
direction): (a) ND/ND (b) ND/TD (c) ND/RD.
Text
ure
coef
ficie
nt (m
rd)
Text
ure
coef
ficie
nt (m
rd)
Text
ure
coef
ficie
nt (m
rd)
Text
ure
coef
ficie
nt (m
rd)
Text
ure
coef
ficie
nt (m
rd)
Text
ure
coef
ficie
nt (m
rd)

(a)
(b)
(c)
texture coefficients for compression along TD: TD/RD
Fig. 8-5 Development of (a) TD/ND (b) TD/TD (c)
Text
ure
coef
ficie
nt (m
rd)
Text
ure
coef
ficie
nt (m
rd)
Text
ure
coef
ficie
nt (m
rd)
Text
ure
coef
ficie
nt (m
rd)
Text
ure
coef
ficie
nt (m
rd)
Text
ure
coef
ficie
nt (m
rd)
242
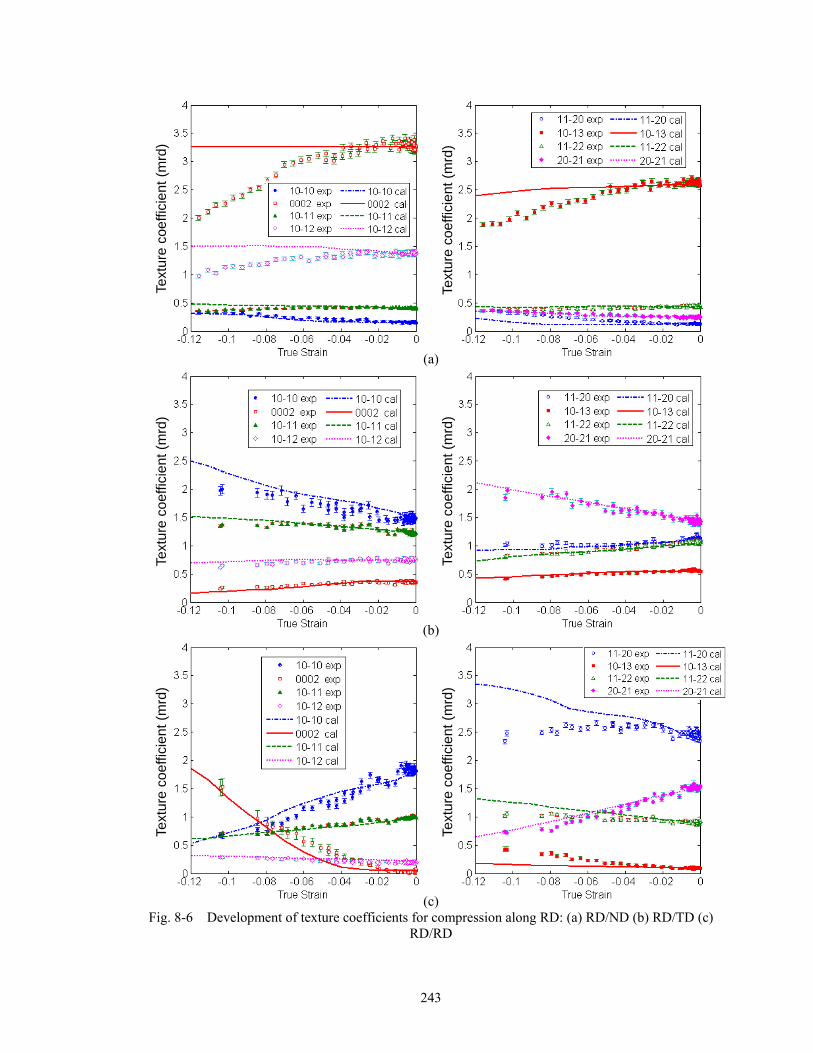
243
(a)
Text
ure
coef
ficie
nt (m
rd)
Text
ure
coef
ficie
nt (m
rd)
(b)
Text
ure
coef
ficie
nt (m
rd)
Text
ure
coef
ficie
nt (m
rd)
(c)
Text
ure
coef
ficie
nt (m
rd)
Text
ure
coef
ficie
nt (m
rd)
Fig. 8-6 Development of texture coefficients for ompression along RD: (a) RD/ND (b) RD/TD (c) c
RD/RD

a) b) c) Fig. 8-7 Development of texture coefficients for tension along ND: (a) ND/ND (b) ND/TD (c) ND/RD
a) b) c) Fig. 8-8 Development of texture coefficients for tension along TD: (a) TD/ND (b) TD/TD (c) TD/RD
Text
ure
coef
ficie
nt(m
rd)
Text
ure
coef
ficie
nt (m
rd)
Text
ure
coef
ficie
nt (m
rd)
Text
ure
coef
ficie
nt(m
rd)
Text
ure
coef
ficie
nt (m
rd)
Text
ure
coef
ficie
nt (m
rd)
244

245
a) b) c)
Fig. 8-9 Development of texture coefficients for tension along RD: (a) RD/ND (b) RD/TD (c) RD/RD
Text
ure
coef
ficie
nt (m
rd)
Text
ure
coef
ficie
nt (m
rd)
Text
ure
coef
ficie
nt (m
rd)

Loading Experiment ‘best-fit’ No prism slip twinning
No pyr<c+a> or twinning
Iso-LH * or
Comp.ND
Comp.TD Comp.RD Tens. ND Tens. TD Tens. RD
(black dots represent mrd<0.5)
* will be discussed in Section 8.5.2 (Iso-LH: ropic latent hardening)
Fig. 8-10 Comparison of the pr d
isot
edicte }0110{ pole figures with experiments
246

Loading Experiment ‘best-fit’ No basal slip or twinning
No pyr<c+a> or twinning
Iso-LH *
Comp.ND
Comp.TD Comp.RD Tens. ND Tens. TD Tens. RD
(black dots represent mrd<0.5)
* will be discussed in Section 8.5.2 (Iso-LH: isotropic latent hardening)
Fig. 8-11 Comparison of the predicted pole figures with experiments (0002)
247

The texture development can be underst paring the PFs as follows:
(1) Comp.ND
e
ood by com
� Th initial max { 01 } conc10 ent d gth his is
to prism slip, without which the max concentrations will move to other positions.
re basal normals cluster close to ND than initially, but in general the basal
norm l distribution around ND does not change significantly. Basal slip reorients basal
owards ND while the <c+a> slip does the opposite. These two slip modes
ork to roughly maintain the original basal normal distribution.
Tens.RD
� The six-fold symmetry about ND of the {
rations aroun RD are stren ened. T due
� Mo
a
normals t
w
(2) Comp.TD and
0110 } lobes at the PF rim is brought
bout by prism slip.
� The basal normal spread around ND expands in the ND-TD plane, but contracts in
e ND-RD plane. This is caused by basal slip.
e appearance of the basal normals near TD in Comp.TD is induced by tensile
inning.
he split of the basal normal spread near ND towards TD in Comp.TD is
controlled by basal slip
� The six-fold symmetry about ND of the {
a
th
� Th
tw
� T
.
(3) Comp.RD and Tens.TD
0110 } lobes at the PF rim is brought
bout by prism slip.
� The basal normal spread around ND contracts in the ND-TD plane, but expands in
e ND-RD plane. This is caused by basal slip.
� The appearance of the basal normals near RD in Comp.RD is induced by tensile
a
th
248

twin
ning.
(4) Tens.ND
� { 0110 } maxima are tilted towards ±60º from ND in the ND-RD plane (more
clearly seen in Fig. 7-5k, Chapter 7) by prism slip.
� The basal normal distribution around ND spreads more towards TD than towards
RD as a result of basal slip (due to the more difficult deformation along TD, especially at
the early stage of plastic deformation), with the central maximum splitting into two
maxima in the ND-TD plane. This has resulted in the discontinuous distribution of the
RD, i.e. most near RD but a few exactly along RD (more
clea ly,
twinned basal grains around
rly seen in Fig. 7-5l, Chapter 7). According { 0110 } normals around RD are
twinned to the ND-TD plane, again with a discontinuous distribution.
re considered, simultaneously achieving acceptable agreement between
mod
tion texture and the development of texture coefficient. In this
the activation of other slip modes, and the importance of
anis acti
to explain the less satisfactory agreement in the loading cases where
non
8.5.1 Possible activation of pyr<a> and other types of pyr<c+a> slip
Chapter 7 shows that pyr<a> slip operates in a largely similar manner to prism slip,
8.5 Discussion
In Section 8.4, the influences of prism slip, basal slip, <c+a> slip and tensile
twinning we
el and experiment for each of the loading cases, in terms of the flow curve, Lankford
coefficient, post-deforma
section, the possibilities of
otropic latent hardening due to dislocation inter ons will be considered. Possible
reasons will be given
-negligible twinning is involved.
249

and to a limited extent similarly to basal slip, in controlling the texture evolution for a
e. Here, the effect of pyr<a> slip is illustrated by replacing basal slip with
ation mode and must occur.
Seco
simu t of the ro basal slip in reorien ing basal normals as shown in Chapter 7,
ble L ord co ficients, must be set as low as 0.05GPa (other
para
Replacing the pyr<c+a> slip on {
random textur
pyr<a> slip in the ‘best’ parameter set. Basal, rather than prism slip has been replaced
for two reasons. First, prism slip is the primary deform
nd, some other workers chose pyr<a> rather than basal slip for the modeling.
A combination of pr0τ =0.08, pya
0τ =0.15, pyca0τ =0.25 and ttw
0τ =0.17GPa can result
in acceptable flow curve and final texture for each of the six loading cases,
simultaneously. However, the predicted Lankford coefficients deviate far from
experiments (Table 8-4), and they cannot be improved by simply tuning the parameters
without including basal slip. This test clearly highlights the importance of considering
Lankford coefficients as modeling constraints. Although a highly active pyr<a> slip can
late par les of
ankf
t
pya0τ to achieve reasona ef
meters are the same as shown in Table 8-2 except without basal slip), which is
unreasonable as it is much lower than pr0τ . Hence, while it is essential to include basal
slip, it is not necessary to include pyr<a> in the model, its effect being similar to a
combination of prism and basal slip (mainly prism slip). This is consistent with the
previous conclusions based on the development of internal strains in the material
(Chapter 5).
1110 } with the slip on { 1211 } or { 2211 } plane will
produce very similar results to those shown in Section 8.4.2 with respect to both macro-
slip on { 1211 } or and microscopic responses. Thus the possible activation of the <c+a>
22 } plane cannot be ruled out through modeling. 11{
250
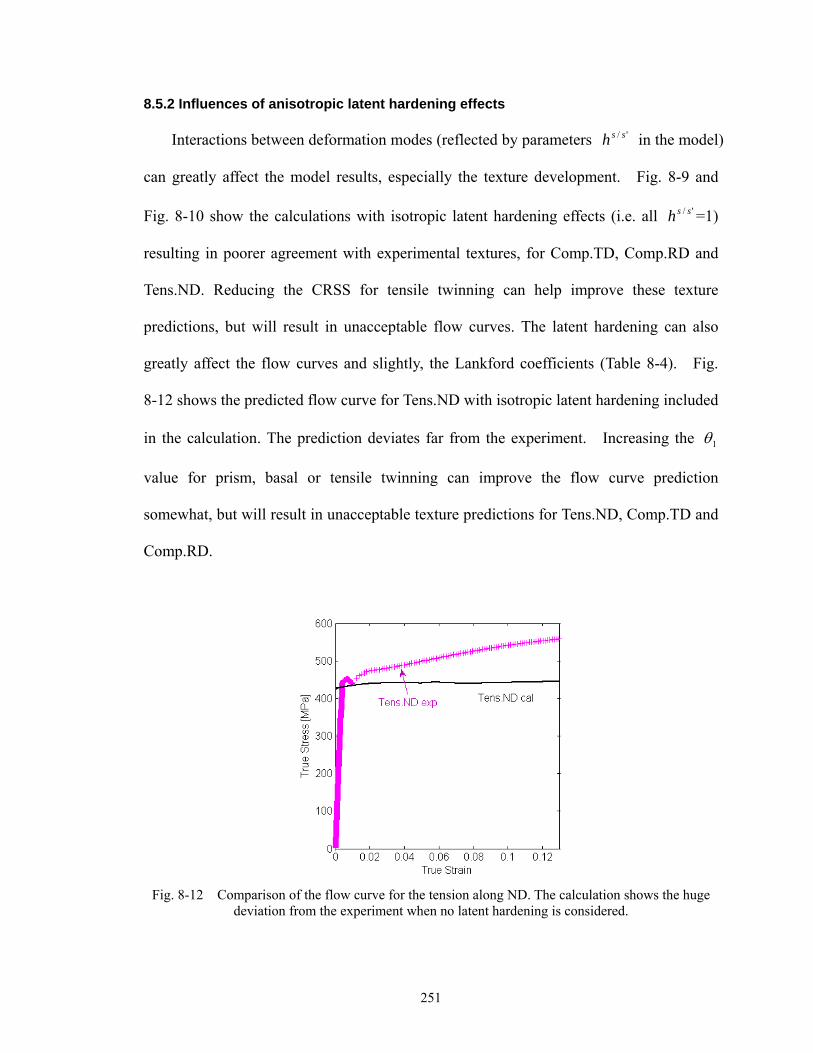
8.5.2 Influences of anisotropic latent hardening effects
Interactions between deformation modes (reflected by parameters '/ ssh in the model)
can greatly affect the model results, especially the texture development. Fig. 8-9 and
Fig. 8-10 show the calculations with isotropic latent hardening effects (i.e. all '/ ssh =1)
resulting in poorer agreement with experimental textures, for Comp.TD, Comp.RD and
Tens.ND. Reducing the CRSS for tensile twinn lp ing can he improve these texture
predictions, but will result in unacceptable flow curves. The latent hardening can also
greatly affect the flow curves and slightly, the Lankford coefficients (Table 8-4). Fig.
8-12 shows the predicted flow curve for Tens.ND with isotropic latent hardening included
in the calculation. The prediction deviates far from the experiment. Increasing the 1θ
value for prism, basal or tensile twinning can improve the flow curve prediction
somewhat, but will result in unacceptable texture predictions for Tens.ND, Comp.TD and
Comp.RD.
deviation from the experiment when no latent hardFig. 8-12 Comparison of the flow curve for the tension along ND. The calculation shows the huge
ening is considered.
251

It is emphasized that the interaction induced hardening cannot be fully represented
by simply adjusting 0θ or 1θ . The strength of interaction is very dependent on the
relative activities of each deformation system and varies significantly during
deformation.
By testing a wide combination of parameters against experimental constraints, it was
found that the importance of '/ ssh varies greatly amongst the deformation systems, in
ttwprh / ttwttw / prpr / pycapyca /
'/ ss
to interact with each other, and (3) pyr<c+a> slip is likely to interact mostly with itself.
A plausible explanation is that prism slip first interacts with itself resulting in local stress
concentratio
decreasing order of importance: , , , . For the others,
isotropic hardening (i.e. y indicate that: (1)
tensile twins build up strong obstacles to the propagation of prism slip and twinning, (2)
prism slip is easily activated resulting in high density of <a> dislocations which are likely
n that may foster the activation of tensile twinning or pyr<c+a> slip. It was
also found that basal slip does not tend to interact with itself and other slip systems. This
is inconsistent with the previous findings, Chapter 5.
8.5.3 Twinning activities
The agreement between the model and experiment, as to the development of
coefficients and final textures, is less satisfactory for the cases where substantial tensile
twinning operates, especially for Tens.ND. This may be due to the inadequacy of the
current twinning model (i.e. the PTR scheme), or the inappropriate choice of the model
p
In Tens.ND, the model predicts more tensile twins around RD than observed in the
h
=1) gives the best fit to the da
h h
ta. This mah
arameters (e.g. Ath1 and Ath2).
252

expe
in {
riment, with a nearly 100% depletion of basal normals near ND in the (0002) PF and
a substantial increase 010 } normals near ND in the {1 0110 } PF. This
over-prediction is not fully understood. The VPSC model adopts the PTR scheme to
deal with twinning such that a randomly polled grain, which is oriented favorably for
twin
lume
twinn g (i.e. the basa rains nea
ning, will be completely twinned if the twinned fraction achieves a certain threshold
value (15% of parent grain vo fraction in this research). Since initially there are a
large number of grains suitable for in l g r ND), twinning is
very active initially (see Fig. 8-3d) resulting in the rapid reduction of basal normals and
substantial increase in { 0110 } normals near ND. In contrast, during compression along
RD and TD, most of the plastic deformation can be accommodated by prism and basal
slip; the twinning activity is relatively low (see Fig. 8-3 b,c), and thus the depletion of
basal normals and substantial increase in { 0110 } normals near ND are not induced.
8.6 Conclusion
The texture development observed in rolled Zircaloy-2 slab pulled or compressed
along different directions, was interpreted with a visco-plastic self-consistent model.
al slip, pyr<c+a> slip, tensile twinning, and the hardening due
to d
low curves and post-deformation textures and multiple
testi
Prism slip, pyr<a> slip, bas
islocation interactions were considered in the model. Pyr<a> slip was found to be
unnecessary in the modeling, while the other modes are required. Hardening due to
dislocation interactions was found to be critical to the texture formation.
A more extensive data set was used to constrain the modeling parameters than in the
literature, i.e. in addition to the f
ng directions, the Lankford coefficients and development of texture coefficients for
253

254
t thu
all crystallographic planes were considered as modeling constraints. The values of the
parameters derived here mus s be considered more robust than those reported
previously. This improvement in the modeling has refined the estimates of critical
resolved shear stresses and hardening parameters, and for the first time provided
estimates of the anisotropic latent hardening parameters.
References [1] R.G. Ballinger, G.E. Lucas and R.M. Pelloux, J. Nucl. Mater. 126 (1984) 53-69
[3] H. Francillette, B. Bacr aspérini and J.L. ade, Mat. Sci. Eng. A234-236 (1997)
974-977
[4] H. Francillette, B. Bacroix, M. Gaspérini and J.L. Béchade, Acta Mater. 46 (1998) 4131-4142
[5] H. Francillette, O. Castelnau, B. Bacroix a .L. Béchade, Mat. Sci. Forum 273-275
[2] E. Tenckhoff, ASTM special technical publication, STP 966 (1988) 1916 Race Street, Philadelphia
oix, M. G Béch
nd J (1998)
28
[6] A. Salinas Rodriguez, J.J. Jonas, Metall. Trans. 23A (1992) 271-293
[7] R.W. Cahn, Acta Metall. 1 (1953) 49-70
[8] R.A
2001) 3085-3096
[13] C.N. Tomé, Mod. Sim. Mater. Sci. Eng. 7 (1999) 723-738
[14] S.R. Agnew, M.H. Yoo and C.N. Tome, Acta Mater. 49 (2001) 4277-4289
523-5
. Holt, D. Dye and R.B. Rogge, Annual Report of the National Research Council (2004)
[9] Lebensohn and Tomé, Acta Metall. Mater. 41 (1993) 2611-2624
[10] P.A. Turner and C.N. Tomé, Acta Metall. 42 (1994) 4143-4153
[11] A. Salinas Rodriguez and J.J. Jonas, in J.S. Kallend and G. Gottstein (eds.), Proc. Int. Conf. on
Texture of Materials, The Metallurgical Society, Warrendale, PA, (1988) 499-504
[12] C.N. Tomé, P.J. Maudlin, R.A. Lebensohn and G.C.Kaschner, Acta Mater. 49 (
[15] C.N. Tomé, G.R. Canova, U.F. Kocks, N. Christodoulou and J.J. Jonas, Acta Metall. 32 (1984)
1637-1653

255
[17] C.N. Tomé, R.A. Lebensohn and U.F. Kocks, Acta Mater. 39 (1991) 2667-2680
[18] J.S. Kallend, U.F. Kocks, A.D. Rollet and H.-R. Wenk, Mat. Sci. Eng. A 132 (1991) 1-11
[19] D.W. Brown, S.P. Abeln, W.R. Blumenthal, M.A.M. Bourke, M.C. Mataya and C.N. Tomé,
Metall. Mater. Trans. 36A (2005) 929-939
[16] S.R. Agnew, M.H. Yoo and C.N. Tomé, Acta Mater. 49 (2001) 4277-4289

256
This page is blank.

Chapter 9
General Discussion
9.1 Overview of the thesis
The general objective of this research was to provide a comprehensive experimental
data set to better understand the plastic deformation at the grain level in Zircaloy-2. This
has been fulfilled by investigating both lattice strain and texture development using a
combination of neutron diffraction and polycrystalline modeling. Prepared in a
manuscript form, this thesis contains independent (in some sense) but closely related
chapters, which have made the thesis an integral piece of work (see Chapter 1).
Chapter 2 presented an overview of the basic knowledge and relevant studies
pertaining to this research, which formed a basis for understanding the ensuing chapters.
Chapters 3-6 were focused on the subject of lattice strain evolution. Details of the
experimental procedures were presented, and the complete experimental data set of lattice
strain evolution was established. Interpretations of the experimental data were based on
the combination of neutron diffraction and EPSC modeling. Operative deformation
modes and their CRSSs and hardening parameters were derived.
Chapter 3 reported the lattice strain evolution observed in the loading direction
during compression along ND, TD and RD. Tensile twinning in the compression along
TD and RD was inferred and used to interpret the inflections in the (0002) strain
development. The spread of lattice strains in the test direction was found to be larger in
compression than in tension. The difference in strain distribution in tension and
compression was ascribed to the possible asymmetry of the CRSS for pyramidal <c+a>
257

slip relative to the normal stress on the slip plane, and/or the occurrence of tensile
twinning in addition to the asymmetry of thermal residual strains in the slab. The lattice
strain in newly formed twins was measured for the first time in any Zr alloy. This
measurement will provide a benchmark for the development of polycrystalline models
that provide a realistic representation of twinning by incorporating the relaxation of
stresses in parent grains and newly formed twins [1,2].
Chapter 4 presented the lattice strain development measured in the three plate
principal directions obtained during tension and compression in the three directions.
These represented the most extensive data set of lattice strains yet to be published for any
zirconium alloy, or indeed any hcp alloy. The data set formed a sound basis to
investigate the active plastic deformation mechanisms and to rigorously test plasticity
models, especially twinning models.
Chapter 5 made a contribution to the quantitative understanding of the deformation
mechanisms of Zircaloy-2 using an EPSC model. The influences of prism <a> slip, basal
<a> slip, pyramidal <c+a> slip and tensile twinning modes were considered. The critical
resolved shear stresses and hardening parameters for each mode were obtained by
simultaneously obtaining a ‘best-fit’ with the macroscopic flow curves, Lankford
coefficients and lattice elastic strain development for all measured diffraction peaks, for
the combination of three measurement directions, three loading directions, and two
mechanical loadings (i.e. compression and tension). This was the first attempt to fit such
an extensive data set. In particular, the hardening due to deformation mode interactions
was found to be important and was qualitatively estimated using the model.
258

Chapter 6 considered a variety of slip mode combinations and investigated the roles
of each slip mode in lattice strain development. It was concluded that there is evidence
that basal slip must occur, while the effects which might be attributed to pyramidal <a>
slip can be represented by the influence of other combinations of slip modes. Reasonable
ranges of CRSSs for the commonly selected slip modes were derived. This would benefit
the modeling of Zircaloy-2 and its sister alloys.
Chapters 7-8 were focused on the subject of texture evolution. This allowed a
different approach to understand the deformation mechanisms from that used in Chapters
3-6.
Chapter 7 presented a complete data set of the intensity (or texture coefficient)
development during deformation and the measured textures after deformation.
Qualitative interpretations for the texture formation were provided, which were based on
a systematic investigation of the effects of individual deformation modes. The smallest
set of deformation modes comprising prism slip, basal slip, pyramidal <c+a> slip and
tensile twinning was inferred to facilitate implementation of plasticity models for a
further quantitative interpretation.
Chapter 8 developed a quantitative understanding of the texture formation using a
VPSC model. The influences of prism slip, basal slip, pyramidal <c+a> slip and tensile
twinning were considered. The model parameters were adjusted to obtain a simultaneous
‘best-fit’ to the flow curves, Lankford coefficients, the development of texture
coefficients in three directions and post-deformation textures, for specimens compressed
or pulled in three principal directions relative to the slab texture. The modeling was
improved compared to the literature in that a more extensive data set was used to
259

constrain the modeling parameters. This improvement in the modeling helped refine the
CRSSs and hardening parameters, and estimate the latent hardening effects due to
deformation mode interactions.
Appendix A presented the measurement of thermal residual strains in the as-received
Zircaloy-2 slab, which formed one of the bases of the lattice strain modeling, and helped
explain the discrepancy in the spread of lattice strains reported in Chapter 3. Appendices
B and C are manuscripts presented at the Canadian Nuclear Society conferences, which
represent the preliminary results concerning the lattice strain modeling and texture
modeling, respectively. Appendix D presented the measured post-deformation pole
figures that had not been shown in the main chapters.
9.2 Comparison of derived characteristics of deformation mechanisms
9.2.1 Comparing EPSC and VPSC modeling results
Both EPSC and VPSC are self-consistent polycrystalline models that are based on
the assumption of an Eshelby inclusion being surrounded by and interacting with the
surrounding homogeneous effective medium (HEM). Specifically, in both models the
single crystal plastic deformation is characterized by the activation of multiple slip and/or
twinning modes. Thus one would expect that the single crystal properties derived from
the two models should be largely consistent with each other. However, the models are
different from each other as to the representation of the inclusion, interaction and HEM,
for which EPSC uses an elasto-plastic description while VPSC uses a visco-plastic one.
Aside from this difference, there are certain limitations with the models as discussed in
the literature review. As a result, it is natural that the derived characteristics of
deformation mechanisms from the two models are not perfectly matching.
260

Both models have demonstrated (1) the necessity of including prism, basal,
pyr<c+a> slip, and twinning, especially the inclusions of basal slip, (2) the necessity of
introducing Lankford coefficients as constraints to the models, and (3) the necessity of
considering the hardening due to deformation mode interactions. The models gave (1)
close CRSSs ( 0τ ’s) for the respective slip and twinning modes, Table 9-1, (2) similar
trends as to the hardening behaviour ( 1θ ) pertaining to either prism slip, basal slip or
<c+a> slip, Table 9-1, i.e. <c+a> slip hardens much more quickly than the <a> slip, (3)
similar trends with respect to the relative activities of the contributing deformation modes
under various deformation conditions relative to the parent plate, (4) similar trends as to
the latent hardening effects for most of the deformation mode interactions, Table 9-2.
Table 9-1. Critical resolved shear stresses and Voce hardening parameters
0τ (GPa) 1τ (GPa) 0θ 1θ
EPSC VPSC EPSC VPSC EPSC VPSC EPSC VPSC
prism <a> slip 0.100 0.100 0. 0.030 0.02 0.50 0.02 0.08
basal <a> slip 0.160 0.155 0. 0.001 0.02 0.01 0.02 0.00
pyr<c+a> slip 0.320 0.320 0. 0.130 0.40 0.80 0.40 0.40
tensile twinning 0.240 0.220 0. 0.020 0.10 0.15 0.10 0.08
Table 9-2. Latent hardening parameters (‘1’ represents isotropic hardening)
mode s hs/pr hs/bas hs/pyr hs/tt
EPSC VPSC EPSC VPSC EPSC VPSC EPSC VPSC
prism <a> slip 5. 2. 1. 1. 1. 1. 5. 12.
basal <a> slip 5. 1. 5. 1. 1. 1. 5. 1.
pyr<c+a> slip 1. 1. 1. 1. 1. 2. 1. 1.
tensile twinning 1. 1. 1. 1. 1. 1. 1. 2.
261
The general consistency between the two models, in terms of the derived
deformation mechanisms, the CRSSs and hardening behaviour, is significant – it strongly
supports the conclusion that the derived single crystal properties are representative of the
‘actual material’, at least within the limitations of the models’ ability to describe the
material.
From Table 9-1, it is clear that the two models yielded very close CRSSs for each of
the deformation modes. The small discrepancy in CRSS for basal slip or tensile twinning
can be attributed to the difference between the way the models handle twinning, and/or
the existing thermal residual stresses among the grains which VPSC does not account for.
The small ambiguity of the CRSSs is hard to resolve at present as the current available
models have certain deficiencies and differences.
In the EPSC model, prism slip hardens as quickly as basal slip (though both harden
very slowly, with = =0.02), while VPSC suggested a lower hardening rate for
basal slip (nearly none). As shown in Table 9-2, both models predicted strong obstacle
effects of twins to prism slip (stronger in VPSC than EPSC); however, the VPSC model
did not suggest any anisotropic latent hardening due to ‘basal/prism’, ‘basal/basal’ or
‘basal/twinning’ interactions which were revealed by the EPSC model. The VPSC model
predicted the anisotropic hardening of ‘<c+a>/<c+a>’ and ‘twinning/twinning’
interactions, while EPSC model did not support these hardening effects. It is speculated
that the VPSC results in these respects are more realistic than the EPSC results, because
VPSC is more suitable for dealing with large-strain deformation during which the
dislocation interactions and hardening are more likely to be significant. It is likely that in
pr1θ
bas1θ
262

EPSC, certain latent hardening parameters have compensated for the fact that texture
development was not represented.
Concerning the predicted relative activities of the deformation systems, both models
revealed significant twinning activity in Comp.RD, Comp.TD and Tens.ND, and the only
significant pyr<c+a> activity was in Comp.ND. Basal slip was the dominant mode in
Comp.ND and Tens.ND at large strains, as revealed by both models. The apparent
difference between the models is that prism slip was predicted by EPSC to always
activate first and accounts for 100% of the relative deformation activity initially, prior to
the activation of the other modes. In contrast, in VPSC modeling prism slip activity was
sometimes less than the other modes initially, e.g. in Comp.ND and Tens.ND. In this
respect it seems that EPSC gives more reasonable results since prism slip is most easily
activated (due to its low CRSS) and grains suitable for its activation were always present,
whatever the loading direction relative to the texture. VPSC does not account for the
initial elasto-plastic transition and thus fails to predict this dominant activation of prism
slip at the very early stage of plastic deformation.
9.2.2 Comparing derived CRSSs with the literature
CRSSs for the deformation modes given in the literature (see Table 2-4), which have
been determined using EPSC modeling, are broadly within the ranges of 90 118,
160, 237.5, 190 330, 190 240, all units in MPa. CRSSs
derived in this research (Table 9-1) fall in these ranges, respectively for each of the
modes. However, there is no single set of CRSSs in the literature closely matching the
CRSSs obtained in this study; the closest match is found with those reported by Tomé et
≤≤ pr0τ
=bas0τ =pya
0τ ≤≤ pyca0τ ≤≤ ttw
0τ
263
al. [3], which was derived by fitting to ex-situ measured residual strains accumulated
after cold rolling a Zircaloy-2 sheet by 1.5% strain, i.e. , and
MPa. In their work basal slip was not considered.
1100 =prτ
ttw0
3300 =pycaτ
2100 =ttwτ
The CRSS ratios derived from the VPSC modeling in the literature (see Table 2-5)
are mostly within the ranges of = 1: 2~5: 2~4: 2~10: 1.2~10.
The CRSS ratios derived in this research ( =1: 1.55: 3.2: 2.2) partially
agree with these ranges – the ratios for <c+a> slip and tensile twinning to prism slip are
within the literature ranges, but the ratio for CRSS of basal slip to prism slip is not.
ttwpycapyabaspr00000 :::: τττττ
pycabaspr000 ::: ττττ
The different initial material states (e.g. texture, pre-straining) can contribute in part
to differences in the CRSSs. However, more likely it is that much smaller experimental
data sets (compared to that obtained in this research) in the literature have resulted in
more ambiguous determination of the CRSSs, because the small data sets did not provide
sufficient constraints on the large number of fitting parameters.
It is emphasized that in the literature there is no single set of CRSSs (or even two
close sets) that was used to simultaneously fit with the lattice strain data using EPSC and
the texture data using VPSC. In contrast, in this research, the deformation mechanisms,
the CRSS sets, and the hardening behaviour derived from two different modeling aspects
(lattice strain or texture), are consistent with each other, and those differences which do
exist can be explained in terms of the different model assumptions. Furthermore, the
derived characteristics of deformation mechanisms are well constrained by the large data
set, and thus are more likely to be ‘real’ than those reported in the literature for smaller
data sets. This is a strong support for the validity of the derived deformation
264
mechanisms, and for the necessity of establishing a large pool of experimental data,
which highlight the two major contributions of this research.
References
[1] G. Proust, C.N. Tomé and G.C. Kaschner, Acta Mater. 55 (2007) 2137-2148
[2] R.Y. Zhang, M.R. Daymond and R.A. Holt, Mater. Sci. Eng. A (2007), doi:10.1016/
j.msea.2007.04.021
[3] C.N. Tomé, N. Christodoulou, P.A. Turner, M.A. Miller, C.H. Woo, J. Root and T.M. Holden,
J. Nucl. Mater. 227 (1996) 237-250
265

266
This page is blank.

Chapter 10
Conclusions and Future Work
10.1 Conclusions
Neutron diffraction was used to track the development of lattice strain and peak
intensity in three dimensions for various crystallographic planes in samples cut from a
rolled Zircaloy-2 slab. The samples were subject to room temperature compression or
tension in-situ in the neutron spectrometer, with the load applied in each of the three
principal directions of the slab. Textures in the deformed samples were measured using
neutron diffraction. An elasto-plastic self-consistent model and a visco-plastic self-
consistent model were used to interpret the lattice strain and texture data, respectively.
This research has led to the following original contributions:
(1) A much larger experimental data-set was established for a single material than has
previously been available. This includes the lattice strain and intensity (or texture
coefficient) development for various crystallographic planes measured in three
dimensions, the texture development, flow curves and Lankford coefficients, under
various combinations of three principal test directions and two external loading
senses. This data-set has allowed improvements in the understanding of active
deformation mechanisms using current polycrystalline models, and is now available
to other investigators to rigorously test any future plasticity models and twinning
models.
267

(2) Tensile twinning was inferred from the intensity changes and texture development to
occur during tension along the plate normal direction, and during the compression
along the rolling and transverse directions.
(3) The discrepancy in the yield stress and the spread of lattice strains observed during
tension and compression was interpreted to be a combined effect of thermal residual
stresses and different operating deformation mechanisms.
(4) The lattice strain in newly formed twins was measured for the first time in any Zr
alloy. This measurement will provide a benchmark for the development of
polycrystalline models that provide a realistic representation of twinning by
incorporating the relaxation of stresses in parent grains and newly formed twins.
(5) The minimum set of active deformation modes to interpret the plastic deformation
was found to be prism <a> slip, basal <a> slip, pyramidal <c+a> slip and tensile
twinning. The activation of basal slip was concluded to be crucial, while pyramidal
<a> slip was unnecessary in the modeling.
(6) The importance of considering Lankford coefficients as modeling constraints and
anisotropic latent hardening effects in the modeling was recognized.
(7) The CRSSs and hardening parameters were refined using separate models to simulate
the lattice strain and texture evolution. The anisotropic latent hardening effects due to
the interaction between deformation modes were qualitatively estimated.
(8) The effects of various individual slip and twinning modes in forming the texture were
investigated, benefiting the qualitative understanding of the texture development in Zr
alloys, and other hcp materials with similar c/a ratios.
268

10.2 Future work
This research has made substantial progress towards the goal of understanding the
plastic deformation in polycrystalline zirconium alloys. However, such an understanding
is still incomplete, due to the lack of both experimental data under other loading
conditions and more appropriate models for data interpretation. The following future
work is envisaged.
(1) Experimental work (e.g. by transmission electron microscopy) is needed to
confirm the presence of basal <a> slip in polycrystal Zr alloys during room temperature
deformation.
(2) It is unknown how the lattice strain and texture develop under complex multi-
axial stress/strain states, such as occurring during the necking or bending (including tube
bending) process or in plane strain conditions. In particular, it would be technologically
useful to investigate how the lattice strains develop under the severe constraints at the
front of crack tips. This would contribute to the understanding of hydride cracking in Zr
alloys, a subject that is at the forefront of the research in the nuclear industry world-wide.
(3) There is a need to investigate how the material and manufacturing parameters
influence the lattice strain evolution. Such parameters include grain shape and grain size,
alloying elements (especially oxygen), and residual stresses in materials manufactured by
routes which involve strain path changes.
(4) The lattice strain evolution at cryogenic and elevated temperatures is also
important; the former can help understand the activation of twinning from a fundamental
point of view, while the latter is an analog to the in-service conditions in a nuclear
reactor.
269

270
(5) An optimization program is needed to handle the ‘multi-variable’-‘multi-
objective’ problem in order to facilitate the fitting process using a model with such large
data sets. In particular, an appropriate method is needed to efficiently evaluate the
agreement between the model and experiment, and make sensible choices in parameters
to improve the agreement.
(6) More appropriate models (e.g. crystal plasticity model, finite element method) that
can properly deal with twinning, hardening interactions and grain reorientations are
needed for the calculations of lattice strain. In particular, modeling the process of
twinning activation and propagation, and importantly the subsequent interactions between
the twins and existing parent grains, is immediately required.

Appendix A
Thermal Residual Strains in Zircaloy-2
Thermal residual strains in anisotropic hexagonal-close-packed (hcp) materials influence
both the macroscopic (e.g. yield stress and elasto-plastic transition) [1], and microscopic
(e.g. lattice strain) [2] materials behaviour. Thus it is important to determine thermal
residual strains in the as-received Zircaloy-2 slab.
The determination of thermal strains in Zircaloy-2 is not trivial, because it is
impossible to develop truly stress-free polycrystal due to the presence of thermal and
elastic anisotropy in the hcp single crystal, which always brings about intergranular
‘mis-fits’ (or intergranular strains). Tomé et al. [3] developed a method to measure
thermal coefficients and stress-free lattice spacings, and thus thermal strains, by using a
combination of neutron diffraction and EPSC modeling.
The basic principle of the method is that, as the temperature is raised, the a- (or c-)
parameters measured at different directions (relative to the slab) for a given diffraction
plane will converge. [3]. As a result, the temperature at which the parameters all
extrapolated to the same value is the “stress-free” temperature.
The unconstrained lattice spacings at temperature T can be deduced [1] by
asfsfsfsf TTTaTa α)](1)[()( −+= (A-1)
271

csfsfsfsf TTTcTc α)](1)[()( −+= (A-2)
where is the temperature at which the lattice cell is truly stress-free (‘sf’);
and are the stress-free a- and c-spacing at temperature T, respectively;
sfT
)(Tsf
)(Tasf
ac α and
cα are the thermal expansion coefficients along a- and c-axes, respectively.
The lattice strain for plane {hkil} at a specific temperature is determined [3] as
( ) hkilsf
hkilsf
hkilhkil ddd /−=ε (A-3)
where is the strain normal to the plane {hkil}, is the actual plane spacing
measured by neutron diffraction and is the stress-free plane spacing.
hkilε hkild
hkilsfd
A cylindrical specimen 6mm tall and 6mm in diameter was cut from the as-received
Zircaloy-2 slab. A line was scribed on one end surface to represent the rolling direction
(RD). The texture of the slab is described in Chapter 1. The specimen was placed inside a
vacuum furnace which was in turn mounted in an Eulerian cradle so that the specimen
can be rotated to specific directions for neutron diffraction measurements.
The temperature was raised from room temperature 298K gradually to 850K. The
temperature of the specimen was detected by a pre-installed thermocouple in the furnace.
Neutron diffraction measurements were performed at temperatures of 298K, 398K, 498K,
598K, 698K, 798K and 850K. Then the furnace was slowly cooled down and neutron
diffraction measurements were performed at temperatures of 750K, 650K, 550K, 450K
and 350K.
At each temperature mentioned above, the (0002) plane was measured at directions
272

)0,0(),( oo=χη , and , and the)45,0( oo )60,90( oo }0110{ , }0220{ and }0211{ a
))
t
, ( and (the definition of directions (
, and (the definition of directions )90,0(),( oo=χη )90,0(),( oo=χη 60,0 oo 60,0( oo )60,90 oo )60,90 oo(( ), ),( χη is shown
in Fig. A-1).
η
χ
Incident beam
Diffracted beam
Eulerian cradle
diffractometer
RD
ND
φ
Fig. A-1 Definition of η and χ . Schematically shown in the figure, the specimen is placed such
that the dashed specimen axis (along ND) is horizontal, and represents χ =0º. One end surface was
scribed with a line representing RD. Here the scribed line is in the plane of the big circle of Eulerian
cradle, and represents η =0º. The Eulerian cradle is placed on a diffractometer which rotates to a
specified diffraction angle (φ) for measuring the desired diffraction plane. Note that ND=(0º, 0º),
RD=(0º, 90º), and TD=(90º, 90º) in ),( χη .
The plane spacing for plane {hkil} is calculated by Bragg’s law,
( )0sin2 θθλ
−=
hkilhkild (A-4)
where λ is the wavelength, which was calibrated using a standard silicon powder as
1.80031Å; hkilθ is half the measured diffraction angle; and 0θ is half the effective zero
angle off-set of the spectrometer. 0θ can be determined from the measurements of
273

}0110{ and }0220{ , i.e.
( )
( )
⎪⎪⎪
⎩
⎪⎪⎪
⎨
⎧
=
−=
−=
02200110
002200220
001100110
2
sin2
sin2
dd
d
d
θθλ
θθλ
(A-5)
Thus, 01100220
0110022000 cos2cos
sin2sin)(
θθθθ
θθ−
−=≈ tg (A-6)
For each measurement of }0110{ and }0220{ , one value of 0θ could be obtained.
These 0θ ’s were then averaged to find 0θ =0.276º.
The a and c-parameters at each temperature and measurement direction were
calculated from the measured plane spacings for }0110{ , }0220{ and }0211{ , and for
{0002}, respectively. These are plotted in Fig. A-2. Superimposed in the figure are
the fitted lattice spacings using the EPSC calculations (for the model see Chapter 2 and
Chapter 5). The thermal coefficients and stress-free lattice spacings were determined by
iteratively fitting with the experimental lattice parameters. The steps are described as
follows:
(1) Assume the stress-free temperature is 898K, according to Ref. [3];
(2) Take )898(sf =3.2427 Å, )898(sfc =5.1816 Å, aa α =5.7×10⁻⁶ K-1 and
3.10=cα ×10-6 K-1 [3] as the initial guess.
(3) Substitute the , ,)898(sfa )898(sfc aα , cα in (2) into Eqn. (A-1) and (A-2) to
calculate the and at various temperatures. Thus the stress-free plane ) csf(Tasf )(T
274

spacing for plane {hkil}, i.e. , at temperature T is known (e.g. =0.5 . hkilsfd
898(sfa
0002sfd )sfc
(4) Use EPSC to calculate the plane lattice strain for the measured directions at
temperatures from 898K to 298K, using the thermal coefficients in (2).
hkilε
(5) Plug (derived in Step 3) and (calculated in Step 4) into Eqn. (A-3) to
calculate that can be directly compared to the measured plane spacings.
hkilsfd
hkild
hkilε
(6) By adjusting the values , ,) )898(sfc aα , cα to fit with the experimental lattice
parameters, and repeating the steps (3)-(5), good agreement with the experimental data is
obtained, as shown in Fig. A-2. Thus it is believed that the initial assumption of the
stress-free temperature being 898K is reasonable. This fitting process has led to
=3.2399 Å, =5.1775 Å, )898(sfa )898(sfc aα =5.3×10⁻⁶ K-1 and cα =10.1×10⁻⁶ K-1.
The stress-free lattice parameters at room temperature are then determined as
= 3.2296 Å and =5.1461 Å. These values are consistent with those
reported in [3]. The thermal residual lattice strains for individual diffraction planes,
induced by the cooling to room temperature, were then derived and given in Table A-2.
These values are the references for the modeling of room-temperature tension or
compression using EPSC.
)298(sfa )c 298(sf
275

a-spacing derived by (10-10) diffracition
3.226
3.228
3.23
3.232
3.234
3.236
3.238
3.24
200 300 400 500 600 700 800 900 1000
Temperature (K)
d-sp
acin
g (A
)
a (10-10) at (0,90) EXP
a (10-10) at (90,90) EXPa (10-10) at (0,60) EXP
a (10-10) at (0,90) sima (10-10) at (90,90) sim
a (10-10) at (0,60) sim
(a)
a-spacing derived by (20-20) diffracition
3.226
3.228
3.23
3.232
3.234
3.236
3.238
3.24
3.242
200 300 400 500 600 700 800 900 1000
Temperature (K)
d-sp
acin
g (A
)
a (20-20) at (0,90) EXP
a (20-20) at (90,90) EXP
a (20-20) at (0,60) EXP
a (20-20) at (0,90) sim
a (20-20) at (90,90) sim
a(20-20) at (0,60) sim
(b)
Fig. A-2 (to be continued)
276

a-spacing derived by (11-20) diffracition
3.226
3.228
3.23
3.232
3.234
3.236
3.238
3.24
200 300 400 500 600 700 800 900 1000
Temperature (K)
d-sp
acin
g (A
)
a (11-20) at (0,90) EXP
a (11-20) at (90,60) EXP
a (11-20) at (90,90) EXP
a (11-20) at (0,60) EXP
a (11-20) at (0,90) sima (11-20) at (90,60) sim
a (11-20) at (90,90) sim
a (11-20) at (0,60) sim
(c)
c-spacing derived by (0002) diffracition
5.145
5.15
5.155
5.16
5.165
5.17
5.175
5.18
200 300 400 500 600 700 800 900 1000
Temperature (K)
d-sp
acin
g (A
)
c (0002) at (0,0) EXP
c (0002) at (0,45) EXP
c (0002) at (90,60) EXP
c (0002) at (0,0) sim
c (0002) at (0,45) sim
c (0002) at (90,60) sim
(d)
Fig. A-2 Lattice spacings derived by experiments (‘exp’) and simulation (‘sim’) at various
measurement directions ),( χη as a function of temperature (continued)
277

Table A-1. Residual lattice strains induced by the cooling process (unit: με)
}0110{ )0002( }1110{ }2110{ }0211{ }3110{ }2211{ }1220{
ND -963 430 -699 -317 -961 31.2 -579 -889
TD -322 990 6.6 411 -322 651 71 -230
RD -108 1170 207 598 -106 838 271 -20.5
( Note: These are the references for the modeling of room-temperature tension or compression using
EPSC. ND=normal direction, TD=transverse direction and RD=rolling direction)
Reference
[1] S.R. MacEwen, C. N. Tomé and J. Faber Jr., Acta Metall. 37 (1989) 979-989
[2] T.M. Holden, J.H. Root, R.A. Holt and P.A. Turner, J. Nucl. Mater. 304 (2002) 73-82
[3] C. N. Tomé, N. Christodoulou, P.A. Turner, M.A. Miller, C.H. Woo, J. Root and T.M. Holden, J.
Nucl. Mater. 227 (1996) 237-250
278

Appendix B
Study of In-situ Deformation of Textured Zircaloy-2 by Neutron Diffraction
Zircaloy-2, the material used in calandria tubes for CANDU reactors, has highly
anisotropic thermal, elastic and plastic properties. Much of the irradiation induced
deformation of calandria tubes is attributed to intergranular constraints (Type-2 residual
stresses) developed as a result of this anisotropy during manufacturing. A complete
understanding of the development of Type-2 stresses in Zircaloy-2 will allow the
prediction of in-reactor deformation of calandria tubes made by different manufacturing
routes. We are investigating the evolution of intergranular strains in Zircaloy-2 in-situ by
neutron diffraction during cyclic tensile deformation is investigated. Experimental
information (texture, thermal strains and flow curves) is used to derive the characteristics
of the deformation modes and their interaction that are essential to predicting the
behavior using an elasto-plastic self-consistent model. Some results of neutron diffraction
and modeling are presented.
B1. Introduction
Zircaloy-2 is a zirconium-based alloy used in calandria tubes for CANDU reactors. It
is highly anisotropic in its thermal, elastic and plastic properties because of the hcp
crystal structure of Zr and the pronounced crystallographic texture in typical components.
Much of the irradiation induced deformation of calandria tubes is attributed to
intergranular constraints (Type-2 residual stresses) which develop as a result of the
279

crystallographic anisotropy during manufacturing. A complete understanding of the
development of intergranular constraints in Zircaloy-2 will allow an improved
understanding of the plastic deformation of Zr alloys, and the prediction of in-reactor
deformation of calandria tubes made by different manufacturing routes.
Experiments on the intergranular strains in Zircaloy-2 have been reported previously
by MacEwen et al., Turner et al., Holden et al., and Pang et al. [1-4]. The thrust of
current research is to expand considerably on past work by extending the investigation to
the development of lattice strain in cyclic loading-unloading of Zircaloy-2 with
measurements taken in-situ up to a large strain of ~16%, for various combinations of
three measuring directions, three loading directions and three deformation types (tension,
compression and bending).
A piece of warm-rolled Zircaloy-2 plate is the source material, from which the test
samples were cut in the three principal orientations relative to the plate. Preliminary
studies showed that the rolled plate has relatively strong c-poles oriented in the plate
normal direction (ND), and relatively strong a-poles in the rolling direction (RD), with
moderate a-poles in the transverse direction (TD), Fig. B-1. The c-direction is the stiffest
orientation elastically. In addition slip along the c-axis requires high resolved shear
stresses, while tensile twinning is available as an alternate deformation mode. It is thus
expected that very different lattice strain evolutions will be obtained during deformations
in the three directions and under different loading conditions. For example, tensile
loading in the plate ND should strongly activate twinning, while tensile loading in RD
will cause negligible twinning. Thus a combination of measurements in the three plate
directions under the three loading conditions will provide critical information in
280

RD
ND TD
Fig. B-1 Pole figures for the Zircaloy-2 plate
understanding the performance and subsequent lifetime of the material in different
situations.
The primary objective of the study is to combine experimental techniques
(mechanical testing, neutron diffraction) and modeling approaches (polycrystalline
modeling, finite element modeling) to predict bulk plastic and intergranular elastic lattice
strains, to understand the underlying deformation mechanisms in textured Zircaloy-2
polycrystals. This research will help understand the behavior of Zircaloy-2 in various
applications, and ultimately, benefit the design and performance predictions of calandria
tubes. It is also very relevant to the sister alloy, Zircaloy-4 which is used extensively as
fuel cladding. In this paper we report the cyclic tensile tests so far completed and give
initial results of neutron diffraction and self-consistent modeling performed on the
281

samples loaded in the transverse direction (TD).
B2. Experimental details
The material used in this study was a piece of Zircaloy-2 plate with dimensions of
220mm wide × 70mm thick × 600mm long. Nine dogbone-shaped tensile samples of
6.35mm × 6.35mm cross-section were cut from the plate, with three samples each
prepared for loading along ND (ND sample), along RD (RD sample), and along TD (TD
sample). The lengths of the samples were chosen to guarantee an appropriate gauge
length to ensure a uniform texture within the irradiated volume and to avoid interference
of the neutron beam with the loading facilities. As a result, the length of the ND samples
was 67.4mm, and that for RD and TD samples was 104.8mm.
The experiments were carried out on the L-3 neutron spectrometer at NRC, Chalk
River. Monochromation of the incident beam was achieved using a (331) reflection of a
Ge single crystal. The wavelength of the incident beam was calibrated against lattice
reflections from a Si powder reference sample and found to be 1.929Å. A computer
controlled screw-driven load frame was used to produce uniform tension in the middle
part of tensile samples. The frame was placed on a high precision positioning table which
allows the sample to be centered accurately in the beam measurement position, Fig. B-2.
Universal joints were used for the tensile tests to ensure uni-axiality of loading. The
cross-head speed was about 0.48 mm/min, corresponding to a strain rate of 4×10⁻⁵ s-1.
Tensile tests were carried out under strain control, while the load was recorded. Nine
sets of measurements were performed, with three sets for each tensile loading direction as
shown in Fig. B-3: (a) with the scattering vector lying parallel to the axis of loading; (b)
282

Loading frame
Fig. B-2 The loading frame mounted on the L-3 spectrometer at NRC, Chalk River
(a) (b) (c)
Fig. B-3 Schematic setup of the tensile samples: (a) parallel to the rod axis; (b) (c) perpendicular to
the rod axis
and (c) with the scattering vectors perpendicular to the axis of loading (two transverse
directions). By doing this, it is possible to obtain measurements of the lattice strains along
the loading and two transverse directions. During each tensile test, an extensometer was
attached to the gauge length of the sample to accurately determine the accumulated
macroscopic strain.
In a typical in-situ measurement, the sample was first loaded incrementally in the
283
elastic regime. Neutron diffraction measurements were performed at load levels with an
interval of 0.25%-0.5% strain. Diffraction data were collected for the }1220{ , }0220{ ,
}2112{ , }0112{ and peaks. Above the elastic regime, relaxation due to room
temperature ‘creep’ deformation of the samples was possible, i.e., the macroscopic strain
increased significantly while the sample was held at constant load during the period
required to acquire the necessary data over all peaks. To circumvent this problem, after
yield the samples were unloaded to facilitate neutron diffraction measurements. During
each unloading stage, the sample was firstly unloaded to ~90% of the specified load, and
then fully unloaded. Diffraction measurements were performed at the ~90% and zero load
levels over all peaks. Typically, tests were interrupted 18 times at intervals of 0.75-2.5%
strain during deformation to a total engineering strain of ~16%.
}0004{
B3. Results and discussion
For all the Bragg diffraction peaks, the lattice strains due to the mechanical loading
were calculated by the equation ( ) hkilhkilhkilhkil ddd 00 /−=ε , where is the measured
lattice spacing and is the reference lattice spacing. corresponds to the zero
load and includes any residual strain effects that may have occurred before the tensile test
during plate fabrication. In this section, some results of neutron diffraction and modeling
are given for the tensile tests performed on the samples being loaded along the TD.
hkild
hkild0hkild0
The lattice strains measured in the loading direction (case TD/TD) at each applied
stress for the measured diffraction peaks are plotted in Fig. B-4a. The deviations from the
initial elastic responses for all the peaks as a function of the amount of deformation are
not far from zero, although there are some indications of positive from the
284

Lattice Strain - Applied True Stress (Tension in TD, Q//TD)
0
50
100
150
200
250
300
350
400
450
500
-0.0010 0.0000 0.0010 0.0020 0.0030 0.0040 0.0050 0.0060
Lattice Strain
App
lied
True
Stre
ss (M
Pa)
{20-21} EXP
{2-1-12} EXP{20-20} EXP
{2-1-10} EXP
{20-21} CAL{2-1-12} CAL
{20-20} CAL{2-1-10} CAL
(a)
Applied True Strain - Residual Strain (Tension in TD, Q//TD)
-0.0020
-0.0015
-0.0010
-0.0005
0.0000
0.0005
0.0010
0.0015
0.0020
0.00 0.02 0.04 0.06 0.08 0.10 0.12 0.14 0.16True Strain
Res
idua
l Stra
in
{20-21} EXP {2-1-12} EXP {20-20} EXP {2-1-10} EXP{20-21} CAL {2-1-12} CAL {20-20} CAL {2-1-10} CAL
(b)
Lattice Strain - Applied True Stress (Tension in TD, Q//RD)
0
50
100
150
200
250
300
350
400
450
500
-0.0030 -0.0020 -0.0010 0.0000 0.0010 0.0020Lattice Strain
App
lied
True
Stre
ss (M
Pa)
{20-21} EXP{2-1-12} EXP{20-20} EXP{2-1-10} EXP{20-21} CAL{2-1-12} CAL{20-20} CAL{2-1-10} CAL
(c) Fig. B-4 Development of lattice strains in TD samples
285

Applied True Strain - Residual Strain (Tension in TD, Q//RD)
-0.0020
-0.0015
-0.0010
-0.0005
0.0000
0.0005
0.0010
0.0015
0.0020
0.00 0.02 0.04 0.06 0.08 0.10 0.12 0.14 0.16
True Strain
Res
idua
l Stra
in
{20-21} EXP {2-1-12} EXP {20-20} EXP {2-1-10} EXP{20-21} CAL {2-1-12} CAL {20-20} CAL {2-1-10} CAL
(d) Lattice Strain - Applied True Stress(Tension in TD, Q//ND)
0
50
100
150
200
250
300
350
400
450
500
-0.0030 -0.0020 -0.0010 0.0000 0.0010 0.0020Lattice Strain
App
lied
True
Stre
ss (M
Pa)
{0004} EXP{20-21} EXP{2-1-12} EXP{2-1-10} EXP{0004} CAL{20-21} CAL{2-1-12} CAL{2-1-10} CAL
(e)
Applied True Strain - Residual Strain (Tension in TD, Q//ND)
-0.0020
-0.0015
-0.0010
-0.0005
0.0000
0.0005
0.0010
0.0015
0.0020
0.0025
0.0030
0.0035
0.00 0.02 0.04 0.06 0.08 0.10 0.12 0.14 0.16
True Strain
Res
idua
l Stra
in
{0004} EXP {20-21} EXP {2-1-12} EXP {2-1-10} CAL{0004} CAL {20-21} CAL {2-1-12} CAL {2-1-10} CAL
(f)
Fig. B-4 Development of lattice strains in TD samples (continued)
286

}1220{ peak and negative deviation for }0220{ and }0112{ . The applied stress versus
lattice strain for the measurements in the two directions transverse to the loading
direction (which was in the TD), i.e. parallel to the RD (case TD/RD) and parallel to the
ND (case TD/ND) respectively are plotted in Fig. B-4c and 4e. These figures show that
the lattice strain exhibits a clear non-linear development once the sample deforms
plastically. In the TD/RD case, the deviation is almost negligib le for }1220{ and
}0220{ , but very large for }2112{ and }0112{ with opposite signs. In the TD/ND case,
the deviation for the peaks is quite large, but {0004} is the only peak that shows a
significant negative deviation; all others show positive. In both transv ases, erse c }0112{
peaks show significant deviations in positive sign; }2112{ peaks also show large
deviations, but of opposite signs in the two transverse directions.
The lattice strains measured parallel to the applied load, i.e. the TD/TD case, are
plotted against macroscopic true strain in Fig. B-4b. In this case, all the residual strains
are quite small, comparable to the error of measurements, except for the }0220{ and
}0112{ peaks, which show small compressive residual strains before ~2% true strain. In
the transverse cases, i.e. TD/RD and TD/ND (Fig. B-4d and 4f), large tensile residual
strains (greater than 1000με) develop in the }0112{ -orientated grains. These residual
strains arise within the first 2%-3% of true strain, after which little further increase is
observed. Similar behavior can be seen in other peaks, especially in the }2112{ and
peaks. Almost no residual strains for the {0004} }1220{ and }0220{ peaks are
observed in the TD/RD case, although there is a little tensile accumulation at higher true
strains. However, these peaks show significant tensile residual strains in the TD/ND case.
287

From Fig. B-4, it can be seen that the residual strain results are practically identical to the
deviation from elastic linearity. This is not surprising because we observe little slip or
twinning during the unloading process, i.e. there is very little Bauschinger effect during
the unloading. It is obvious that after large strain (>10%) deformation, prismatic planes,
}0220{ and }0112{ , are in residual tension, basal planes, { }0004 , are in compression,
and pyramidal planes, }1220{ and }2112{ , are in tension or compression.
The lattice strains generated during deformation were calculated with an
elasto-plastic self-consistent model, EPSC [5]. The data required for the modeling fall
into three categories: the single crystal properties (thermal expansion coefficients, elastic
constants, and plastic systems), the polycrystalline aggregate (texture and grain shape),
and the boundary conditions (temperature and mechanical constraints) [2]. In this
research, we assume the elastic constants of Zircaloy-2 to be the same as those of pure
α-Zr, whose properties can be obtained from literature [6]. The thermal expansion
coefficients in both a- and c- directions and the truly stress-free lattice parameters were
derived from the heating-cooling experiment performed on a cylindrical Zircaloy-2
sample (Appendix A). The experiment gave the thermal expansion coefficients
and , and stress-free lattice spacings of
Å and
16103.5 −−×= Kaα
22960.3)298( =Kasf
16101.10 −−×= Kcα
.5)298( 14612=Kcsf Å. As for the plastic deformation
systems, since the alloying elements in Zircaloy-2 can change the relative strengths of the
deformation modes, the critical resolved shear stresses and the hardening properties of
the prismatic <a>-slip, basal <a>-slip and pyramidal <c+a>-slip may be different from
those reported in the literature. Therefore, these were used as fitting parameters to give an
optimum agreement between the measured and modeled macroscopic stress-strain curves.
288

At the aggregate level, the orientation distribution function describing the texture as an
input was represented by 1944 equiaxed grains. The boundary conditions were applied by
setting appropriate macroscopic true strains in the loading direction at room temperature.
The calculated lattice strains in three directions at the ~90% load level are compared
to the measured results in Fig. B-4a, 4c and 4e. These figures show that the calculated
diffraction elastic constants (DEC) for all the measured diffraction peaks in the three
directions agree well with the measured values. However, a closer investigation reveals
that the difference in the DEC between the measured peaks is generally greater that
derived by modeling. One possible reason is that the elastic constants of single crystal Zr
used in the modeling are slightly different from those in the textured Zircaloy-2 due to the
microstructure or more likely alloying elements. The samples enter plastic deformation as
the applied stress exceeds ~280MPa. Generally the model captures very well the lattice
strain redistributions in the plastic regime. In the TD/TD case, the model predicts the
development of lattice strain in all the diffraction peaks except for }2112{ , Fig. B-4a. In
the other two transverse cases (Fig. B-4c and 4e), the redistribution of lattice strains at the
onset of plastic deformation is much more dramatic. Such a feature is reproduced by the
modeling. In both cases, good agreement is found until the applied stress reaches
~320MPa, except for the }0220{ peak in the TD/RD case and the }2112{ peak in the
TD/ND case.
The calculated residual strains of individual diffraction peaks versus true strain in the
TD/TD case are shown in Fig. B-4b. As can be seen, before ~7% strain, the calculated
results agree well with experiments for }1220{ , }0220{ and }0112{ peaks, but not for
the }2112{ peak. In the TD/RD case (Fig. B-4d), most predictions are in reasonable
289

agreement with the measurements in terms of the trends and magnitudes, especially
before ~7% strain, but this is not true for the }0220{ peak. After ~7% strain, residual
strains for the }1220{ and }0112{ peaks are somewhat underestimated. In the TD/ND
case (Fig. B-4f), the model reasonably captures the general trends for all the peaks, but
obviously it misses the response of }2112{ . The predictions agree well with experiments
for the {0004} peak before ~7% strain and for the }1220{ and }0112{ peaks before
~2% strain. After ~2% strain, the observed lattice strains for }1220{ and }0112{ keep
accumulating while the predictions indicate a level-off trend. The underestimations in
both transverse cases indicate that the grain-matrix interaction in the model may not be
“hard” enough. One possible reason could be the self-hardening assumption in the
modeling, i.e. each slip system is independently hardened. However, the most likely
reason is that the model does not include grain rotation and the subsequent change in
texture associated with larger plastic strains. This change in texture will then influence
the subsequent loading, and is typically considered to become important somewhere after
2%-5% strain plastic deformation.
B4. Conclusion
Type-2 strains were measured in the tensile samples in three dimensions. For samples
loaded in the TD direction, it was found that after large strain (>10%) deformation,
prismatic planes were in residual tension, basal planes in compression and pyramidal
planes in tension or compression. The results were also modeled using EPSC employing
prismatic, basal and pyramidal slips with limited success. There is good agreement only
up to macroscopic true strain of 2-7%. It is suggested that twinning, texture development
290

and a better hardening law should be included in the model.
References
[1] S.MacEwen, N.Christodoulou, A.Salinas-Rodriguez, Metal. Trans. A 21 (1990) 1083-1095
[2] P.A. Turner, N. Christodoulou, C.N. Tomé, Int. J. Plast. 11 (1995) 251-265
[3] T.M. Holden, J.H. Root, R.A. Holt, P.A. Turner, J. Nucl. Mat. 304 (2002) 73-82
[4] J.W.L. Pang, T.M. Holden, P.A. Turner, and T.E. Mason, Acta Mater. 47 (1999) 373-383
[5] P.A. Turner, C.N. Tomé, Acta Mater. 42 (1994) 4143-4153
[6] E.S. Fischer, C.J. Renken, Phys. Rev. A135 (1964) 484-494
291

292
This page is blank.

Appendix C
Texture Evolution during Compression in Zircaloy-2
The deformation of Zircaloy-2 is influenced by many factors; one being bulk texture. The
texture can greatly affect the development of both the macro-mechanical (e.g.
stress-strain curve) and micro-mechanical behavior (e.g. intergranular stresses). Thus
studies on texture evolution are of practical significance. This introduces our current
work on texture development during uniaxial loading of warm rolled Zircaloy-2 slab.
As manufactured, most basal poles are orientated along the normal direction (ND), with a
spread of ±50° towards the transverse direction (TD) and ±30° towards the rolling
direction (RD). The { 0211 } normals are moderately concentrated in RD. Compression
tests were performed in-situ during neutron diffraction to follow the development of
lattice strain and intensity for eight diffraction peaks, with two tests each for compression
along ND, TD and RD. Pole figures were then measured for the deformed samples. In
this paper, we report the results for compression along RD. The development of intensity
measured in two perpendicular directions during compression along RD showed that
tensile twinning occurred during the deformation, which was confirmed by the
subsequent texture measurement. Modeling work was performed with a visco-plastic
self-consistent model (VPSC), assuming that prism <a> slip, basal <a> slip, pyramidal
<c+a> slip and tensile twinning are the active deformation mechanisms. The model
successfully reproduced the macroscopic stress-strain responses, and also predicted the
final texture reasonably well. Although further work is needed to refine the results, the
model predicts reasonably well tensile twinning activity, and the twinning-induced
293

reorientation of basal poles from ND to RD, and prism poles from RD to ND.
C1. Introduction
Zircaloy-2 (Zr, 1.20-1.70 wt% Sn, 0.07-0.2 wt% Fe, 0.05-0.15 wt% Cr, 0.03-0.08
wt% Ni, 900-1400 ppm O) [1] has a stable α-phase (hcp) below 1156K and exhibits
anisotropy in the thermal, elastic and plastic properties, both at the single crystal and
polycrystal levels. The material is widely used in nuclear reactors due to its low neutron
capture cross-section, excellent corrosion-resistant properties, and reasonable mechanical
properties. In CANDU reactors, this material is used for the calandria tubes.
Excessive deformation during operation in the irradiation environment of the reactor may
lead to serious problems, such as the pressure tube-to-calandria tube contact [2]. The
deformation is closely related to the development of intergranular stresses (Type-2
Stresses), i.e. the stresses developed between different grain orientations during
manufacturing. It is necessary to understand the development of Type-2 stresses in order
to predict the behavior of a material made by a new manufacturing route, for example the
calandria tubes for the Advanced CANDU Reactor [3].
There are many factors that can influence the accumulation of Type-2 stresses: one of
the most important factors is bulk texture. The texture in Zircaloy-2 polycrystals usually
develops during manufacturing, such as rolling or extrusion, and results in anisotropic
properties in the final product. The texture is a combined result of anisotropic single
crystal properties, grain interactions and the external loading.
Plastic deformation at room temperature in Zircaloy-2 is usually accommodated by
prism <a> slip { 0110 }< 0211 >, tensile twinning { 2110 }< 1110 >, pyramidal <c+a> slip
294

{ 1110 }< 3211 >, and compressive twinning { 2211 }< 3211 >, in order of ease of activation.
There is still some debate about the presence of basal <a> slip {0001}< 0211 > at room
temperature [4,5], but it appears to be necessary to model the behavior [6]. Relating the
activation of various deformation modes to texture evolutions, Ballinger et al. [7,8] found
(for a similar texture to that used in our study) that: (1) prism slip accounts for most of
the large axial expansions or contractions and rotates the { 0110 } planes into the rolling
direction (RD) during tension along RD; (2) compressive strains achieved through
pyramidal slip will rotate the { 1110 } plane such that it will approach the normal to the
compression axis; (3) pyramidal slip can also create a spread of basal poles peaked in the
normal-transverse (ND-TD) plane at approximately 30-40° to TD; and (4) twinning
rotates grains into an orientation favorable for prism slip which makes accommodation of
strains in other grains easier. Hobson et al. [9] suggests that twinning is more important in
the initial stages and that slip is more important in the final stages of texture development,
thus the occurrence of twinning (especially tensile twinning) has received much attention
in our studies. The activation of tensile twinning involves a reorientation of 85.22° of the
basal and prism poles, resulting in basal pole orientation ~90° away from ND during
tension along ND, Fig. C-1 [10].
The development of texture is generally understood experimentally. However, there
has been limited success in modeling it. Part of the reason is due to the limited
understanding of twinning and hardening (e.g. how multiple deformation systems interact
with each other). The theory for the texture simulation of noncubic crystals is well behind
that of cubic crystals [11], due to the more restricted availability of slip the greater
possibilities of twinning. Also there are other issues remain to be understood: e.g. the
295

(a) (b) ND
Fig. C-1 Tensile twinning in α–zirconium indicating the reorientation of the hcp structure and for
tension along ND (where most of the basal plane normals are concentrated), rotation of the basal plane
normals to the periphery of the pole figure [10]
impact of the initial texture (associated with previous deformation), the impact of texture
development on the intergranular stresses and the impact of more complicated stress
states and loading than simple uniaxial ones.
Currently, we are investigating the evolution of lattice strain and texture in
Zircaloy-2 by neutron diffraction (time-of-flight) during in–situ uniaxial compression
along three principal directions. The development of three-dimensional lattice strains for
both compression and tension along three directions has been reported in Ref. [12]. Some
intensity changes were included in Ref. [13]. In this paper, we revisit some of the
intensity changes and report the measured final texture, for compression along RD. In
particular, we emphasize the role of tensile twinning, and its effects on the texture
evolution. A visco-plastic self-consistent model (VPSC) is used to predict the final
texture, and to illustrate how slip and tensile twinning contribute to this texture.
C2. Experimental procedure
The source material is a warm-worked Zircaloy-2 slab, 60mm thick with most of the
296

basal poles orientated near ND, with a spread of ±50° towards TD and ±30° towards RD
[14]. The { 0211 } normals are moderately concentrated in RD. The manufacturing
process of the slab was not well documented but it appears to have recrystallized,
inducing a 30° rotation of the texture about the basal pole, rotating the < 0211 >, rather
than the < 0110 > direction into RD [7, 14].
Six samples for the compression tests were machined from the slab at the middle
thickness (to ensure the uniform texture throughout the sample) in the three principal
directions, with two samples each being prepared for compression along ND, along RD
and along TD. Each sample was machined to a right circular cylinder, with 9mm in
diameter and 18mm in height. In-situ compression tests were performed on the ENGIN-X
beam line at the ISIS facility, Rutherford Appleton Labs. (UK). Experimental details have
been given in Ref. [13]. The loading axis is set horizontally at 45° to the incident beam so
that it is possible to measure lattice strains in directions both parallel and perpendicular to
the axis in two detector banks which are aligned horizontally at scattering angles of ±90°.
Fig. C-2 shows a schematic experimental set-up for the sample tested in ND. Intensities
and lattice strains in RD and ND (Fig. C-2b) (or TD and ND, Fig. C-2c) can be measured
simultaneously using Detector 1 and 2, respectively. Four compression tests were
performed over -12% strain, while one sample compressed in RD was stopped earlier at
~-8% strain and one for ND at ~-5% strain, due to the time constraints. The measured
diffraction peaks are { 0110 }, { }, {0002 1110 }, { 2110 }, { 0211 }, { 3110 }, { 0220 },
{ 2211 }, { 1220 }, { 0004 }, and { 2220 }, in order of high to low inter-planar spacing.
Peak intensities were obtained by fitting the recorded spectra with Gaussian function
using GSAS rawplot [15].
297

298
η Incident beam
(a) χ
Diffracted beam
Scattering vector
(b) (c)
Fig. C-2 Sample positioning for compression tests along
ND, (a). The sample can be tested such that (b) Q1║RD Fig. C-3. Definition of η and χ and Q2║ND or (c) Q1║TD and Q2║ND.
Textures of the samples after compression were measured at the NRU reactor, Chalk
River Labs., using the constant-wavelength neutron diffraction technique on the E3
triple-axis spectrometer. The deformed sample was positioned on the goniometer with
its compression axis being normal to the plate of the sample holder table. Samples were
measured, each having been compressed to more than –12% strain along ND, TD or RD.
The intensity of three diffraction peaks was measured in 5º increments over the complete
hemisphere defined by the polar angle η and the azimuthal angle χ of the goniometer
relative to the compression axis of the specimen (η from 0º to 360º and χ from 0º to 90º,
Fig. C-4). In order to obtain the maximum counting statistics of neutron diffraction, the
whole sample was bathed in the incident beam. Therefore background intensity was
also measured over the complete hemisphere to correct the diffracted intensities for
anisotropic absorption due to the non-spherical shape of the sample. The measured
textures for the samples compressed along RD and TD were rotated such that the center
of all the pole figures is ND, and the north pole is RD.
C3. Self-consistent modeling
The deformation textures of the compressed samples were calculated with the
visco-plastic self-consistent polycrystal model (VPSC), developed by C.N. Tomé et al.
[16]. In the model, each grain is treated as a visco-plastic ellipsoidal inclusion embedded
in, and interacting with, a homogeneous effective medium that represents the aggregate
[17]. Hardening and grain reorientations are accounted for. Twinned regions, which
have a different orientation than the surrounding matrix, are treated as new grains with an
evolving volume fraction [18]. As with slip, twinning is assumed to have an associated
CRSS for activation and hardening parameters. However, VPSC does not represent
elastic deformation or the initial elastic-plastic transition. In this study, the model is
used to help understand the effects of tensile twinning on the texture evolution with
plastic strain, and to derive the activities of intrinsic deformation mechanisms that are
difficult to determine experimentally.
The input data for the VPSC modeling is in three categories. The first is the boundary
condition: the true plastic strain along the compression axis in this study. The second is
the initial texture and grain shape that describe the polcycrystalline Zircaloy-2 slab. These
were taken from Ref. [19]. The last is the single crystal properties, consisting of thermal
expansion coefficients, elastic constants and plastic deformation parameters. The thermal
expansion coefficients and elastic constants are those reported in Ref. [19]. Plastic
deformation parameters were adjusted so that the calculated flow curves fit best the
experimental ones simultaneously for compression along three directions.
Four plastic deformation modes were considered: prismatic <a> slip
{ 0110 },1/3< 0211 > (pr), basal <a> slip {0001},1/3< 0211 > (bas), pyramidal <c+a> slip
299

{ 1110 },1/3< 3211 > (pyr) and tensile twinning { 2110 },< 1110 > (tt). The evolution of
CRSS for each mode is described by Voce hardening [20]. Table C-1 lists the
parameters used in the VPSC modeling. Tomé et al. [21] suggested that the hardening
effects due to twin-slip (or twin-twin) interactions are stronger than those due to slip-slip
interactions. Thus we used a higher ‘interaction hardening’ parameter concerning
‘twin-twin’ and ‘twin-slip’ interactions, i.e. hslip-twin =2.0, while we kept all hslip-slip as 1.0.
Comparing the Voce-hardening parameters with those used in Ref. [12] for the EPSC
modeling, we note that the relative initial CRSS’s of the slip and twinning modes are the
same. Also the asymptotic hardening rate 1θ for the slip modes are the same, while
for VPSC modeling (0.40) is higher than that used for EPSC modeling (0.10). This
difference is probably necessary because twinning is represented differently in VPSC
than in EPSC. Specifically, EPSC does not account for the grain reorientations or
texture development (which is much better treated in VPSC), thus a lower is needed
in EPSC to generate softening commensurate with that brought about by the orientation
changes associated with twinning in VPSC.
tt1θ
tt1θ
Table C-1. Parameters describing the evolution of CRSS for each deformation mode: 0τ and
0τ + 1τ are the initial and final back-extrapolated CRSS; 0θ and 1θ are the initial and
asymptotic hardening rates.
0τ (GPa) 1τ (GPa) 0θ 1θ
prism <a> slip 0.05 0.08 10. 0.02
basal <a> slip 0.08 0.08 10. 0.02
pyra. <c+a> slip 0.16 0.40 10. 0.40
tensile twinning 0.12 0. 0.40 0.40
300

C4. Results and Discussion
C4.1 Macroscopic stress-strain response
Although it is not sufficient, reproducing macroscopic stress-strain responses is the
first important criterion for a successful model to reveal the texture evolution and the
intrinsic deformation mechanisms. Fig. C-4 shows both the experimental and calculated
macroscopic stress-strain behavior for compression along three directions. The
experimental points in the figure represent the averaged stress and strain states where
neutron diffraction measurements were performed. Clearly, the sample compressed along
ND yields at a higher stress, and work-hardens more quickly than that compressed in TD
and RD. The elastic-plastic transition is the most rapid during compression along RD,
while it is relatively gradual along ND. Qualitatively reproducing the transition regions
(as shown in Fig. C-4) by the model suggests that the CRSS ratio and the initial
hardening rate of the deformation modes are reasonable, although the very sharp ‘corner’
at –0.5% strain in Fig. C-4c is not well captured. The starting points in the calculated
curves do not overlap the experimental ones, since the VPSC model is incapable of
treating the elastic deformation, and the basic formula in the model do not allow for a
‘zero’ stress. It should be highlighted that the responses beyond –1.5% strain in each
(a) (b) (c)
Fig. C-4 Experimental and calculated macroscopic stress-strain responses during (a) compression
along ND, (b) compression along TD, and (c) compression along RD.
301

case are well predicted, especially for the compression along ND and along RD. In
particular, the slight inflection of the experimental curve after –1.5% during compression
along RD is well reproduced. This indicates that the values of the parameter used for
the twinning (shown in Table C-1) are in a reasonable range, since the inflection is caused
by the initiation and hardening of tensile twinning [12].
In order to achieve reasonable values of the parameters, we stress the importance of
achieving simultaneous agreement for the compression along all the three directions.
Input values suitable for reproducing the response in only one or two directions do not
guarantee the agreement in the other direction(s).
C4.2 Measured texture development
The variation in intensity with strain was recorded for all the measured diffraction
peaks in three directions. Here we present only the { 0110 }, { } and {0002 1110 }
intensities during compression along RD. We reported the intensity changes of the prism
and basal poles, for the compression along TD and RD in Ref. [13]. Here we briefly
revisit them just in order to help understand the activation of twinning and to associate
the intensity changes with the texture development.
Fig. C-5 shows the intensity changes with respect to the applied stress, for
measurements taken in RD and ND, during compression along RD. Remarkable changes
occur at –370MPa (or ~ -1.7% strain). Measured in RD, the initially absent {0002}
intensity increases dramatically above that stress, while the { 0110 } and { 1110 } intensities
decrease in a significant rate. Measured in ND, the opposite is found for the prism and
basal plane normals, i.e., the {0002} intensity decreases while the { 0110 } intensity
302

-500
-450
-400
-350
-300
-250
-200
-150
-100
-50
00 50000 100000 150000
Integrated Intensity [Arb. Units]
True
Stre
ss [M
Pa] {10-10} EXP
{10-11} EXP
{0002} EXP
-500
-450
-400
-350
-300
-250
-200
-150
-100
-50
00 50000 100000 150000
Integrated Intensity [Arb. Units]
True
Stre
ss [M
Pa] {10-10} EXP
{10-11} EXP
{0002} EXP
(a)
(b)
Fig. C-5 Intensity development for the { 0110 }, { } and {0002 1110 } reflections during
compression along RD: (a) measured from RD, and (b) measured from ND. [13]
increases. However, the { 1110 } intensity also decreases in ND, but with a much smaller
gradient. The opposite trend in intensity changes of the prism and basal poles shown in
RD and ND is a clear signature of the occurrence of tensile twinning, since tensile
twinning can bring about a ~90º reorientation of the prism and basal poles.
303

Ex-situ texture measurements have confirmed the activation of tensile twinning. As
shown in the {0002} pole figures (Fig. C-6b and 6e), after compression the {0002}
texture near ND is weaker, whereas the texture near RD is much stronger. The contours
around ND in Fig. C-6e are skewed, which is probably caused by the buckling that
occurred to the sample and/or the misalignment during texture measurement. Examining
the prism pole figures (Fig. C-6a and 6d), it is easy to observe the decrease in the texture
coefficient in RD, consistent with the intensity decrease observed in this direction during
compression. After compression, the ‘1x random’ contour is much closer to ND, and the
weakest texture has moved from the center to ~30º away from ND in the ND-RD plane.
Thus it is reasonable to deduce that the prism texture is strengthened in ND after
deformation, again consistent with the intensity changes observed in-situ. Changes in
the { 1110 } texture (Fig. C-7c and 7f) display the obvious decrease in the texture
component in RD after compression. Around ND, the change in the texture component
is too slight to discern, although it can be considered to decrease since the random
contour moves away from the center. Interestingly, distributions of the { 0110 } and { 1110 }
texture components are very similar to each other after compression (Fig. C-6d and 6f).
C4.3 Predicted final textures
The calculated { 0110 }, { } and {0002 1110 } pole figures are shown in Fig. C-6g, 6h
and 6i, respectively. From a qualitative point of view, the comparisons show good
agreement with experimental measurements. Several similarities are shared by the
predicted and measured { 0110 } pole figures. Six strongest { 0110 } texture lobes
distribute at similar positions along the rim of the pole figures, while the weakest
304

Fig. C-6 Measured and calculated pole figures: (a) measured initial { 0110 } [14], (b) measured
initial {0002} [14], (c) measured initial { 1110 } [14], (d) measured final { 0110 }, (e) measured
final {0002}, (f) measured final { 1110 }, (g) calculated final { 0110 }, (h) calculated final {0002}
and (i) calculated final { 1110 } (blue to red: low to high).
components are found around RD and in the “X”-shape region symmetrically aligned
with respect to the center. The strongest and weakest { 1110 } components show up at
similar positions to those of the { 0110 }; however, the relatively highest strength is less
RD
ND TD
(b) (c) (a)
(f) (e) (d)
(i) (g) (h)
305

than that of { 0110 }. The prediction again reasonably reproduced the { 1110 } texture. As
for the basal poles, clearly the predictions well reproduce their appearance around RD
and also the propagation from ND to RD in the ND-RD plane. However, the increase in
the intensity around RD is obviously over-predicted. Also, the calculated basal pole
figure shows a split of basal poles near ND in the ND-RD plane, which was not clearly
observed in the experiment.
Fig. C-7 presents the evolution of the relative activities of the three slip modes and
dominant
tensile twinning. From the figure, the following deformation modes contribute to the
strain in decreasing order of contribution: prism <a> slip, basal <a> slip and tensile
twinning, at strains higher than –4%. Pyramidal <c+a> slip is nearly negligible
(note that it is very active during compression along ND, however). The
activity of prism slip suggests that the deformation is mostly accommodated by this mode,
which is consistent with the well-established fact that prism slip is the major mechanism
during the deformation of zirconium and its alloys. Basal <a> slip also takes an
important role in accommodating the plastic strain; it even accounts for more and more
portion of the total activity as the deformation proceeds. Prism and basal slip may
contribute to the formation of the six relatively strong texture lobes on the rims of the
{ 0110 } and { 1110 } pole figures. As revealed by the modeling, significant tensile
twinning takes place at approximately -1.0% strain; beyond that strain, its relative activity
diminishes quickly. The predicted remarkable activation of tensile twinning
corresponds to the small-range (from ~-1.0% to ~-1.8%) saturation of the experimental
stress-strain curve observed in Fig. C-4c. Thus we can deduce that the model does
reasonably reproduce the occurrence of tensile twinning, although virtually it initiates a
306

little earlier.
Prism <a> slip
basal <a> slipTensile twinning
Fig. C-7 Evolution of relative activities of the deformation modes
C5. Conclusion
pression tests have been performed along ND, TD and RD. The
deve
Six in-situ com
lopment of intensity was monitored in three principal directions during each test. The
intensity changes during compression along RD indicated that significant tensile twinning
occurred during the deformation. Textures of the deformed samples were then measured
ex-situ at a different neutron site. The intensity changes of the basal pole, one prism
pole and one pyramidal pole are consistent with the measured final texture. The
measured basal pole figure confirmed the occurrence of tensile twinning which has
brought about a portion of basal poles from ND to RD, and a portion of prism poles from
RD to ND. Preliminary modeling work has been performed to reproduce the texture
evolution. A visco-plastic self-consistent model was used and prism <a> slip, basal <a>
slip, pyramidal <c+a> slip and tensile twinning were considered. The model
qualitatively reproduced the macroscopic stress-strain responses and the final texture.
As revealed by the modeling of the compression along RD, prism <a> slip is the leading
deformation mechanism, while basal <a> slip and tensile twinning compete with each
307

other as the next. Pyramidal <c+a> slip is negligible. In particular, the model discloses
significant tensile twinning activities at a small strain during the deformation, which
results in the accumulation of basal poles around RD. Further studies are needed to
quantify the volume fraction of tensile twinning, both experimentally and theoretically.
References
wen, J. Faber and A.P.L. Turner, Acta Metall. 31 (1983) 657-676.
97).
23, 2005.
T.E. Mason, Acta Mater. 47 (1999) 373-383.
4) 53-69.
e of Mining,
isotropy in zirconium and zircaloy,
mater. 49 (2001) 4277-4289.
itted to Proc. MecaSens 2005).
No.
, P.J. Maudlin, R.A. Lebensohn, and G.C. Kaschner, Acta mater. 49 (2001),
[1] S.R. MacE
[2] Canada Enters the Nuclear Age, Atomic Energy of Canada Limited (19
[3] J. Hopwood, Proc. 26th Annual Conference of the Canadian Nuclear Society, paper P
[4] A. Akhtar, Acta. Metallurgica 21 (1973) 1-11.
[5] H.R. Wenk, J. Appl. Cryst. 31 (1998) 262.
[6] J.W.L. Pang, T.M. Holden, P.A. Turner, and
[7] R.G. Ballinger and R.M. Pelloux, J. Nucl. Mater. 97 (1981) 231-253.
[8] R.G. Ballinger, G.E. Lucas and R.M. Pelloux, J. Nucl. Mater. 126 (198
[9] D.O. Hobson, Transactions, The Metallurgical Society, American Institut
Metallurgical and Petroleum Engineers, Vol. 242 (1968) 1105.
[10] Erich Tenckhoff, Deformation mechanisms, texture and an
ASTM special technical publication 966 (1998).
[11] S.R. Agnew, M.H. Yoo and C.N. Tomé, Acta
[12] F. Xu, R.A. Holt and M.R. Daymond, (in preparation).
[13] F. Xu, R.A. Holt, E.C. Oliver and M.R. Daymond, (subm
[14] R.A. Holt, D. Dye, R.B. Rogge, Annual Report of the National Research Council (2004)
[15] Larson, A.C and Von Dreele, R.B. (1994) General Structure Analysis System, Report
LAUR 86-748.
[16] C.N. Tomé
308

3085-3096.
[17] D.W. Brown, S.R. Agnew et al., Materials Science and Engineering A 399 (2005) 1-12
, R.A. Holt, R.B. Rogge and M.R. Daymond, Proc. CNS-26, (2005)
[18] P. Rangaswamy, M.A.M. Bourke, et al., Metallurgical and Materials Transactions 33A (2002)
757-763.
[19] F. Xu
[20] P.A. Turner and C.N. Tomé, Acta Metall. 42 (1994) 4143-4153
[21] C.N. Tomé, P.J. Maudlin et al., 49 (2001) 3085-3096.
309

310
This page is blank.

Appendix D
Measured Pole Figures for the Deformed Samples
This appendix presents the measured pole figures (Fig. D-1) not shown in Fig. 7-4,
Chapter 7.
RD
(a)
ND
(b) (c)
TD
(f) (d) (e)
Fig. D-1 (to be continued)
311

(i) (h) (g)
(j) (k) (l)
Fig. D-1 Measure pole figures for the deformed samples: (a) }1110{ after compression along ND;
(b) }1110{ after compression along TD; (c) }1110{ after compression along RD; (d) }1110{ , (e) }2110{ ,
(f) }0211{ after tension along ND; (g) }1110{ , (h) }2110{ , (i) }0211{ after tension along TD; (j) }1110{ ,
(k) }2110{ , (l) }0211{ after tension along RD.
312