latitudinal biogeographic structuring in the globally
TRANSCRIPT

University of Wollongong University of Wollongong
Research Online Research Online
Faculty of Science, Medicine and Health - Papers: Part B Faculty of Science, Medicine and Health
1-1-2020
Latitudinal biogeographic structuring in the globally distributed moss Latitudinal biogeographic structuring in the globally distributed moss
Ceratodon purpureus Ceratodon purpureus
Elisabeth Machteld Biersma
Peter Convey
Rhys Wyber University of Wollongong, [email protected]
Sharon A. Robinson University of Wollongong, [email protected]
Mark P. Dowton University of Wollongong, [email protected]
See next page for additional authors
Follow this and additional works at: https://ro.uow.edu.au/smhpapers1
Publication Details Citation Publication Details Citation Biersma, E. M., Convey, P., Wyber, R., Robinson, S. A., Dowton, M. P., Van De Vijver, B., Linse, K., Griffiths, H., & Jackson, J. A. (2020). Latitudinal biogeographic structuring in the globally distributed moss Ceratodon purpureus. Faculty of Science, Medicine and Health - Papers: Part B. Retrieved from https://ro.uow.edu.au/smhpapers1/1523
Research Online is the open access institutional repository for the University of Wollongong. For further information contact the UOW Library: [email protected]
Latitudinal biogeographic structuring in the globally distributed moss Ceratodon Latitudinal biogeographic structuring in the globally distributed moss Ceratodon purpureus purpureus
Abstract Abstract Biogeographic patterns of globally widespread species are expected to reflect regional structure, as well as connectivity caused by occasional long-distance dispersal. We assessed the level and drivers of population structure, connectivity, and timescales of population isolation in one of the most widespread and ruderal plants in the world — the common moss Ceratodon purpureus. We applied phylogenetic, population genetic, and molecular dating analyses to a global (n = 147) sampling data set, using three chloroplast loci and one nuclear locus. The plastid data revealed several distinct and geographically structured lineages, with connectivity patterns associated with worldwide, latitudinal “bands.” These imply that connectivity is strongly influenced by global atmospheric circulation patterns, with dispersal and establishment beyond these latitudinal bands less common. Biogeographic patterns were less clear within the nuclear marker, with gene duplication likely hindering the detection of these. Divergence time analyses indicated that the current matrilineal population structure in C. purpureus has developed over the past six million years, with lineages diverging during the late Miocene, Pliocene, and Quaternary. Several colonization events in the Antarctic were apparent, as well as one old and distinct Antarctic clade, possibly isolated on the continent since the Pliocene. As C. purpureus is considered a model organism, the matrilineal biogeographic structure identified here provides a useful framework for future genetic and developmental studies on bryophytes. Our general findings may also be relevant to understanding global environmental influences on the biogeography of other organisms with microscopic propagules (e.g., spores) dispersed by wind.
Keywords Keywords purpureus, ceratodon, moss, distributed, globally, biogeographic, structuring, latitudinal
Publication Details Publication Details Biersma, E. Machteld., Convey, P., Wyber, R., Robinson, S. A., Dowton, M. P., Van De Vijver, B., Linse, K., Griffiths, H. & Jackson, J. A. (2020). Latitudinal biogeographic structuring in the globally distributed moss Ceratodon purpureus. Frontiers in Plant Science, Online First 1-14.
Authors Authors Elisabeth Machteld Biersma, Peter Convey, Rhys Wyber, Sharon A. Robinson, Mark P. Dowton, Bart Van De Vijver, Katrin Linse, Howard Griffiths, and Jennifer A. Jackson
This journal article is available at Research Online: https://ro.uow.edu.au/smhpapers1/1523

Latitudinal Biogeographic Structuringin the Globally Distributed MossCeratodon purpureusElisabeth M. Biersma1,2,3*, Peter Convey1, Rhys Wyber4, Sharon A. Robinson4,Mark Dowton5, Bart van de Vijver6,7, Katrin Linse1, Howard Griffiths2
and Jennifer A. Jackson8
1 Biodiversity, Evolution and Adaptation Team, British Antarctic Survey, Cambridge, United Kingdom, 2 Department of PlantSciences, University of Cambridge, Cambridge, United Kingdom, 3 Natural History Museum of Denmark, University ofCopenhagen, Copenhagen, Denmark, 4 School of Earth, Atmospheric and Life Sciences, University of Wollongong, NSW,Australia, 5 School of Chemistry and Molecular Bioscience, University of Wollongong, Wollongong, NSW, Australia,6 Research Department, Botanic Garden Meise, Meise, Belgium, 7 Ecosystem Management (ECOBE), Department of Biology,University of Antwerp, Antwerp, Belgium, 8 Ecosystems Team, British Antarctic Survey, Cambridge, United Kingdom
Biogeographic patterns of globally widespread species are expected to reflect regionalstructure, as well as connectivity caused by occasional long-distance dispersal. Weassessed the level and drivers of population structure, connectivity, and timescales ofpopulation isolation in one of the most widespread and ruderal plants in the world — thecommon moss Ceratodon purpureus. We applied phylogenetic, population genetic, andmolecular dating analyses to a global (n = 147) sampling data set, using three chloroplastloci and one nuclear locus. The plastid data revealed several distinct and geographicallystructured lineages, with connectivity patterns associated with worldwide, latitudinal“bands.” These imply that connectivity is strongly influenced by global atmosphericcirculation patterns, with dispersal and establishment beyond these latitudinal bandsless common. Biogeographic patterns were less clear within the nuclear marker, withgene duplication likely hindering the detection of these. Divergence time analysesindicated that the current matrilineal population structure in C. purpureus hasdeveloped over the past six million years, with lineages diverging during the lateMiocene, Pliocene, and Quaternary. Several colonization events in the Antarctic wereapparent, as well as one old and distinct Antarctic clade, possibly isolated on the continentsince the Pliocene. As C. purpureus is considered a model organism, the matrilinealbiogeographic structure identified here provides a useful framework for future genetic anddevelopmental studies on bryophytes. Our general findings may also be relevant tounderstanding global environmental influences on the biogeography of other organismswith microscopic propagules (e.g., spores) dispersed by wind.
Keywords: phylogeography, model organism, moss, spore, wind, bryophyte, global, Antarctica
Frontiers in Plant Science | www.frontiersin.org August 2020 | Volume 11 | Article 5023591
Edited by:Jeffrey Graham Duckett,Natural History Museum,
United Kingdom
Reviewed by:Alexander Zizka,
German Centre for IntegrativeBiodiversity Research (iDiv), Germany
Santiago Martın-Bravo,Universidad Pablo de Olavide, Spain
*Correspondence:Elisabeth M. Biersma
Specialty section:This article was submitted to
Plant Systematicsand Evolution,
a section of the journalFrontiers in Plant Science
Received: 02 October 2019Accepted: 13 August 2020Published: 28 August 2020
Citation:Biersma EM, Convey P, Wyber R,
Robinson SA, Dowton M,van de Vijver B, Linse K, Griffiths H and
Jackson JA (2020) LatitudinalBiogeographic Structuring in the
Globally Distributed MossCeratodon purpureus.
Front. Plant Sci. 11:502359.doi: 10.3389/fpls.2020.502359
ORIGINAL RESEARCHpublished: 28 August 2020
doi: 10.3389/fpls.2020.502359

INTRODUCTION
Bryophytes tend to show extensive distributions, often spanningmultiple continents and/or both hemispheres (Schofield andCrum, 1972). In particular, the often extremely prolific sporeproduction (Longton, 1997) combined with small spore size(generally ~10–20 mm diameter in mosses; Frahm, 2007) givemany bryophytes strong potential for long distance dispersal.Mounting evidence from experimental (e.g. Sundberg, 2013) andphylogeographic studies (e.g. McDaniel and Shaw, 2005;Huttunen et al., 2008; Pokorny et al., 2011; Stenøien et al.,2011; Karlin et al., 2012; Piñeiro et al., 2012; Szövenyi et al.,2012; Lewis et al., 2014a; Pisa et al., 2014; Kyrkjeeide et al., 2016;Biersma et al., 2017) has demonstrated the occurrence of long-distance dispersal in mosses with disjunct or widespread ranges,and suggests that the majority of bryophyte distribution patternsare underlain by relatively frequent short distance, and lessfrequent long distance, dispersal events (Heinrichs et al., 2009;Patiño and Vanderpoorten, 2018; Vigalondo et al., 2019).
Some bryophytes show a truly cosmopolitan or globaldistribution, similar to some microbial groups (Fontaneto,2011). The capability for long-distance dispersal in suchspecies is well illustrated by their frequent occurrence ongeologically young islands (Convey et al., 2000; Vanderpoortenet al., 2007). Additionally, the speed and frequency with whichsome of these species colonize newly-erected buildings similarlyillustrates the tremendous dispersal potential of such species(Forman, 2014). Yet, the extent to which the global distributionof cosmopolitan bryophytes predominantly reflects recent orongoing long-distance dispersal events (e.g. over thousands ofyears), or a worldwide spread acquired over much longertimescales (e.g. millions of years), is poorly known.
Ceratodon purpureus (Hedw.) Brid., is one of the mostwidespread and ruderal moss species known, and can be foundin an exceptionally wide geographic range from polar to tropicalareas (Ochyra et al., 2008). It is commonly found in harsh,ruderal habitats such as concrete surfaces, buildings, roofs,sidewalks, recently burnt soil and barren glacial deposits (Julesand Shaw, 1994; Shaw and Beer, 1999), and has a high toleranceto drought, pollution, and trampling (Clarke and Robinson,2008; Forman, 2014; Waterman et al., 2017). The species iscommonly used as a model organism in genetic, physiological,and developmental studies, in particular for studying theevolution of developmental processes in bryophytes (e.g.McDaniel et al., 2007, and references therein; Szövenyi et al.,2014). For this type of developmental research, good baselineknowledge on the evolutionary history and global biogeographyof a species is fundamental, for instance, for underpinninginterpretation of crossing experiments, trait mapping andmarker discovery, and controlling for demographic orpopulation effects.
The global genetic diversity in natural populations of C.purpureus was initially investigated by McDaniel and Shaw(2005) using a worldwide data set of n = 34 samples, includingthe chloroplast spacer atpB-rbcL and the nuclear genes adenosinekinase (adk) and phytochrome 2 (phy2). They found two distinctNorthern Hemisphere clades, a Southern Hemisphere clade
including some Northern Hemisphere specimens, and severalmore distantly related distinct lineages from equatorialregions, suggesting that migration between Australasian andHolarctic regions was more common than among equatorialregions. Overall, the study found that, while markers differedin implied population structure, the overall global populationstructure in C. purpureus was sparse, and provided evidence thatmigration is ongoing.
Here, we aim to gain a better understanding of the biogeographyof C. purpureus and assess the level of connectivity between itsglobally widespread populations. Building on the previousbiogeographic analysis of McDaniel and Shaw (2005), weconsiderably increased the global sampling (n = 147 samples; 257newly obtained sequences), focusing primarily on three chloroplastmarkers, the rps4 gene and trnL-F and atpB-rbcL spacers and, to alesser degree, one nuclear marker, the Internal Transcribed Spacer(ITS). We tested for global latitudinal and longitudinal populationstructure, providing an overall assessment of biogeographic patternsin the species. Finally, we assessed the relative divergence time ofmatrilineal divergent populations, and evaluated timescales overwhich such widespread populations have been isolated, with aparticular interest in those located in isolated, remote regions(e.g. Antarctica).
MATERIALS AND METHODS
Sampling and Molecular MethodsMoss samples for molecular analyses were obtained fromherbaria (AAS, BR, BM, E, WOLL, and NY) and freshcollections (see text and Supplementary Table S1 for sampleinformation). We included sequences available on GenBank, andunpublished sequences from the Honours thesis of RW (Wyber,2013), originally collected for microsatellite analyses (Clarkeet al., 2008, 2009). All specimens were confirmed as C. purpureusby specialist bryologists. Genomic DNA was extracted usingthe DNeasy Plant Mini Kit (Qiagen GmbH, Hilden, Germany),using a mortar and pestle and liquid nitrogen, followingthe manufacturer’s instructions. As C. purpureus has verysmall gametophytes, multiple stems were extracted per sampleto ensure sufficient DNA quantity. The trnL-F spacer, the rps4gene, atpB-rbcL spacer, and ITS were amplified using the primerstrnLF-c and trnLF-f (Taberlet et al., 1991), trnS (Souza-Chieset al., 1997) and rps 5′ (Nadot et al., 1994), atpB1 and rbcL1(Chiang et al., 1998) and ITS1 and ITS4 (White et al., 1990),respectively. PCR reactions were performed using the Taq PCRCore Kit (Qiagen GmbH, Hilden, Germany) with addition ofMgCl2 and Bovine Serum Albumin (BSA), using annealingtemperatures of 60°C, 55°C, 53°C, and 55°C for trnL-F, rps4,atpB-rbcL, and ITS, respectively. PCR products were checkedusing gel electrophoresis. For ITS, many samples revealed messyor double bands, and for a small selection of samples bands weresuccessfully excised and purified using the Wizard SV Gel andPCR clean up kit (Promega, USA), respectively. Forward andreverse sequencing was performed by LGC Genomics (Berlin,Germany) and the University of Wollongong sequencing facility.
Biersma et al. Global Biogeography Ceratodon purpureus
Frontiers in Plant Science | www.frontiersin.org August 2020 | Volume 11 | Article 5023592
Sequence AnalysisForward and reverse sequences were manually checkedand concatenated using CODONCODE ALIGNER v.5.0.2(CodonCode Corp., Dedham, MA). Totals of 74, 94, 80, and56 concatenated sequences of trnL-F (433–435 bp), rps4 (589bp), atpB-rbcL (623–627 bp) and ITS (674–816 bp) weregenerated, respectively. Sequences were deposited in GenBankas listed in Supplementary Table S1. Following McDanieland Shaw (2005), and based on Hedderson et al. (2004), weselected sequences of Cheilothela chloropus (Brid.) Lindb. andthree Dicranum species from GenBank as outgroups forphylogenetic chloroplast DNA (cpDNA) analyses. CpDNAregions were aligned using the Geneious aligner withinGENEIOUS 9.0.4 (Biomatters, LTD, Auckland, NZ). ITS wasaligned using PRANK (Löytynoja and Goldman, 2008), usingdefault settings. Obvious misalignments were adjusted by eye. Inthe case of partially incomplete data, short sections at the endsof alignments were excluded. The number of variable andparsimony informative sites of all cpDNA regions werecalculated using MEGA7 (Kumar et al., 2016). As McDanieland Shaw (2005) found evidence for a possible selective sweep,we tested for positive selection in the coding gene rps4 using theZ-test for synonymous vs. non-synonymous mutations, applyingthe Nei-Gojobori method with Jukes-Cantor correction, withinMEGA7 (Kumar et al., 2016).
Three alternative alignments of ITS were created; (i) a fullPRANK alignment, and with removal of ambiguously aligned orhypervariable regions using (ii) NOISY (Dress et al., 2008) and(iii) GBLOCKS (Castresana, 2000), using default settings. NOISYand GBLOCKS treatments resulted in alignments of length 588–678 and 514 bp, respectively. To test for recombination weapplied recombination detection methods within the programRDP v4.71 (Martin et al., 2015) to the original ITS alignment,using default settings.
Phylogenetic and PopulationGenetic AnalysesFor phylogenetic analyses the best-fitting models of evolutionwere investigated by locus, and by codon for rps4, withJMODELTEST-2.1.7 (Darriba et al., 2012) using the SPR treetopology search operation and AICc calculations. This providedthe models TIM1+G for atpB-rbcL and HKY+G for trnL-F. Therps4 marker was partitioned by codon position with modelTPM1uf selected for the first two codon positions and JC forthe third codon position.
To estimate population and species relationships, phylogeneticanalyses were performed using Bayesian and Maximumlikelihood (ML) methods. For individual cpDNA data setsindels were coded with simple indel coding (SIC; Simmonsand Ochoterena, 2000) in SEQSTATE v1.0. We investigatedfour different types of data sets, including i) each cpDNA locusseparately (including indel information, where present), ii) aconcatenated data set including samples for which all of rps4 andatpB-rbcL loci were complete, called the “rps4 + atpB-rbcL” dataset, and iii) a concatenated data set including only samples forwhich all three cpDNA loci had been sequenced, called the
“concatenated cpDNA” data set. This data set was analyzedwith and without indels. We also analyzed iv) a data set usingall samples and cpDNA loci which had been sequenced,including those samples for which only one or two lociwere available.
Bayesian analyses were performed using MRBAYES3.2 (Ronquist et al., 2012). Runs were continued for 1.5×10⁶
generations, sampling every 1.0×10³ generations, and discardingthe first 25% as burn-in. Convergence was assessed byconfirming that split frequencies had an average standarddeviation of < 0.01, and by using TRACER v.1.6 (Rambautet al., 2014) to confirm that all parameters exceeded effectivesample sizes (ESS) > 200. ML analyses were performed usingRAxML-GUI v1.3.1 (Silvestro and Michalak, 2012; Stamatakis,2014), using the “bootstrap + consensus” option (1000iterations), applying models of evolution most similar to bestfitting JMODELTEST-2.1.7 results in each case (e.g. GTR with orwithout the Gamma model of rate heterogeneity), and applyingdefault settings. Maximum clade credibility trees were visualizedusing FIGTREE v1.4.2 (http://tree.bio.ed.ac.uk/software/figtree/).
To investigate possible species clusters within the “concatenatedcpDNA” data set we used the web-based pairwise genetic distance-based Automatic Barcode Gap Discovery approach (ABGD;Puillandre et al., 2012), applying default settings. ABGD groupssamples into hypothetical candidate species based on non-overlapping values of intra- and interspecific genetic distances.We investigated Prior “maximum divergence of intraspecificdiversity” (Pmax) values over a range of 0.001–0.05.
To examine phylogeographic structure, TCS networks wereproduced for all loci, and for the “concatenated cpDNA” data setwithin POPART (Leigh and Bryant, 2015) using default settings.Within ITS, haplotype networks were constructed using original,NOISY and GBLOCKS alignments.
Population Diversity andDemographic AnalysesTo evaluate the cpDNA demographic history, we calculatedgenetic diversity indices, pairwise Kimura-2P distances,demographic and spatial expansion models, Tajima’s D(Tajima, 1989) and Fu’s Fs (Fu, 1997) neutrality tests for eachcpDNA locus with 10000 permutations, using ARLEQUINv3.5.1.2 (Excoffier and Lischer, 2010). Analyses were performedon the complete data set for each individual cpDNA marker, aswell as on the total “concatenated cpDNA” data set. The formerwere analyzed to investigate population processes using themaximum available sample sizes; the latter using the maximumavailable co-segregating sites. In the “concatenated cpDNA”analyses we also considered clade substructure withinCeratodon, and performed demographic analyses on the overalldata set (clades I–VII), and the large ABGD-inferred cluster asdefined with Pmax = 0.0017–0.0046 (clades III–VII) and Pmax =0.001 (clades IV–VII).
To investigate worldwide latitudinal and longitudinalgeographic structure, we divided the “concatenated cpDNA”data set and the GBLOCKS filtered ITS data set into three
Biersma et al. Global Biogeography Ceratodon purpureus
Frontiers in Plant Science | www.frontiersin.org August 2020 | Volume 11 | Article 5023593

partitions based on geographical areas. The three a priorilatitudinal partitions were based on the general atmosphericcirculation cells (see Farmer and Cook, 2013) composed of i)30°S–30°N: the area spanning the Hadley Cells between bothHorse Latitudes on each side of the equator, forming oneregion where air is circulating (via the trade winds); ii) > 30°N; and iii) > 30°S: the Ferrel Cells and Polar Cells at the higherlatitudes beyond both hemisphere’s Horse Latitudes, the twoother main regions where air is circulating (via the Westerliesand Polar easterlies). The a priori longitudinal partitionsincluded regions between 30°W–165°W (Americas), 60°E–30°W (Europe/Africa), and 165°W–60°E (Australia/Asia). Weconducted hierarchical AMOVA analysis of partitioning ofgenetic variation within and between regions in ARLEQUINv3.5.1.2, and calculated FST and FST differentiation, using10000 permutations. Here, FST estimates reflect differencesin composition and frequency between regions, FST
estimates reflect levels of evolutionary differentiation betweendifferent regions.
Divergence Time EstimationTo estimate the age of splits among populations we investigateddivergence times within the “concatenated cpDNA” data set inBEAST v2.6.2 (Bouckaert et al., 2014). In the absence of suitablefossils we used a relaxed log normal clock with nucleotidesubstitution rate of 5.0 × 10⁻⁴ and standard deviation of 1.0 ×10⁻⁴ substitutions/site/my, respectively; a rate previously appliedin bryophyte studies, and corresponding to the average absolutesubstitution rate of cpDNA across a wide range of land plantsand algae (see Villarreal and Renner, 2014, and referencestherein). We included the same outgroups, models ofevolution, and partitioning as described above. To investigatethe impact of tree prior choice on divergence times in a data setthat contains many population-level samples, as well aspotentially different species, we explored two types of tree
priors: i) a Coalescent Bayesian Skyline tree prior, and ii) aYule tree prior. All other parameter settings were identical.MCMC chains were run for 1.0 × 10⁸ generations, withparameters sampled every 103 generations. We combined logand tree files of three runs using LOGCOMBINER v2.6.2 with10% burn-in. TRACER v.1.6 (Rambaut et al., 2014) was used toassess ESS > 200 for all estimated parameters with 10% burn-in.The maximum clade credibility tree was visualized usingTREEANNOTATOR v1.8.2 (Drummond and Rambaut, 2007)and FIGTREE v1.4.2 (http://tree.bio.ed.ac.uk/software/figtree/).
RESULTS
Molecular Sequence DataThe final sample set comprised 147 samples with a widegeographic spread across the globe (distribution shown inFigure 1; Supplementary Table S1). All cpDNA markers hadlow nucleotide diversity (p > 0.01) (Supplementary Table S2), aswould be expected for these markers, which are more commonlyused for species- and genus-level rather than population-levelstudies (Stech and Quandt, 2010). The “concatenated cpDNA”alignment comprised a minimum total combined length of 1,645bp. Of the cpDNA markers, atpB-rbcL was most variable,followed by rps4 and trnL-F (18, 18, and 10 variable sites, and17, 12, and 7 parsimony informative (PI) sites, respectively). Wedetected no evidence for positive selection within rps4 (p > 0.05),but note that low numbers of variable sites limits our ability todraw strong conclusions.
ITS had much greater genetic variation than the cpDNAmarkers, reflected in the numbers of variable (115) and PI sites(61), even after treatment with NOISY or GBLOCKS (83 and 41variable sites and 60 and 20 PI sites, respectively). Many PCR-amplified samples provided a “clean” single band during
FIGURE 1 | Geographical distribution of Ceratodon purpureus samples. Colored dots refer to sequences generated in this study (yellow) and previously publishedstudies (remaining colors; for more information see Supplementary Table S1).
Biersma et al. Global Biogeography Ceratodon purpureus
Frontiers in Plant Science | www.frontiersin.org August 2020 | Volume 11 | Article 5023594

electrophoresis (Table S1). Other samples yielded double ormessy bands, and were not sequenced. Two sets of doublebands were successfully excised and sequenced, and revealedmultiple copies of ITS in the same specimens (samples fromHawaii and Australia, see Discussion for more detail). We didnot investigate the occurrence of ITS copies further (e.g. throughcloning) as ITS amplification of other contaminants e.g. fungi, iscommon in herbarium samples, and this approach would bebetter pursued through future studies with fresh rather than
degraded herbarium material. Recombination tests revealedevidence of recombination signals in five of the seven testsperformed (GENECONV, BOOTSCAN, MAXCHI, SISCANand 3SEQ; Martin et al., 2015).
Phylogenetic and PopulationGenetic AnalysesPhylogenetic trees and haplotype networks of the “concatenatedcpDNA” data set are presented in Figures 2A, B, respectively
A
B
C
FIGURE 2 | Bayesian phylogeny (A) and haplotype network (B) for Ceratodon purpureus constructed with a concatenated cpDNA data set (atpB-rbcL+rps4+trnL-F).Posterior probabilities and bootstrap support are shown next to branches (A). The scale bar represents the mean number of nucleotide substitutions per site.Biogeographic clade descriptions (I–VII) and ABGD species-clusters with different Pmax-values are shown next to (A). In (B) haplotype circle sizes and colorscorrespond to the number of specimens and clades I–VII, respectively. Branches represent mutations between haplotypes, with mutations shown as 1-step edges.(C) represents the sample locations and biogeographic regions of samples in the different clades (I–VII) as interpreted from the concatenated cpDNA data set (A), aswell as the placement of samples in phylogenies of single cpDNA markers (e.g. when samples were only represented by one or two single cpDNA marker(s); seealso Supplementary Figures S1A–D). For example, while the Mediterranean clade (III) includes just one sample (from Greece) in the concatenated cpDNA data set(A), clade III on the map in (C) includes one more sample from Greece (AY881059) and one from the Canary Islands (BM 27), based on the well-resolved placementof these samples in clade III in the Bayesian phylogenies of atpB-rbcL (Figure S1A) for the former, and rps4 and trnL-F (Figures S1C, D) for the latter, respectively.
Biersma et al. Global Biogeography Ceratodon purpureus
Frontiers in Plant Science | www.frontiersin.org August 2020 | Volume 11 | Article 5023595

(for trees and haplotypes of individual loci and the “rps4 + atpB-rbcL” data set see Supplementary Figures S1 and S2). Notopological conflicts were found between Bayesian and MLanalyses. Phylogenetic relationships were similar for analysesof the “concatenated cDNA” data set with and without indelsincluded (the former not shown).
Phylogenetic analyses of the “concatenated cpDNA” data setrevealed seven highly supported clades (posterior probability(PP) > 0.97, bootstrap values > 90) (Figure 2A). These included,in order, an Antarctic clade (I), a tropical clade (II), a single-specimen lineage originating from Greece (III), and a polytomyconsisting of an East African clade (IV), a bipolar clade (V), aSouthern Hemisphere clade (VI) and a Northern Hemisphereclade (VII). All single-locus analyses also resolved the first threeclades (I–III) (see Supplementary Figures S1A–C), while thelatter four clades were resolved only by atpB-rbcL and/or rps4.The phylogeny with all sequenced cpDNA loci (data set iv)showed very limited resolution by comparison, with mostsamples falling as a single large polytomy (data not shown).
The geographic ranges spanned by each clade (I–VII) areshown by locus in Supplementary Figures S1 and S2, andvisualized in Figure 2C. Clade I only included specimens fromthe maritime Antarctic. Clade II included specimens fromequatorial regions in the Palaeotropics and the Neotropics,including Papua New Guinea, Nepal, Reunion Island, Mexico,Costa Rica, and Bolivia. Clade III consisted of specimens fromGreece and the Canary Islands. The East African group (IV) wasnot resolved by individual loci, but appeared ancestral withinclades IV–VII (Figures 2A, B) and “rps4 + atpB-rbcL” data set(Supplementary Figure S1D), and included specimens fromReunion Island, Malawi, and Uganda. The bipolar clade (V)(Figures 2A–C) included specimens from western NorthAmerica, the sub-Antarctic, and Antarctic, as well as onespecimen from India (this was only resolved in the atpB-rbcLmarker; Figure S1A). The Southern Hemisphere clade (VI)included specimens from higher latitudes in the Southern
Hemisphere (South America, Australia, the sub-Antarctic, andAntarctica). Finally, the Northern Hemisphere clade (VII)included specimens from the Holarctic, Hawaii, and onespecimen from Ecuador.
The species delimitation method ABGD revealed three orfour significant “barcoding gaps” in the concatenated cpDNAdata set at Pmax = 0.0017–0.0046 (separating I, II, and III–VII)and Pmax = 0.001 (separating I, II, III, and IV–VII), respectively(see Figure 2A). Clades I and II were identified as differentspecies clusters from the rest of the data set in all the Pmax-valuesanalyzed, while clade III was only regarded as a distinct speciescluster at the lower Pmax-value.
Haplotype networks of ITS (based on GBLOCKS, NOISY,and original alignments (Figures 3A–C); for more detail seeSupplementary Figure S3) revealed that the same samplesrepresenting distinct clades I, II, and III in the cpDNA (seeFigure 2) were also genetically distinct in ITS, with long branch-lengths in all ITS networks (Figures 3A–C; Figure S3). Nodistinct clustering of the remaining cpDNA-defined clades (V–VII) was apparent in the ITS networks. Multiple gene copieswithin the same sample were placed in widely separated regionsin the haplotype networks (indicated with * in Figure S3).
Population Diversity andDemographic AnalysesFST and FST calculations of cpDNA revealed significantgenetic differentiation between the latitudinal geographic areas(Figure 4A; Supplementary Table S3). ITS also revealedsignificant genetic differentiation in composition and frequency(FST) between all latitudinally divided regions, but only thenorthern (> 30°N) and southern region (> 30°S) showedsignificant genetic differentiation (FST) from one another.When divided based on longitudinal geographic regions, bothcpDNA and ITS showed significant haplotypic differentiation(FST) between regions, but no significant evolutionarydifferentiation (FST) (Figure 4A; Supplementary Table S4).
A B C
FIGURE 3 | Haplotype networks of ITS for Ceratodon purpureus, after treatment with (A) GBLOCKS, (B) NOISY or as (C) original data. Haplotype circle sizes andcolors correspond to the number of specimens and globally recognized bryofloristic kingdoms (see legend; Schofield, 1992), respectively. Branches representmutations between haplotypes, with mutations shown as 1-step edges. Numbers (I–IV) indicate the placement of the same samples falling in clades I–IV as resolvedin the cpDNA data sets (see Figure 2).
Biersma et al. Global Biogeography Ceratodon purpureus
Frontiers in Plant Science | www.frontiersin.org August 2020 | Volume 11 | Article 5023596

Latitudinal regionalized partitions of cpDNA revealed FST > FSTin two population comparisons (tropical versus either north orsouth, Figure 4A; Supplementary Table S4), suggesting asignificant phylogeographic signal. This was not seen inlongitudinal regionalized partitions of cpDNA, or in the ITSdata for either latitudinal or longitudinal partition.
Hierarchical AMOVA analyses of cpDNA estimated that 21%and 17% of haplotypic (FST = 0.21, p < 0.01) and genetic (FST =0.17, p < 0.01) differentiation was found within latitudinal bands,respectively, while longitudinal regionalization showed weakerhaplotypic differentiation (FST = 0.14, p < 0.01) and no significantgenetic differentiation (FST = 0.06, p = 0.07) (Figure 4B;Supplementary Table S5). ITS revealed a less strong butsimilar pattern, with 14% and 6% of haplotypic (FST = 0.14,p < 0.01) and genetic (FST = 0.06, p < 0.05) differentiation foundamong latitudinal geographic regions, while longitudinalregionalization showed a decreased haplotypic differentiation(FST = 0.12, p < 0.01) and no significant genetic differentiation(FST = 0.01, p = 0.22) (Figure 4B; Supplementary Table S5).
The demographic expansion test on the concatenated cpDNAdata set of all clades (I–VII) was significant, rejecting ademographic expansion (Supplementary Table S2). Thespatial expansion test was non-significant, indicating that thegenetic pattern may be consistent with a spatial expansion.Tajima’s D was significantly negative in the full (I–VII)concatenated cpDNA data set, as well as the full data sets ofrps4 and trnL-F, suggesting that rare alleles were present in theseloci at lower frequencies than expected, indicative of a selectivesweep or past population expansion. However, Tajima’s D wasnot significant when the most divergent lineages (I–II) wereremoved, suggesting the significant results were mostlyinfluenced by cryptic population structure within C. purpureus.Furthermore, Fu’s Fs was not significant for any data set,suggesting that overall cpDNA does not support a rapid pastexpansion of C. purpureus on a global scale.
Divergence Time EstimationThe divergence time analysis using a coalescent tree priorindicated that the ancestor of the C. purpureus cladesoriginated in the mid- to late Miocene ~11.24 Mya (with 95%highest posterior density intervals (95HPD): 6.27–16.56 Mya; seeTable 1, Figure 5), a time when the Antarctic (I) and tropical (II)clade diverged from the remaining clades (III–VII). The splitsbetween clades III–VII and clades IV–VII (which were,depending on Pmax value, delimited as one species usingABGD; see Figure 2) were dated to be 4.76 (95HPD: 2.00–7.78) Mya and 2.22 (95HPD: 0.76–3.93) Mya, respectively.
Implementing a Yule tree prior the analysis indicated thatthe ancestor of the C. purpureus clades originated in the lateMiocene ~5.98 Mya (95HPD: 2.68–9.80 Mya; see Table 1,Supplementary Figure S4), and clade III diverged from theother clades ~4.66 Mya (95HPD: 1.95–7.85 Mya). The remainingclades (IV–VII) diverged ~3.81 Mya onwards (95HPD: 1.54–6.53Mya). Regardless of the tree prior used, the remaining clades(IV–VII) diverged throughout the late Pliocene to mid-
TABLE 1 | Mean estimated time to most recent common ancestor (TMRCA) (95%HDP lower–upper) for clades within the “concatenated cpDNA” data set (seeFigure 2A ) of Ceratodon purpureus, as calculated in BEAST.
Lineage TMRCA Mean ages (my) CoalescentBayesian Skyline tree prior
Mean ages (my)Yule tree prior
Cheilothela chloropus +Ceratodon purpureus
62.78 (26.94–91.13) 7.18 (3.90–12.20)
I–VII 11.24 (6.27–16.56) 5.98 (2.68–9.80)I–II 9.80 (4.86–14.85) 3.99 (0.92–7.11)III–VII 4.76 (2.00–7.78) 4.66 (1.95–7.85)IV–VII 2.22 (0.76–3.93) 3.81 (1.54–6.53)I Antarctic 9.19×10⁻² (2.21×10⁻⁷ to 0.36) 0.72 (1.43×10⁻⁶
to 2.22)II Tropical 0.68 (2.97×10⁻³ to 2.06) 1.49 (0.07–3.45)IV East-African 0.11 (2.47×10⁻⁷ to 0.45) 0.91 (2.33×10⁻⁶
to 2.56)V Bipolar 0.33 (1.46×10⁻² to 0.83) 1.99 (0.49–3.85)VI Southern
Hemisphere0.55 (4.47×10⁻² to 1.30) 2.23 (0.61–4.18)
VII NorthernHemisphere
0.61 (6.39×10⁻² to 1.37) 2.55 (0.84–4.63)
A
B
FIGURE 4 | (A) Pairwise FST and FST values and (B) analysis of molecularvariance (AMOVA) within Ceratodon purpureus populations based onlatitudinal and longitudinal geographically divided areas, including samplesfrom the “concatenated cpDNA” and GBLOCKS filtered ITS data set. Fordetails see Tables S3–S5. For geographically divided areas see legend in (A).P-values are represented by * for P < 0.05 and ** for P < 0.01.
Biersma et al. Global Biogeography Ceratodon purpureus
Frontiers in Plant Science | www.frontiersin.org August 2020 | Volume 11 | Article 5023597

Quaternary, also a period of global cooling (Hansen et al., 2013;for a comparison with global surface temperature see Figure 5).All nodes had high posterior support (Figure 5), except for thenode uniting clades IV and VI, and that separating V from IV+VI, relationships which were also not strongly supported in thephylogenetic analyses (Figure 2A). The phylogenies of BEAST(Figures 5 and S4) and MrBayes (Figure 2) showed a topologicalinconsistency (with clade I being sister to the remainder ofCeratodon clades in the latter, while clades I and II were sisterto each other in the former analyses). The analysis in BEASTincorporates a relaxed clock, which has a potential to improvephylogenetic accuracy but on the other hand can be less precisethan the time-free approach taken in MrBayes, depending on thetrue underlying evolutionary pattern (Wertheim et al., 2010).
Consequently, we decided to retain both topologies despite theminor biogeographic differences.
DISCUSSION
Old Lineages in DistinctBiogeographic RegionsThe analysis of the cpDNA loci within C. purpureus revealedwell-supported, several hundreds of thousands to multi-million-year old lineages derived from distinct global regions (Figures 2and 3). This surprising finding implies that the globaldistribution of a ruderal, cosmopolitan species such as C.purpureus is mainly the result of a worldwide spread achievedby dispersal and establishment over hundreds of thousands tomillion-year timescales rather than high-frequency long-distancedispersal events, as would be expected for a highly ruderalspecies. The old age of the genus Ceratodon is also in line withprevious age estimates implementing fossil ages (Laenenet al., 2014).
The matrilineal lineages were mainly strongly linked withlatitude (Figures 2C and 4; Supplementary Tables S3–S5). Thisglobal latitudinal structuring was particularly evident for cpDNA(significant FST and FST; Figure 4), and partly reflected in ITS(significant FST, while only one latitudinal comparison showed asignificant FST). Biogeographic patterns were in line with thosefound by McDaniel and Shaw (2005), while the increasedsampling and additional cpDNA loci considerably expandedthe geographic extent and characterization of several clades(particularly newly-recognized clades I and VI).
All cpDNA loci (Figures 2 and 3) and the ITS marker(Supplementary Figure S3) revealed particularly strongdifferentiation of the first three clades identified (I–III). TheABGD species delimitation method supported a species complexwith at least three (I, II, and III–VII) and possibly four (alsodividing III from IV–VII) species, with the whole complexreferred to as C. purpureus sensu lato (s.l.) hereafter.
Several taxonomic studies have previously also notedphenotypic differentiation within geographically separatedpopulations of C. purpureus (Burley and Pritchard, 1990;Ochyra et al., 2008, and references therein), observations whichregain credence based on the genetic differentiation of cpDNAand ITS regions within C. purpureus s.l., and which are ofrelevance to future developmental studies using the species as amodel species.
In their global revision of the Ceratodon genus, Burley andPritchard (1990) identified four species and three subspeciesbased on a quantitative assessment of morphological characters.Although their work did not gain wide acceptance (Ochyra et al.,2008), the phylogeny and geographic regions of their describedspecies and subspecies show a striking similarity with the geneticpatterns obtained in our study. The overlap in geographicregions in the Holarctic occupied by C. purpureus ssp.purpureus with Northern Hemisphere clade VII suggestsan agreement between morphological and genetic evidence. Asimilar resemblance was found in the occurrence of Holantarctic
FIGURE 5 | Time-calibrated phylogeny of Ceratodon purpureus. Themaximum clade credibility tree presents the median divergence timeestimates for major lineages (Figure 2A) from a concatenated cpDNA dataset (atpB-rbcL+rps4+trnL-F) using a coalescent tree prior. Node barsrepresent 95% height posterior distribution of age estimates. Posteriorsupport (PP) values are shown below nodes, with PP < 0.5 provided as *.Global surface temperature estimates (blue and solid line representingtemperature variations and a 500 kyr smoothed resolution, respectively),reproduced from Hansen et al. 2013, are provided below. Due to the old age(62.78 Mya; 95HDP 26.94–91.13 Mya; ) the split of the outgroup Cheilothelachloropus and Ceratodon purpureus is not shown in this figure. Note that thelower part of the 95HPD range of the two oldest nodes is not shown, butgiven in numbers above the node bars. Scale bar indicates the number ofsubstitutions per site. Illustration by Christiaan Sepp (Kops et al., 1868;Wikimedia Commons).
Biersma et al. Global Biogeography Ceratodon purpureus
Frontiers in Plant Science | www.frontiersin.org August 2020 | Volume 11 | Article 5023598

C. purpureus ssp. convolutes (Reichardt) J.S. Burley and SouthernHemisphere clade VI. Although ssp. convolutes was suggested tobe found in southern South America, the sub-Antarctic andAustralia (Burley and Pritchard, 1990), we also find manyspecimens of this clade (VI) in Antarctica. The third describedsubspecies in Burley and Pritchard (1990), C. purpureus ssp.stenocarpus (B.S.G.) Dix., found in equatorial regions of the Oldand New World, has a distribution consistent with that oftropical clade II.
Other lineages for which distinct overlap was found in bothbiogeography and phylogenies of work by Burley and Pritchard(1990) included: 1) the bipolar species consisting of themorphologically similar Antarctic C. antarcticus Card. andArctic C. purpureus ssp. arcticus Kindb., showing an overlapwith bipolar clade V; and 2) the distinct European (or Eurasian)C. conicus (Hamp.) Lindb., showing a possible overlap withclade III.
The morphological differences in Ceratodon between differentgeographic areas reported by Burley and Pritchard (1990) pointtowards a phenotypic response to local environmentalconditions. It should be noted however, that we did notdirectly compare our samples with the exact samples used inBurley and Pritchard (1990), nor did we make detailedmorphological re-assessments of our specimens, and thereforefurther morphological assessments are needed to clarify thestatus of these taxa. However, it is clear that several ancientand geographically distinct lineages within specimensmorphologically assigned to C. purpureus s.l. exists, a patternthat might be similar in other species that are currently assumedto be globally distributed cosmopolitan species.
Concordance in Phylogeographic PatternsBetween cpDNA and ITSBiogeographic patterns of cpDNA were only partly mirrored byITS. The latter revealed clear differentiation of the earlierdiverging lineages (primarily clades I–III; Figure 3); however,the remaining clades could not be clearly distinguished, and ITShaplotypes could be found across geographically separated areasaround the globe (Figure 3).
ITS and cpDNA revealed concordance in most ofthe population FST and FST comparisons according to latitudeor longitude. Both genetic compartments revealed significanthaplotypic differentiation (FST) in all latitudinal and longitudinalpopulation comparisons. However, while cpDNA showedsignificant evolutionary differentiation (FST) in all latitudinalcomparisons (implying a latitudinal biogeographic signal), thiswas only found in one latitudinal population comparison (> 30°N vs. > 30°S) in ITS (Figure 4A; Supplementary Table S4).Neither cpDNA nor ITS showed significant evolutionarydifferentiation (FST) in any of the longitudinal partitioncomparisons, implying that there is no strong longitudinalbiogeographic signal.
This observed difference in geographical patterns and FST
values in latitudinal population comparisons between cpDNA vs.nDNA could have several origins. The different nuclear pattern is
unlikely to be attributed to migration of male gametes: the latter(unlike pollen in angiosperms) have an extremely limiteddispersal capacity in mosses (Pressel and Duckett, 2019). Thenuclear pattern is more likely to be caused by paralogy andevolution of pseudogenes. Previous research has shown C.purpureus has undergone an ancient nuclear genomeduplication (Szövenyi et al., 2014), a finding also shown inMcDaniel and Shaw (2005) through the different gene copiesof adk and phy2. In addition, ITS is known to have paralogouscopies in mosses (Vanderpoorten et al., 2006). In our study wealso found ITS had copies in several samples, and the twosamples for which two different copies were sequenced wereplaced in widely spaced haplotypes in the haplotype network(Figure S3). In addition to multiple paralogous copies, the signalof the nDNA is likely influenced by the use of multiple mossshoots in the DNA extraction, and other factors such asrecombination (shown in adk and phy2 in McDaniel andShaw, 2005, and ITS in this study), genetic interactions amongnuclear loci (McDaniel et al., 2007; McDaniel et al., 2008), andpossibly by processes such as hybridization among populations,selection or incomplete lineage sorting (i.e., cpDNA is haploidand therefore is subject to more rapid genetic drift than nuclearDNA, while the nuclear DNA has undergone genomeduplication, shows high diversity and extensive recombination).
Previously, McDaniel and Shaw (2005) suggested the cpDNAto have undergone a selective sweep. Our results are consistentwith this possibility, with current levels of diversity suggesting aselective sweep prior to the mid-Miocene, with subsequentcpDNA population structure likely reflecting patterns of winddispersal since this time. In contrast the nuclear genome mayreflect much older patterns of dispersal and connectivity over theTertiary period.
Although our genealogical history of ITS is not complete (dueto the difficulty of obtaining paralogous copies with degradedherbarium specimens), we highlight the importance ofcombining nuclear and plastid markers to unravel evolutionaryhistories, as both are part of a species’ biology. We await futurestudies on the nuclear genome of C. purpureus (using freshrather than herbarium samples) to advance knowledge on nDNAbiogeographic patterns, as well as the extent, causes andconsequences of recombination and genome doubling on theevolution in C. purpureus and other non-vascular plants.
Drivers of Dispersal and EstablishmentWe found clear biogeographic structuring dividing the mainglobal populations of C. purpureus s.l. into physically distinct“latitudinal” geographic areas (see Figures 2C and 4;Supplementary Tables S3–S5). This structuring is plausiblylinked with atmospheric circulation patterns (see Figure 6 forgeneral global wind patterns overlaying the distributions of theSouthern Hemisphere, Northern Hemisphere, tropical clades).Generally, global air masses, and thus particles that are carriedwithin them, are retained within particular latitudinal bands orgeographic regions. At higher latitudes in both hemispheres, theprevailing westerly winds (blue arrows; Figure 6) generally
Biersma et al. Global Biogeography Ceratodon purpureus
Frontiers in Plant Science | www.frontiersin.org August 2020 | Volume 11 | Article 5023599
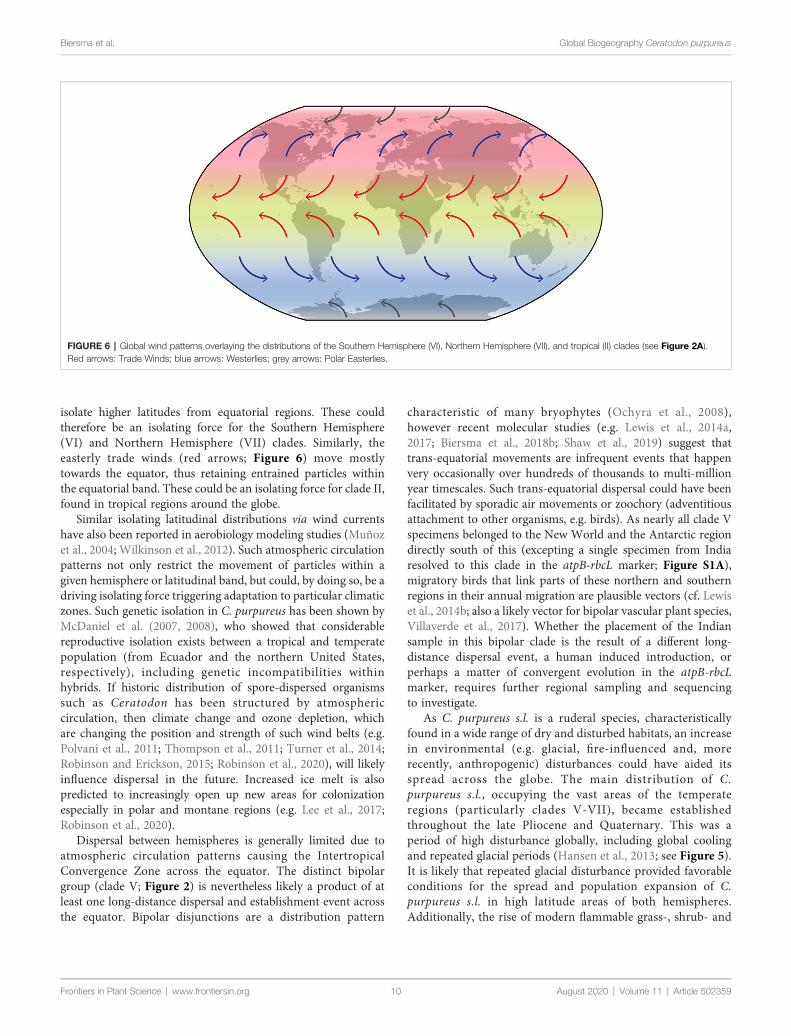
isolate higher latitudes from equatorial regions. These couldtherefore be an isolating force for the Southern Hemisphere(VI) and Northern Hemisphere (VII) clades. Similarly, theeasterly trade winds (red arrows; Figure 6) move mostlytowards the equator, thus retaining entrained particles withinthe equatorial band. These could be an isolating force for clade II,found in tropical regions around the globe.
Similar isolating latitudinal distributions via wind currentshave also been reported in aerobiology modeling studies (Muñozet al., 2004; Wilkinson et al., 2012). Such atmospheric circulationpatterns not only restrict the movement of particles within agiven hemisphere or latitudinal band, but could, by doing so, be adriving isolating force triggering adaptation to particular climaticzones. Such genetic isolation in C. purpureus has been shown byMcDaniel et al. (2007, 2008), who showed that considerablereproductive isolation exists between a tropical and temperatepopulation (from Ecuador and the northern United States,respectively), including genetic incompatibilities withinhybrids. If historic distribution of spore-dispersed organismssuch as Ceratodon has been structured by atmosphericcirculation, then climate change and ozone depletion, whichare changing the position and strength of such wind belts (e.g.Polvani et al., 2011; Thompson et al., 2011; Turner et al., 2014;Robinson and Erickson, 2015; Robinson et al., 2020), will likelyinfluence dispersal in the future. Increased ice melt is alsopredicted to increasingly open up new areas for colonizationespecially in polar and montane regions (e.g. Lee et al., 2017;Robinson et al., 2020).
Dispersal between hemispheres is generally limited due toatmospheric circulation patterns causing the IntertropicalConvergence Zone across the equator. The distinct bipolargroup (clade V; Figure 2) is nevertheless likely a product of atleast one long-distance dispersal and establishment event acrossthe equator. Bipolar disjunctions are a distribution pattern
characteristic of many bryophytes (Ochyra et al., 2008),however recent molecular studies (e.g. Lewis et al., 2014a,2017; Biersma et al., 2018b; Shaw et al., 2019) suggest thattrans-equatorial movements are infrequent events that happenvery occasionally over hundreds of thousands to multi-millionyear timescales. Such trans-equatorial dispersal could have beenfacilitated by sporadic air movements or zoochory (adventitiousattachment to other organisms, e.g. birds). As nearly all clade Vspecimens belonged to the New World and the Antarctic regiondirectly south of this (excepting a single specimen from Indiaresolved to this clade in the atpB-rbcL marker; Figure S1A),migratory birds that link parts of these northern and southernregions in their annual migration are plausible vectors (cf. Lewiset al., 2014b; also a likely vector for bipolar vascular plant species,Villaverde et al., 2017). Whether the placement of the Indiansample in this bipolar clade is the result of a different long-distance dispersal event, a human induced introduction, orperhaps a matter of convergent evolution in the atpB-rbcLmarker, requires further regional sampling and sequencingto investigate.
As C. purpureus s.l. is a ruderal species, characteristicallyfound in a wide range of dry and disturbed habitats, an increasein environmental (e.g. glacial, fire-influenced and, morerecently, anthropogenic) disturbances could have aided itsspread across the globe. The main distribution of C.purpureus s.l., occupying the vast areas of the temperateregions (particularly clades V-VII), became establishedthroughout the late Pliocene and Quaternary. This was aperiod of high disturbance globally, including global coolingand repeated glacial periods (Hansen et al., 2013; see Figure 5).It is likely that repeated glacial disturbance provided favorableconditions for the spread and population expansion of C.purpureus s.l. in high latitude areas of both hemispheres.Additionally, the rise of modern flammable grass-, shrub- and
FIGURE 6 | Global wind patterns overlaying the distributions of the Southern Hemisphere (VI), Northern Hemisphere (VII), and tropical (II) clades (see Figure 2A).Red arrows: Trade Winds; blue arrows: Westerlies; grey arrows: Polar Easterlies.
Biersma et al. Global Biogeography Ceratodon purpureus
Frontiers in Plant Science | www.frontiersin.org August 2020 | Volume 11 | Article 50235910
woodlands (late Miocene onwards with peak origins in latePliocene; Bond, 2015) could have promoted its spread, as C.purpureus s.l. is also frequently found in fire-influenced habitats(Clement and Touffet, 1988; even called “fire moss” as acommon name). Furthermore, in the recent post-quaternaryperiod, the origin and expansion of urban environmentsprovided major sources of anthropogenically influenceddisturbance potentially favorable to C. purpureus s.l.
Multiple Antarctic Colonizations, Includingan Ancient LineageC. purpureus s.l. is one of the most widespread moss speciesfound across the Antarctic (Ochyra et al., 2008). Ochyra et al.(2008) noted considerable diversity in leaf size and morphologybetween Antarctic C. purpureus s.l. plants, suggesting thepresence of multiple lineages within Antarctica, a findingconfirmed here by the presence of multiple origins of Antarcticpopulations (clades I, V, and VI). This reveals that Antarctica isnot as isolated as is often assumed for spore-dispersed organisms(also seen in the Antarctic moss Chorisodontium aciphyllum(Hook. f. & Wils.) Broth.; Biersma et al., 2018a). Recently, Pisaet al. (2014) also proposed at least three independent origins ofthe moss Bryum argenteum Hedw. in Antarctica, and even thevascular plant Colobanthus quitensis (with much larger seedsthan moss spores) was also found to have at least twoindependent origins in the Antarctic Peninsula (Biersmaet al., 2020).
According to the dating analysis, Antarctic clade I, whosemembers consist only of specimens from the Antarctic Peninsulaand the South Orkney Islands, has been isolated since the lateMiocene or early Pliocene (Table 1; Figures 5 and S4). Althoughmore extensive sampling may be required to fully assess whetherclade I is limited to Antarctica, its apparent ancient isolationsuggests it may be a remnant lineage that has survived pastglaciations in the maritime Antarctic in situ. Its arrival couldhave coincided with relatively warm interglacials on theAntarctic Peninsula during the early Pliocene (particularlybetween ~4.5–4.4 and ~3.6–3.4 Mya; De Schepper et al., 2014).Recent climate and glaciological modeling studies havehighlighted greater dynamism in glacial extent than previouslyconsidered possible throughout the early Pliocene andPleistocene (Scherer et al., 2008; Naish et al., 2009; Pollard andDeConto, 2009; De Schepper et al., 2014; DeConto and Pollard,2016), suggesting the possibility of ice-free local refugial areaspersisting throughout these periods (e.g. as suggested by Fraseret al., 2014). Molecular, phylogenetic and biogeographic studiesalso suggest in situ survival for many groups of terrestrial faunain Antarctica throughout the Quaternary, Neogene and evenPaleogene (see Convey et al., 2008, 2009, 2020, and referencestherein). Recently, increased evidence has also been found ofmillion-year persistence of the Antarctic flora, e.g. several speciesof Schistidium (Biersma et al., 2018b), and B. argenteum (Pisaet al., 2014). Here, our data indicate that at least one lineage (I) ofC. purpureus s.l. may also have had a long-term Antarcticpresence in situ.
DATA AVAILABILITY STATEMENT
Sequences are uploaded to GenBank with accessionsMN542517–MN542603, MN542604–MN542650, MN552307–MN552379 and MN556618–MN556666 (see SupplementaryTable S1). Phylogenetic matrixes (MrBayes and BEAST inputfiles), tree files and POPART input files are uploaded in theSupplementary Material.
AUTHOR CONTRIBUTIONS
PC, EB, RW, and SR conceived the study, with details furtherdeveloped by JJ, MD, KL, and HG. SR, MD, and RW conceivedand executed a small pilot study. EB, BV, and RW conducted themajority of herbarium sampling. EB and RW carried out themolecular work. EB, with guidance from JJ, conducted theanalyses and wrote the manuscript. All authors contributed tothe article and approved the submitted version.
FUNDING
This study was funded by a Natural Environment Research Council(NERC) PhD studentship (ref NE/K50094X/1), NERC-CONICYT(NE/P003079/1) and Carlsberg Foundation (CF18-0267) to EB andNERC core funding to the BAS Biodiversity, Evolution, andAdaptation Team, and Australian Research Council (ARC)Discovery Project DP180100113 funding to SR and PC.
ACKNOWLEDGMENTS
We are grateful for comments of Stuart McDaniel, Matthew G.Johnson and Alain Vanderpoorten, which greatly improvedearlier versions of this article. We thank Johanna Turnbull,Laurence Clarke, Alison Downing, Marc Lebouvier, RyszardOchyra, Stuart McDaniel, Helena Korpeläinen, AngelicaCasanova-Katny, Graham Bell and curators of herbaria BR,BM, AAS, WOLL, E, NY for providing specimens or DNA.We are grateful for the support of the French Polar Institute(program 136), the Australian Antarctic Division and InstitutoAntartico Chileno for support to collect specimens. We thankLaura Gerrish (British Antarctic Survey) for preparing Figures 1and 2C. This research contributes to the Scientific Committee onAntarctic Research “State of the Antarctic Ecosystem” program.
SUPPLEMENTARY MATERIAL
The Supplementary Material for this article can be found onlineat: https://www.frontiersin.org/articles/10.3389/fpls.2020.502359/full#supplementary-material
Biersma et al. Global Biogeography Ceratodon purpureus
Frontiers in Plant Science | www.frontiersin.org August 2020 | Volume 11 | Article 50235911
REFERENCES
Biersma, E. M., Jackson, J. A., Hyvönen, J., Koskinen, S., Linse, K., Griffiths, H.,et al. (2017). Global biogeographic patterns in bipolar moss species. R. SocOpen Sci. 4:170147. doi: 10.1098/rsos.170147
Biersma, E. M., Jackson, J. A., Bracegirdle, T. J., Griffiths, H., Linse, K., and Convey, P.(2018a). Low genetic variation between South American and Antarctic populationsof the bank−forming moss Chorisodontium aciphyllum (Dicranaceae). Polar. Biol.41, 599–610. doi: 10.1007/s00300-017-2221-1
Biersma, E. M., Jackson, J. A., Stech, M., Griffiths, H., Linse, K., and Convey, P.(2018b). Molecular data suggest long-term in situ Antarctic persistence withinAntarctica’s most speciose plant genus, Schistidium. Front. Ecol. Evol. 6:77.doi: 10.3389/fevo.2018.00077
Biersma, E. M., Torres-Dıaz, C., Molina-Montenegro, M. A., Newsham, K. K.,Vidal, M. A., Collado, G. A., et al. (2020). Multiple post-glacial colonisationevents of the Antarctic pearlwort Colobanthus quitensis (Caryophyllaceae)reveal the recent arrival of native Antarctic vascular flora. J. Biogeogr. 00, 1–11.doi: 10.1111/jbi.13843
Bond, W. J. (2015). Fires in the Cenozoic: a late flowering of flammableecosystems. Front. Plant Sci. 5:749. doi: 10.3389/fpls.2014.00749
Bouckaert, R., Heled, J., Kühnert, D., Vaughan, T., Wu, C. H., Xie, D., et al. (2014).BEAST 2: a software platform for Bayesian evolutionary analysis. PLoSComput. Biol. 10, e1003537. doi: 10.1371/journal.pcbi.1003537
Burley, J. S., and Pritchard, N. M. (1990). Revision of the genus Ceratodon(Bryophyta). Harv. Pap. Bot. 2, 17–76.
Castresana, J. (2000). Selection of conserved blocks from multiple alignments fortheir use in phylogenetic analysis. Mol. Biol. Evol. 17, 540–552. doi: 10.1093/oxfordjournals.molbev.a026334
Chiang, T.-Y., Schaal, B. A., and Peng, C.-I. (1998). Universal primers foramplification and sequencing a noncoding spacer between the atpB and rbcLgenes of chloroplast DNA. Bot. Bull. Acad. Sinica. 39, 245–250.
Clarke, L. J., Ayre, D. J., and Robinson, S. A. (2008). Somatic mutation and theAntarctic ozone hole. J. Ecol. 96, 378–385. doi: 10.1111/j.1365-2745.2007.01347.x
Clarke, L. J., and Robinson, S. A. (2008). Cell wall-bound ultraviolet-screeningcompounds explain the high ultraviolet tolerance of the Antarctic moss,Ceratodon purpureus. New Phytologist 179 (3), 776–783. doi: 10.1111/j.1469-8137.2008.02499.x
Clarke, L. J., Robinson, S. A., and Ayre, D. J. (2009). Genetic structure of Antarcticpopulations of the moss Ceratodon purpureus. Antarct. Sci. 21, 51–58.doi: 10.1017/S0954102008001466
Clement, B., and Touffet, J. (1988). Le role des bryophytes dans la recolonisationdes landes après incendie. Cryptogamie Bryol. L. 9 (4), 297–311.
Convey, P., Smith, R.II, Hodgson, D. A., and Peat, H. J. (2000). The flora of theSouth Sandwich Islands, with particular reference to the influence ofgeothermal heating. J. Biogeogr. 27, 1279–1295. doi: 10.1046/j.1365-2699.2000.00512.x
Convey, P., Gibson, J. A., Hillenbrand, C. D., Hodgson, D. A., Pugh, P. J., Smellie,J. L., et al. (2008). Antarctic terrestrial life - challenging the history of the frozencontinent? Biol. Rev. Camb. Philos. Soc 83, 103–117. doi: 10.1111/j.1469-185X.2008.00034.x
Convey, P., Bindschadler, R., Di Prisco, G., Fahrbach, E., Gutt, J., Hodgson, D. A.,et al. (2009). Antarctic climate change and the environment. Antarct. Sci. 21,541–563. doi: 10.1017/S0954102009990642
Convey, P., Biersma, E. M., Casanova-Katny, A., and Maturana, C. S. (2020).“Refuges of Antarctic diversity,” in Past Antarctica. Eds. M. Oliva and J. Ruiz-Fernandez (Cambridge, MA: Academic Press), 181–200. doi: 10.1016/B978-0-12-817925-3.00010-0
Darriba, D., Taboada, G. L., Doallo, R., and Posada, D. (2012). jModelTest 2: moremodels, new heuristics and parallel computing. Nat. Methods 9, 772.doi: 10.1038/nmeth.2109
De Schepper, S., Gibbard, P. L., Salzmann, U., and Ehlers, J. (2014). A globalsynthesis of the marine and terrestrial evidence for glaciation during thePliocene Epoch. Earth Sci. Rev. 135, 83–102. doi: 10.1016/j.earscirev.2014.04.003
DeConto, R. M., and Pollard, D. (2016). Contribution of Antarctica to past andfuture sea-level rise. Nature 531, 591–597. doi: 10.1038/nature17145
Dress, A. W., Flamm, C., Fritzsch, G., Grunewald, S., Kruspe, M., Prohaska, S. J.,et al. (2008). Noisy: identification of problematic columns in multiple sequencealignments. Algorithms Mol. Biol. 3:7. doi: 10.1186/1748-7188-3-7
Drummond, A. J., and Rambaut, A. (2007). BEAST: Bayesian evolutionary analysisby sampling trees. BMC Evol. Biol. 7:214. doi: 10.1186/1471-2148-7-214
Excoffier, L., and Lischer, H. E. (2010). Arlequin suite ver 3.5: a new series ofprograms to perform population genetics analyses under Linux and Windows.Mol. Ecol. Resour. 10, 564–567. doi: 10.1111/j.1755-0998.2010.02847.x
Farmer, G. T., and Cook, J. (2013). “Atmospheric Circulation and Climate,” inClimate Change Science: A Modern Synthesis (Dordrecht: Springer), 231–243.doi: 10.1007/978-94-007-5757-8_11
Fontaneto, D. (Ed.) (2011). Biogeography of Microscopic Organisms: Is EverythingSmall Everywhere? (Systematics Association Special Volume Series) (Cambridge:Cambridge University Press). doi: 10.1017/CBO9780511974878
Forman, R. T. T. (2014). “Urban habitat, vegetation, plants,” in Urban Ecology:Science of Cities. Ed. R. T. T. Forman (Cambridge: Cambridge UniversityPress), 205–240. doi: 10.1017/CBO9781139030472.010
Frahm, J. P. (2007). “Diversity, dispersal and biogeography of bryophytes (mosses).”in Protist Diversity and Geographical Distribution, Topics in Biodiversity andConservation Vol. 8. Eds. W. Foissner and D. L. Hawksworth (Dordrecht:Springer), 43–50. doi: 10.1007/978-90-481-2801-3_4
Fraser, C.II, Terauds, A., Smellie, J., Convey, P., and Chown, S. L. (2014).Geothermal activity helps life survive glacial cycles. Proc. Natl. Acad. Sci. U.S. A. 111, 5634–5639. doi: 10.1073/pnas.1321437111
Fu, Y. X. (1997). Statistical tests of neutrality of mutations against populationgrowth, hitchhiking and background selection. Genetics 147, 915–925.
Hansen, J., Sato, M., Russell, G., and Kharecha, P. (2013). Climate sensitivity, sealevel and atmospheric CO2. Philos. Trans. R. Soc A. 371, 20120294.doi: 10.1098/rsta.2012.0294
Hedderson, T. A., Murray, D. J., Cox, C. J., and Nowell, T. L. (2004). Phylogeneticrelationships of haplolepideous mosses (Dicranidae) inferred from rps4 genesequences. Syst. Biol. 29, 29–41. doi: 10.1600/036364404772973960
Heinrichs, J., Hentschel, J., Feldberg, K., Bombosch, A., and Schneider, H. (2009).Phylogenetic biogeography and taxonomy of disjunctly distributed bryophytes.J. Syst. Evol. 47, 497–508. doi: 10.1111/j.1759-6831.2009.00028.x
Huttunen, S., Hedenäs, L., Ignatov, M. S., Devos, N., and Vanderpoorten, A.(2008). Origin and evolution of the northern hemisphere disjunction in themoss genus Homalothecium (Brachytheciaceae). Am. J. Bot. 95, 720–730.doi: 10.3732/ajb.2007407
Jules, E. S., and Shaw, A. J. (1994). Adaptation to metal-contaminated soils inpopulations of the moss, Ceratodon purpureus: vegetative growth andreproductive expression. Am. J. Bot. 81, 791–797. doi: 10.1002/j.1537-2197.1994.tb15516.x
Karlin, E. F., Hotchkiss, S. C., Boles, S. B., Stenøien, H. K., Hassel, K., Flatberg, K.II,et al. (2012). High genetic diversity in a remote island population system: sanssex. New Phytol. 193, 1088–1097. doi: 10.1111/j.1469-8137.2011.03999.x
Kops, J., Hartsen, F. A., and van Eeden, F. W. (1868). Flora Batava, ofAfbeeldingen en Beschrijving van Nederlandsche gewassen.. XIII Deel 13(Amsterdam, the Netherlands: J. C. Sepp en Zoon).
Kumar, S., Stecher, G., and Tamura, K. (2016). MEGA7: molecular evolutionarygenetics analysis version 7.0 for bigger datasets. Mol. Biol. Evol. 3, 1870–1874.doi: 10.1093/molbev/msw054
Kyrkjeeide, M. O., Hassel, K., Flatberg, K.II, Shaw, A. J., Brochmann, C., andStenøien, H. K. (2016). Long-distance dispersal and barriers shape geneticstructure of peatmosses (Sphagnum) across the Northern Hemisphere.J. Biogeogr. 43, 1215–1226. doi: 10.1111/jbi.12716
Laenen, B., Shaw, B., Schneider, H., Goffinet, B., Paradis, E., Desamore, A., et al.(2014). Extant diversity of bryophytes emerged from successive post-Mesozoicdiversification bursts. Nat. Commun. 5 (1), 1–6. doi: 10.1038/ncomms6134
Lee, J. R., Raymond, B., Bracegirdle, T. J., Chades, I., Fuller, R. A., Shaw, J. D., et al.(2017). Climate change drives expansion of Antarctic ice-free habitat. Nature547, 49. doi: 10.1038/nature22996
Leigh, J. W., and Bryant, D. (2015). popart: full-feature software for haplotypenetwork construction. Methods Ecol. Evol. 6, 1110–1116. doi: 10.1111/2041-210X.12410
Lewis, L. R., Rozzi, R., and Goffinet, B. (2014a). Direct long-distance dispersalshapes a New World amphitropical disjunction in the dispersal-limited dung
Biersma et al. Global Biogeography Ceratodon purpureus
Frontiers in Plant Science | www.frontiersin.org August 2020 | Volume 11 | Article 50235912

moss Tetraplodon (Bryopsida: Splachnaceae). J. Biogeogr. 41, 2385–2395.doi: 10.1111/jbi.12385
Lewis, L. R., Behling, E., Gousse, H., Qian, E., Elphick, C. S., Lamarre, J. -F., et al.(2014b). First evidence of bryophyte diaspores in the plumage oftransequatorial migrant birds. PeerJ 2, e424. doi: 10.7717/peerj.424
Lewis, L. R., Biersma, E. M., Carey, S. B., Holsinger, K., McDaniel, S. F., Rozzi, R.,et al. (2017). Resolving the northern hemisphere source region for the long-distance dispersal event that gave rise to the South American endemic dungmoss Tetraplodon fuegianus. Am. J. Bot. 104, 1651–1659. doi: 10.3732/ajb.1700144
Longton, R. E. (1997). Reproductive biology and life-history strategies. Adv. Bryol. 6, 101.Löytynoja, A., and Goldman, N. (2008). Phylogeny-aware gap placement prevents
errors in sequence alignment and evolutionary analysis. Science 320, 1632–1635. doi: 10.1126/science.1158395
Martin, D. P., Murrell, B., Golden, M., Khoosal, A., and Muhire, B. (2015). RDP4:Detection and analysis of recombination patterns in virus genomes. Virus Evol.1:vev003. doi: 10.1093/ve/vev003
McDaniel, S. F., and Shaw, A. J. (2005). Selective sweeps and intercontinentalmigration in the cosmopolitan moss Ceratodon purpureus (Hedw.) Brid. Mol.Ecol. 14, 1121–1132. doi: 10.1111/j.1365-294X.2005.02484.x
McDaniel, S. F., Willis, J. H., and Shaw, A. J. (2007). A linkage map reveals acomplex basis for segregation distortion in an interpopulation cross in themoss Ceratodon purpureus. Genetics 176, 2489–2500. doi: 10.1534/genetics.107.075424
McDaniel, S. F., Willis, J. H., and Shaw, A. J. (2008). The genetic basis ofdevelopmental abnormalities in interpopulation hybrids of the mossCeratodon purpureus. Genetics 179, 1425–1435. doi: 10.1534/genetics.107.086314
Muñoz, J., Felicısimo, A. M., Cabezas, F., Burgaz, A. R., and Martınez, I. (2004).Wind as a long-distance dispersal vehicle in the Southern Hemisphere. Science304, 1144–1147. doi: 10.1126/science.1095210
Nadot, S., Bajon, R., and Lejeune, B. (1994). The chloroplast generps 4 as a tool forthe study of Poaceae phylogeny. Plant Syst. Evol. 191, 27–38.
Naish, T., Powell, R., Levy, R., Wilson, G., Scherer, R., Talarico, F., et al. (2009).Obliquity-paced Pliocene West Antarctic ice sheet oscillations. Nature 458,322–328. doi: 10.1038/nature07867
Ochyra, R., Smith, R. I. L., and Bednarek-Ochyra, H. (2008). The illustrated mossflora of Antarctica (Cambridge, UK: Cambridge University Press).
Patiño, J., and Vanderpoorten, A. (2018). Bryophyte biogeography. Crit. Rev. PlantSci. 37, 175–209. doi: 10.1080/07352689.2018.1482444
Piñeiro, R., Popp, M., Hassel, K., Listl, D., Westergaard, K. B., Flatberg, K.II, et al.(2012). Circumarctic dispersal and long-distance colonization of SouthAmerica: the moss genus Cinclidium. J. Biogeogr. 39, 2041–2051.doi: 10.1111/j.1365-2699.2012.02765.x
Pisa, S., Biersma, E. M., Convey, P., Patiño, J., Vanderpoorten, A., Werner, O.,et al. (2014). The cosmopolitan moss Bryum argenteum in Antarctica: recentcolonisation or in situ survival? Polar. Biol. 37, 1469–1477. doi: 10.1007/s00300-014-1537-3
Pokorny, L., Olivan, G., and Shaw, A. J. (2011). Phylogeographic patterns in twosouthern hemisphere species of Calyptrochaeta (Daltoniaceae, Bryophyta).Syst. Biol. 36, 542–553. doi: 10.1600/036364411X583529
Pollard, D., and DeConto, R. M. (2009). Modelling West Antarctic ice sheetgrowth and collapse through the past five million years. Nature 458, 329–332.doi: 10.1038/nature07809
Polvani, L. M., Waugh, D. W., Correa, G. J. P., and Son, S.-W. (2011).Stratospheric ozone depletion: the main driver of twentieth-centuryatmospheric circulation changes in the Southern Hemisphere. J. Clim. 24,795–812. doi: 10.1175/2010JCLI3772.1
Pressel, S., and Duckett, J. G. (2019). Do motile spermatozoids limit theeffectiveness of sexual reproduction in bryophytes? Not in the liverwortMarchantia polymorpha. J. Syst. Evol. 57 (4), 371–381. doi: 10.1111/jse.12528
Puillandre, N., Lambert, A., Brouillet, S., and Achaz, G. (2012). ABGD, AutomaticBarcode Gap Discovery for primary species delimitation. Mol. Ecol. 21, 1864–1877. doi: 10.1111/j.1365-294X.2011.05239.x
Rambaut, A., Suchard, M. A., Xie, D., and Drummond, A. J. (2014). Tracer v1.6.Available at: http://beast.bio.ed.ac.uk/Tracer.
Robinson, S. A., and Erickson, D. J. ,.IIIII (2015). Not just about sunburn – theozone hole’s profound effect on climate has significant implications for
Southern Hemisphere ecosystems. Glob. Change Biol. 21, 515–527.doi: 10.1111/gcb.12739
Robinson, S. A., Klekociuk, A. R., King, D. H., Rojas, M. P., Zuñiga, G. E., andBergstrom, D. M. (2020). The 2019/2020 summer of Antarctic heatwaves. Glob.Change Biol. 26, 3178–3180. doi: 10.1111/gcb.15083
Ronquist, F., Teslenko, M., van der Mark, P., Ayres, D. L., Darling, A., Hohna, S.,et al. (2012). MrBayes 3.2: efficient Bayesian phylogenetic inference and modelchoice across a large model space. Syst. Biol. 61, 539–542. doi: 10.1093/sysbio/sys029
Scherer, R. P., Bohaty, S. M., Dunbar, R. B., Esper, O., Flores, J. A., Gersonde, R.,et al. (2008). Antarctic records of precession-paced insolation-driven warmingduring early Pleistocene Marine Isotope Stage 31. Geophys. Res. Lett. 35,L03505. doi: 10.1029/2007GL032254
Schofield, W. B., and Crum, H. A. (1992). “Bryophyte distribution patterns”, inBryophytes and Lichens in a Changing Environment, ed. Bates, J. W., andFarmer, A. M. (Oxford: Clarendon Press).
Schofield, W. B., and Crum, H. A. (1972). Disjunctions in Bryophytes. Ann.Missouri Bot. Gard. 59, 174–202.
Shaw, J., and Beer, S. C. (1999). Life history variation in gametophytepopulations of the moss Ceratodon purpureus (Ditrichaceae). Am. J. Bot.86 (4), 512–521.
Shaw, A. J., Carter, B. E., Aguero, B., da Costa, D. P., and Crowl, A. A. (2019).Range change evolution of peat mosses (Sphagnum) within and betweenclimate zones. Glob. Change Biol. 25 (1), 108–120. doi: 10.1111/gcb.14485
Silvestro, D., and Michalak, I. (2012). raxmlGUI: a graphical front-end forRAxML. Org. Divers. Evol. 12, 335–337. doi: 10.1007/s13127-011-0056-0
Simmons, M. P., and Ochoterena, H. (2000). Gaps as characters in sequence-based phylogenetic analyses. Syst. Biol. 49, 369–381. doi: 10.1093/sysbio/49.2.369
Souza-Chies, T. T., Bittar, G., Nadot, S., Carter, L., Besin, E., and Lejeune, B.(1997). Phylogenetic analysis of Iridaceae with parsimony and distancemethods using the plastid gene rps4. Plant Syst. Evol. 204, 109–123.
Stamatakis, A. (2014). RAxML version 8: a tool for phylogenetic analysis and post-analysis of large phylogenies. Bioinformatics 30, 1312–1313. doi: 10.1093/bioinformatics/btu033
Stech, M., and Quandt, D. (2010). 20,000 species and five key markers: The statusof molecular bryophyte phylogenetics. Phytotaxa 9, 196–228. doi: 10.11646/phytotaxa.9.1.11
Stenøien, H. K., Shaw, A. J., Shaw, B., Hassel, K., and Gunnarsson, U. (2011).North American origin and recent European establishments of the amphi-Atlantic peat moss Sphagnum angermanicum. Evolution 65, 1181–1194.doi: 10.1111/j.1558-5646.2010.01191.x
Sundberg, S. (2013). Spore rain in relation to regional sources and beyond.Ecography 36, 364–373. doi: 10.1111/j.1600-0587.2012.07664.x
Szövenyi, P., Sundberg, S., and Shaw, A. J. (2012). Long-distance dispersal andgenetic structure of natural populations: an assessment of the inverse isolationhypothesis in peat mosses. Mol. Ecol. 21, 5461–5472. doi: 10.1111/mec.12055
Szövenyi, P., Perroud, P. F., Symeonidi, A., Stevenson, S., Quatrano, R. S., Rensing,S. A., et al. (2014). De novo assembly and comparative analysis of theCeratodon purpureus transcriptome. Mol. Ecol. Resour. 15, 203–215.doi: 10.1111/1755-0998.12284
Taberlet, P., Gielly, L., Pautou, G., and Bouvet, J. (1991). Universal primers foramplification of three non-coding regions of chloroplast DNA. Plant Mol. Biol.17, 1105–1109.
Tajima, F. (1989). The effect of change in population size on DNA polymorphism.Genetics 123, 597–601.
Thompson, D. W., Solomon, S., Kushner, P. J., England, M. H., Grise, K. M., andKaroly, D. J. (2011). Signatures of the Antarctic ozone hole in SouthernHemisphere surface climate change. Nat. Geosci. 4, 741–749. doi: 10.1038/ngeo1296
Turner, J., Barrand, N. E., Bracegirdle, T. J., Convey, P., Hodgson, D. A., Jarvis, M.,et al. (2014). Antarctic climate change and the environment: an update. Polar.Rec. 50, 237–259. doi: 10.1017/S0032247413000296
Vanderpoorten, A., Goffinet, B., and Quandt, D. (2006). “Utility of the internaltranscribed spacers of the 18S-5.8 S-26S nuclear ribosomal DNA in land plantsystematics with special emphasis on Bryophytes,” in Plant Genome:Biodiversity and Evolution, vol. 2, B, Lower groups. Eds. A. K. Sharma and A.Sharma (Enfield, New Hampshire, USA: Science Publishers), 385–407.
Biersma et al. Global Biogeography Ceratodon purpureus
Frontiers in Plant Science | www.frontiersin.org August 2020 | Volume 11 | Article 50235913
Vanderpoorten, A., Rumsey, F., and Carine, M. (2007). Does Macaronesia exist?Conflicting signal in the bryophyte and pteridophyte floras. Am. J. Bot. 94,625–639. doi: 10.3732/ajb.94.4.625
Vigalondo, B., Garilleti, R., Vanderpoorten, A., Patiño, J., Draper, I., Calleja, J. A., et al.(2019). Do mosses really exhibit so large distribution ranges? Insights from theintegrative taxonomic study of the Lewinskya affinis complex (Orthotrichaceae,Bryopsida). Mol. Phylogenet. Evol. 140, 106598. doi: 10.1016/j.ympev.2019.106598
Villarreal, J. C., and Renner, S. S. (2014). A review of molecular-clock calibrationsand substitution rates in liverworts, mosses, and hornworts, and a timeframefor a taxonomically cleaned-up genus Nothoceros. Mol. Phylogenet. Evol. 78,25–35. doi: 10.1016/j.ympev.2014.04.014
Villaverde, T., Escudero, M., Martın-Bravo, S., Jimenez-Mejıas, P., Sanmartın, I.,Vargas, P., et al. (2017). ). Bipolar distributions in vascular plants: A review.Am. J. Bot. 104 (11), 1680–1694. doi: 10.3732/ajb.1700159
Waterman, M. J., Nugraha, A. S., Hendra, R., Ball, G. E., Robinson, S. A., andKeller, P. A. (2017). Antarctic moss Biflavonoids show high antioxidant andultraviolet-screening activity. J. Nat. Prod. 80 (8), 2224–2231. doi: 10.1021/acs.jnatprod.7b00085
Wertheim, J. O., Sanderson, M. J., Worobey, M., and Bjork, A. (2010). Relaxedmolecular clocks, the bias–variance trade-off, and the quality of phylogeneticinference. Syst. Biol. 59, 1–8. doi: 10.1093/sysbio/syp072
White, T. J., Bruns, T., Lee, S., and Taylor, J. (1990). “Amplification and directsequencing of fungal ribosomal RNA genes for phylogenetics,” in PCRprotocols: a guide to methods and applications. Ed. M. A. Innis (New York:Academic Press), 315–322.
Wilkinson, D. M., Koumoutsaris, S., Mitchell, E. A. D., and Bey, I. (2012).Modelling the effect of size on the aerial dispersal of microorganisms.J. Biogeogr. 39, 89–97. doi: 10.1111/j.1365-2699.2011.02569.x
Wyber, R. A. (2013). Phylogeny of Three East Antarctic Mosses. [PhD thesis](Wollongong, (Australia: University of Wollongong).
Conflict of Interest: The authors declare that the research was conducted in theabsence of any commercial or financial relationships that could be construed as apotential conflict of interest.
Copyright © 2020 Biersma, Convey, Wyber, Robinson, Dowton, van de Vijver, Linse,Griffiths and Jackson. This is an open-access article distributed under the terms of theCreative Commons Attribution License (CC BY). The use, distribution orreproduction in other forums is permitted, provided the original author(s) and thecopyright owner(s) are credited and that the original publication in this journal iscited, in accordance with accepted academic practice. No use, distribution orreproduction is permitted which does not comply with these terms.
Biersma et al. Global Biogeography Ceratodon purpureus
Frontiers in Plant Science | www.frontiersin.org August 2020 | Volume 11 | Article 50235914