latino students in the worcester public schools march 30, 2010 miren uriarte mauricio gaston...
TRANSCRIPT

Latino Students in the Latino Students in the Worcester Public SchoolsWorcester Public Schools
March 30, 2010
Miren UriarteMauricio Gaston Institute for Latino Community
Development and Public Policy University of Massachusetts Boston
Prepared for the Latino Education Institute, Worcester State College

Enrollment. WPS. 2007-2010.
2 Source: Worcester Public Schools, March 12, 2009.

Background
Make-Up of the Latino School Population
3
ALL Latino9092
Native Language NES NSS
Source: Worcester Public Schools, March 12, 2009.

Background
Make-Up of the Latino School Population, WPS 2010
4
ALL Latino9092
Native Language NES NSS
Language Proficiency EP EP
LEP3691 (40%)
Source: Worcester Public Schools, March 12, 2009.

Demographics of the Enrollment, WPS 2010
All WPS Latino Latino LEP
Gender (% male) 52.1 52.1 51.4
Poverty Rate (Eligible for free/reduced lunch)
69 86.7 92.4
5 Source: Worcester Public Schools, March 12, 2009.

Proportion of LEP students in Latino Enrollments, WPS,
2007-2010
6 Source: Worcester Public Schools, March 12, 2009.

Enrollments by Grade Level, WPS 2010
7

What does this mean?
Latino enrollments are growing, specially those of English Language Learners
Among Latinos, students tend to show stronger risk factors known to affect educational outcomes: they are poorer and a higher proportion are students of limited English proficiency.
8

Educational Outcomes
• MCAS Proficiency Rates of Different Populations of Latino Students• Dropout Rate of Different Populations of Latino Students
9

Background
MA NAEP Rankings
10
All Gr 4 Reading 1
Gr8 Reading 1
Gr 4 Math 1
Gr 8 Math 1
SOURCE: U.S. Department of Education, Institute of Education Sciences, National Center for Education Statistics, National Assessment of Educational Progress (NAEP), http://nces.ed.gov/nationsreportcard/naepdata/report.aspx

Background
MA NAEP Rankings
11
All LatinoGr 4 Reading 1 11
(tied with 4 other states)
Gr8 Reading 1 11 (tied with 3 other states)
Gr 4 Math 1 7 (tied 4 with other states)
Gr 8 Math 1 9SOURCE: U.S. Department of Education, Institute of Education Sciences, National Center for Education Statistics, National Assessment of Educational Progress (NAEP), http://nces.ed.gov/nationsreportcard/naepdata/report.aspx

MCAS ELA Proficiency Rates. WPS & MA. 2009.
12Source: MDESE (State data); Worcester Public Schools, March 12, 2009 (WPS data).

MCAS Math Proficiency Rates. WPS & MA. 2009.
13Source: MDESE (State data); Worcester Public Schools, March 12, 2009 (WPS data).

Current data does not help us understand the outcomes of Latino students.
Latino and LEP MCAS scores include outcomes for students with very low levels of proficiency. These students should not be expected to score well in standardized test in English.
Recent research shows that ELL are taking about 5 years to reach the level of English proficiency in the Mass English Proficiency Assessment (MEPA) that allows them to pass the MCAS ELA test, but they are tested after the first year in MA schools.
Once they attain this level, their performance is comparable to that of English proficient students,
14
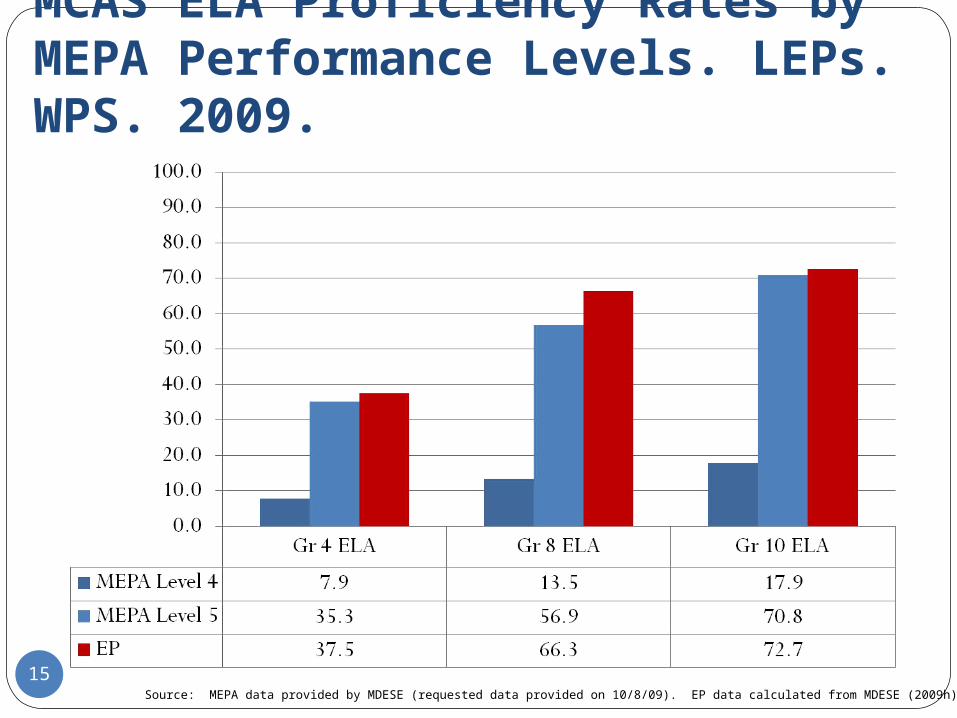
MCAS ELA Proficiency Rates by MEPA Performance Levels. LEPs. WPS. 2009.
15Source: MEPA data provided by MDESE (requested data provided on 10/8/09). EP data calculated from MDESE (2009h)

Staying in School and Graduating
16

4-Yr Graduation Rate. WPS & MA. 2006, 2007, and 2008
17Source: MDESE (State data); Worcester Public Schools, March 12, 2009 (WPS data).

Annual Drop-out Rate, WPS and MA, 2007-2009
18Source: MDESE (State data); Worcester Public Schools, March 12, 2009 (WPS data).

Areas for Intervention
Gaston Institute, 5/26/200919
Focus on drop out prevention improve the learning environment for all Latino students, value students’
language and culture. emphasize early intervention, as early as elementary school focus on low rates of attendance and high rates of grade retention pay special attention
to boys to English Learners, particularly those who arrive to MA schools as adolescents
or illiterate in their own language Improve academic achievement
focus on all Latino students as they transition from elementary to middle school focus on English Learners at all levels, but specially in middle school and high
school prioritize professional development for teachers in contact with English Learners institute appropriate assessment and placement of English Learners use evidence-based program planning at the state and at the district levels
based on accurate and relevant data include thorough analyses of the situation of Latino students
Improve accountability and access to information monitor the progress of all Latino students and most especially English Learners improve data collection about Latino students improve parents’ and communities’ access to accurate information about Latino
student outcomes and schools where Latino students succeed improve parents’ understanding of requirements and responsibilities in U.S.
educational system