latin american exceptionalism: the politics and economics of unfulfilled potential professor victor...
TRANSCRIPT
Latin American Exceptionalism: The Politics and Economics of Unfulfilled
Potential
Professor Victor MenaldoUniversity of Washington
Recent Progress• Democratization• Rule of Law• Economic Growth• Decreasing Inequality and
Rising Middle Class
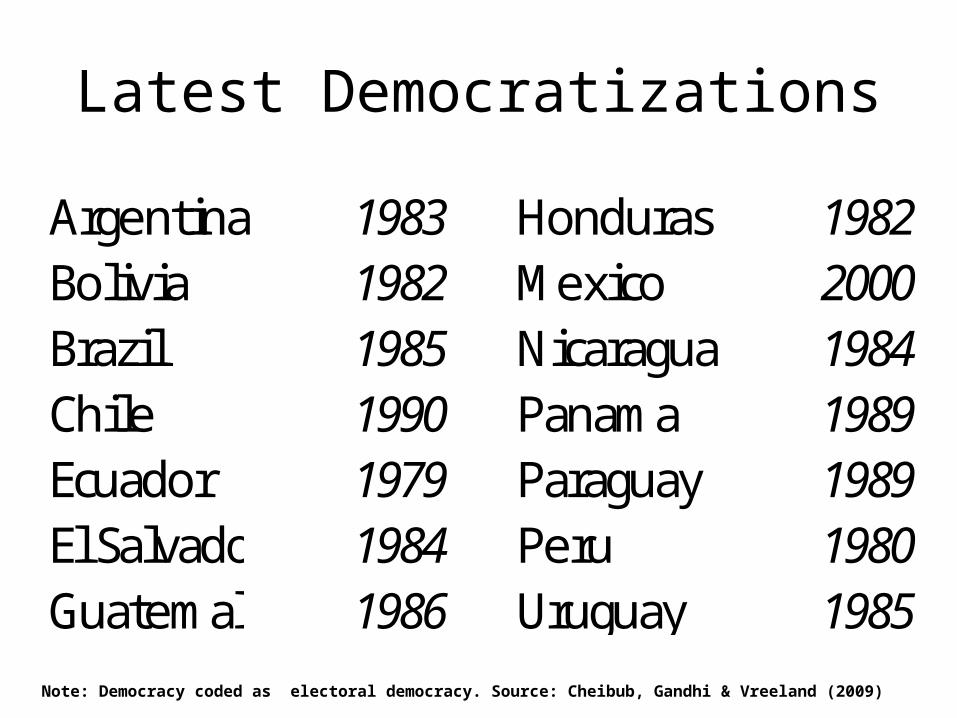
Latest Democratizations
Argentina 1983 Honduras 1982Bolivia 1982 Mexico 2000Brazil 1985 Nicaragua 1984Chile 1990 Panama 1989Ecuador 1979 Paraguay 1989El Salvador 1984 Peru 1980Guatemala 1986 Uruguay 1985
Note: Democracy coded as electoral democracy. Source: Cheibub, Gandhi & Vreeland (2009)
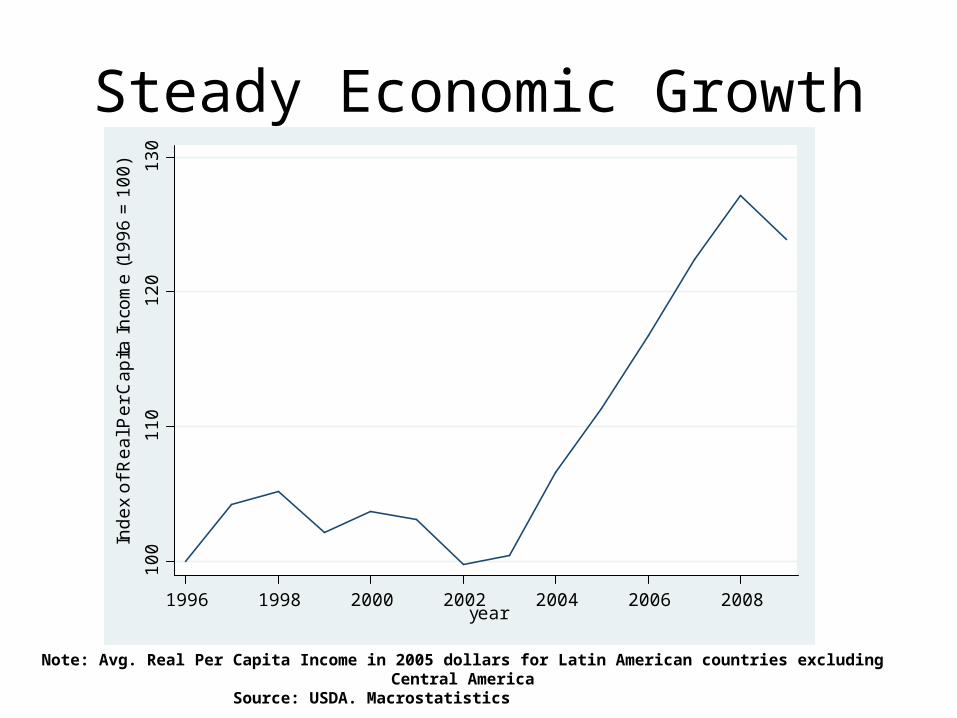
Steady Economic Growth1
00
11
01
20
13
0
Ind
ex
of
Re
al P
er
Ca
pita
In
com
e (
19
96
= 1
00
)
1996 1998 2000 2002 2004 2006 2008year
Note: Avg. Real Per Capita Income in 2005 dollars for Latin American countries excluding Central America Source: USDA. Macrostatistics
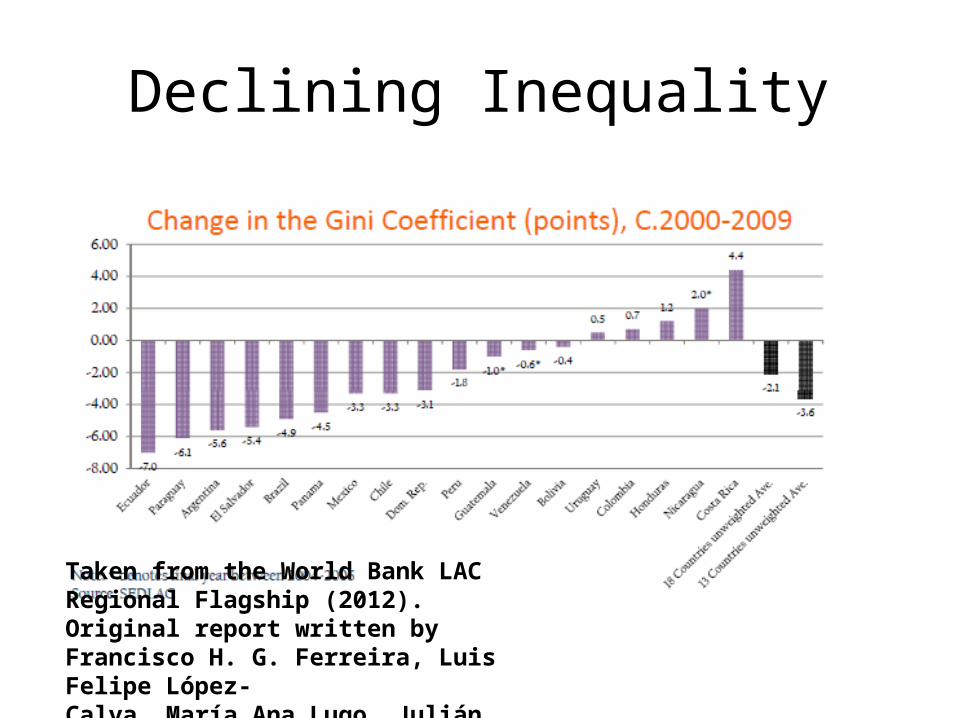
Declining Inequality
Taken from the World Bank LAC Regional Flagship (2012). Original report written by Francisco H. G. Ferreira, Luis Felipe López-Calva, María Ana Lugo, Julián Messina, Jamele Rigolini, and Renos Vakis.
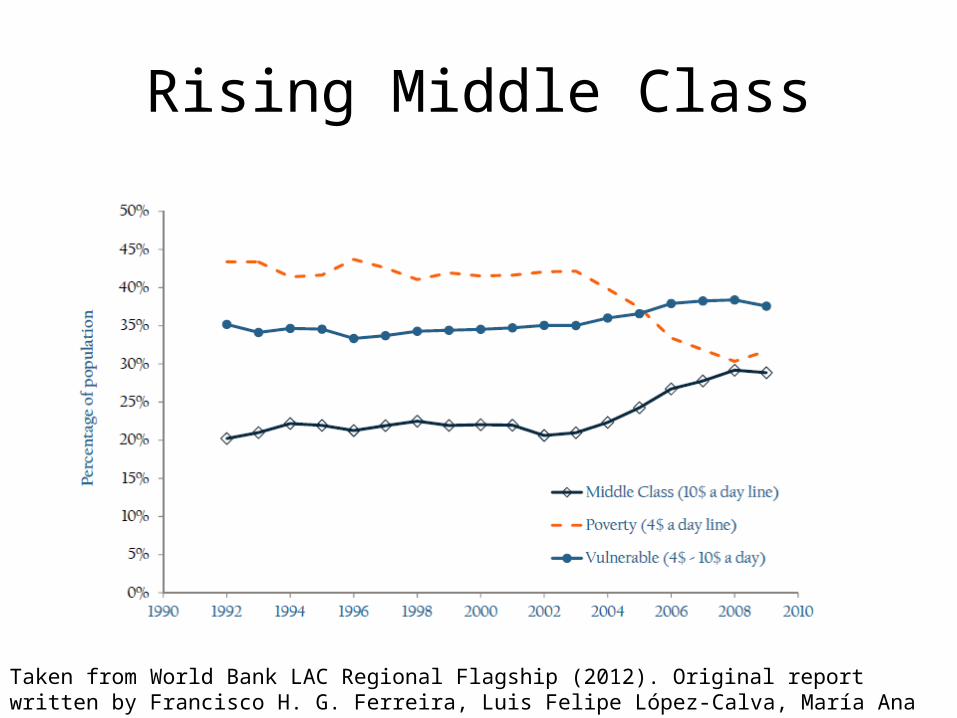
Rising Middle Class
Taken from World Bank LAC Regional Flagship (2012). Original report written by Francisco H. G. Ferreira, Luis Felipe López-Calva, María Ana Lugo, Julián Messina, Jamele Rigolini, and Renos Vakis.
Chile• GDP per capita has doubled over past 18 years,
fastest sustained expansion in country's history.• Poverty rates have fallen precipitously. • Chileans from humble families attending college.• Chile has attained homeownership rate roughly
equal to that of the United States, about 70%.
Peru
• Country has grown at 7% per year over past few years.
• Commodity boom has fed public investment & consumption boom
• FDI keeps pouring in & currency strong.
MexicoLiving standards—infant mortality rates, life expectancy and years of education—have improved greatly.
Country is growing again; giving China run for its money with skilled labor.
Immigration to USA has been drastically reduced.
LATAM exceptionalism:unfulfilled promise
• Lower economic development than expected given these countries’ age, resources & proximity to foreign markets.
• Serious corruption and challenges to rule of law.
• Spending on education, health, social insurance & infrastructure less than expected, given the vast needs.
• Lower & more regressive taxes than rest developing world.
• Still highest inequality in the world
05
,00
01
0,0
001
5,0
002
0,0
002
5,0
00
Re
al G
DP
Pe
r C
api
ta (
20
00 In
tern
atio
nal D
olla
rs),
200
0-2
006
ave
rag
e
Eas
t Eu
rop
e/p
ost
US
SR
Lat
in A
mer
ica
Mid
dle
Eas
t/No
rth
Afr
ica
Sub
saha
ran
Afr
ica
We
ste
rn E
uro
pe/N
ort
h A
mer
ica
Eas
t Asi
a
Sou
th-E
ast
Asi
a
Sou
th A
sia
Th
e P
aci
fic (
san
s A
ust
r. &
N.Z
.)
Th
e C
arib
bean
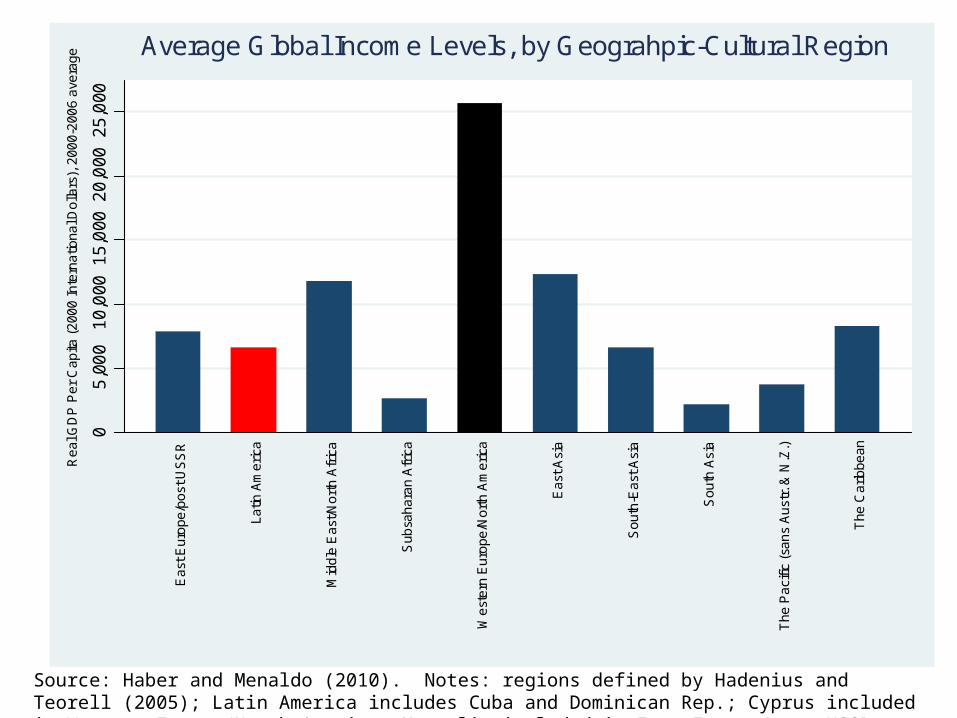
Average Global Income Levels, by Geograhpic-Cultural Region
Source: Haber and Menaldo (2010). Notes: regions defined by Hadenius and Teorell (2005); Latin America includes Cuba and Dominican Rep.; Cyprus included in Western Europe/North America; Mongolia included in East Europe/post USSR
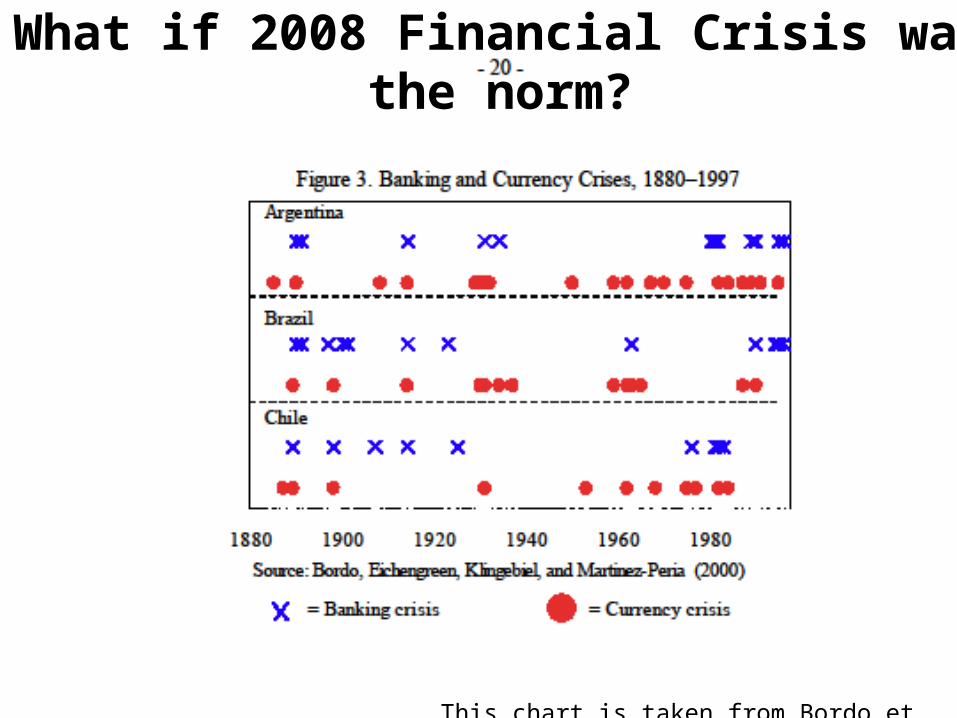
What if 2008 Financial Crisis was the norm?
This chart is taken from Bordo et al. (2000)
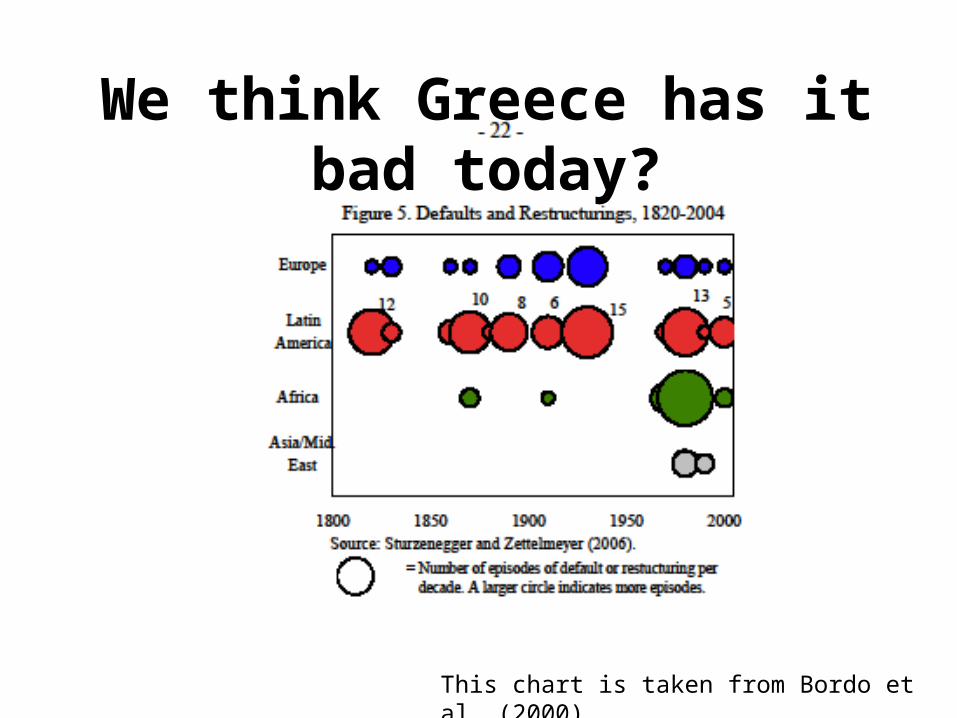
We think Greece has it bad today?
This chart is taken from Bordo et al. (2000)
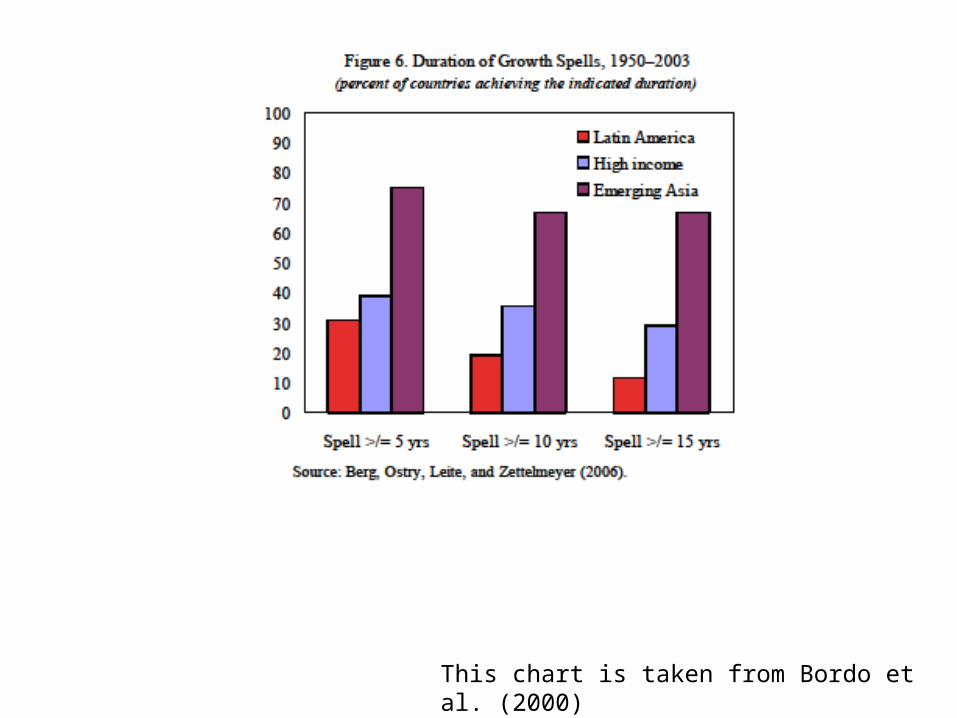
This chart is taken from Bordo et al. (2000)
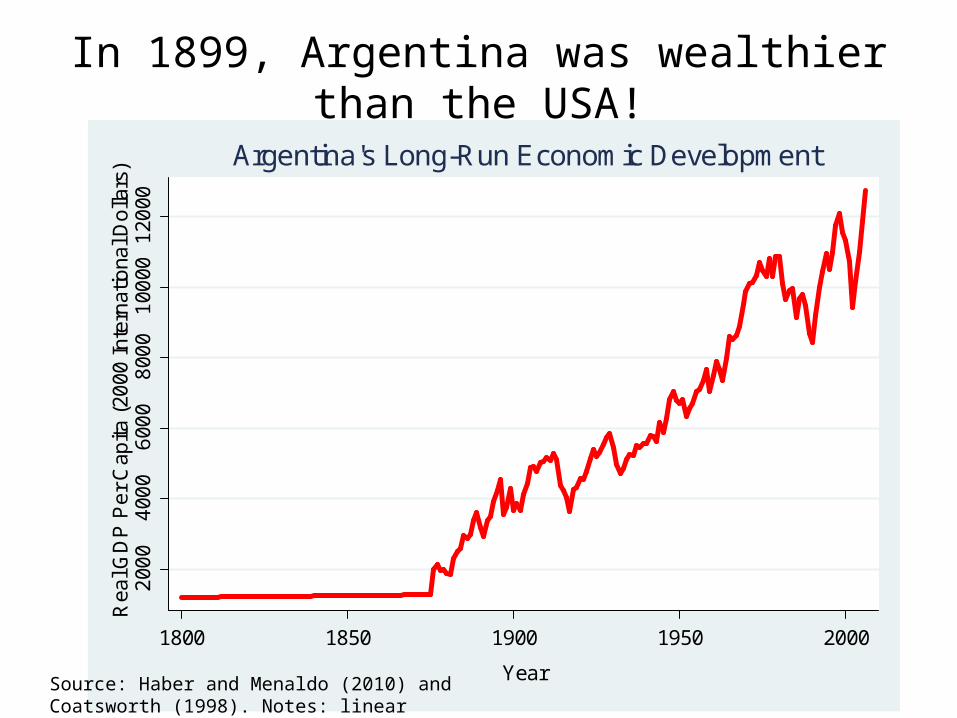
In 1899, Argentina was wealthier than the USA!2
000
400
06
000
800
01
0000
120
00R
eal G
DP
Pe
r C
apita
(20
00 In
tern
atio
nal D
olla
rs)
1800 1850 1900 1950 2000
Year
Argentina's Long-Run Economic Development
Source: Haber and Menaldo (2010) and Coatsworth (1998). Notes: linear interpolation used between 1800 and 1874.
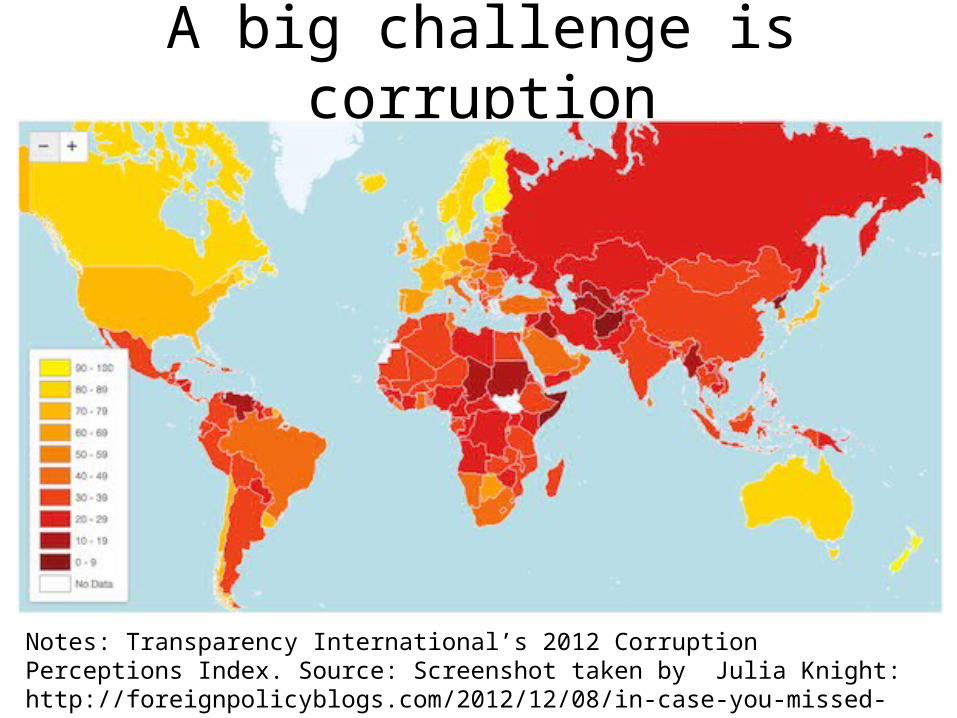
A big challenge is corruption
Notes: Transparency International’s 2012 Corruption Perceptions Index. Source: Screenshot taken by Julia Knight: http://foreignpolicyblogs.com/2012/12/08/in-case-you-missed-it-transparency-international-corruption-perceptions-index/
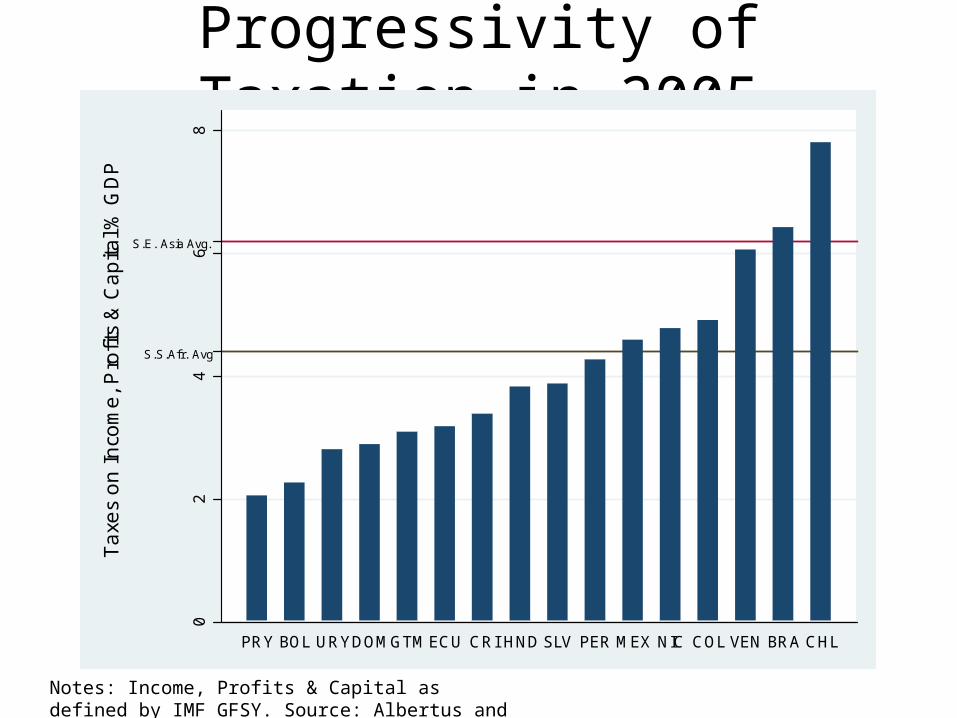
Progressivity of Taxation in 2005
02
46
8
S.S.Afr. Avg
S.E. Asia Avg.
Ta
xes
on
In
com
e,
Pro
fits
& C
ap
ital %
GD
P
PRY BOL URYDOMGTM ECU CRI HND SLV PER MEX NIC COL VEN BRA CHL
Notes: Income, Profits & Capital as defined by IMF GFSY. Source: Albertus and Menaldo (2013).
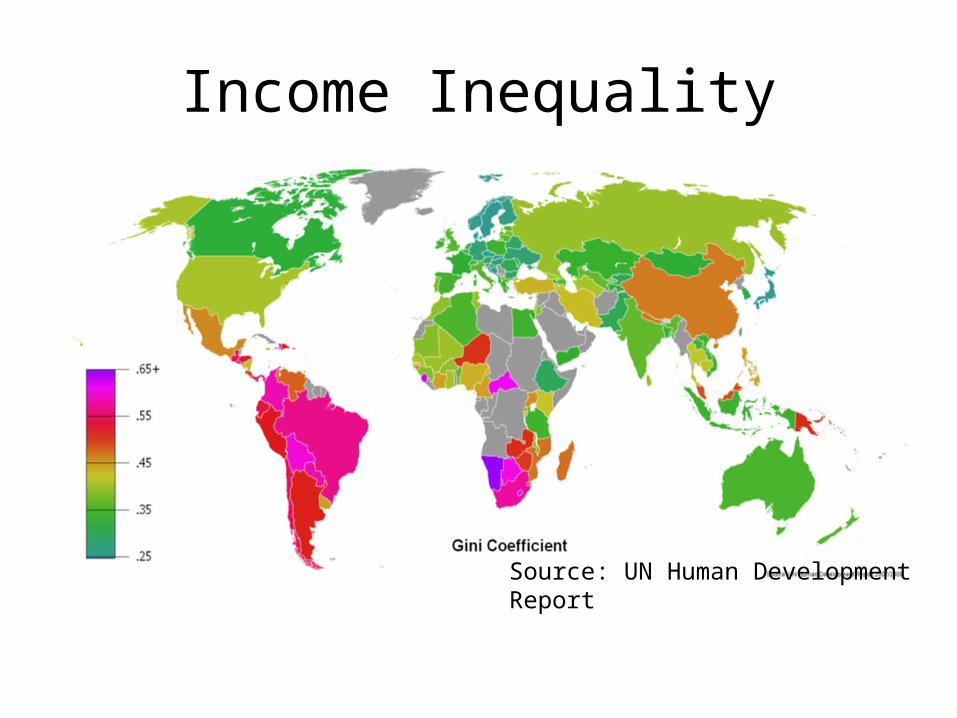
Income Inequality
Source: UN Human Development Report
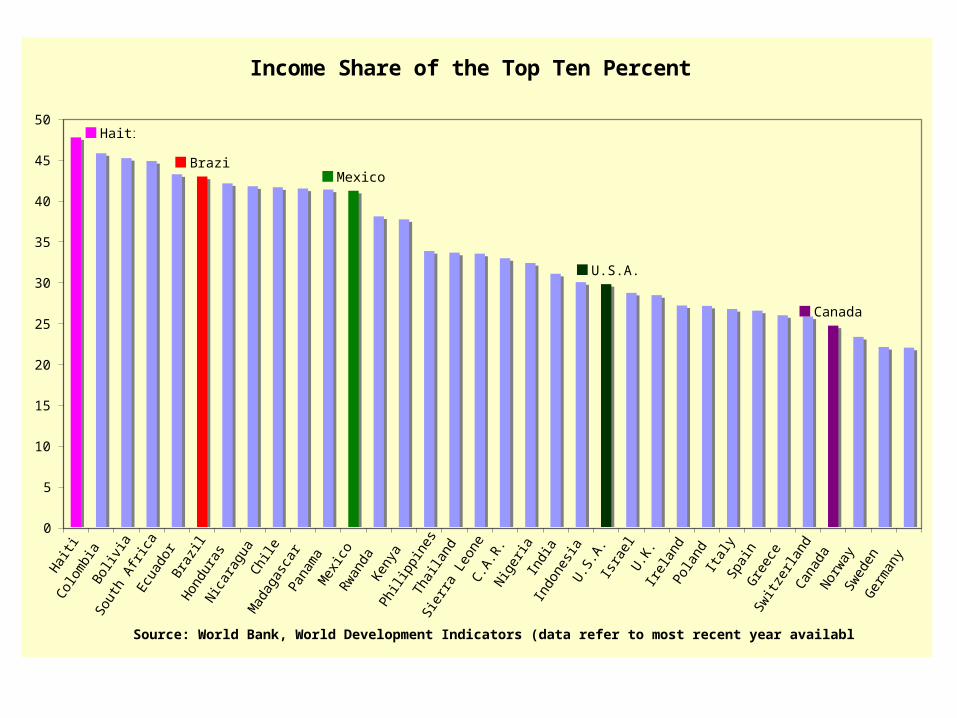
Income Share of the Top Ten Percent
Haiti
Canada
U.S.A.
MexicoBrazil
0
5
10
15
20
25
30
35
40
45
50
Hai
tiCo
lom
bia
Boliv
iaSo
uth
Afric
aEc
uado
rBr
azil
Hon
dura
sNic
arag
uaCh
ileM
adag
asca
rPa
nam
aM
exic
oRw
anda
Keny
aPh
ilipp
ines
Thai
land
Sier
ra L
eone
C.A.
R.Nig
eria
Indi
aIn
done
sia
U.S
.A.
Isra
elU.K
.Ire
land
Pola
ndIta
lySp
ain
Gre
ece
Switz
erla
ndCa
nada
Nor
way
Swed
enG
erm
any
Source: World Bank, World Development Indicators (data refer to most recent year available)
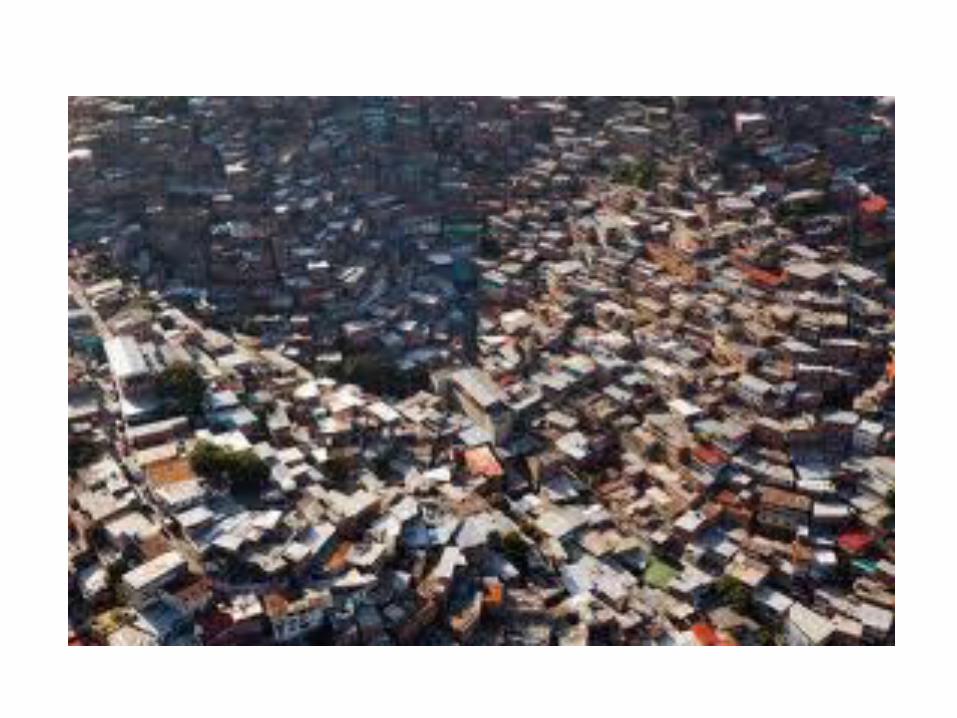
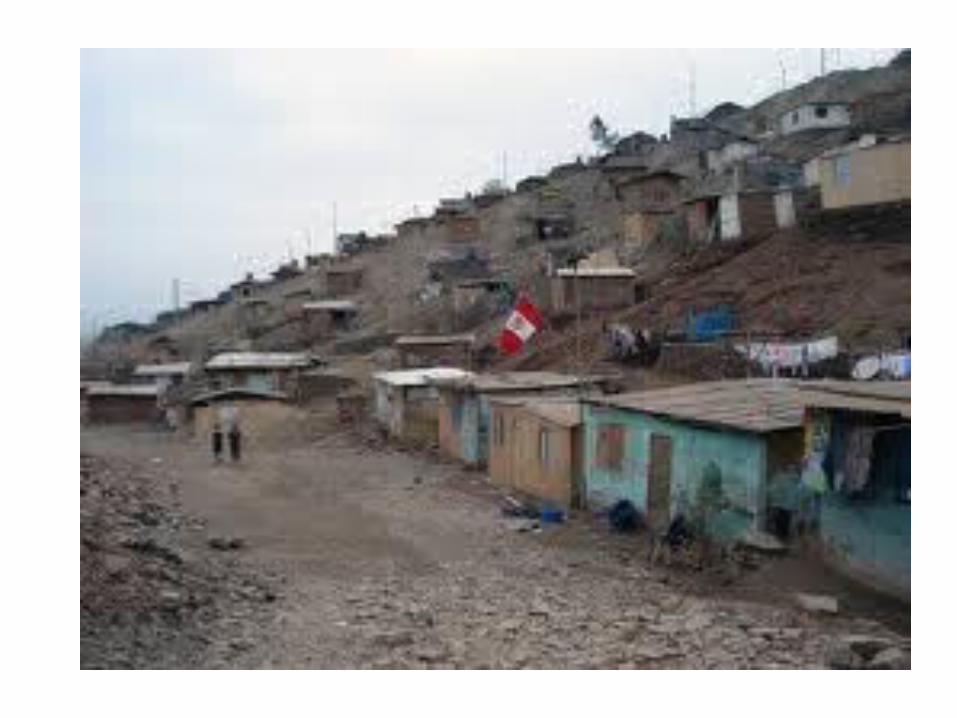

LATAM Exceptionalism is Very Puzzling!
Consider a natural experiment• Areas conquered by Spaniards
populated by more sophisticated, wealthier civilizations.
• LATAM colonies wealthier & more important than North American ones.
• LATAM countries just as old as USA.
YET THERE WAS A NOTABLE REVERSAL OF FORTUNE
After colonialism, North America surpassed LATAM and became much wealthier and influential.
Much of LATAM got stuck in neutral.
Some LATAM countries went in reverse.
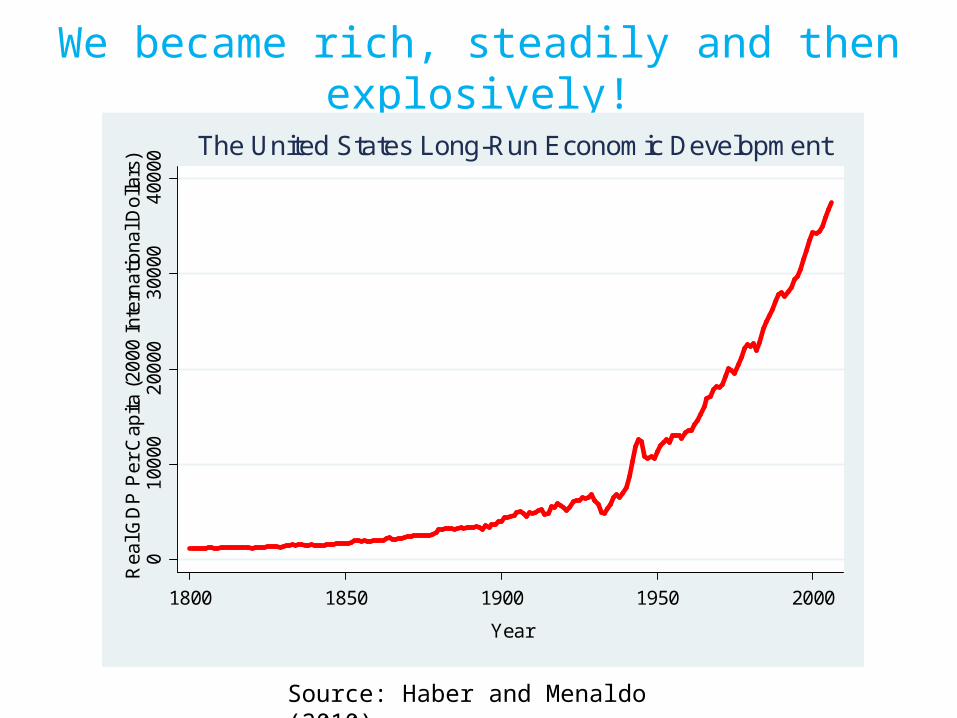
We became rich, steadily and then explosively!
Source: Haber and Menaldo (2010)
01
0000
200
003
0000
400
00R
eal G
DP
Pe
r C
apita
(20
00 In
tern
atio
nal D
olla
rs)
1800 1850 1900 1950 2000
Year
The United States Long-Run Economic Development
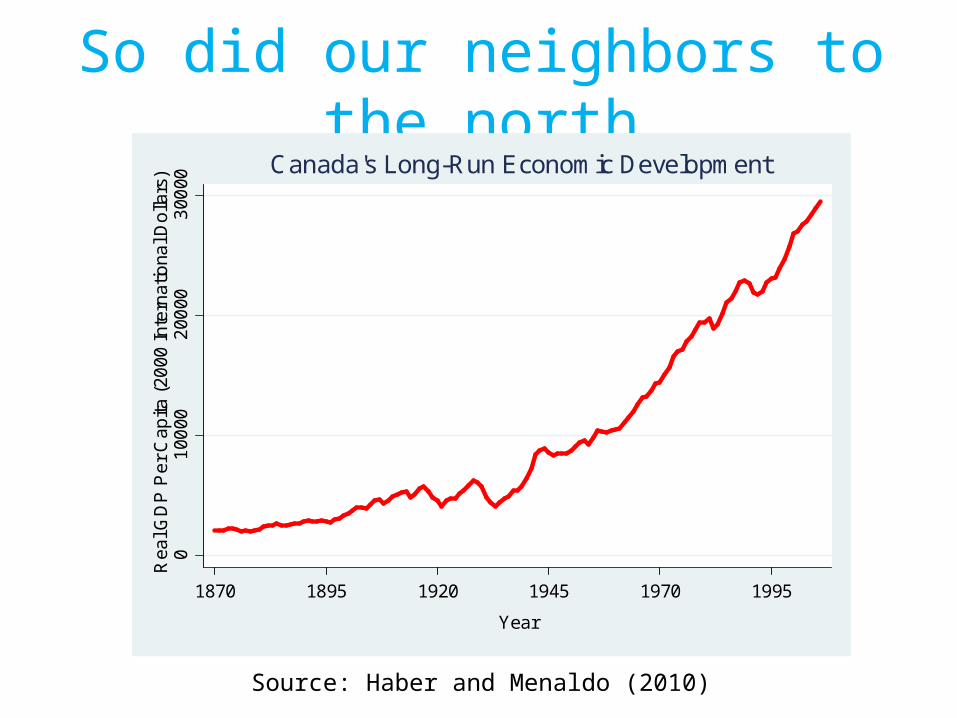
So did our neighbors to the north
Source: Haber and Menaldo (2010)
01
0000
200
003
0000
Rea
l GD
P P
er
Cap
ita (
2000
Inte
rnat
iona
l Do
llars
)
1870 1895 1920 1945 1970 1995
Year
Canada's Long-Run Economic Development
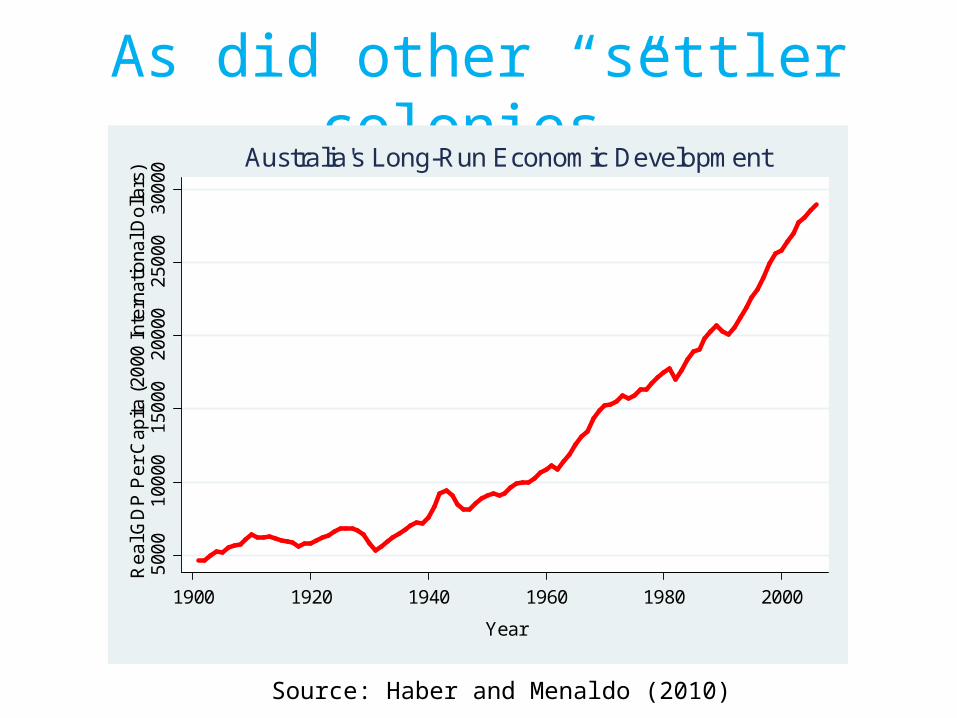
As did other “settler colonies”5
000
100
001
5000
200
002
5000
300
00R
eal G
DP
Pe
r C
apita
(20
00 In
tern
atio
nal D
olla
rs)
1900 1920 1940 1960 1980 2000
Year
Australia's Long-Run Economic Development
Source: Haber and Menaldo (2010)
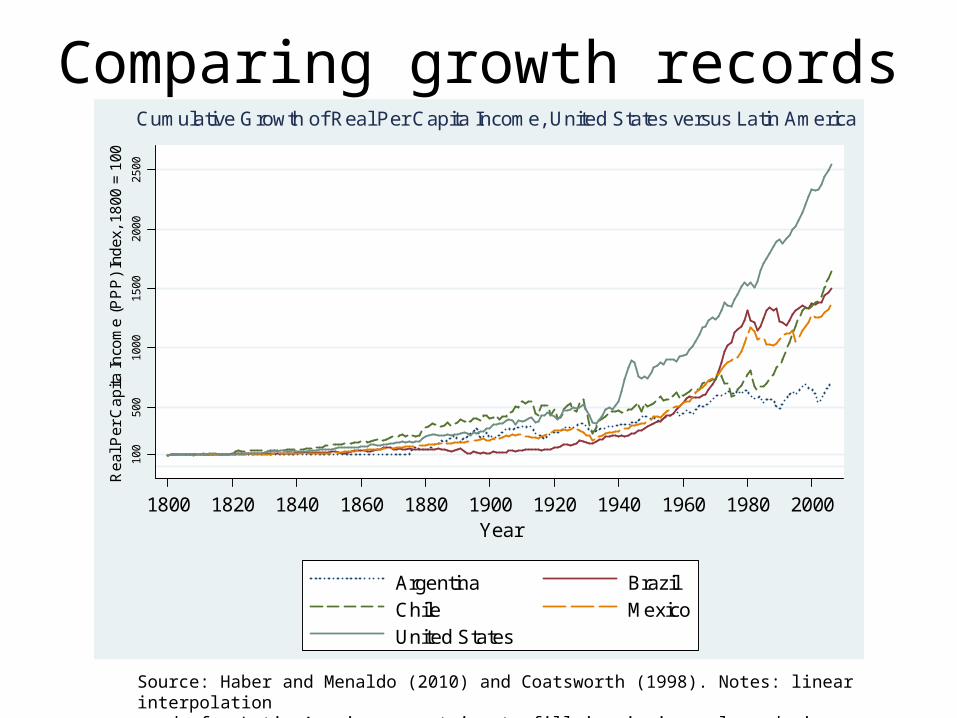
Comparing growth records5
001
000
150
02
000
250
01
00
Re
al P
er C
api
ta In
com
e (
PP
P)
Ind
ex, 1
800
= 1
00
1800 1820 1840 1860 1880 1900 1920 1940 1960 1980 2000
Year
Argentina BrazilChile MexicoUnited States
Cumulative Growth of Real Per Capita Income, United States versus Latin America
Source: Haber and Menaldo (2010) and Coatsworth (1998). Notes: linear interpolation used for Latin American countries to fill in missing values during the nineteenth century.
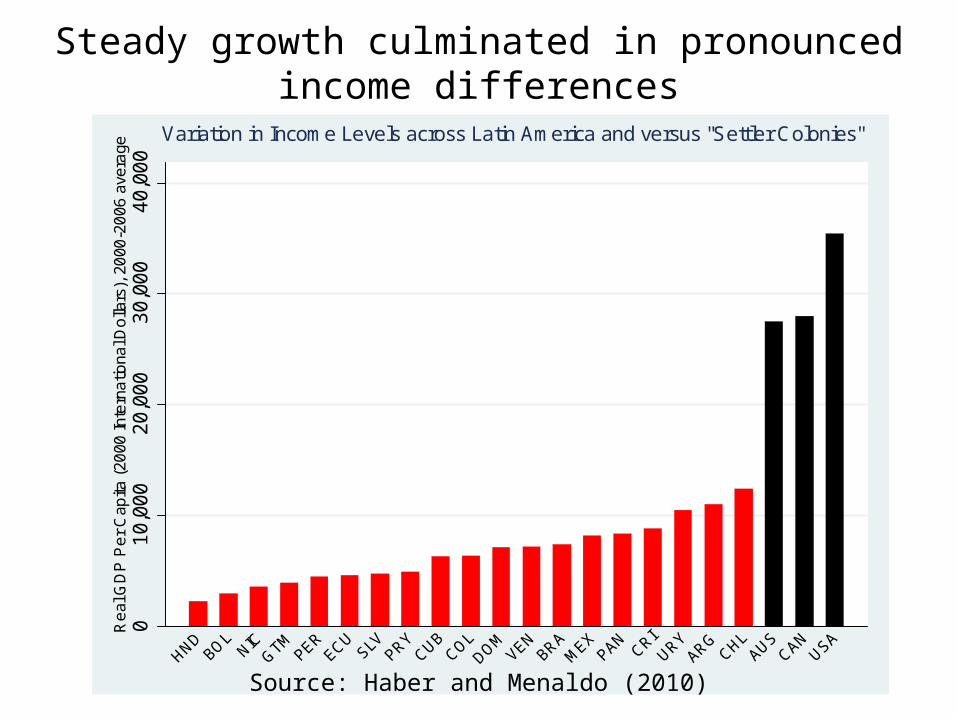
Steady growth culminated in pronounced income differences
01
0,00
02
0,00
03
0,00
04
0,00
0R
eal
GD
P P
er
Cap
ita (
2000
Inte
rna
tiona
l Do
llars
), 2
000
-20
06 a
vera
ge
HNDBOL
NICGTM
PERECU
SLVPRY
CUBCOL
DOMVEN
BRAM
EXPAN
CRIURY
ARGCHL
AUSCAN
USA
Variation in Income Levels across Latin America and versus "Settler Colonies"
Source: Haber and Menaldo (2010)
What explains Latin American Exceptionalism?
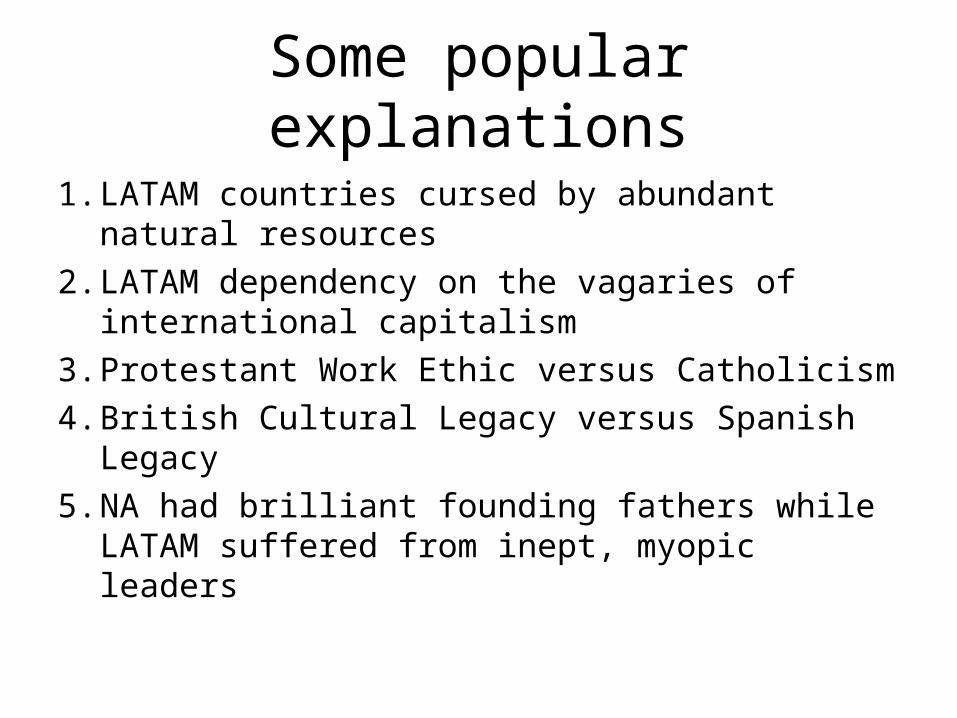
Some popular explanations
1. LATAM countries cursed by abundant natural resources
2. LATAM dependency on the vagaries of international capitalism
3. Protestant Work Ethic versus Catholicism4. British Cultural Legacy versus Spanish Legacy5. NA had brilliant founding fathers while
LATAM suffered from inept, myopic leaders
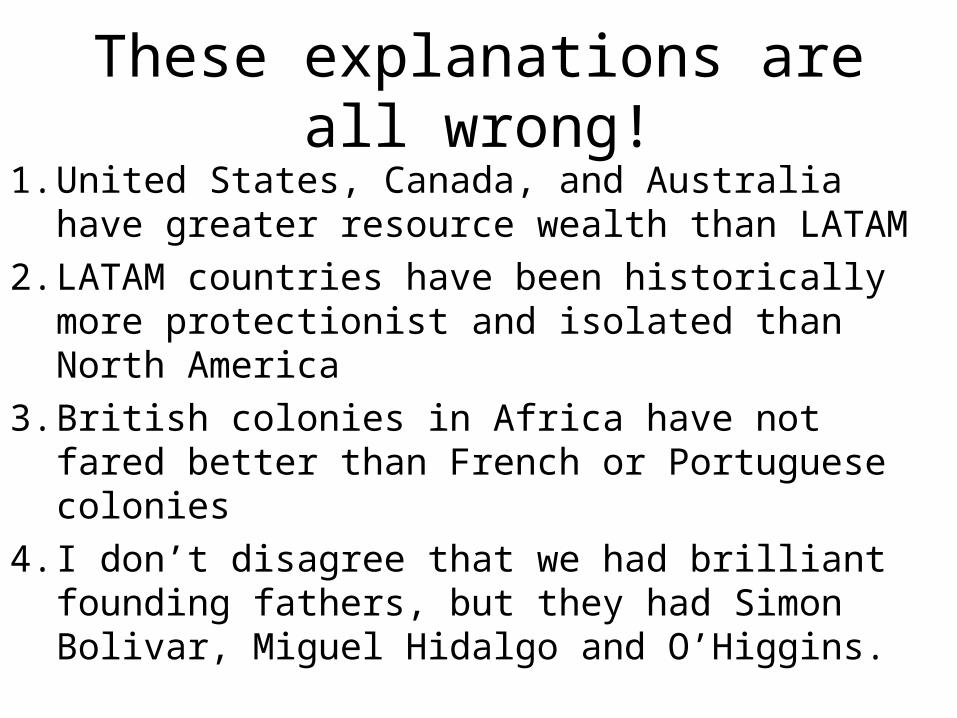
These explanations are all wrong!1. United States, Canada, and Australia have greater
resource wealth than LATAM2. LATAM countries have been historically more
protectionist and isolated than North America3. British colonies in Africa have not fared better than
French or Portuguese colonies4. I don’t disagree that we had brilliant founding
fathers, but they had Simon Bolivar, Miguel Hidalgo and O’Higgins.
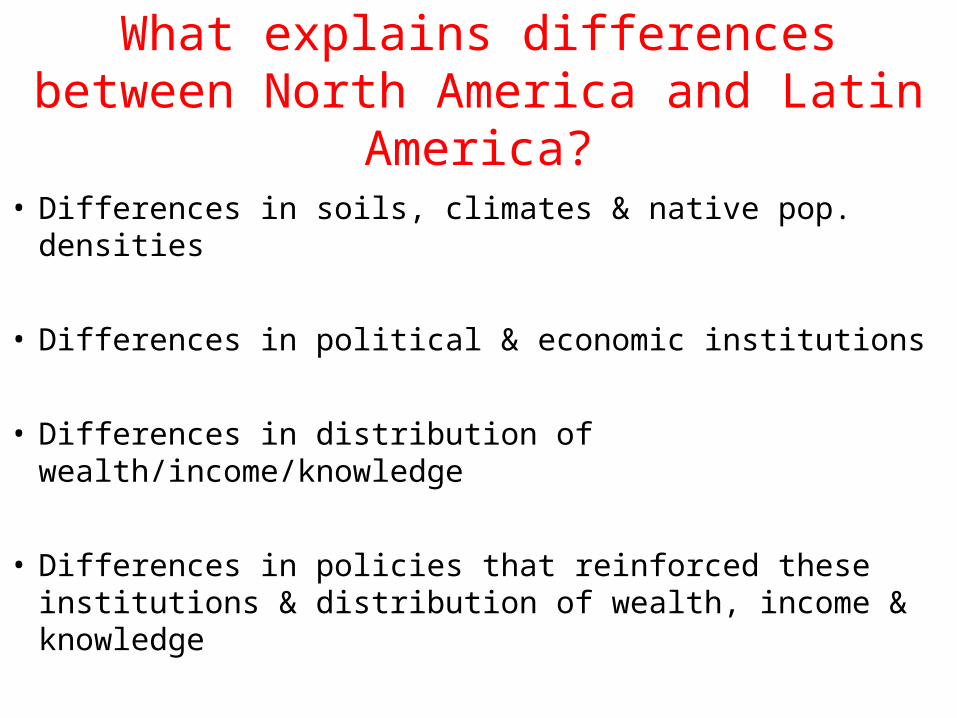
What explains differences between North America and Latin America?
• Differences in soils, climates & native pop. densities
• Differences in political & economic institutions
• Differences in distribution of wealth/income/knowledge
• Differences in policies that reinforced these institutions & distribution of wealth, income & knowledge
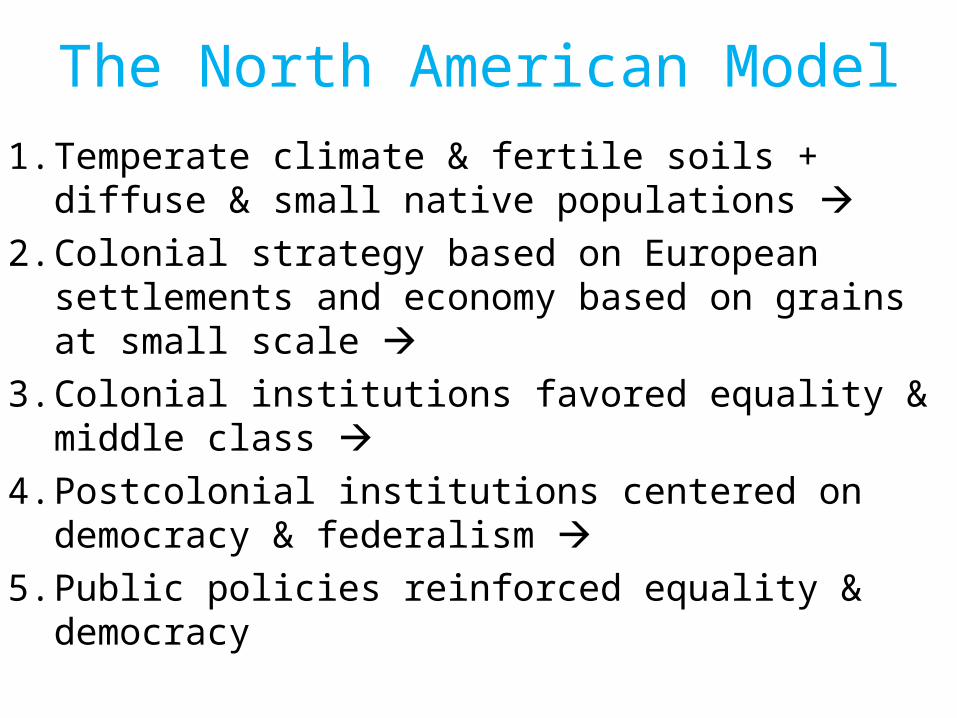
The North American Model1. Temperate climate & fertile soils + diffuse & small
native populations 2. Colonial strategy based on European settlements
and economy based on grains at small scale 3. Colonial institutions favored equality & middle
class 4. Postcolonial institutions centered on democracy &
federalism 5. Public policies reinforced equality & democracy
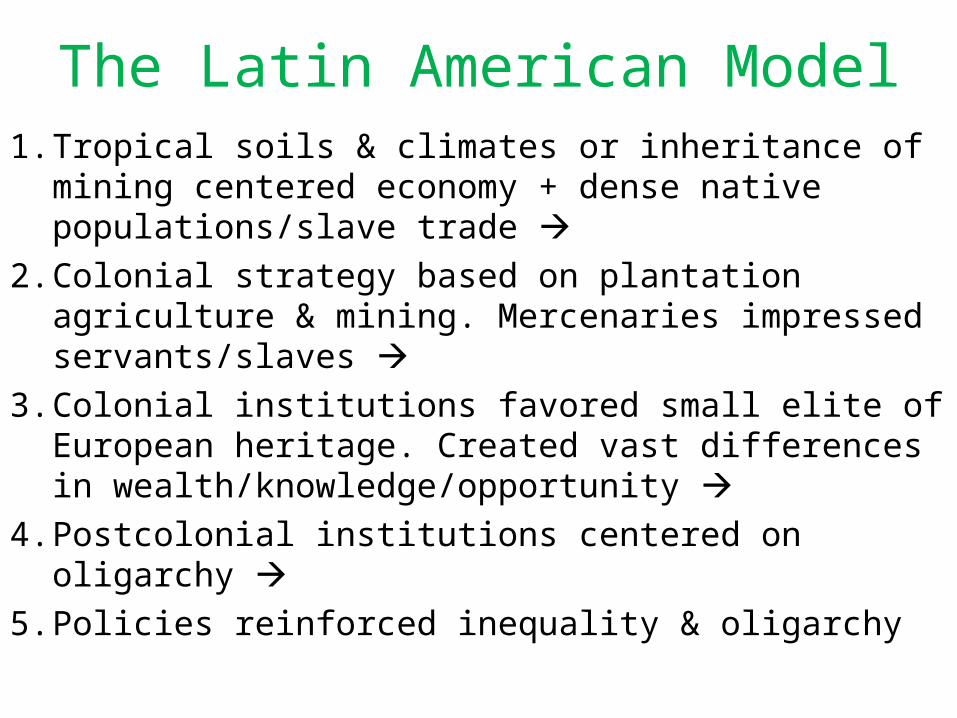
The Latin American Model1. Tropical soils & climates or inheritance of mining
centered economy + dense native populations/slave trade
2. Colonial strategy based on plantation agriculture & mining. Mercenaries impressed servants/slaves
3. Colonial institutions favored small elite of European heritage. Created vast differences in wealth/knowledge/opportunity
4. Postcolonial institutions centered on oligarchy 5. Policies reinforced inequality & oligarchy
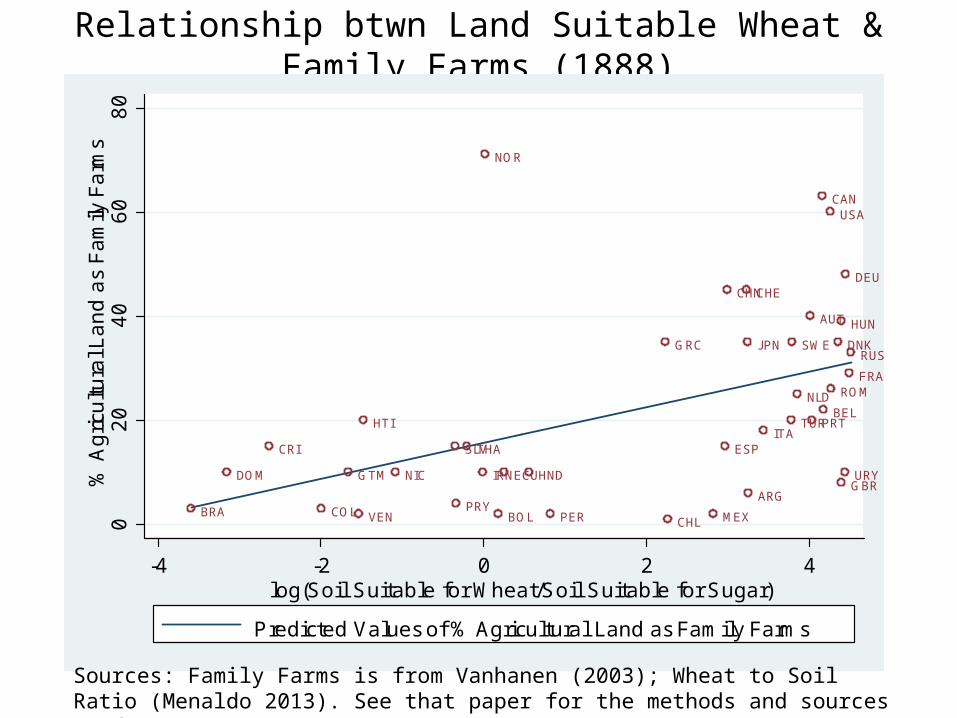
Relationship btwn Land Suitable Wheat & Family Farms (1888)
USACAN
HTI
DOM
MEX
GTM HND
SLV
NIC
CRI
COL VEN
ECU
PERBRA BOLPRY
CHL
ARG
URYGBR
NLDBEL
FRA
CHE
ESP
PRT
DEU
AUT HUN
ITA
GRC
ROM
RUSSWE
NOR
DNK
IRN
TUR
CHN
JPN
THA
02
04
06
08
0%
Ag
ricu
ltura
l La
nd
as
Fa
mily
Fa
rms
-4 -2 0 2 4
log(Soil Suitable for Wheat/Soil Suitable for Sugar)
Predicted Values of % Agricultural Land as Family Farms
Sources: Family Farms is from Vanhanen (2003); Wheat to Soil Ratio (Menaldo 2013). See that paper for the methods and sources used.
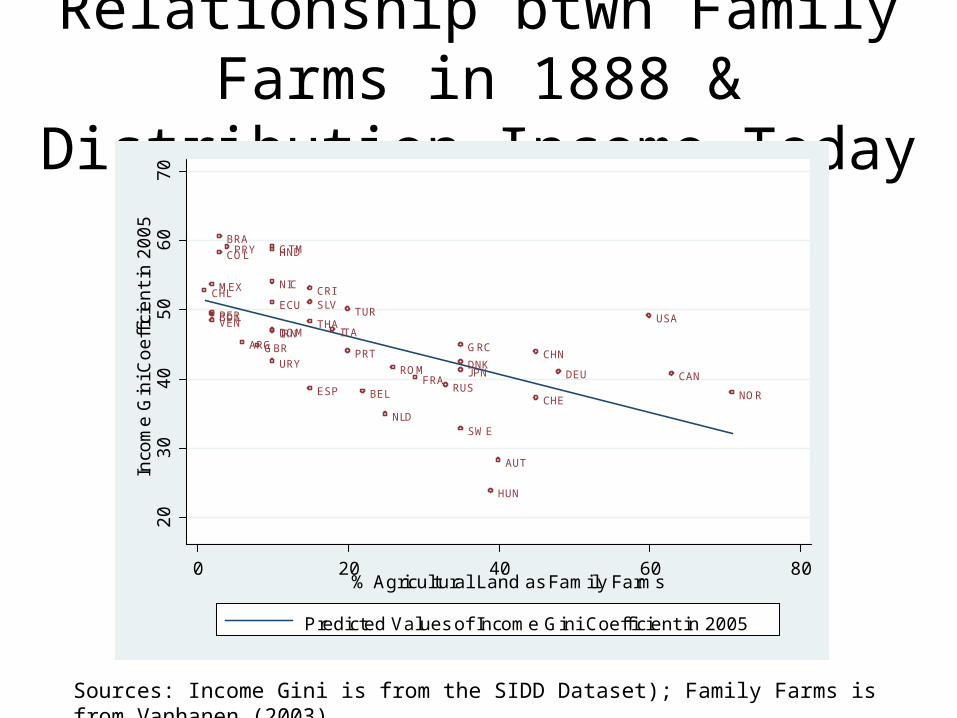
Relationship btwn Family Farms in 1888 & Distribution Income Today
USA
CAN
DOM
MEX
GTMHND
SLV
NICCRI
COL
VEN
ECUPER
BRA
BOL
PRY
CHL
ARG
URY
GBR
NLD
BELFRA
CHEESP
PRT
DEU
AUT
HUN
ITAGRC
ROM
RUS
SWE
NOR
DNK
IRN
TUR
CHN
JPN
THA
20
30
40
50
60
70
Inco
me
Gin
i Co
eff
icie
nt
in 2
00
5
0 20 40 60 80% Agricultural Land as Family Farms
Predicted Values of Income Gini Coefficient in 2005
Sources: Income Gini is from the SIDD Dataset); Family Farms is from Vanhanen (2003).
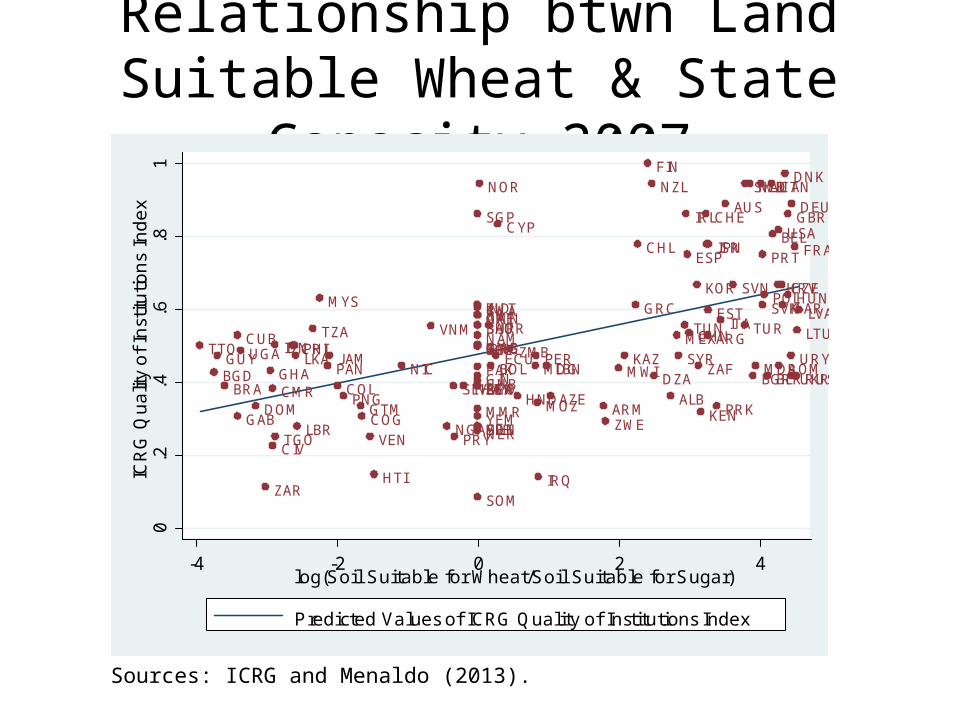
Relationship btwn Land Suitable Wheat & State Capacity 2007
USA
CAN
HTI
JAMTTO
GUY
GBRIRL
NLD
BELFRA
CHE
ESP PRT
DEU
POL
AUT
HUNCZE
SVKITA
ALB
HRVSVNGRC
CYP
BGRMDAROM
RUS
EST LVA
LTU
UKRBLR
ARMAZE
FINSWENOR
DNK
GNB
GMB
MLI
SEN
NERCIV
GINBFA
LBR SLE
GHA
TGO
CMR
NGAGAB COG
ZAR
UGA
KEN
TZA
SOM
AGOMOZ
ZMB
ZWE
MWI ZAF
NAM
BWA
MDG
MAR
DZA
TUN
LBY
SDN
IRNTUR
IRQ
EGYSYR
LBN
JOR
ISR
SAU
YEM
KWTBHRQATAREOMN
KAZ
CHNMNG
PRK
KOR
JPN
IND
PAKBGD
MMR
LKA
THA
VNM
MYS
SGP
PHLIDN
AUS
PNG
NZL
CUB
DOM
MEX
GTMHND
SLVNIC
CRI
PANCOL
VEN
ECU PER
BRABOL
PRY
CHL
ARGURY
0.2
.4.6
.81
ICR
G Q
ua
lity
of
Inst
itutio
ns
Ind
ex
-4 -2 0 2 4log(Soil Suitable for Wheat/Soil Suitable for Sugar)
Predicted Values of ICRG Quality of Institutions Index
Sources: ICRG and Menaldo (2013).
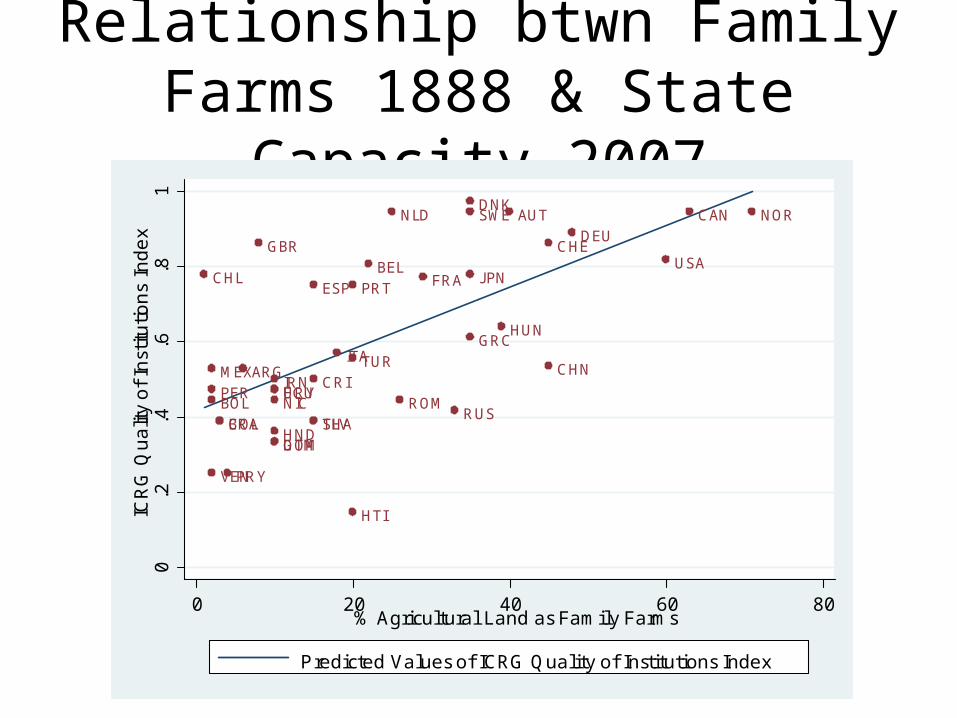
Relationship btwn Family Farms 1888 & State Capacity 2007
USA
CAN
HTI
GBR
NLD
BELFRA
CHE
ESP PRT
DEUAUT
HUN
ITAGRC
ROMRUS
SWE NORDNK
IRNTUR CHN
JPN
THADOM
MEX
GTMHND
SLVNIC
CRI
COL
VEN
ECUPER
BRABOL
PRY
CHL
ARGURY
0.2
.4.6
.81
ICR
G Q
ua
lity
of
Inst
itutio
ns
Ind
ex
0 20 40 60 80% Agricultural Land as Family Farms
Predicted Values of ICRG Quality of Institutions Index
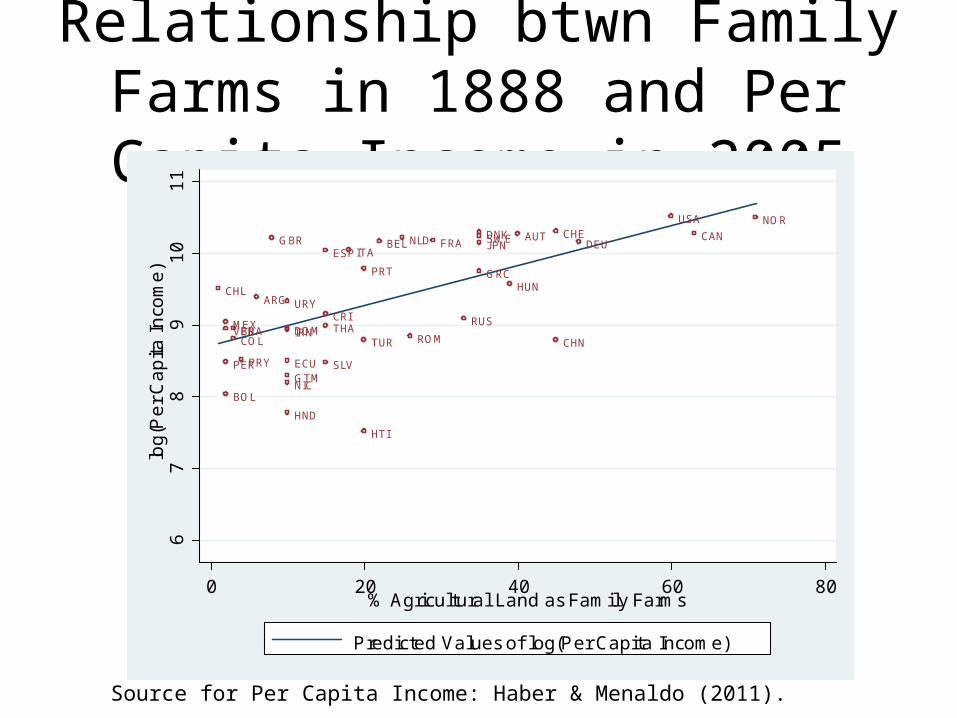
Relationship btwn Family Farms in 1888 and Per Capita Income in 2005
USA
CAN
HTI
DOMMEX
GTM
HND
SLV
NIC
CRI
COLVEN
ECUPER
BRA
BOL
PRY
CHLARG URY
GBR NLDBEL FRACHE
ESP
PRT
DEUAUT
HUN
ITA
GRC
ROM
RUS
SWE
NORDNK
IRNTUR CHN
JPN
THA
67
89
10
11
log
(Pe
r C
ap
ita I
nco
me
)
0 20 40 60 80% Agricultural Land as Family Farms
Predicted Values of log(Per Capita Income)
Source for Per Capita Income: Haber & Menaldo (2011).
Postcolonial institutions & policies
North America
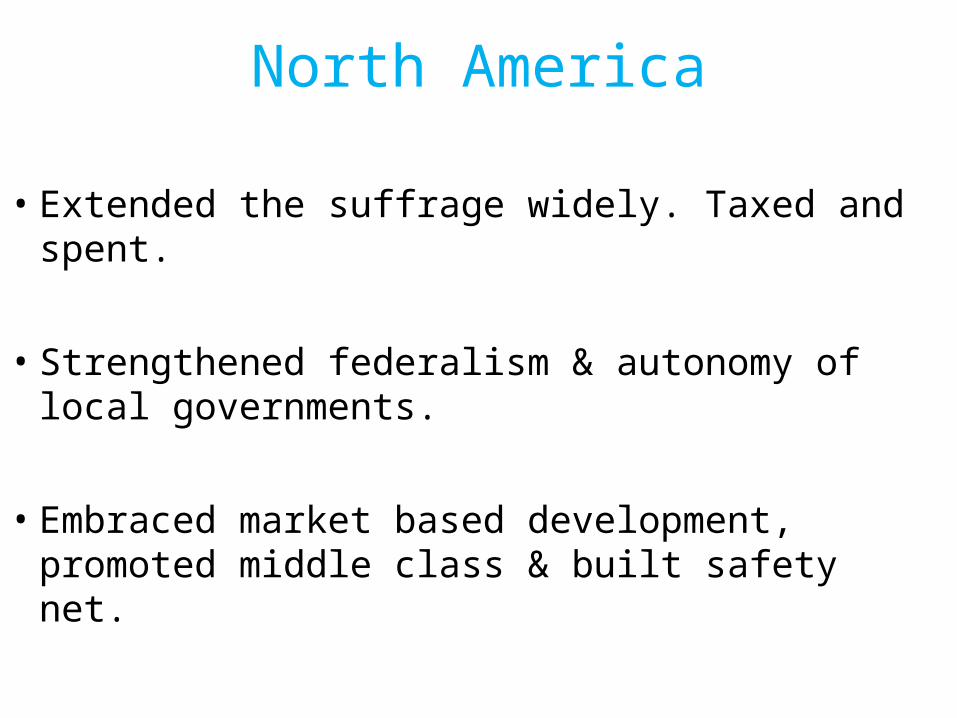
North America
• Extended the suffrage widely. Taxed and spent.
• Strengthened federalism & autonomy of local governments.
• Embraced market based development, promoted middle class & built safety net.
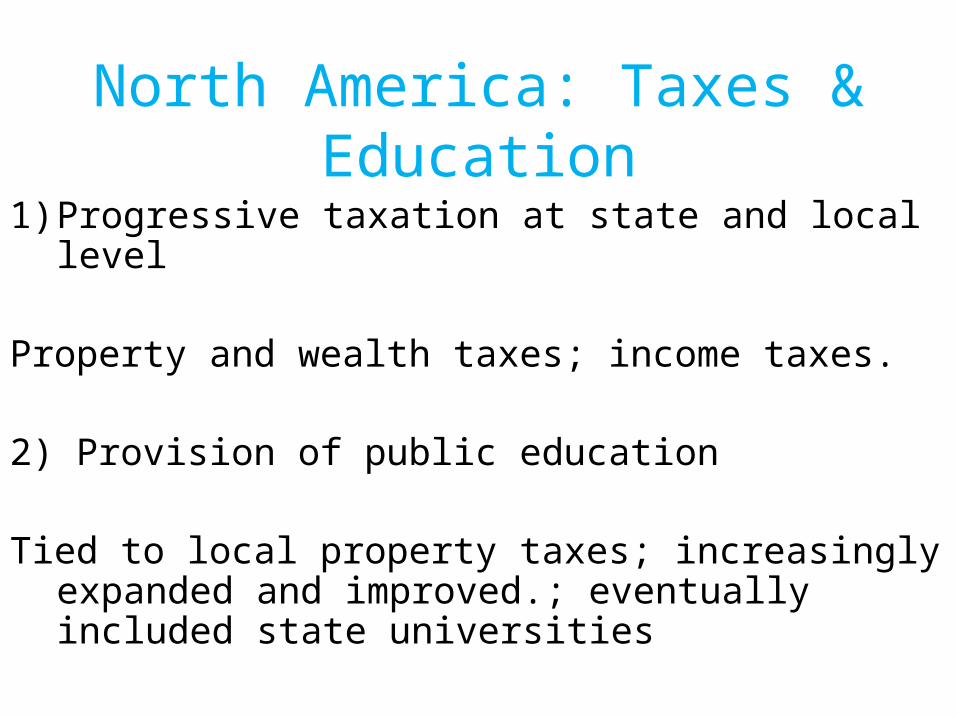
North America: Taxes & Education
1) Progressive taxation at state and local level
Property and wealth taxes; income taxes.
2) Provision of public education
Tied to local property taxes; increasingly expanded and improved.; eventually included state universities
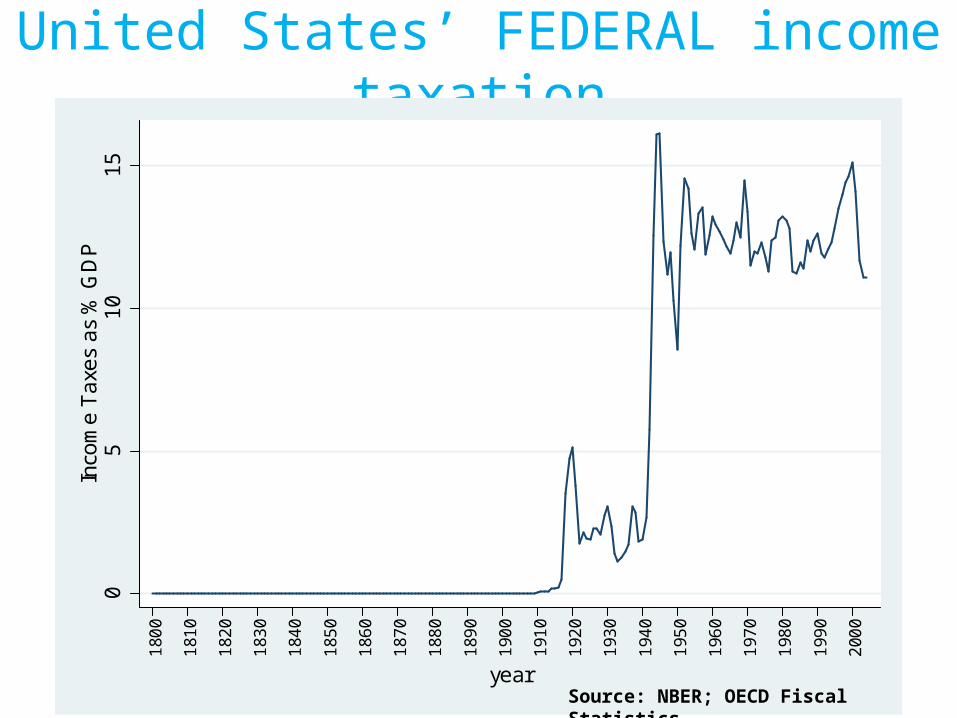
United States’ FEDERAL income taxation0
51
01
5In
com
e T
axe
s as
% G
DP
180
0
181
0
182
0
183
0
184
0
185
0
186
0
187
0
188
0
189
0
190
0
191
0
192
0
193
0
194
0
195
0
196
0
197
0
198
0
199
0
200
0
yearSource: NBER; OECD Fiscal Statistics
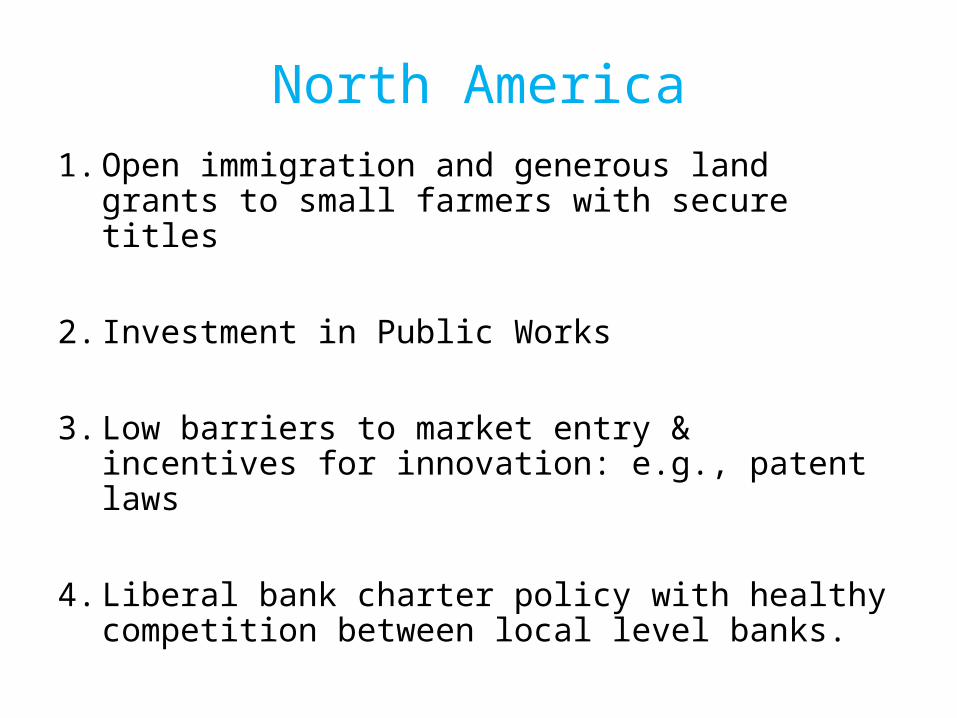
North America1. Open immigration and generous land grants to
small farmers with secure titles
2. Investment in Public Works
3. Low barriers to market entry & incentives for innovation: e.g., patent laws
4. Liberal bank charter policy with healthy competition between local level banks.
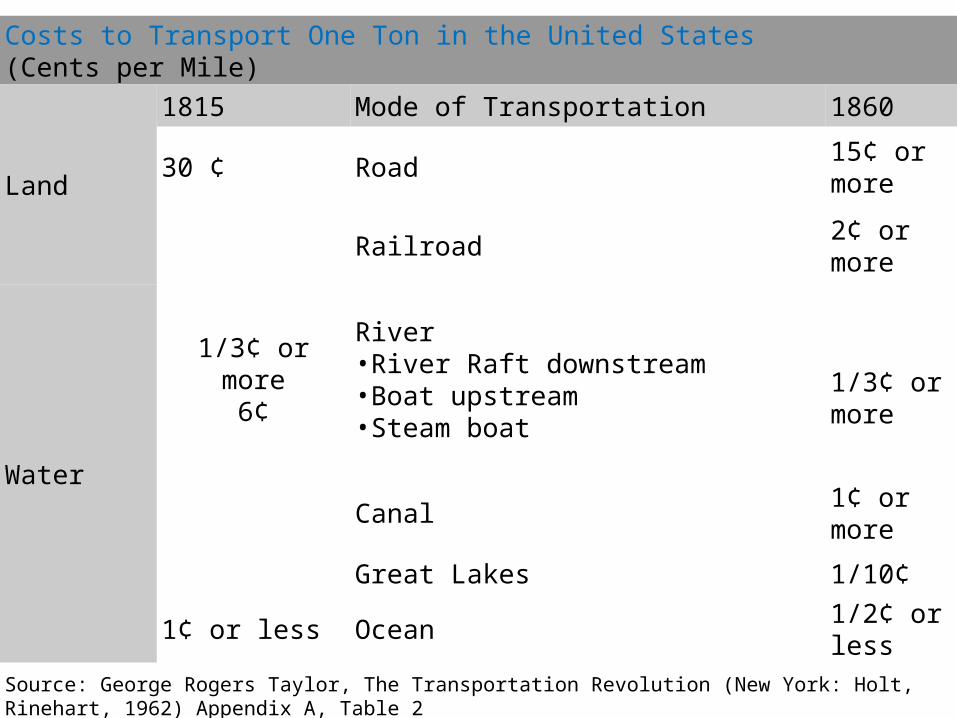
Costs to Transport One Ton in the United States(Cents per Mile)
Land
1815 Mode of Transportation 1860
30 ¢ Road 15¢ or more
Railroad 2¢ or more
Water
1/3¢ or more6¢
River•River Raft downstream•Boat upstream•Steam boat
1/3¢ or more
Canal 1¢ or more
Great Lakes 1/10¢
1¢ or less Ocean 1/2¢ or less
Source: George Rogers Taylor, The Transportation Revolution (New York: Holt, Rinehart, 1962) Appendix A, Table 2
Postcolonial institutions & policies
Latin America
Latin America
• LATAM experienced authoritarianism, inequality & political instability
• LATAM became centralized
• LATAM countries embarked on crony capitalism to benefit politicians, bankers, and a small cadre of industrialists and unions.
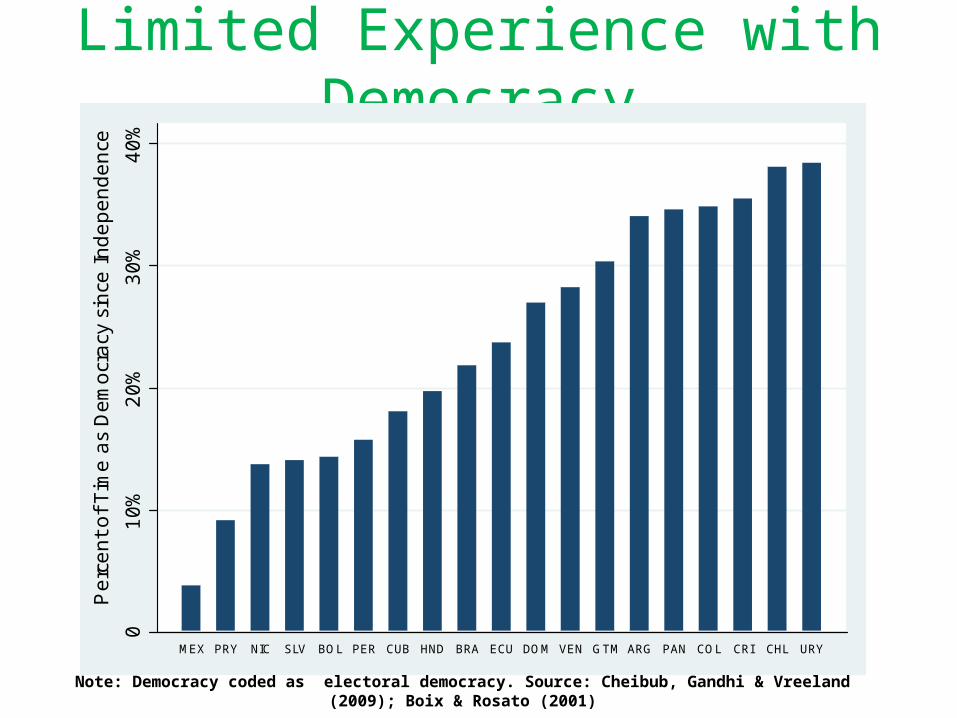
Limited Experience with Democracy0
10
%3
0%
20
%4
0%
Pe
rce
nt
of
Tim
e a
s D
em
ocr
acy
sin
ce I
nd
ep
en
de
nce
MEX PRY NIC SLV BOL PER CUB HND BRA ECU DOM VEN GTM ARG PAN COL CRI CHL URY
Note: Democracy coded as electoral democracy. Source: Cheibub, Gandhi & Vreeland (2009); Boix & Rosato (2001)
Latin America:
Regressive taxation and no taxes collected at state and local level: excise taxes on consumption goods & fiscal monopolies.
The wealthy provided private education to their own children and higher education was targeted to a narrow elite.
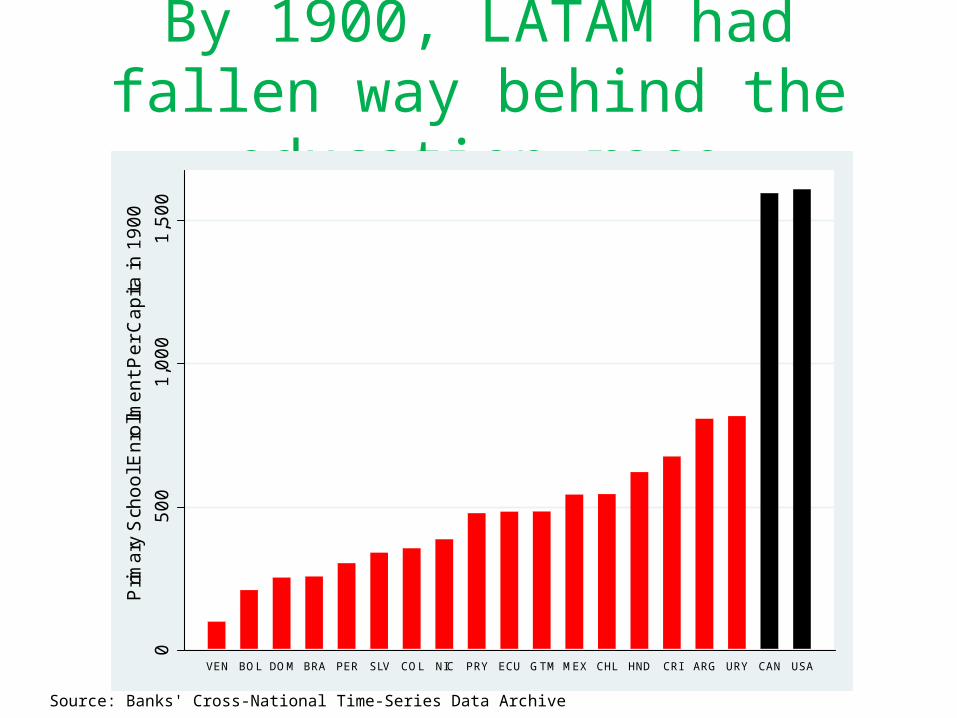
By 1900, LATAM had fallen way behind the education race
05
00
1,0
00
1,5
00
Prim
ary
Sch
oo
l En
rollm
en
t P
er
Ca
pita
in 1
90
0
VEN BOL DOM BRA PER SLV COL NIC PRY ECU GTM MEX CHL HND CRI ARG URY CAN USA
Source: Banks' Cross-National Time-Series Data Archive
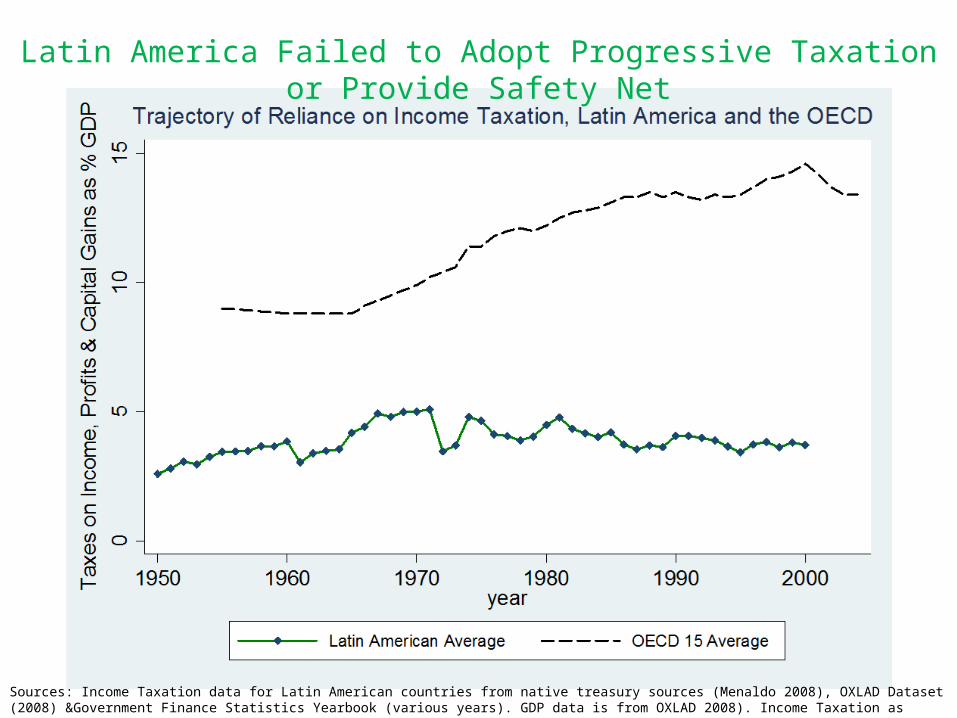
Sources: Income Taxation data for Latin American countries from native treasury sources (Menaldo 2008), OXLAD Dataset (2008) &Government Finance Statistics Yearbook (various years). GDP data is from OXLAD 2008). Income Taxation as share of GDP data for the EU 15 is from OECD Factbook (2007).
Latin America Failed to Adopt Progressive Taxation or Provide Safety Net
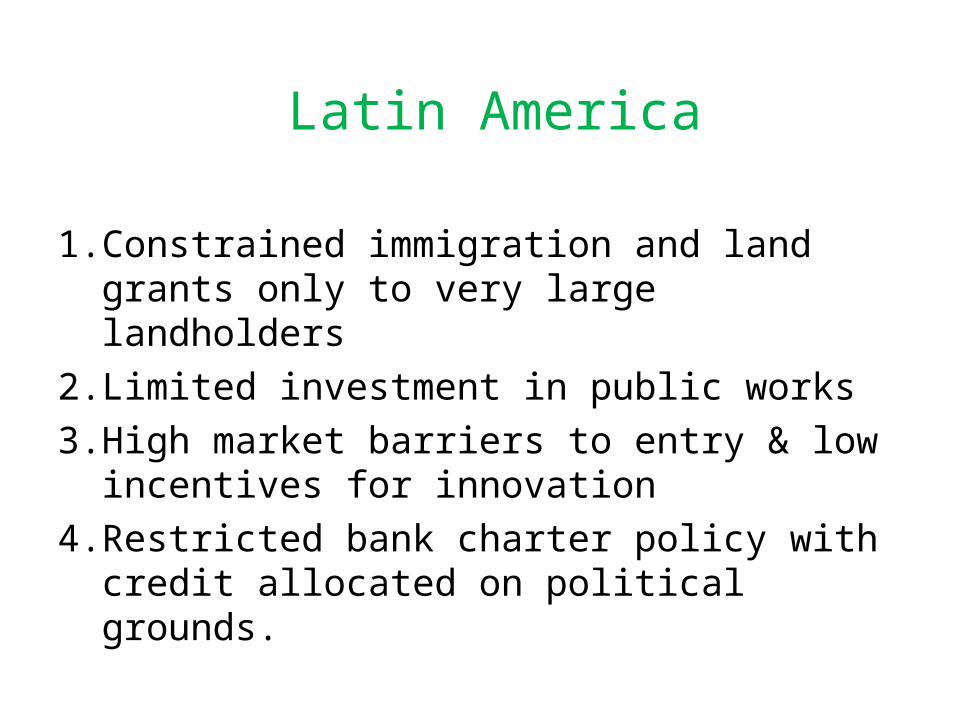
Latin America
1. Constrained immigration and land grants only to very large landholders
2. Limited investment in public works3. High market barriers to entry & low
incentives for innovation4. Restricted bank charter policy with credit
allocated on political grounds.
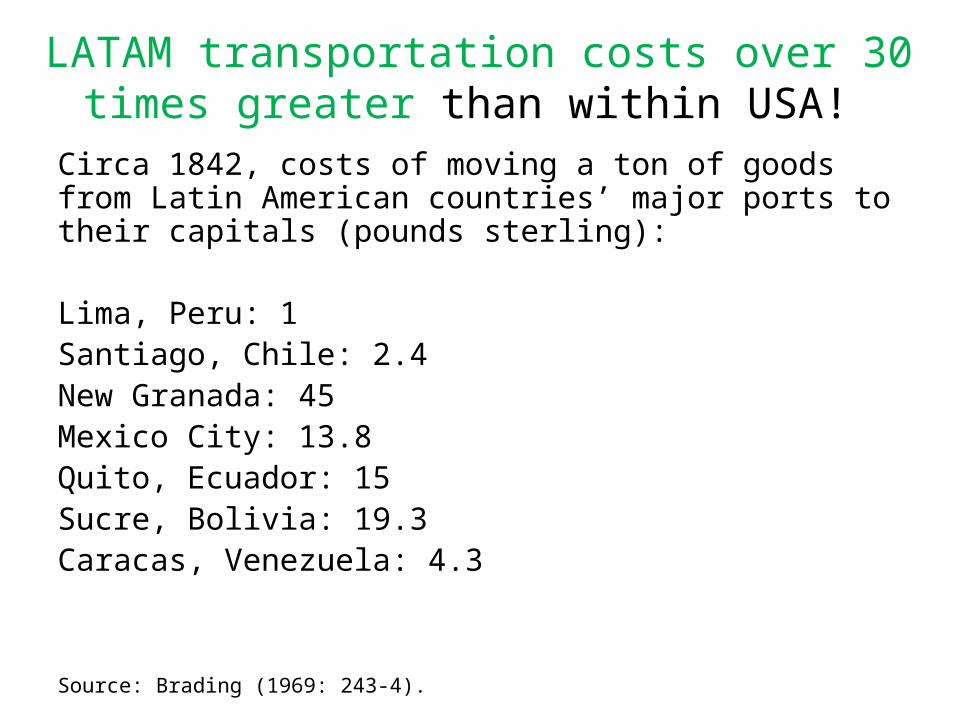
LATAM transportation costs over 30 times greater than within USA!
Circa 1842, costs of moving a ton of goods from Latin American countries’ major ports to their capitals (pounds sterling):
Lima, Peru: 1Santiago, Chile: 2.4New Granada: 45Mexico City: 13.8Quito, Ecuador: 15 Sucre, Bolivia: 19.3Caracas, Venezuela: 4.3
Source: Brading (1969: 243-4).
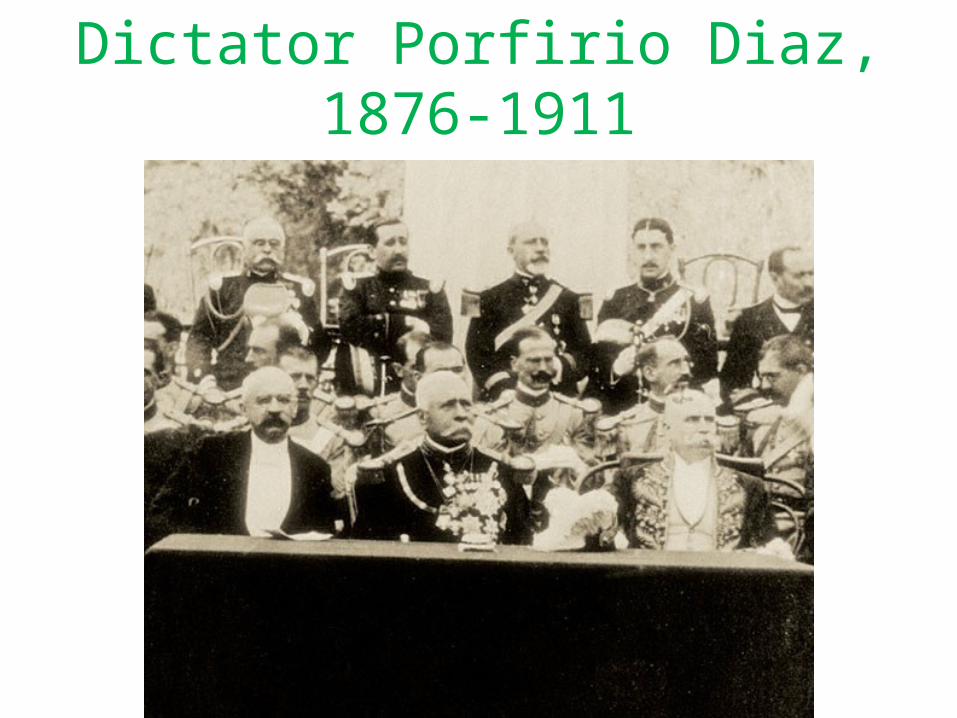
Dictator Porfirio Diaz, 1876-1911
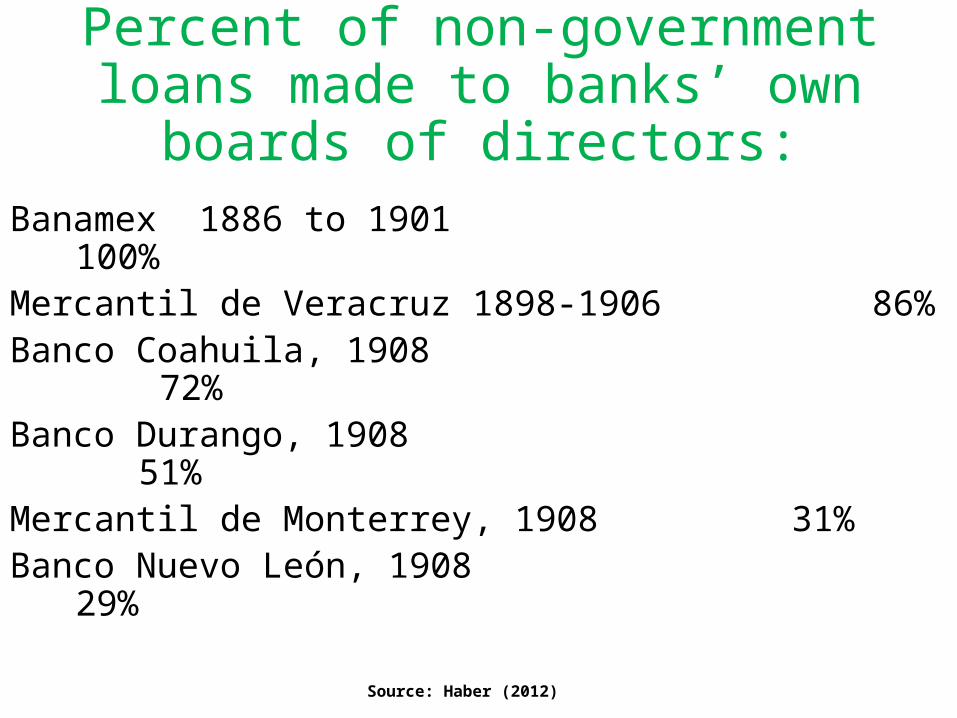
Percent of non-government loans made to banks’ own boards of directors:
Banamex 1886 to 1901 100%Mercantil de Veracruz 1898-1906 86%Banco Coahuila, 1908 72%Banco Durango, 1908 51%Mercantil de Monterrey, 1908 31%Banco Nuevo León, 1908 29%
Source: Haber (2012)
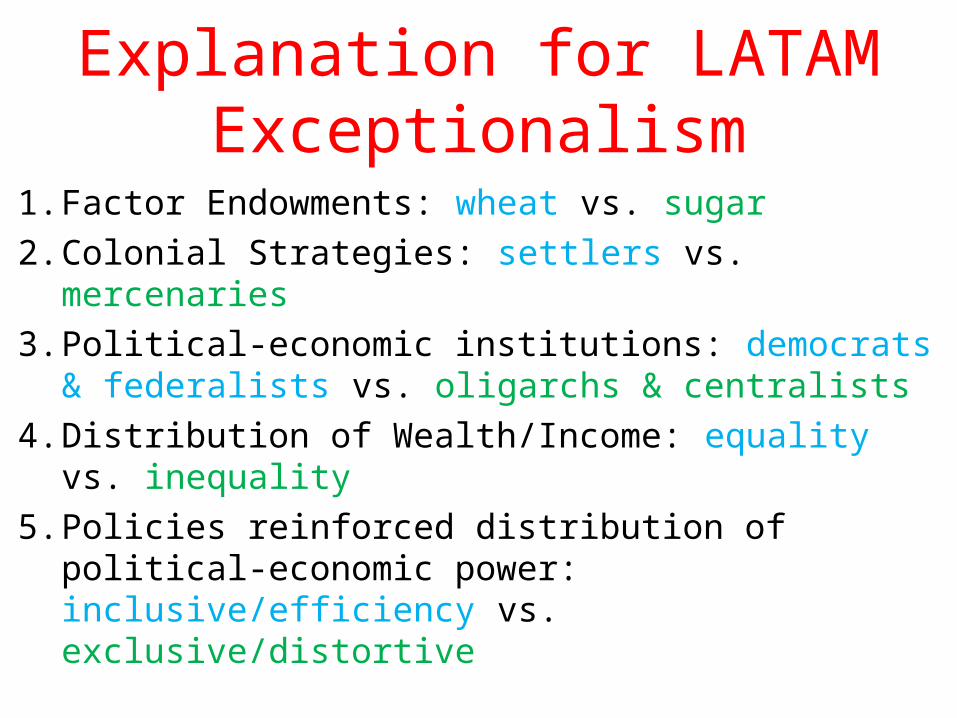
Explanation for LATAM Exceptionalism
1. Factor Endowments: wheat vs. sugar2. Colonial Strategies: settlers vs. mercenaries3. Political-economic institutions: democrats &
federalists vs. oligarchs & centralists 4. Distribution of Wealth/Income: equality vs.
inequality5. Policies reinforced distribution of political-
economic power: inclusive/efficiency vs. exclusive/distortive
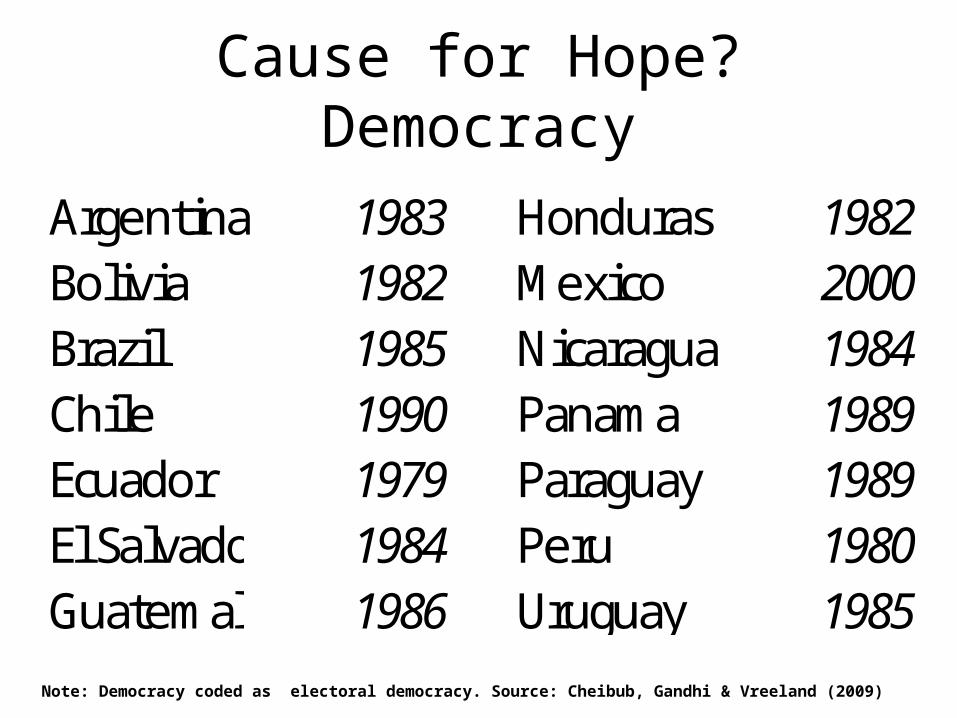
Cause for Hope? Democracy
Argentina 1983 Honduras 1982Bolivia 1982 Mexico 2000Brazil 1985 Nicaragua 1984Chile 1990 Panama 1989Ecuador 1979 Paraguay 1989El Salvador 1984 Peru 1980Guatemala 1986 Uruguay 1985
Note: Democracy coded as electoral democracy. Source: Cheibub, Gandhi & Vreeland (2009)
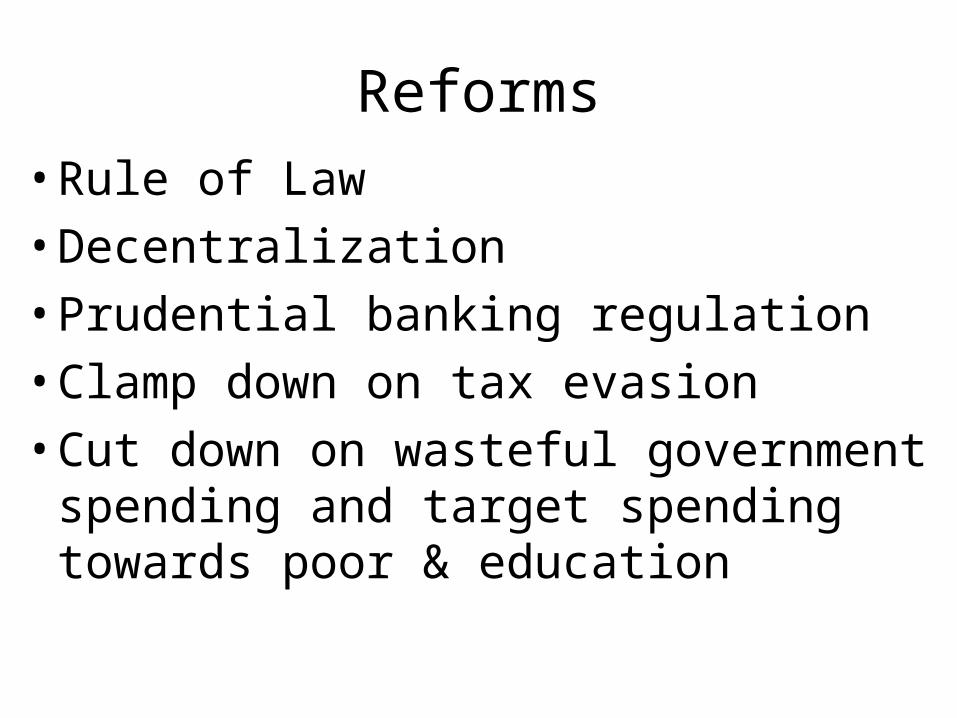
Reforms• Rule of Law• Decentralization• Prudential banking regulation• Clamp down on tax evasion • Cut down on wasteful government
spending and target spending towards poor & education
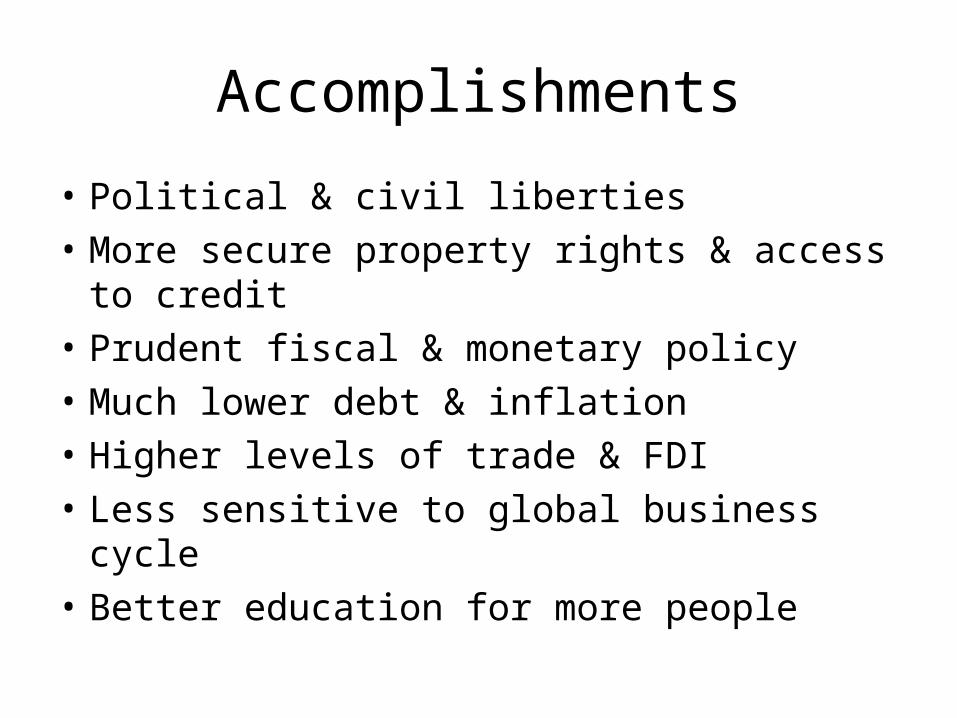
Accomplishments
• Political & civil liberties• More secure property rights & access to credit• Prudent fiscal & monetary policy• Much lower debt & inflation• Higher levels of trade & FDI• Less sensitive to global business cycle• Better education for more people
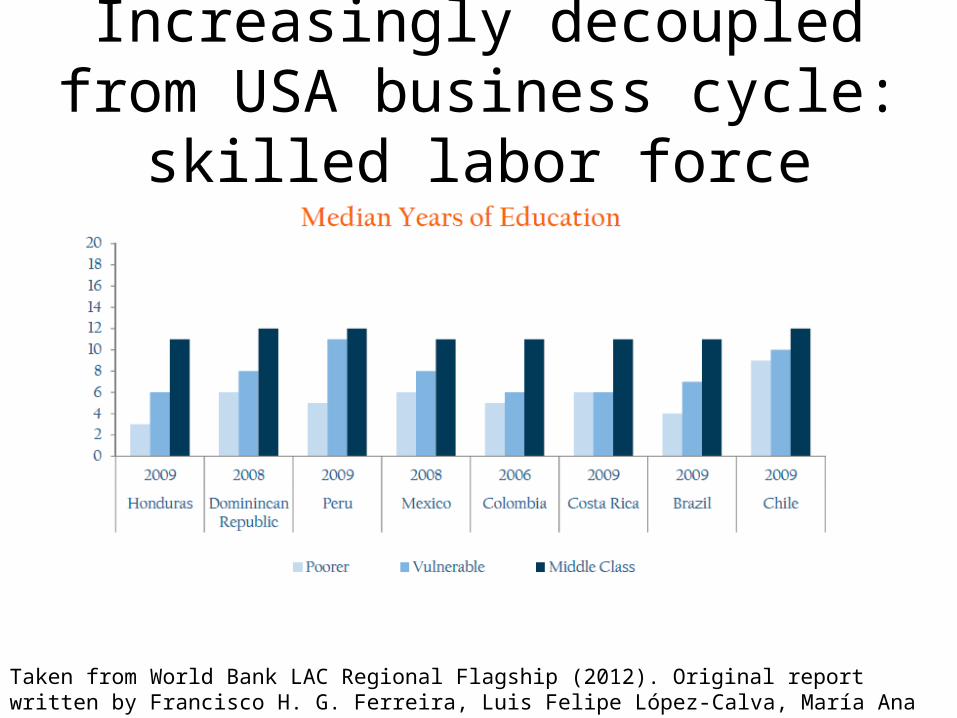
Increasingly decoupled from USA business cycle: skilled labor force
Taken from World Bank LAC Regional Flagship (2012). Original report written by Francisco H. G. Ferreira, Luis Felipe López-Calva, María Ana Lugo, Julián Messina, Jamele Rigolini, and Renos Vakis.
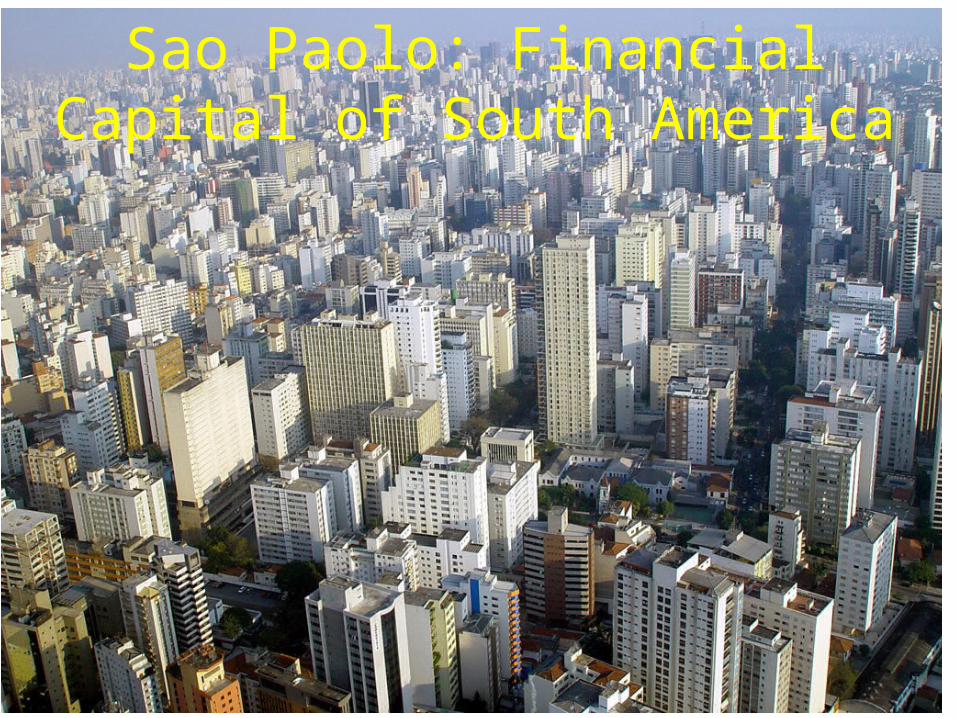
Sao Paolo: Financial Capital of South America