lateral loading and response for a tall … · to consider wind loading according to cp31 or...
TRANSCRIPT

Saturday, December 19, 2015Total number of words: 6515
Macintosh HD:Users:jb591:Dropbox:5_DOCS_TP_DROPBOX:papers_journal:RP_performance_ES:rp_performance_ES2.doc
1
LATERAL LOADING AND RESPONSE FOR A TALL BUILDING IN THE NON-SEISMIC DOLDRUMS James MW Brownjohn BSc, PhD, Ceng MIMechE MIStructE SYNOPSIS
The situation for building design against wind and earthquake effects in Singapore is apparently unique. There is no seismic design code as there is no local seismicity, yet the effects of significant regional earthquakes are frequently felt in many high rise buildings in Singapore. Whereas it has become clear that the strongest winds in Singapore originate from storms and squalls, design for wind by law requires use of an arbitrary design wind speed applied in a British loading code geared to cyclonic wind systems.
A decade of monitoring of a 280m office has shown that distant strong earthquakes generate dynamic response typically an order of magnitude greater than due to the strongest winds occurring during the same period. The effect is greater for high rise apartment blocks and it is becoming clear that for extreme events with similar return periods, earthquake effects should govern design for lateral load in terms of dynamic base shears under such conditions. For the present building control authorities take code requirements to design for accidental eccentricity to be adequate to cover seismic loads and while there have been moves towards a more rational local code there remains an open question about the relationship of static and dynamic effects due to wind for both cyclonic and (thunder)storm winds. In this paper the evidence concerning the nature of the two forms of loading is presented and the various existing and potential code provisions examined.
KEYWORDS Tall building vibration code wind earthquakes instrumentation

Saturday, December 19, 2015Total number of words: 6515
Macintosh HD:Users:jb591:Dropbox:5_DOCS_TP_DROPBOX:papers_journal:RP_performance_ES:rp_performance_ES2.doc
2
INTRODUCTION
The city state of Singapore, at Latitude 1.3°, Longitude 103.8° with land area of approximately 620km2, has no local seismic activity and is not subject to strong cyclonic weather systems. Such apparently ideal conditions should favor tall building design and the only real limitations on building height in Singapore are aviation regulations restricting maximum height of permanent structures to 280m. There is currently no specific code provision for dynamic lateral loading due to seismic activity and equivalent static approaches are used for wind. Under the Building Control Act, building design has to consider wind loading according to CP31 or BS63992 and design is according to either BS59503 or BS81104 or more recent equivalents. According to BS8110 a ‘notional horizontal load’ (NHL) equivalent to 1.5% of dead load has to be applied to cater for accidental eccentricity and is believed to be good enough cater for seismic actions, while using the 3-second gust as a static wind load is believed to cover dynamic wind effects. While on the surface specific provisions for dynamic effects seem to be unnecessary, close examination shows the need to assess how far existing code provisions are adequate to provide for occasional unusual dynamic loads.
Specifically, while there are no local faults, Singapore is approximately 700km from a major subduction zone off the south west coast of neighbouring Sumatra which has been the source of numerous earthquakes including the Ms=8.0 Bengulu event of 4th June 20005. More notably, study of coral micro-atolls off the Sumatran coast6 suggests the magnitude of the great earthquake of 1833 to have been Mw=8.8-9.2, and that such events recur at intervals of approximately 200-260 years. As for wind, there is no officially published design wind speed and the Building and Construction Authority (BCA) in Singapore will apparently accept designs that consider design wind speeds in the range 30-35m/sec for a 3-second gust. The origin of these figures is difficult to trace, but the range is believed to be conservative. Using such an inexact approach is not ideal, and as part of regional harmonisation including Singapore, the Asia Pacific Economic Cooperative (APEC) has suggested member states develop wind codes modeled on ISO 43547. This model code uses a design pressure based on a mean wind speed (10 minute averaging is suggested), with a form of gust load factor to account for turbulence and resonant amplification.
For Singapore, using mean wind speeds can be misleading as the strongest winds are known to have been the result of local events such as thunderstorms or ‘Sumatran squalls’. The strongest (and certainly reliable) recorded gust wind speed was 40m/sec, recorded at an airfield in the north-west of the island during a storm and appears to be an outlier in regression analyses of extreme winds8.
Singapore is thus a paradox for dynamic loading of buildings. It has no local seismic activity and consequently no seismic loading code but is 700km from the source of the largest recurring earthquakes on the planet. The current wind loading provision is widely regarded as over-conservative yet attempts to determine a more appropriate design value and procedure face (apart from political considerations) the difficulty that it is probably not the usual steady monsoon winds associated with large-scale weather systems that govern but the localised, short-lived and highly turbulent storms. In the end it is the performance of the buildings under seismic and wind loads that is the concern, so it is natural to study building performance as a gauge of the loading. Through such studies it is possible to calibrate loading codes9,10.
This paper examines evidence from full-scale studies of one structure and compares observations with code-based estimates of loading and response. It begins by briefly reviewing current code

Saturday, December 19, 2015Total number of words: 6515
Macintosh HD:Users:jb591:Dropbox:5_DOCS_TP_DROPBOX:papers_journal:RP_performance_ES:rp_performance_ES2.doc
3
provisions for both seismic and wind loads, then describes an instrumented structure which is able to act as an analog, via a finite element model validated by full-scale testing, to estimate the static and dynamic responses due to these design loads.
Response data recorded at the building due to extreme wind and earthquake events are then presented for comparison with code requirements, showing that so far, at least dynamically, building response has resulted in no more than 10% of design base shears. As it has become clear that more rational bases for design against lateral loads would be desirable, some candidate loading codes are then reviewed in terms of applicability to Singapore in terms of wind, seismic and serviceability provisions.
Finally, comparison of seismic and wind-induced response with respect to lateral load is not complete without including quasi-static response to wind, to which end data recently acquired using a GPS system are presented. Even with such a sophisticated system it has proven to be still rather difficult to obtain reliable indication of wind-induced displacements
CURRENT DESIGN CODE PROVISIONS FOR DYNAMIC WIND LOADS Because it is simple to use, invariably conservative and specifically referenced in local legislation, present design for wind loading in Singapore still widely uses CP31, which is based on a 3-second gust speed which is converted to a load via pressure coefficients and modified by factors. The load F on a surface element with area A is given by
( ) ( )21 2 30.5 air pe piF VS S S C C Aρ= − 1)
V is a basic wind speed given as a 3-second gust for the all areas in the UK (not Singapore) in the code, 1 2 3, andS S S are factors for topography, height and ground roughness and return period. Cpe and Cpi are pressure coefficients for external and internal areas. BS63992, not widely used, leads to loads on a surface element given by
( )( )0.85 1front rear rF P P C= × − +∑ ∑ 2)
where Pfront and Prear are horizontal loads on windward and leeward facing surfaces. Cr is the dynamic augmentation factor which allows for load enhancement due to resonant response and the 0.85 is a fixed value allowing for ‘non-simultaneous action of forces’. The loads P are obtained from
( ) { } { }( )2
int0.5 b a b d s p pe a pi aexternal ernal
P V S S S S S C C A C C Aρ= − 3)
Vb is a basic wind speed given for all areas in the UK and being a one-hour mean value is lower than the CP3 values. The factors , , anda d s pS S S S are for altitude, direction, seasonal and statistical considerations and are vary around unity, but the ‘terrain and building factor’ Sb varies in the approximate range 1 to 2 to account for the difference in using (lower) hourly averaged wind speeds so as to provide a measure of peak rather than mean loads. The three principal differences between the two codes i.e. use of mean wind speed with correction from mean to peak values and the acknowledgement of lack of correlation and resonant response are significant issues for dynamic wind-induced response, and which are all covered in greater and appropriate detail in wind loading codes with local relevance i.e. ISO43547 and the latest Australian/New Zealand wind code AS1170.211.

Saturday, December 19, 2015Total number of words: 6515
Macintosh HD:Users:jb591:Dropbox:5_DOCS_TP_DROPBOX:papers_journal:RP_performance_ES:rp_performance_ES2.doc
4
These other codes also deal with wind-induced vibrations in along-wind or cross-wind direction, neither of which are dealt with in the currently used British codes and for which it would otherwise be necessary to resort to ESDU documentation12.
CURRENT DESIGN CODE PROVISIONS FOR SEISMIC LOADS Presently there are no specific provisions for seismic loading in Singapore, however the NHL amounts to a lateral force equal to 1.5% of the weight of each floor. For a uniform building this leads to a triangular distribution of accumulating storey shear forces, and is taken by BCA to cater for seismic actions, which so far have not caused any structural damage in Singapore. CODE PROVISIONS FOR VIBRATION SERVICEABILITY
The rarely used but applicable standard for vibration serviceability of tall buildings is BS661113 which proposes limiting values of horizontal vibration for infrequent events of duration at least ten minutes, such as storms. The values are given as 1/3rd octave (narrow band) RMS accelerations varying from 26mm/sec2 at 1Hz down to 81mm/sec2 at 0.063Hz. For a structure with natural frequency of 0.2Hz the corresponding RMS is 55 mm/sec2. Within CP3 or BS6399 pt 2 there is no means to estimate accelerations for vibration serviceability, although there is provision in alternative regional codes. DESCRIPTION OF INSTRUMENTED STRUCTURE
The design loads and their effects have been evaluated and compared with experimental observations for the 280m, sixty-six storey Republic Plaza (Fig. 1), which has been studied through static and dynamic response measurements since 199314,15. The tower has a frame-tube structural system with an internal lateral load-bearing core wall connected to a ring of eight external columns by horizontal steel framing system at every floor. An extensive program of vibration measurements and consequent finite element mode updating has provided a clear description of the characteristics of the building. Specifically, the fundamental vibration modes A1 and B2 occur at 0.18Hz and 0.19Hz in the principal directions A and B, have damping ratios below 0.7% and mode shapes that are on the cantilever side of linear while the single noded-second modes A2 and B2 occur at 0.67Hz and 0.72Hz. Knowledge of structural mass, provided by the contractor, together with a set of 12 mapped vibration modes has validated a finite element model (FEM)14, allowing to evaluate the static and dynamic deflected shape for any given load and vice versa. A long term monitoring system comprising bi-axial horizontal accelerometers at rooftop (level 65) and basement (B1), and a pair of three-component anemometers, one on each corner of the building parapet were installed in 1996. Originally the anemometers were propeller type but were replaced by ‘sonic’ devices, but these have also proved unreliable. One year of complete wind data was provided by each anemometer set, after which various operational difficulties affected various of the wind data channels. A recent system upgrade to the existing 10-channel system is a dual receiver global positioning system (GPS) logger for tracking displacements, clearly a necessity to identify static response to wind. This is a novel application for GPS, pushing to the limits of resolution, and with various forms of error in the signal. Hence a major part of the exercise has been to validate the GPS data in various ways. So far it has been possible to identify dynamic response in the GPS in strong winds and the system is beginning to identify the slowly varying building movements. COMPARISON OF CODE PROVISION AND PREDICTED RESPONSE FOR LATERAL LOADS

Saturday, December 19, 2015Total number of words: 6515
Macintosh HD:Users:jb591:Dropbox:5_DOCS_TP_DROPBOX:papers_journal:RP_performance_ES:rp_performance_ES2.doc
5
The code provisions for seismic loading (via NHL) and wind loading (via CP3) are compared in Fig. 2 in terms of accumulating storey shears. The building masses are used to compute NHL while a 30m/sec design wind speed (3 second gust) is used for wind, the absolute minimum currently acceptable design value. Fig. 2 also shows the shears for seismic response, in first mode, resulting in the same base shear as NHL i.e. 1.5% of total building weight. For the same base shear the base overturning moment would be considerably larger, showing that an argument that NHL is equivalent to a base seismic (base shear) coefficient of 1.5%g may be misleading.
Fig. 3 shows the deflections obtained using the validated FEM by applying the CP3 load in the building principal axes A and B. For the seismic response, resonant response in mode A1 is assumed and the peak absolute deflections to achieve 1.5% base shear are shown. This is determined from the known building mass distribution and mode shape leading to 0.41m/sec2 peak acceleration. To achieve 1.5% base shear in mode A2 requires 0.8m/sec2 or 0.045m deflection. PEAK DYNAMIC RESPONSE VALUES FOR STORM AND TREMOR
Direct comparison of code provisions for lateral loading should be possible given the maximum known response of the building for both types of loading. For seismic loading, as the mode shapes and mass distribution are known all that is required is the roof acceleration, or for consideration of a single mode, the peak level 65 acceleration in that mode. For wind loading the along-wind response comprises a static and dynamic component, the former requiring a measure of the ‘static’ displacement of the building during a strong wind and the latter requiring the dynamic response in the fundamental mode which dominates wind-induced response. Peak acceleration and serviceability
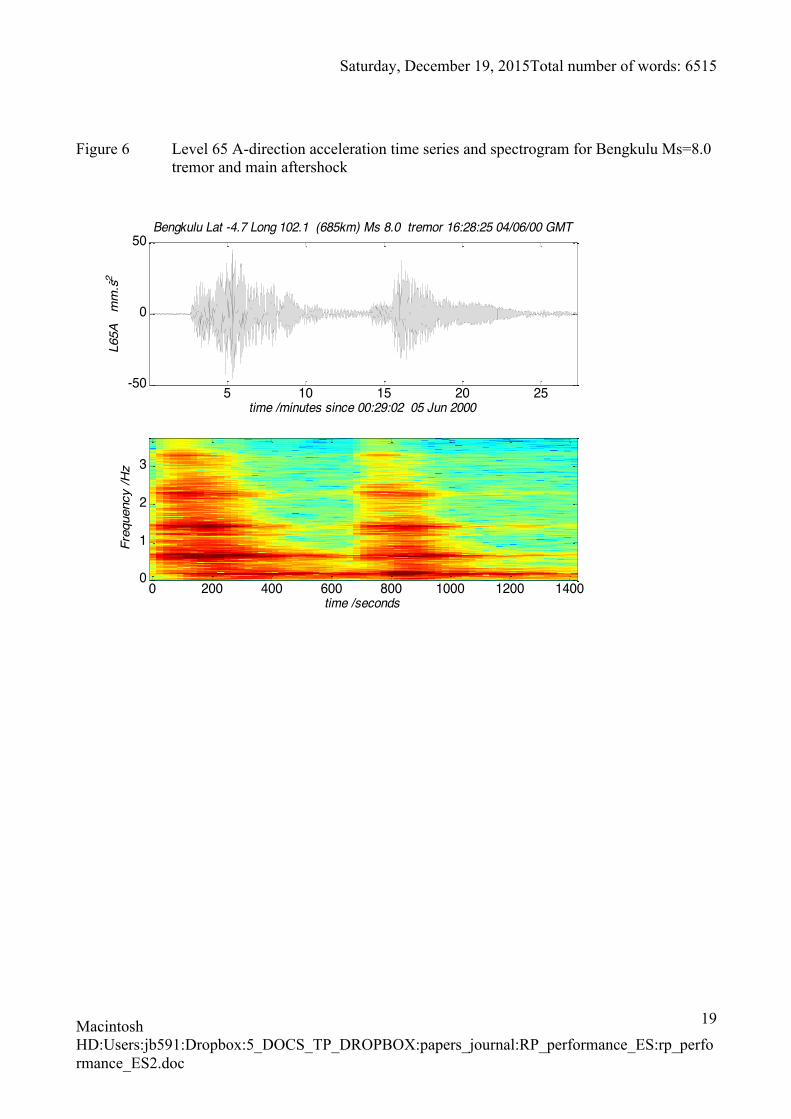
Fig. 4 present Gumbel plots of RMS acceleration in the band of the two close fundamental frequencies for A and B directions, measured over 9-minute records. For most records there is no clear difference between responses in along-wind and cross-wind directions. Peak acceleration values are more relevant but because they are not determined for every record (as are modal RMS values), the statistical peak factor gA has been obtained for a sizeable data set of recorded time series, returning an average value of 3.9. Hence 50-year wind-induced accelerations would approach 20mm/sec2. For the very strongest wind-induced response, Fig. 5 presents time series in both directions together with displacements. This event was described locally as a ‘100 year storm’, less due to the wind than due to the large rainfall that appeared to affect operation of the sonic anemometers that were unable to provide a reliable wind signal. The peak to peak accelerations were ±15.5mm/sec2 in A-direction, ±10.5mm/sec2 in B-direction with respective RMS of 4.4 mm/sec2 and 3.1 mm/sec2. Peak to peak displacements (with unknown zero reference) of 31mm and 18mm were found using the lowest possible high pass filter frequency of 0.02Hz. The strongest seismic response recorded since 1995 was due to the Ms=8.0 Bengkulu tremor of June 20005, generating peak accelerations of ±48mm/sec2. Fig. 6 shows both main and aftershocks, as time series and spectrogram. The tremor response may have been even greater as the system (having range of +/-50mm.sec-2) almost certainly clipped the high frequency components. Corresponding dynamic deflections relative to the basement were, by integration, respectively 36mm and 29mm peak to peak.
Frequency content The spectrogram of Fig. 6 reveals the presence of stronger second vibration mode at 0.67Hz in the main shock of the tremor. This is a feature of all the records captured by the system and is

Saturday, December 19, 2015Total number of words: 6515
Macintosh HD:Users:jb591:Dropbox:5_DOCS_TP_DROPBOX:papers_journal:RP_performance_ES:rp_performance_ES2.doc
6
consistent with the largest peak response spectrum values being in the range 0.5Hz to 1Hz for all tremors with epicentral distance over 500km. This is significant for Singapore as a large number of high-rise apartment blocks, probably those with at least 20 stories, will respond to this frequency range predominantly in the fundamental mode. Mass participation factors are much greater for mode 1 (for Republic Plaza in A-direction the factors are 62% for mode 1 compared to 15.5% for mode 2) hence the effect on these residential buildings will be much greater. Conversely as the wind-induced dynamic response is almost entirely in first mode and wind pressure power spectrum reduces with increasing frequency, the already weaker wind effect would diminish even further. Only one data point16 is available for such a high rise apartment block, and this shows the RMS acceleration due to a tremor being ten times that due to a strong storm occurring in the same period. Base shear from extreme events
Figs. 7 and 8 present contributions to base shear in the first and second modes for the strong wind and distant strong earthquake events shown in Figs. 5 and 6. These can be compared with the NHL value of 10.8MN given in Fig. 2. To calculate the base shear the signals have been filtered into each mode and applied as a scale factors to an integral (summation) of the product of floor mass and measured modal ordinate at each floor. For the wind the peak dynamic base shear is less then 4% of NHL, for the earthquake it is less than 8%.
Information lacking for more reliable comparison of seismic and wind effects is extreme values of spectral accelerations for tremors and the magnitude of the static or quasi-static elastic deflections of the building under wind load. Historical records17 have shown several regional events with magnitudes larger than 8, for example events with moment magnitude 8.4 and 8.75 occurred in the Sumatra area in the 19th century long before they could affect any high-rise buildings, and there is evidence from the coral studies6 of even greater magnitudes. Further, many of the high-rise buildings that have responded to more recent tremors (to the concern of the residents) are built on reclaimed land or soft soil sites where the effect would be enhanced. While there are no building response records, indirect evidence18 indicates relatively large effects on such buildings.
For the quasi-static wind-induced response, provided the deflections are elastic it is possible to estimate the loads using measured absolute deflections, the calibrated FE model and some assumptions about the wind profile that have been made in generating Figs. 2 and 3. Some displacement data have been collected by the GPS logger and, as discussed later appear, up to a point, to corroborate code predictions of the relative scale of static and dynamic response. ALTERNATIVE REGIONAL CODE PROVISIONS
Wind codes and design wind speeds The dependence on a British wind code using a design wind speed of dubious origin is not satisfactory, and with a view to a more rational basis for design, meteorological data have been used to estimate extreme winds for given return periods19. The exercise has been carried out separately for winds due to small-scale systems or thunderstorms (identified from radar data) and large scale systems (monsoonal winds) for peak speeds as well as mean values with 10 minute and one hour averaging times. The large-scale (monsoonal winds) tend to have relatively high mean wind speeds and low turbulence whereas the small-scale (thunderstorm) winds have high gust speeds and low means. Observation of both wind types at Republic Plaza has shown thunderstorm winds to have the greater effect.

Saturday, December 19, 2015Total number of words: 6515
Macintosh HD:Users:jb591:Dropbox:5_DOCS_TP_DROPBOX:papers_journal:RP_performance_ES:rp_performance_ES2.doc
7
For the combined wind systems 10-minute mean and 3-second gust wind speeds up to 17.6m/sec and 29.3m/sec resulted19 for a return period of 50 years, corresponding to a gust factor approaching 1.7. While not directly measured, turbulent intensities can be inferred using the statistical peak factor that depends only on averaging time. A number of national codes are reviewed for applicability to dynamic response by Kijewski and Kareem20 but for local use, the two candidates for possible use in Singapore are ISO4354 and AS1170.2.
ISO43547 is relatively simple and determines total aerodynamic pressure F from: 20.5 exp fig dynF v C C Cρ= 4)
where Cfig and Cexp represent factors mainly due to shape and wind profile. The background dynamic response due to wind speed fluctuations, lack of coherence along the structure height and enhanced response due to resonance are accounted for by the ‘dynamic response factor’:
2 21 2 1dyn w uC g I B R B= + + , 5)
where B, is background factor (less than unity), Iu the turbulent intensity and R is a function of structural damping, spectral energy and reduced frequency.
Peak factor is gW=3.7 for ten-minute mean speeds and turbulent intensity as Iu =17%. For Republic Plaza, R2/B2 is only 0.211 so does not even compensate for the reduced coherence given with B=0.7:
2 21 2 1 1 2 3.7 0.17 0.7 1 0.211 2dyn w uC g I B R B= + + = + × × × × + ≈ 6)
The wind load prediction is very sensitive to roughness length and scale factor used in Cexp and Fig. 2 shows that the shear predicted for ‘city terrain’ is considerably less than due to CP3, but much closer for open terrain.
AS1170.211 uses a 3-second gust and a Cexp that accounts only for the combination of resonant amplification and lack of coherence, and taking a minimum of unity. The result, shown in Fig. 2 is closer to CP3 using the factors relevant to the building situation. Seismic provisions
For seismic effects due to distant earthquakes, epicentral distance is a major consideration as well as earthquake magnitude. Extreme event scenarios of a magnitude 9 Sumatran subduction earthquake21 or a magnitude 7.6 earthquake along the Sumatran fault lead22 to conclusions that elastic base shear demand is likely to exceed the 1.5% NHL provision. Given this, it may be advisable to provide a seismic code or at least design guide for Singapore. Possible models are due to ISO23 are the Australian code AS1170.424 and the Indonesian code25, all under review at the time of writing. The last of these is relatively simple and even includes Singapore, but in zone 6 for which zero seismicity is assumed. For zone 5 a base seismic coefficient of 2% of building weight is used and there are consequences on robust design with consideration for seismic effects, for which there is officially no requirement in Singapore.
Serviceability considerations A bonus with either of these codes is a means to predict vibration levels for comfort (serviceability). For ISO4354, peak acceleration pa is related to mean deflection δ via

Saturday, December 19, 2015Total number of words: 6515
Macintosh HD:Users:jb591:Dropbox:5_DOCS_TP_DROPBOX:papers_journal:RP_performance_ES:rp_performance_ES2.doc
8
( ) ( )22 2p w u oa g I B R B fπ δ= ⋅ ⋅ 7)
where of is fundamental frequency. Peak deflections would be found by structural analysis based on the equivalent static wind loads and converted to mean values by dividing by Cdyn. For example, taking the peak deflection 0.136m predicted by CP3, dividing by Cdyn (approximately 2) to get ‘mean’ deflection then using the appropriate values in equation (7) leads to 2p p pa aδ δ≈ =0.64 so that peak acceleration is 40mm/sec2, in line with the observed 50 year return peak acceleration. If this is in first mode, the peak dynamic displacement would be 31mm. This calculation also gives a feel of the relative magnitudes of dynamic and quasi-static deflections.
AS1170.2 avoids structural analysis and simply relates peak along-wind acceleration to peak moment kinematically via ( )23p oa m h= × resonant component of peak base bending moment Mres which is given (with a little simplification) by summing resonant component of horizontal forces at height z as:
( )2
1 2
tair w h
res fig desw h
SEg IM C V zdA
g I
ρζ
= ×+ ∑ 8)
S is size reduction factor and Et is spectrum of along wind turbulence. Damping for first mode is ζ=0.7%, mo is average mass per unit height (72,488,000kg over 280m) and Ih turbulence intensity taken as 0.17. Supplying other values for Republic Plaza, equation (8) leads to resonant component of bending moment of 395MNm and peak acceleration is then 58.5mm/sec2. AS1170.2 also provides for calculating across-wind acceleration. These are within the BS6611 provision of 55m/sec2 RMS (in 1/3rd octave band) which using the peak factor of 3.9 and assuming all response to be in mode 1 is equivalent to peak acceleration of 200 mm/sec2. The building specification was for peak acceleration to be less than 100 mm/sec2.
STATIC RESPONSE TO WIND For tremors all the loading is dynamic, but for wind the majority contribution to loading should be static. Direct comparison of seismic and wind load effects is only possible if the static component of base shear can be added to the measurable dynamic component. As proposed, since the FE model of the building has been validated, non-resonant low frequency or ‘static’ deflections could be used to recover the corresponding ‘static’ or quasi-static component of load. This has been one aim of installing the GPS. The rare full-scale measurements of deflections of tall buildings have until recent used optical systems for tracking displacement, for example a study of a 57 storey office block in Toronto10 for which, with a natural frequency of in the range 0.117-0.135Hz (depending on wind speed) mean deflections were shown as being approximately 8 times RMS values. Using GPS to measure total displacement
The global positioning system (GPS) offers new possibilities for direct measurement of deflection without need for optical methods, which have a number of limitations. A growing number of studies are using this technology, initially for short term measurements e.g. of the 324m Di Wang Tower in Shenzen26,27 and the Humber Bridge28.

Saturday, December 19, 2015Total number of words: 6515
Macintosh HD:Users:jb591:Dropbox:5_DOCS_TP_DROPBOX:papers_journal:RP_performance_ES:rp_performance_ES2.doc
9
Capture of large deflections and correlations with other effects principally acceleration and wind requires longer term monitoring. Two recent projects have shown the potential; the Chicago Project28 that uses GPS to track movements of three tall buildings and the capture of both wind and seismic induced response up to 2Hz in a radio mast30. For Republic Plaza the real-time kinematic (RTK) GPS logger comprises two Leica SR530 ‘rover’ receivers and a base station approximately 10km distant. Positional corrections are transmitted from base station to rovers that output a fix at 1 second intervals. For synchronous saving with the accelerometer data, the RTK data are converted to analog signals for input to the analog to digital converter of the acceleration recording system. RTK data are recorded continuously, with raw data saved at each receiver on event trigger for post-processing. Fig. 9 shows one GPS antenna located on the building parapet adjacent to one ultrasonic anemometer. This is one of a pair of antennae located close to positions 2 and 3 as marked on Fig. 1. The units are set flush with the parapet in an attempt to reduce the chances of lightning strike (one has already been replaced by Leica due to this). Fig. 10 shows time series obtained from accelerometers and GPS during a storm. The top two traces are easting and northing from rover 1, below are accelerations in east and west directions. Fig. 11 shows similar time series during a more windy period during the monsoon season, and includes signals from the second rover. GPS signals have drop outs (now remedied) but correlate up to a point between the receivers. The storm response shows changes in the DC acceleration levels, that could indicate building rotation, together with large GPS displacements that appear to show gradual static movement, a pause with vibration then more gradual static movement in a ratcheting action, totaling 130mm. This equates to the effect of the peak gust load from Fig. 2 so cannot be taken as elastic deflection.
For the monsoon wind the accelerometer signals do not drift and the GPS displacements are more even (and smaller), amounting to no more than 40mm accompanying peak accelerations of 8mm/sec2, whose relationship is more in line with the values (135mm and 40mm/sec2) for design wind speeds.
Some attempts have been made to realize DC acceleration variations as rotations and to integrate accelerometer signals but the results have not been useful as the very small instrument drift affects the DC voltage and prevents meaningful integration of frequencies below 0.02Hz. So far during the GPS operation only minor tremors have occurred, too small to generate relative displacements strong enough to be detectable above the GPS noise floor, which appears to be around 2mm to 4mm. Unlike wind-induced response, the GPS would mostly recover relative displacement as the significant displacement that have been observed by integration of accelerometer data appear to be crustal, affecting the whole island.
DISCUSSION During the period of operation of the monitoring system at Republic Plaza, there have been discussions about local codes or design guidance for wind and seismic effects using locally relevant and applicable data and the monitoring exercise has been a good opportunity to check code provisions against the full-scale performance. Structural design that has to be approved by regulatory authorities in Singapore is concerned with ultimate limit states, and serviceability is minor consideration. Hence safe but not overly conservative horizontal forces are the most important output of any code. In terms of code provisions, Fig. 2 shows that the NHL provision provides for lateral load (10.7MN) exceeding wind
Saturday, December 19, 2015Total number of words: 6515
Macintosh HD:Users:jb591:Dropbox:5_DOCS_TP_DROPBOX:papers_journal:RP_performance_ES:rp_performance_ES2.doc
10
loads (8.9MN) for one of the three tallest (in fact equally tall) buildings in Singapore, despite wind loading being regarded as critical for taller buildings. For shorter buildings, unless they are highly dynamically sensitive, wind load would generally be less significant. The concern would then be for vibration serviceability, and in the case of Republic Plaza, even design winds will not produce much more than half of serviceability limits (58mm/sec2 from AS1170.2 against 100mm/sec2 in the specification) No data have been presented here about wind speeds as reliable data are presented in papers by Choi and others19,31. Nevertheless, measurements using the rooftop anemometers have shown westerly winds to be stronger than easterly winds and that there is reasonable correlation between acceleration response and the dynamic component of wind (mean times standard deviation). Due to the questionable reliability of the wind signals it appears to be more useful to infer the actual loading via the response using the validated FE model. The range of wind speeds experienced appears to be within sight of the design value, maximum mean speeds of 13m/sec having been recorded (without allowance for experimentally judged 10% speeding up due to building shape or correction to 10m free-stream height). Hence the magnitude of wind loads experienced, including static effects is well covered by the wind loading code. For seismic effects the situation is ‘so far so good’. The strongest tremors experienced in Singapore have energy concentrated between 0.5H and 1Hz so for Republic Plaza the response to tremors is characteristically in second mode which has limited the building response. For buildings which respond in first mode in this frequency range, mass participation factors are around four times higher than for second mode, hence base shears will be much larger even before considering soil amplification effects. Added to that the possibility a regional ‘super earthquake’ of magnitude 9 and the risk to a major financial centre and it would seem wise to pay far more attention to seismic loading considerations than is currently admitted to. ACKNOWLEDGEMENTS
Thanks to City Developments Ltd and Shimizu Corporation for providing the opportunity and assistance for the instrumentation, to Max, Poh and GH Tan of SysEng and to Leica for continued support of the monitoring system, to TC Pan for support in looking for long distance earthquake effects, to You Xuting for running the calibrated FE model and to Edmund Choi for his wisdom in matters relating to extreme wind data in Singapore. POSTSCRIPT
This paper was submitted before the Boxing day (2004) magnitude 9 earthquake and resulting tsunami. The effect of the earthquake was recorded by the Republic Plaza recorder as both acceleration and RTK-GPS data. The raw data sets were also obtained for the three receivers and have been processed by the Satellite Navigation and Positioning Group (SNAP) at University of New South Wales Australia. The earthquake signal is clearly visible in the GPS data principally as strong mode 1 response. Figure 12 shows the basement displacement signal using, integrated from acceleration. The relatively long period oscillations do not show up in the GPS data because base station and rover experience similar ground motions.
Preliminary analysis has shown that the frequency content and response amplitude are both lower than expected for this epicentral distance. The fault rupture took place on the northern part of the subduction zone and extended north beyond the epicentre, while the events noted in reference 17 and which have more relevance for Singapore, took place in the southerly part of the zone.
Saturday, December 19, 2015Total number of words: 6515
Macintosh HD:Users:jb591:Dropbox:5_DOCS_TP_DROPBOX:papers_journal:RP_performance_ES:rp_performance_ES2.doc
11
REFERENCES
1. BSI. Code of basic data for the design of buildings. Chapter V, Loading, Part 2, Wind loads: CP3. British Standards Institution 1972.
2. BSI. British Standard: Loads for buildings. Part 2. Code of practice for wind loads: BS6399. British Standards Institution 1995.
3. BSI. British Standard: Structural use of concrete: Code of practice for design and construction: BS8110, Part 1. British Standards Institution 1985.
4. BSI. British Standard: Structural use of steelwork in building: Code of practice for design and construction: BS5950, Part 1. British Standards Institution 1990.
5. Pan TC, Kusnowidjaja K, Brownjohn JMW, Lee CL, The Bengkulu, Southern Sumatra Earthquake of June 4 2000. Seismological Research Letters 2001, 7(2), 171-185.
6. Zachariasen JK, Sieh K, Taylor FW, Edwards RL, Hantoro WS, Submergence and uplift associated with the giant 1833 Sumatran subduction earthquake: Evidence from coral microatolls. J. Geophys. Res. 1999, 104, 195-919.
7. ISO. International Standard: Wind actions on structures, ISO4354:1997. International Standards Organisation 1997.
8. Choi E.C.C., Basic wind speeds for the drafting of the Singapore Wind Loading Code. APEC Workshop on Alignment of Standards in the Building Industry, Hanoi, Vietnam, 2001.
9. Littler JD, Ellis BR, Interim findings from full-scale measurements at Hume Point. Journal of Wind engineering and Industrial Aerodynamics 1990, 36, 1181-1190.
10. Dalgleish WA, Rainer JH, Measurements of wind induced displacements and accelerations of a 57 storey building in Ontario Canada. Proceedings, 3rd Colloquium on Industrial Aerodynamics, Aachen, 1978, 2 67-78.
11. AS/NZS 1170.2, (2002) Structural design actions, Part 2: Wind actions
12. Engineering Sciences Data Unit, Calculation methods for along-wind loading. Part 3. response of buildings and plate-like structures to atmospheric turbulence. ESDU Item 88019.
13. BSI, Evaluation of the response of occupants of fixed structures, especially buildings and offshore structures, to low frequency horizontal motion (0.063-1hz). BS6611: 1985
14. Brownjohn JMW, Pan TC, Deng XY, Correlating dynamic characteristics from field measurements and numerical analysis of a high-rise building. Earthquake Engineering and Structural Dynamics 2000 29 No. 4, 523-543.
15. Brownjohn JMW, Pan TC, Response of tall buildings to weak long distance earthquakes. Earthquake Engineering & Structural Dynamics 2000, 30 709-729.
16. Brownjohn JMW, Ang CK, Full-scale dynamic response of a high rise building subject to lateral loading. ASCE Journal of Performance of Constructed Facilities 1998, 12, No. 1, 33-40.
17. Pan TC, Sun, J, Seismic events felt in Singapore (1833-1935). Nanyang Technological University Centre for Advanced Construction Studies Research Report CSE/ST&CO/96-01, 1996.
18. Pan TC, When the doorbell rings - a case of building response to a long distance earthquake. Earthquake Engineering and Structural Dynamics 1995, 24, 1343-1353.

Saturday, December 19, 2015Total number of words: 6515
Macintosh HD:Users:jb591:Dropbox:5_DOCS_TP_DROPBOX:papers_journal:RP_performance_ES:rp_performance_ES2.doc
12
19. Choi E. C. C., Tanurdjaja A., Extreme winds in Singapore. An area with mixed weather systems. Journal of Wind Engineering and Industrial Aerodynamics, 2002, 90, 1611-1630.
20. Kijewski, T. and Kareem, A. (1998), "Dynamic Wind Effects: A Comparative Study of Provisions in Codes and Standards with Wind Tunnel Data," Wind and Structures 1(1): 77-109.
21. Pan TC, Megawati K, Estimation of peak ground accelerations of the Malay Peninsula due to distant Sumatra earthquakes Bulletin of the Seismological Society of America, 2002 92(3), 1082-1094
22. Balendra T, Lam NTK, Wilson JL, Kong KH, Analysis of long-distance earthquake tremors and base shear demand for buildings in Singapore Engineering Structures, 2002, 24(1), 99-108
23. ISO. International Standard: Bases for design of structures –seismic actions on structures ISO 3010:1988. International Standards Organisation 1988
24. AS 1170.4-1993 : Minimum design loads on structures (known as the SAA Loading Code) Part 4:Earthquake loads.
25. Indonesian Seismic Code for Building, Ministry of Public Works, Indonesia, 1983.
26. Guo J., Ge S., Research of displacement and frequency of tall building under wind loading using GPS. ION GPS 2, Institute of Navigation, Alexandria USA, 1997, 1385-1388.
27. Xu YL, Zhan S, Field measurements of Di Wang Tower during Typhoon York. Journal of Wind Engineering and Industrial Aerodynamics 2001, 89 73-93.
28. Ashkenazi V, Roberts GW, Experimental monitoring of the Humber Bridge using GPS. Civil Engineering, Proceedings, Institution of Civil Engineers 1997 120 177-182
29. Kijewski-Correa TL, Kareem A, The Chicago Project: a fusion if information technologies and advanced sensing for civil infrastructure. Proceedings, SHMII-1, Tokyo, November 2003.
30. Li X, Ge L, Peng GD, Rizos C, Tamura Y, Yoshida A, Seismic Response of a Tower as Measured by an Integrated RTK-GPS System. 1st FIG International Symposium on Engineering Surveys for Construction Works and Structural Engineering, The University of Nottingham, United Kingdom, 2004
31. Choi ECC, Extreme wind characteristics in Singapore. Journal of Wind Engineering and Industrial Aerodynamics, 1999, 83, 61-69.

Saturday, December 19, 2015Total number of words: 6515
Macintosh HD:Users:jb591:Dropbox:5_DOCS_TP_DROPBOX:papers_journal:RP_performance_ES:rp_performance_ES2.doc
13
FIGURES
Figure 1 Republic Plaza, elevation and plan Figure 2 Storey shear variations according to various loading codes for wind and earthquake
applied in building A direction. NHL is notional horizontal load due to BS8110, ‘mode 1’ is for equal base shear in due to response in vibration mode 1.
Figure 3 Deflected shape due to CP3 wind loads of Figure 1 and corresponding to peak acceleration for NHL-equivalent base shear
Figure 4 Gumbel plots of 9-minute level 65 RMS accelerations in A and B directions, with predicted 50-year values.
Figure 5 Level 65 displacement and acceleration time series during 100-year (rain) storm. Displacements are obtained by integration with high pass filter cut off at 0.02Hz.
Figure 6 Level 65 A-direction acceleration time series and spectrogram for Bengkulu Ms=8.0 tremor and main aftershock
Figure 7 Contribution to base shear in modes A1 and A2 due to storm of Fig. 5 Figure 8 Contribution to base shear in modes A1 and A2 due to Bengkulu earthquake and
main aftershock of Fig. 6 Figure 9 GPS rover antenna and sonic antenna on corner of roof parapet, location 3 of Fig. 1
Figure 10 East (left, ch3) and North (right, ch4) displacement signals from GPS and corresponding accelerations during storm
Figure 11 East (left, ch1, ch3) and North (right, ch2, ch4) displacement signals from GPS and corresponding accelerations during strong monsoon wind. First and second row of GPS traces are from two rovers.

Saturday, December 19, 2015Total number of words: 6515
Macintosh HD:Users:jb591:Dropbox:5_DOCS_TP_DROPBOX:papers_journal:RP_performance_ES:rp_performance_ES2.doc
14
Figure 1 Republic Plaza, elevation and plan
45.000m
tapertaper
taper
taper
B
A
12
3
4 6
5
7
LR lifts
HRlifts

Saturday, December 19, 2015Total number of words: 6515
Macintosh HD:Users:jb591:Dropbox:5_DOCS_TP_DROPBOX:papers_journal:RP_performance_ES:rp_performance_ES2.doc
15
Figure 2 Storey shear variations according to various loading codes for wind and earthquake applied in building A direction. NHL is notional horizontal load due to BS8110, ‘mode 1’ is for equal base shear in due to response in vibration mode 1.
Storey shear variations
0
50
100
150
200
250
0 2 4 6 8 10 12shear /MN
height /m
CP3NHLmode 1ASISO

Saturday, December 19, 2015Total number of words: 6515
Macintosh HD:Users:jb591:Dropbox:5_DOCS_TP_DROPBOX:papers_journal:RP_performance_ES:rp_performance_ES2.doc
16
Figure 3 Deflected shape due to CP3 wind loads of Figure 1 and corresponding to peak acceleration for NHL-equivalent base shear
0
50
100
150
200
250
0.00 0.10 0.20 0.30deflection /m
height /m
mode 1CP3-ACP3-B

Saturday, December 19, 2015Total number of words: 6515
Macintosh HD:Users:jb591:Dropbox:5_DOCS_TP_DROPBOX:papers_journal:RP_performance_ES:rp_performance_ES2.doc
17
Figure 4 Gumbel plots of 9-minute roof level RMS accelerations in A and B directions, with predicted 50-year values.
0 2 4-1
0
1
2
3
4
5
6
750 yr A1 RMS acc: 6.04 mm/sec2
ln(1
/ln(1
/F))
RMS(A1) / mm.sec-20 2 4-1
0
1
2
3
4
5
6
7
850 yr B1 RMS acc: 5.29 mm/sec2
RMS(B1) / mm.sec-2
ln(1
/ln(1
/F))

Saturday, December 19, 2015Total number of words: 6515
Macintosh HD:Users:jb591:Dropbox:5_DOCS_TP_DROPBOX:papers_journal:RP_performance_ES:rp_performance_ES2.doc
18
Figure 5 Level 65 displacement and acceleration time series during 100-year (rain) storm. Displacements are obtained by integration with high pass filter cut off at 0.02Hz.
-10
0
10
ch 3
(mm
)
storm_mat
-10
0
10
ch 4
(mm
)
100 200 300 400 500
-10
0
10
ch 7
(mm
/sec
2 )
t/sec100 200 300 400 500
-10
0
10
ch 8
(mm
/sec
2 )
t/sec
Saturday, December 19, 2015Total number of words: 6515
Macintosh HD:Users:jb591:Dropbox:5_DOCS_TP_DROPBOX:papers_journal:RP_performance_ES:rp_performance_ES2.doc
19
Figure 6 Level 65 A-direction acceleration time series and spectrogram for Bengkulu Ms=8.0 tremor and main aftershock
5 10 15 20 25-50
0
50
L65A
m
m.s-2
time /minutes since 00:29:02 05 Jun 2000
Bengkulu Lat -4.7 Long 102.1 (685km) Ms 8.0 tremor 16:28:25 04/06/00 GMT
time /seconds
Freq
uenc
y /H
z
0 200 400 600 800 1000 1200 14000
1
2
3

Saturday, December 19, 2015Total number of words: 6515
Macintosh HD:Users:jb591:Dropbox:5_DOCS_TP_DROPBOX:papers_journal:RP_performance_ES:rp_performance_ES2.doc
20
Figure 7 Contribution to base shear in modes A1 and A2 due to storm of Fig. 5
0 1 2 3 4 5 6 7 8 9 10-0.4
-0.2
0
0.2
0.4Base shear for mode A1 at 0.18Hz
V/M
N
0 1 2 3 4 5 6 7 8 9 10-0.02
-0.01
0
0.01
0.02Base shear for mode A2 at 0.68Hz
t/min
V/M
N

Saturday, December 19, 2015Total number of words: 6515
Macintosh HD:Users:jb591:Dropbox:5_DOCS_TP_DROPBOX:papers_journal:RP_performance_ES:rp_performance_ES2.doc
21
Figure 8 Contribution to base shear in modes A1 and A2 due to Bengkulu earthquake and main aftershock of Fig. 6
0 5 10 15 20 25 30-1
-0.5
0
0.5
1Base shear for mode A1 at 0.18Hz
V/M
N
0 5 10 15 20 25 30-0.5
0
0.5Base shear for mode A2 at 0.68Hz
t/min
V/M
N

Saturday, December 19, 2015Total number of words: 6515
Macintosh HD:Users:jb591:Dropbox:5_DOCS_TP_DROPBOX:papers_journal:RP_performance_ES:rp_performance_ES2.doc
22
Figure 9 GPS rover antenna and sonic antenna on corner of roof parapet, location 3 of Fig. 1

Saturday, December 19, 2015Total number of words: 6515
Macintosh HD:Users:jb591:Dropbox:5_DOCS_TP_DROPBOX:papers_journal:RP_performance_ES:rp_performance_ES2.doc
23
Figure 10 East (left, ch3) and North (right, ch4) displacement signals from GPS and corresponding accelerations during storm
-100
-50
0
50
100
ch 3
(mm
)
nc1_r
-100
-50
0
50
100
ch 4
(mm
)
5330 5340 5350 5360 5370 5380 5390-10
-5
0
5
10
minutes
ch 5
(mm
/sec
2 )
5330 5340 5350 5360 5370 5380 5390-10
-5
0
5
10
minutes
ch 6
(mm
/sec
2 )

Saturday, December 19, 2015Total number of words: 6515
Macintosh HD:Users:jb591:Dropbox:5_DOCS_TP_DROPBOX:papers_journal:RP_performance_ES:rp_performance_ES2.doc
24
Figure 11 East (left, ch1, ch3) and North (right, ch2, ch4) displacement signals from GPS and corresponding accelerations during strong monsoon wind. First and second row of GPS traces are from two rovers.
-40
-20
0
20
40
ch 1
(mm
)
je_8_b_cal_rotate
-40
-20
0
20
40
ch 2
(mm
)
-40
-20
0
20
40
ch 3
(mm
)
-40
-20
0
20
40
ch 4
(mm
)
0 5 10 15 20 25 30-10
0
10
minutes
ch 5
(mm
/sec2 )
0 5 10 15 20 25 30-10
0
10
minutes
ch 6
(mm
/sec2 )

Saturday, December 19, 2015Total number of words: 6515
Macintosh HD:Users:jb591:Dropbox:5_DOCS_TP_DROPBOX:papers_journal:RP_performance_ES:rp_performance_ES2.doc
25
Figure 12 Ground absolute displacement recovered from basement accelerometer following Boxing Day (2004) earthquake
5 10 15 20 25-20
-15
-10
-5
0
5
10
15
20
B1A
mm
time /minutes since 08:57:41 26 Dec 2004
Aceh 2 Lat 3.30 Long 95.78 (915km) Ms 9.0 tremor 00:58:50 26/12/04 GMT