lateef akanji - spe-uk.org · pdf filekey variables examined include: gas lift gas injection...
TRANSCRIPT

Lateef Akanji

2
Introduction Conceptual gas lift design Variables
Pressure GLGIR Water cut
Results Conclusion
2

Long string High PI High BHFP Excessive water production
Short string Low PI Low BHFP Excessive water production
Artificial lift is critical in maximising oil production within the limits of the facility where the rates are constrained by pressure excessive water production available lift gas
3

Key variables examined include:
gas lift gas injection rate (GLGIR)
water cut
tubing sizes
erosional velocity
pressure versus rate
4

5
7199ft
85ft
7256ft
7160ft
7307ft
7506ft
8083ft
8328ft
9857ft
6
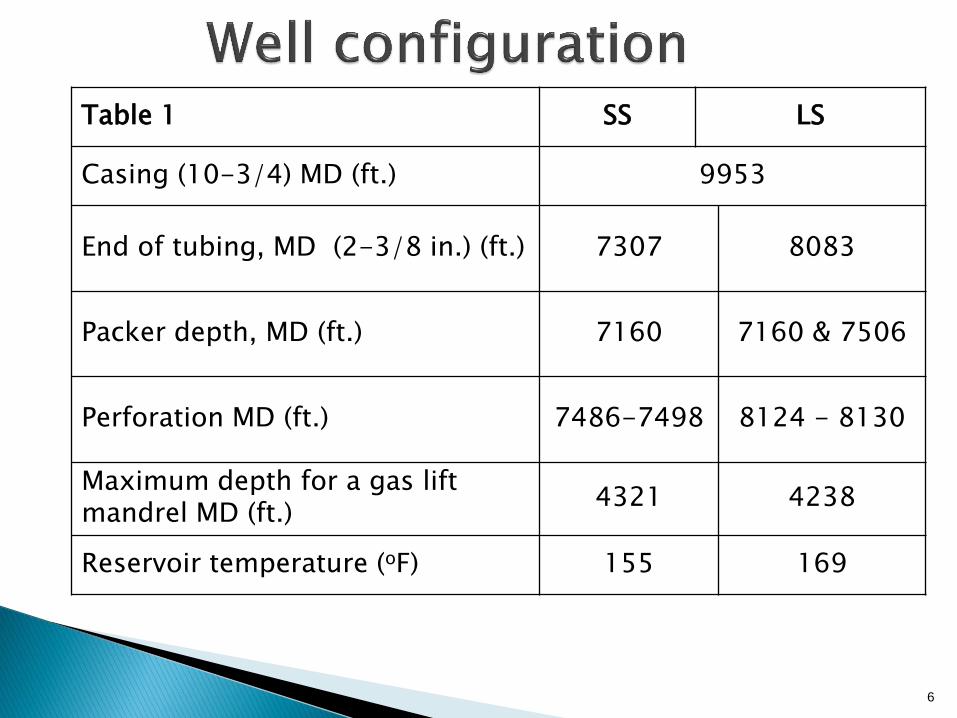
Table 1 SS LS
Casing (10-3/4) MD (ft.) 9953
End of tubing, MD (2-3/8 in.) (ft.) 7307 8083
Packer depth, MD (ft.) 7160 7160 & 7506
Perforation MD (ft.) 7486-7498 8124 - 8130
Maximum depth for a gas lift mandrel MD (ft.)
4321 4238
Reservoir temperature (oF) 155 169

Table 2: Fluid properties
Variable LS SS
oAPI gravity
g
w
20.49 0.654 1.02
24.85 0.654 1.00
Pb (psia) Water cut (%) Rp (Scf/STB) Rs (Scf/STB)
3008 50
380 380
3208 50
422
7
Table 3: Reservoir data
Variable LS SS
Static pressure (oF) 2680 2410
Temperature (oF) 169 155
Liquid, PI (J) (STB/D-psi) 3 0.45

8
Table 4: Production data
Variable LS SS
FWHT (oF) FWHP (psig) Sep. press. (psig)
100 165 48
97 135 48
Flow line length (ft.) Flow line size ID (in.)
1673 4
1673 4
Table 5: Well test data
Variable LS SS
qtotal(bbl/D) qo(bbl/D) Qw(bbl/D) qp,t
qg/qg,t(%) GLR (scf/bbl)
729 425 275 0.85 20
1169
533 324 209 533 74 357
FBHP (psia) FWHT (oF)
2423 82
2174 87

9
Table 6: Gas lift system
Variable LS SS
Pkickoff (psig) Pinj (psig) Min valve inj. ∆P (psi) Unloading grad. (psi/ft.) Unloading WHP (psig)
820 820 101
0.433 150
820 820 100
0.433 120
g,inj
qinj(MMScf/D) qmax,inj(MMScf/D) Tsurf,inj(
oF)
0.65 0.68
1 89
0.654 0.05 0.77 89

10
wfres
R
wf
R
wf
PP
qJ
P
P
P
P
q
q
2
8.02.01'
IPR equation (Vogel, 1968)

11
h
g
v
D
Mfq c
m
m
m
Lm
2
109652.2h
P 144
2
511
22
LgLLm HH 1
Tubing correlation, (Hagedorn and Brown, 1965)
12
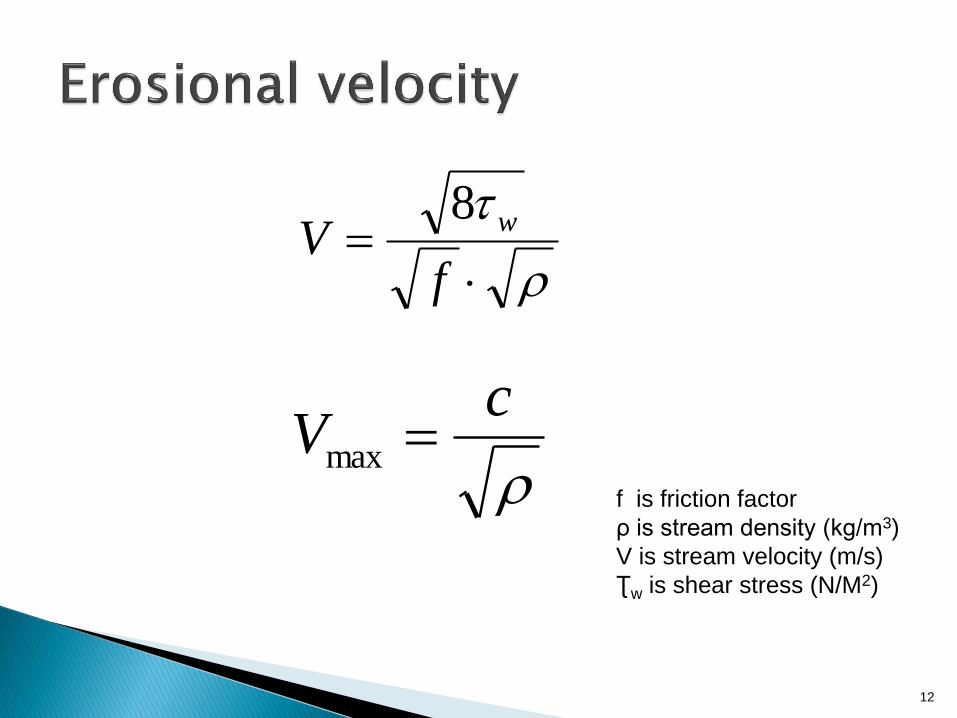
fV
w8
f is friction factor
ρ is stream density (kg/m3)
V is stream velocity (m/s)
Ʈw is shear stress (N/M2)
cV max

13
wwwo f+) f-(1 = l
wowo f)-(+= l
fw is water cut

14
0
150
300
450
0
2.5
5
7.5
10
0 1000 2000 3000
Oil Viscosity (cp)
GOR (scf/STB)
Fig. 1: PVT plots showing the variation of μo and Rs

15
200
400
600
0.2 0.6 1
Oil r
ate
ST
B/D
Gaslift gas injection rate (MMScf/D)
2.38" 2.88" 3.5"
Tubing sizes
Fig. 2: Typical oil rate versus GLGIR for varying tubing sizes of 2-3/8”, 2-7/8”, 3-1/2”

16
10
110
210
310
0 0.5 1 1.5
Gaslift gas injection rate (MMScf/D)
WC = 0%
WC = 10%
WC = 50%
WC = 80%
Oil r
ate
ST
B/D
Fig. 3: Typical oil rate versus GLGIR at different water-cuts and 2-3/8” tubing. The optimal value is indicated by the arrow.

Heavier gas requires Lower surface pressure
Higher injection rate per barrel of fluid lifted
Higher compression horsepower
17
Table 7: Summary of the sensitivity on well A2 performance
GLGIR (MMScf/day) Water-cut (%) Tubing size ID
(inches)
SS LS SS LS SS LS
0.05 0.4 0 0 2
0.4125 0.7 10 10 2 3/8 2 3/8
0.775 0.85 50 50 3 2 7/8
1.1375 1.0 80 77.5 3 ½ 3 ½
1.5 100 100

18
Table 8: Sensitivity on well A2 performance SS
Water cut (%) 0 10 50 80
Liquid rate (STB/day) 378.6 375.0 340.3 281.1
Oil rate (STB/day) 378.6 337.5 170.1 56.2
Pressure (psig) 1499.9 1525.3 1670.5 1832.7
Table 9: Sensitivity on well A2 performance LS
Water cut (%) 10 50
Liquid rate (STB/day) 813.8 425.6
Oil rate (STB/day) 732.4 263.8
Pressure (psig) 2520 2570

19
Liquid rate (STB/D)
Pre
ssure
(psig
)
Liquid rate (STB/D)
Fig. 4: IPR/VLP plots for SS at 10% WC Fig. 5: IPR/VLP plots for SS at 50% WC

20
Liquid rate (STB/D)
Pre
ssure
(psig
)
Liquid rate (STB/D)
Fig. 6: IPR/VLP plots for LS at 10% WC for tubing sizes of 2-3/8”, 2-7/8”, 3-1/2”; the green marks indicate erosional velocity limits
Fig. 7: IPR/VLP plots for LS at 50% WC tubing sizes of 2-3/8”, 2-7/8”, 3-1/2”; the green marks indicate erosional velocity limits

21
0
500
1000
1500
2000
2500
3000
0 100 200 300 400 500 600 700 800
Pre
ssure
(p
sig
)
Oil rate (STB/D)
VLP curve (Optimal)
IPR curve (optimal)
VLP curve (current)
IPR curve (current)
Fig. 8: Performance plots comparison; current and optimal, for the SS
0
1000
2000
3000
4000
5000
6000
0 1000 2000 3000 4000 5000
Pre
ssure
(p
sig
)
Oil rate (STB/D)
IPR curve (Optimal)
VLP curve (Optimal)
IPR curve (current)
VLP curve (current)
Fig. 9: Performance plots comparison; current and optimal, for the LS
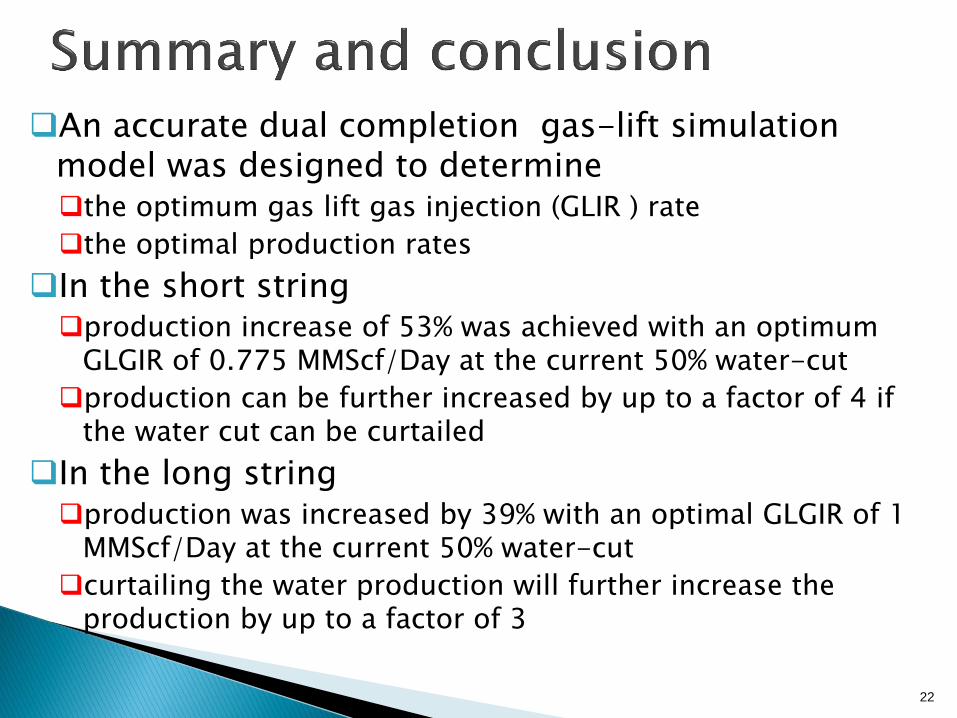
An accurate dual completion gas-lift simulation model was designed to determine the optimum gas lift gas injection (GLIR ) rate
the optimal production rates
In the short string production increase of 53% was achieved with an optimum
GLGIR of 0.775 MMScf/Day at the current 50% water-cut
production can be further increased by up to a factor of 4 if the water cut can be curtailed
In the long string production was increased by 39% with an optimal GLGIR of 1
MMScf/Day at the current 50% water-cut
curtailing the water production will further increase the production by up to a factor of 3
22

Incorporate the effects of well instabilities associated with casing heading
density wave oscillation
dynamic mixing (reservoir fluid/ injected gas)
Smart gas lift design automatic gas lift mandrel positioning
variable intelligent port size
23

A. Hagedorn and K. Brown, “Experimental Study of Pressure Gradients Occurring During Continuous Two-Phase Flow in Small Diameter Vertical Conduits.” Journal of Petroleum Technology Volume 17, Number 4, pages 475-484, (1965).
J. V. Vogel, “Inflow performance relationships for solution gas drive wells. Journal of Petroleum Technology.” Volume 20, Number 1 pages 83-92 (1968).
Petroleum Experts Prosper Manual. (2010). Single Well Systems Analysis, Version 11.5.
24

PTRG
PETEX
25

THANK YOU
26