late or no prenatal care - child trends · source: centers for disease control and prevention, ......
TRANSCRIPT

Late or No Prenatal Care
Updated: December 2015

Late or No Prenatal Care December 2015
2 | P a g e
Although there was substantial improvement on this measure in the 1990s for all
races, black, Hispanic, and Native American mothers are still more than twice as
likely as white mothers to receive either late or no prenatal care.
Importance
Prenatal visits are important for the health of both infant and mother. Health care providers can educate
mothers on important health issues, such as their diet and nutrition, exercise, immunizations, weight gain,
and abstaining from drugs and alcohol. Health professionals also have an opportunity to instruct expecting
parents on nutrition for their newborn, the benefits of breastfeeding, and injury and illness prevention, as well
as monitor for health-compromising conditions, and help them prepare for the new emotional challenges of
caring for an infant.1
Mothers who receive late (defined as beginning in the third trimester of pregnancy) or no prenatal care are
more likely to have babies with health problems. Mothers who do not receive prenatal care are three times
more likely to give birth to a low-weight baby, and their baby is five times more likely to die.2 However, some
health researchers have concerns about the value of prenatal care as an indicator. Women who seek
prenatal care are more likely to have higher incomes and intended pregnancies, which makes it difficult to
measure the unique effects of prenatal care.3 Prenatal care does not always address, and may not be as
effective among, women with specific social and medical risks.4 Adequacy of care (defined by the frequency
and timing of visits), however, has been correlated with positive outcomes and may also confer benefits
such as reduced likelihood of post-partum depression and infant injuries.5

Late or No Prenatal Care December 2015
3 | P a g e
Trends With the exception of a period during the 1980s, in general there has been a positive downward trend in this
indicator since the 1970s. The percentage of births where the mother received late or no prenatal care
dropped by more than a third from 1989 to 2003, from six to four percent. Between 2003 and 2006 there
was little apparent change, until an increase in 2007; however, comparisons are complicated by the states’
transition to a revised birth certificate, a process which began in 2003 and was still not completed as of 2014
(see Definition section). Consequently, nationwide year-to-year comparisons are problematic, and not
possible at all between 2006 and 2007. (Figure 1)
7.9
6.0
5.1
5.6
6.4
4.4
3.9 3.6
3.5
3.6
7.1
6.0 6.0
0
2
4
6
8
10
1969 1972 1975 1978 1981 1984 1987 1990 1993 1996 1999 2002 2005 2008 2011 2014
Pe
rce
nt
Percentage of Births to Mothers Receiving Late or No
Prenatal Care, Selected Years: 1970-2014*
Births in all States
Births in states using the 1989 birth certificate revision
Births in states using the 2003 birth certificate revision
Data for 2004-2006 and 2014: National Center for Health Statistics, National Vital Statistics System, VitalStats. http://205.207.175.93/VitalStats/TableViewer/tableView.aspx?ReportId=15101Data for 2007-2013: National Center for Health Statistics, CDC WONDER. http://wonder.cdc.gov/controller/datarequest/D27
Figure 1
*Note: Data for 2003 -2006 include only those jurisdictions using the 1989 revision of the birth certificate. Data for 2007 forward include only those jurisdictions using the 2003 revision of the birth certificate. More details are available in the notes to Appendix 1.Sources: Data for 1970-1999: Eberhart MS, Ingram DD, Makuc DM, et al. Urban and Rural Health Chartbook Health, United States, 2001. Hyattsville, Maryland: National Center for Health Statistics. 2001: Table 6; Data for 2000:Martin JA, Hamilton BE, Ventura SJ, Menacker F, Park MM. Births: Final Data for 2000. National Vital Statistics Reports; vol 50 no. 5. Hyattsville, Maryland: National Center for Health Statistics. 2002.; Data fo r 2001: Martin JA, Hamilton BE, Ventura SJ, Menacker F, Park MM, Sutton PD. Births: Final data for 2001. National vital statistics reports; vol 51 no.2. Hyattsville, Maryland: National Center for Health Statistics. 2002. Tables 24, 25 and 33. Data for 2002 from: Martin JA, Hamilton BE, Sutton PD. Ventura SJ. Menacker F. Munson, ML. Births: Final Data for 2002. National vital statistics reports; vol 52 no 10. Hyattsville, Maryland: National Center for Health Statistics. 2003. Tables 24, 25, and 33. Data for 2003: Martin JA, Hamilton BE, Sutton PD, et al. (2005). "Births: Final data for 2003. " National Vital Statistics Reports, 54(2). Hyattsville, MD: National Center for Health Statistics. Tables 24, 25, and 33. http://www.cdc.gov/nchs/data/nvsr/nvsr54/nvsr54_02.pdf.

Late or No Prenatal Care December 2015
4 | P a g e
Differences by Race and Hispanic Origin6 In 2014, American Indian and Alaska Native women were the most likely to receive late or no prenatal care
(11 percent of births), followed by black (10 percent) and Hispanic women (eight percent). In contrast, only
six percent of 2014 births among Asian or Pacific Islander women, and four percent of births among white
women, were births where the mother received late or no prenatal care. (Figure 2)
There is substantial variation in prenatal care receipt by subgroups within both the Hispanic and
Asian/Pacific Islander
categories. Among
Hispanics in 2014, the
percentage of women
receiving late or no
prenatal care ranged
between three percent
for mothers of Cuban
origin, to six percent for
mothers of Puerto Rican
origin, eight percent for
mothers of Mexican
origin, and nine percent
for mothers of Central
or South American origin. Similarly, among Asian or Pacific Islander women in 2014, those receiving late or
no prenatal care ranged between four percent of births (among mothers of Japanese origin), and nine
percent of births (for mothers of Hawaiian or part-Hawaiian origin).a (Appendix 1)
Differences by Age Young women in their teens are by far the least likely to receive timely prenatal care. In 2014, 25 percent of
births to females under age 15, and 10 percent of births to teens ages 15 to 19, were to those receiving late
or no prenatal care. This
proportion drops with
increasing age, reaching
a low of 4.5 percent for
women in their thirties,
and then increases
a Data from Hawaii were not available for 2014, so this figure refers only to those Native Hawaiians living outside of the
state.
4.3
9.7
7.5
5.7
10.8
0
5
10
15
Non-Hispanic white Non-Hispanic black Hispanic Asian or Pacific Islander American Indian or
Alaska Native
Pe
rce
nt
Percentage of Mothers Receiving Late or No Prenatal
Care, by Race and Hispanic Origin: 2014*
*Note: Data exclude those jurisdictions using the 1989 revision of the birth certificate (4 states,
representing 4 percent of births) .
Source: Centers for Disease Control and Prevention, National Center for Health Statistics.
VitalStats online tool. Available at http://www.cdc.gov/nchs/vitalstats.htm.
Figure 2
24.6
10.4
7.8
5.64.5 4.6 5.3
0
5
10
15
20
25
30
Under 15 years 15-19 years 20-24 years 25-29 years 30-34 years 35-39 years 40 years andover
Pe
rce
nt
Percentage of Births to Mothers Receiving Late or No
Prenatal Care, by Age of Mother: 2014*
Figure 3
Source: Centers for Disease Control and Prevention, National Center for Health Statistics. VitalStats online
tool. Available at http://www.cdc.gov/nchs/vitalstats.htm.
*Note: Data exclude those jurisdictions using the 1989 revision of the birth certificate (4 states, representing 4 percent of births).

Late or No Prenatal Care December 2015
5 | P a g e
slightly to 5.3 percent among older women. (Figure 3)
State and Local Estimates Estimates of the percentage of births to mothers who received late or no prenatal for 2003-2013 are
available for all states and the 50 largest U.S. cities at the KIDS COUNT Data Center:
http://datacenter.kidscount.org/data#USA/2/27/28

Late or No Prenatal Care December 2015
6 | P a g e
International Estimates The most recent estimates of the percentage of women who received prenatal care at least once during
pregnancy are available from UNICEF at http://data.unicef.org/maternal-health/antenatal-care.html.
National Goals The Healthy People 2020 initiative has set a goal of increasing the proportion of pregnant women who
receive care in the first trimester from 71 percent in 2007 to 78 percent in 2020, as well as a goal to increase
the proportion of pregnant women who receive early and adequate prenatal care from 70.5 percent in 2007
to 77.6 percent in 2020.
More information is available at:
http://www.healthypeople.gov/2020/topics-objectives/topic/maternal-infant-and-child-health/objectives (goal
MICH 10)
Related Indicators Mothers Who Smoke While Pregnant: www.childtrends.org/?indicators=mothers-who-smoke-while-
pregnant
Low and Very Low Birthweight Infants: www.childtrends.org/?indicators=low-and-very-low-
birthweight-infants
Unintended Births: www.childtrends.org/?indicators=unintended-births
Infant, Child, and Teen Mortality: www.childtrends.org/?indicators=infant-child-and-teen-mortality
Definition Late or no prenatal care is calculated as the percentage of births that occur to mothers who, on their child’s
birth certificate, reported receiving prenatal care only in the third trimester of their pregnancy, or reported
receiving no prenatal care. Beginning in 2003, states and other jurisdictions began adopting a new revision
of the standard birth certificate, and the last states transitioned in 2014. National data for years prior to 2003
are not strictly comparable with data for subsequent years, because the 1989 revision asks for the month
that prenatal care began, while the 2003 revision asks for the date of the first prenatal visit.
Because of this inconsistency, data from states using different versions of the birth certificate are not
comparable. Data through 2006 reflect only those jurisdictions which had not yet adopted the 2003
Late or No Prenatal Care December 2015
7 | P a g e
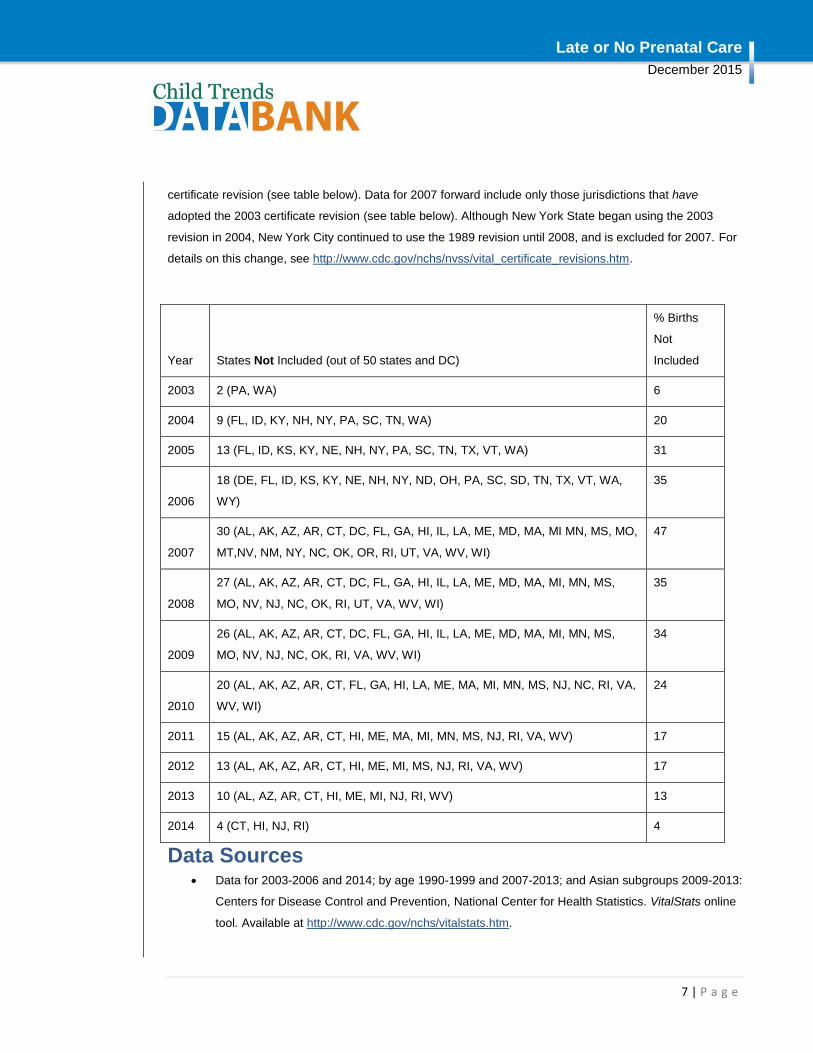
certificate revision (see table below). Data for 2007 forward include only those jurisdictions that have
adopted the 2003 certificate revision (see table below). Although New York State began using the 2003
revision in 2004, New York City continued to use the 1989 revision until 2008, and is excluded for 2007. For
details on this change, see http://www.cdc.gov/nchs/nvss/vital_certificate_revisions.htm.
Year States Not Included (out of 50 states and DC)
% Births
Not
Included
2003 2 (PA, WA) 6
2004 9 (FL, ID, KY, NH, NY, PA, SC, TN, WA) 20
2005 13 (FL, ID, KS, KY, NE, NH, NY, PA, SC, TN, TX, VT, WA) 31
2006
18 (DE, FL, ID, KS, KY, NE, NH, NY, ND, OH, PA, SC, SD, TN, TX, VT, WA,
WY)
35
2007
30 (AL, AK, AZ, AR, CT, DC, FL, GA, HI, IL, LA, ME, MD, MA, MI MN, MS, MO,
MT,NV, NM, NY, NC, OK, OR, RI, UT, VA, WV, WI)
47
2008
27 (AL, AK, AZ, AR, CT, DC, FL, GA, HI, IL, LA, ME, MD, MA, MI, MN, MS,
MO, NV, NJ, NC, OK, RI, UT, VA, WV, WI)
35
2009
26 (AL, AK, AZ, AR, CT, DC, FL, GA, HI, IL, LA, ME, MD, MA, MI, MN, MS,
MO, NV, NJ, NC, OK, RI, VA, WV, WI)
34
2010
20 (AL, AK, AZ, AR, CT, FL, GA, HI, LA, ME, MA, MI, MN, MS, NJ, NC, RI, VA,
WV, WI)
24
2011 15 (AL, AK, AZ, AR, CT, HI, ME, MA, MI, MN, MS, NJ, RI, VA, WV) 17
2012 13 (AL, AK, AZ, AR, CT, HI, ME, MI, MS, NJ, RI, VA, WV) 17
2013 10 (AL, AZ, AR, CT, HI, ME, MI, NJ, RI, WV) 13
2014 4 (CT, HI, NJ, RI) 4
Data Sources Data for 2003-2006 and 2014; by age 1990-1999 and 2007-2013; and Asian subgroups 2009-2013:
Centers for Disease Control and Prevention, National Center for Health Statistics. VitalStats online
tool. Available at http://www.cdc.gov/nchs/vitalstats.htm.

Late or No Prenatal Care December 2015
8 | P a g e
All other data for 2007-2013: National Center for Health Statistics, CDC WONDER online tool.
Available at: http://wonder.cdc.gov/natality-current.html
Data for 2002: Martin, J. A., Hamilton, B. E., Sutton, P. D., Ventura, S. J., Menacker, F., Munson,
M,L. (2003). Births: Final data for 2002. National Vital Statistics Reports, 52 (10). Hyattsville,
Maryland: National Center for Health Statistics. Tables 24, 25, and 33. Available at:
http://www.cdc.gov/nchs/data/nvsr/nvsr52/nvsr52_10.pdf
Data for 2001: Martin, J. A., Hamilton, B. E., Ventura, S.J., Menacker, F., Park, M. M., Sutton, P. D.
(2002) Births: Final data for 2001. National Vital Statistics Reports,51 (2). Hyattsville, Maryland:
National Center for Health Statistics. Tables 24, 25, and 33. Available at:
http://www.cdc.gov/nchs/data/nvsr/nvsr51/nvsr51_02.pdf
Data for 2000: Martin, J. A., Hamilton, B. E., Ventura, S. J., Menacker, F., Park, M. M. (2002)
Births: Final data for 2000. National Vital Statistics Reports, 50(5). Hyattsville, Maryland: National
Center for Health Statistics. Available at:
http://www.cdc.gov/nchs/data/nvsr/nvsr50/nvsr50_05.pdf
Data for 1970-1999: Eberhart, M. S., Ingram, D. D., Makuc, D. M., et al. (2001). Urban and rural
health chartbook: Health, United States, 2001. Hyattsville, Maryland: National Center for Health
Statistics. Table 6. Available at:
http://www.cdc.gov/nchs/hus/previous.htm
Raw Data Source Birth Data, National Vital Statistics System
http://www.cdc.gov/nchs/nvss.htm

Late or No Prenatal Care
December 2015
9 | P a g e
Appendix 1 - Births to Mothers Receiving Late or No Prenatal Care, as a Percentage of All Births, by Race, Hispanic Origin, and Age of Mother: Selected Years, 1970-20141
1970 1975 1980 1985 1990 1995 2000 2002 20032 20052 20062 20073 20083 20093 20103 20113 20123 20133 20143
All Births 7.9 6.0 5.1 5.7 6.1 4.2 3.9 3.6 3.5 3.5 3.6 7.1 7.0 6.6 6.2 6.0 6.0 6.1 6.0
White 6.3 5.0 4.3 4.8 4.9 3.5 3.3 3.1 3.0 3.0 3.2 6.5 6.3 5.9 5.5 5.2 5.2 5.3 5.2
Non-Hispanic White5 - - 3.5 4.0 3.4 2.5 2.3 2.2 2.1 2.2 2.3 5.0 4.8 4.5 4.3 4.3 4.3 4.4 4.3
Black 16.6 10.5 8.9 10.2 11.3 7.6 6.7 6.2 6.0 5.7 5.7 11.7 11.3 10.6 10.2 9.8 9.8 10.0 9.6
Non-Hispanic Black5 - - 9.7 10.9 11.2 7.6 6.7 6.2 6.0 5.6 5.7 11.7 11.3 10.6 10.2 9.8 9.9 10.0 9.7
Hispanic origin4,5 - - 12.0 12.4 12.0 7.4 6.3 5.5 5.3 5.1 5.0 9.3 9.2 8.8 8.1 7.5 7.5 7.6 7.5
Mexican - - 11.8 12.9 13.2 8.1 6.9 5.8 5.6 5.0 5.0 9.7 9.6 9.3 8.4 7.8 7.8 7.9 7.7
Puerto Rican - - 16.2 15.5 10.6 5.5 4.5 4.1 3.7 4.1 4.1 7.6 7.8 6.9 6.6 6.2 6.4 6.2 5.7
Cuban - - 3.9 3.7 2.8 2.1 1.4 1.3 1.3 2.5 3.2 3.4 3.3 3.4 3.2 3.2 3.3 3.5 3.4
Central and South
American - - 13.1 12.5 10.9 6.1 5.4 4.9 4.7 5.6 5.8 8.3 9.2 8.5 8.2 7.7 7.7 8.0 8.7
Other and unknown
Hispanic - - 9.2 9.4 8.5 6.0 5.9 5.3 5.4 5.6 4.9 8.9 8.5 7.9 7.5 7.2 7.2 7.5 7.0
Asian or Pacific Islander - - 6.5 6.5 5.8 4.3 3.3 3.1 3.1 3.0 3.1 4.9 5.3 4.9 5.1 5.2 5.0 5.4 5.7
Asian Indian - - - - - - - - - - - - - 4.6 4.5 4.7 4.5 4.7 4.6
Chinese 6.5 4.4 3.7 4.4 3.4 3.0 2.2 2.1 - - - - - 3.2 3.7 3.8 4.3 5.3 6.3
Japanese 4.1 2.7 2.1 3.1 2.9 2.3 1.8 2.1 - - - - - 3.2 3.2 3.3 3.2 3.2 3.5
Filipino 7.2 4.1 4.0 4.8 4.5 4.1 3.0 2.8 - - - - - 4.0 4.1 4.3 4.1 3.9 3.7
Hawaiian and part
Hawaiian - - 6.7 7.4 8.7 5.1 4.2 4.7 - - - - - 9.6 8.5 10.1 8.7 12.3 8.8
Other Asian or Pacific
Islander - - 9.3 8.2 7.1 5.0 3.8 3.5 - - - - - 6.4 6.8 6.6 6.1 6.6 6.8
American Indian or
Alaska Native 28.9 22.4 15.2 12.9 12.9 9.5 8.6 8.0 7.6 8.2 8.1 13.1 12.6 11.4 11.3 11.2 11.0 11.3 10.8

Late or No Prenatal Care
December 2015
10 | P a g e
1970 1975 1980 1985 1990 1995 2000 2002 20032 20052 20062 20073 20083 20093 20103 20113 20123 20133 20143
Age
Under 15 years - - - - 20.3 15.3 16.3 14.8 15.4 15.0 15.6 23.2 26.0 22.0 22.0 22.2 22.4 23.1 24.6
15-19 years - - - - 11.9 7.6 7.2 6.6 6.4 6.3 6.4 12.0 11.8 11.1 10.6 10.2 10.3 10.5 10.4
15-17 years - - - - - - 8.6 8.0 7.6 - - 14.1 13.4 12.7 12.5 12.2 12.2 12.6 12.7
18-19 years - - - - - - 6.4 6.0 5.6 - - 11.1 11.0 10.3 9.9 9.4 9.6 9.7 9.5
20-24 years - - - - 8.0 5.4 5.1 4.7 4.6 4.5 4.7 9.4 9.1 8.6 8.2 7.9 7.9 8.1 7.8
25-29 years - - - - 4.4 3.3 3.1 3.0 3.0 3.0 3.2 6.2 6.1 5.8 5.5 5.3 5.4 5.7 5.6
30-34 years - - - - 3.4 2.7 2.4 2.3 2.3 2.3 2.4 4.7 4.8 4.5 4.3 4.2 4.3 4.5 4.5
35-39 years - - - - 3.8 3.0 2.6 2.5 2.4 2.4 2.5 4.6 4.7 4.5 4.4 4.3 4.3 4.5 4.6
40 years and over - - - - 5.6 3.9 3.5 3.3 3.2 3.2 3.1 5.6 5.5 5.2 5.3 5.0 5.2 5.4 5.3
"-" Indicates data not available.
1Excludes live births for which trimester when prenatal care began is unknown. Data for 1970 and 1975 also exclude births that occurred in states not reporting prenatal care.
2Data are for the reporting areas that used the 1989 Revision of the U.S. Standard Certificate of Live Birth for prenatal care. Reporting areas that implemented the 2003 revision of the U.S.
Standard Certificate of Live Birth are excluded because prenatal care data based on the 2003 revision are not comparable with data based on the 1989 revision. In 2003, 48 states and DC,
representing 94 percent of births, used the 1989 revision. In 2004, 41 states and DC, representing 80 percent of births, used the 1989 revision. In 2005 it was 37 states and DC,
representing 69 percent of births. In 2006 it was 32 states and DC, representing 65 percent of births. Although New York state began using the 2003 revision in 2004, New York City
continued to use the 1989 revision, and is included in these estimates.
3Data are for the reporting areas that used the 2003 Revision of the U.S. Standard Certificate of Live Birth for prenatal care. Reporting areas that did not yet implement the 2003 revision of
the U.S. Standard Certificate of Live Birth are excluded because prenatal care data based on the 2003 revision are not comparable with data based on the 1989 revision. In 2007, 20 states,
representing 53 percent of births, were using the 2003 revision. In 2008, 24 states, representing 65 percent of births, were. In 2009, 25 states, representing 66 percent of births were using
the 2003 revision, in 2010, 30 states and DC, representing 76 percent of births, in 2011, 35 states and DC, representing 83 percent of births, in 2012, 37 states and DC, representing 83
percent of births, in 2013, 40 states and DC, representing 87 percent of all births, and, in 2014, 46 states and DC, representing 96 percent of births. Although New York state began using
the 2003 revision in 2004, New York City continued to use the 1989 revision until 2008, and is excluded for 2007.
4Persons of Hispanic origin may be of any race.

Late or No Prenatal Care
December 2015
11 | P a g e
5Trend data for Hispanics and non-Hispanics are affected by expansion of the reporting area for an Hispanic-origin item on the birth certificate and by immigration. These two factors affect
numbers of events, composition of the Hispanic population, and maternal and infant health characteristics. The number of states in the reporting area increased from 22 in 1980, to 23 and
the District of Columbia (DC) in 1985, 48 and DC in 1990, and 50 and DC in 1993 and all later years.
Sources: Data for 1970-1999: Eberhart, M. S., Ingram, D. D., Makuc, D. M., et al. (2001). Urban and rural health chartbook: Health, United States, 2001. Hyattsville, Maryland: National
Center for Health Statistics. Table 6. Available at: http://www.cdc.gov/nchs/hus/previous.htm. Data for 2000: Martin, J. A., Hamilton, B. E., Ventura, S. J., Menacker, F., Park, M. M. (2002)
Births: Final data for 2000. National Vital Statistics Reports, 50(5). Hyattsville, Maryland: National Center for Health Statistics. Available at:
http://www.cdc.gov/nchs/data/nvsr/nvsr50/nvsr50_05.pdf. Data for 2001: Martin, J. A., Hamilton, B. E., Ventura, S.J., Menacker, F., Park, M. M., Sutton, P. D. (2002) Births: Final data for
2001. National Vital Statistics Reports,51 (2). Hyattsville, Maryland: National Center for Health Statistics. Tables 24, 25, and 33. Available at:
http://www.cdc.gov/nchs/data/nvsr/nvsr51/nvsr51_02.pdf. Data for 2002: Martin, J. A., Hamilton, B. E., Sutton, P. D., Ventura, S. J., Menacker, F., Munson, M,L. (2003). Births: Final data
for 2002. National Vital Statistics Reports,52 (10). Hyattsville, Maryland: National Center for Health Statistics. Tables 24, 25, and 33. Available at:
http://www.cdc.gov/nchs/data/nvsr/nvsr52/nvsr52_10.pdf. Data for 2003-2006 and 2014; by age 1990-1999 and 2007-2011; and Asian subgroups 2009-2013: Centers for Disease Control
and Prevention, National Center for Health Statistics. VitalStats online tool. Available at http://www.cdc.gov/nchs/vitalstats.htm. All other data for 2007-2013: National Center for Health
Statistics, CDC WONDER online tool. Available at: http://wonder.cdc.gov/natality-current.html.

Late or No Prenatal Care
December 2015
12 | P a g e
Endnotes
1 Hagan, J. F., Shaw, J. S., and Duncan, P. M., Eds. (2008). Bright Futures: Guidelines for health supervision of infants,
children, and adolescents. (3rd Ed.) J. Elk Grove Village, IL: American Academy of Pediatrics Available at:
http://brightfutures.aap.org/3rd_Edition_Guidelines_and_Pocket_Guide.html
2 Maternal and Child Health Bureau, Health Resources and Services Administration, U.S. Department of Health and
Human Services. Prenatal services. http://www.mchb.hrsa.gov/programs/womeninfants/prenatal.htm
3 Logan, C., Moore, K., Manlove, J., Mincieli, L., Cottingham, S. (2007). Conceptualizing a “Strong Start”: Antecedents of
positive child outcomes at birth and Into early childhood. Child Trends Research Brief. Child Trends: Washington, D.C.
4 Alexander, G.R., Kotelchuck, M. (2001). Assessing the role and effectiveness of prenatal care: History, challenges, and
directions for future research. Public Health Reports, 116(4). 306-16.
5 Ibid.
6Hispanics may be any race. Estimates for whites and blacks in this report do not include Hispanics.