last lecture - department of electrical engineering ...yasmeen/statistics-lec03.pdf · critical...
TRANSCRIPT
LastLecture
• ImportanceofStatisticalMeasurements
• DistinguishCategoricalfromNumericalvariables
• Knowingdifferentwaysofstatisticallydescribingdata
LectureGoals
• VariabilityMeasurement– Percentiles
• Shape– Skewness,Kurtosis
• NormaldistributionoftheMean,SD
• MoreontheCentralLimitTheorem
• ConfidenceIntervals

Notations
Characteristic Population(Parameter)
Sample(Statistic)
Mean
Variance
StandardDeviation(SD)
1 1
2 ∑ ̅ 21 2 ∑ 21
∑ ̅ 21 ∑ 2
1

StatisticalDescriptionofData…contd.
• Statisticsdescribesanumericsetofdatabyits- Center- Variability- Shape
• Statisticsdescribesacategoricalsetofdataby- Frequency,percentageorproportionofeachcategory
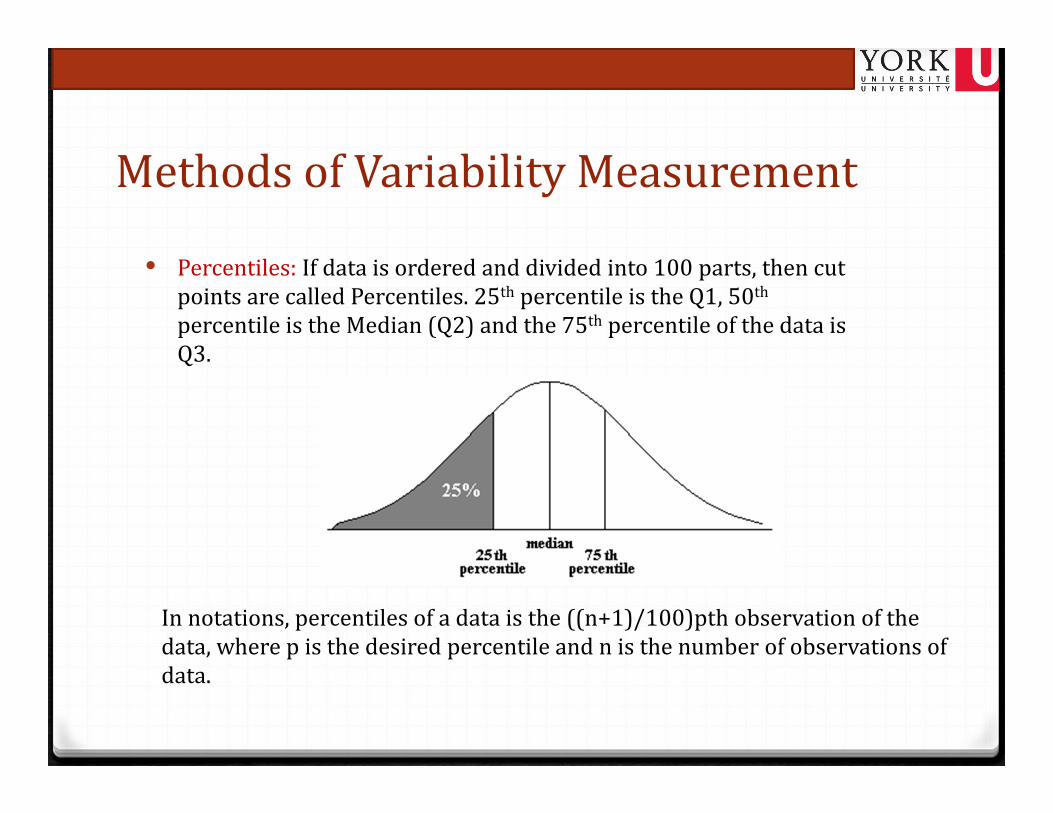
MethodsofVariability Measurement
• Percentiles:Percentiles:Ifdataisorderedanddividedinto100parts,thencutpointsarecalledPercentiles.25th percentileistheQ1,50thpercentileistheMedian(Q2)andthe75th percentileofthedataisQ3.
Innotations,percentilesofadataisthe((n+1)/100)pth observationofthedata,wherepisthedesiredpercentileandnisthenumberofobservationsofdata.
Percentiles
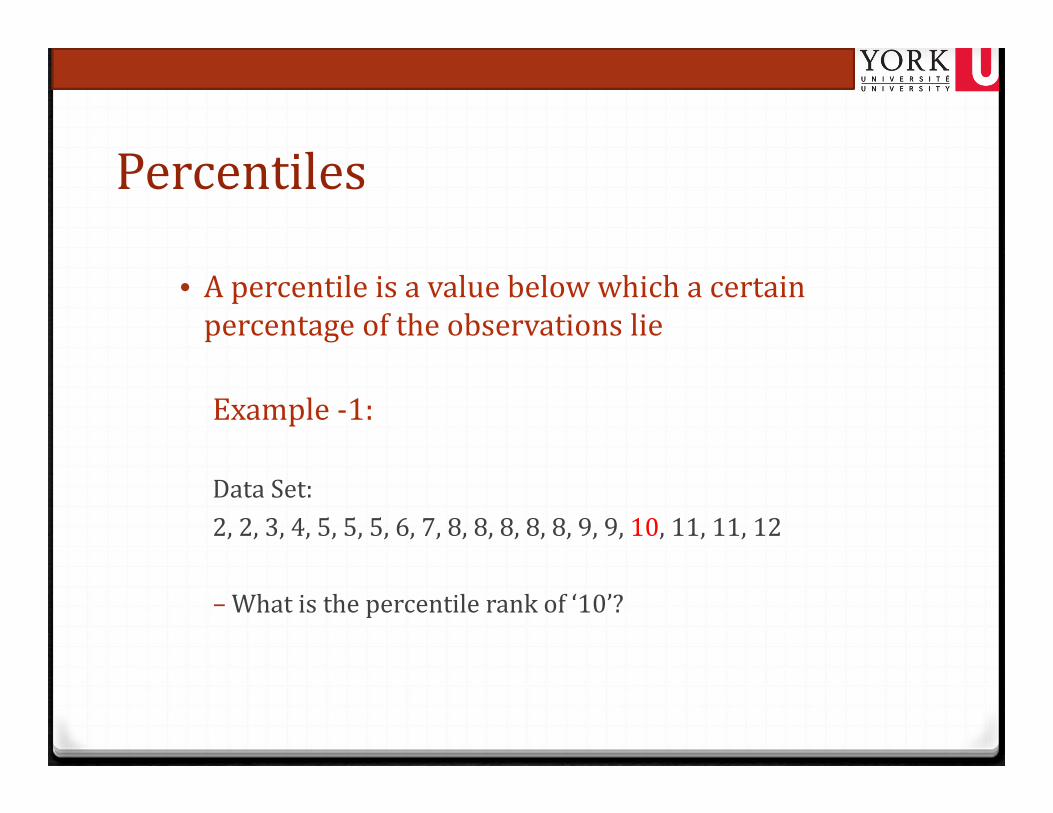
• Apercentileisavaluebelowwhichacertainpercentageoftheobservationslie
Example‐1:
DataSet:2,2,3,4,5,5,5,6,7,8,8,8,8,8,9,9,10,11,11,12
−Whatisthepercentilerankof‘10’?
Percentiles
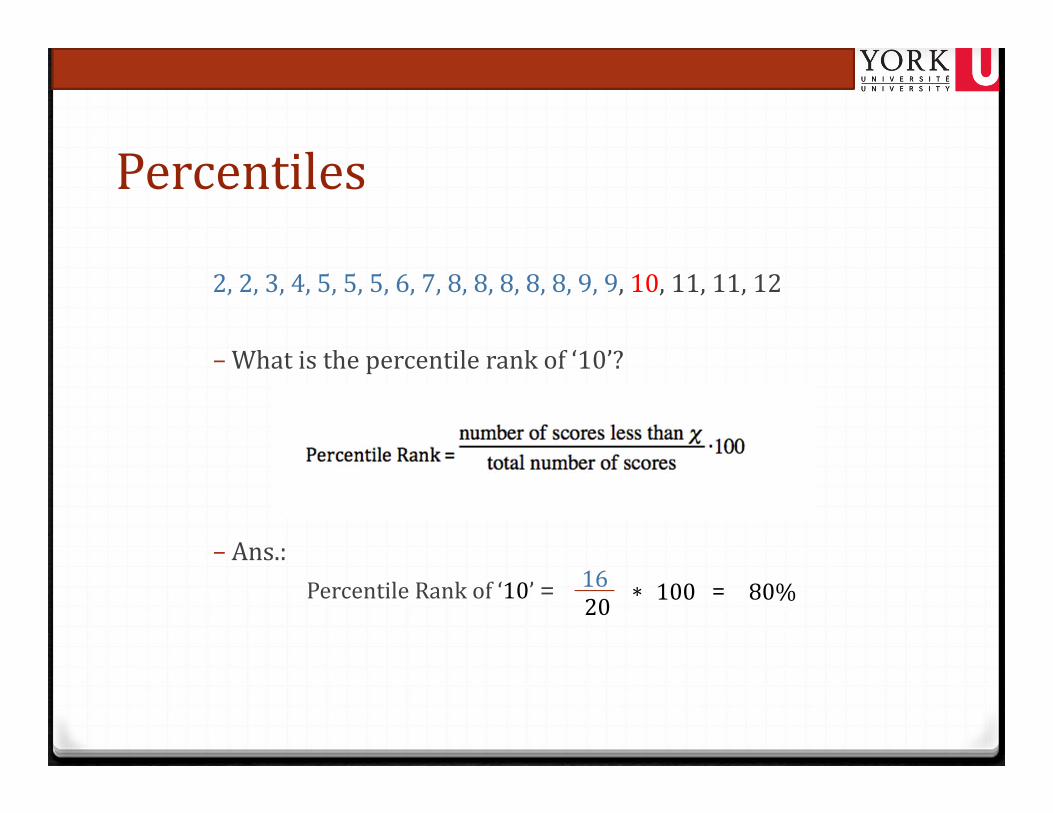
2,2,3,4,5,5,5,6,7,8,8,8,8,8,9,9,10,11,11,12
−Whatisthepercentilerankof‘10’?
− Ans.:PercentileRankof‘10’= 16
20 * 100 = 80%

Percentiles
• Example‐2:(exerciseforstudents)
DataSet:2,2,3,4,5,5,5,6,7,8,8,8,8,8,9,9,10,11,11,12
−Whatvalueexistsatthepercentilerankingof25%?(i.e.whatscorehad25ofthescoresbelowit?)

Percentiles
2,2,3,4,5,5,5,6,7,8,8,8,8,8,9,9,10,11,11,12
−Whatvalueexistsatthepercentilerankingof25%?
Value#=Percentile
100 * (n+1)

StatisticalDescriptionofData...Contd.
• Statisticsdescribesanumericsetofdatabyits- Center- Variability- Shape
• Statisticsdescribesacategoricalsetofdataby- Frequency,percentageorproportionofeachcategory
ShapeofData• Shapeofdataismeasuredby
- Skewness- Kurtosis
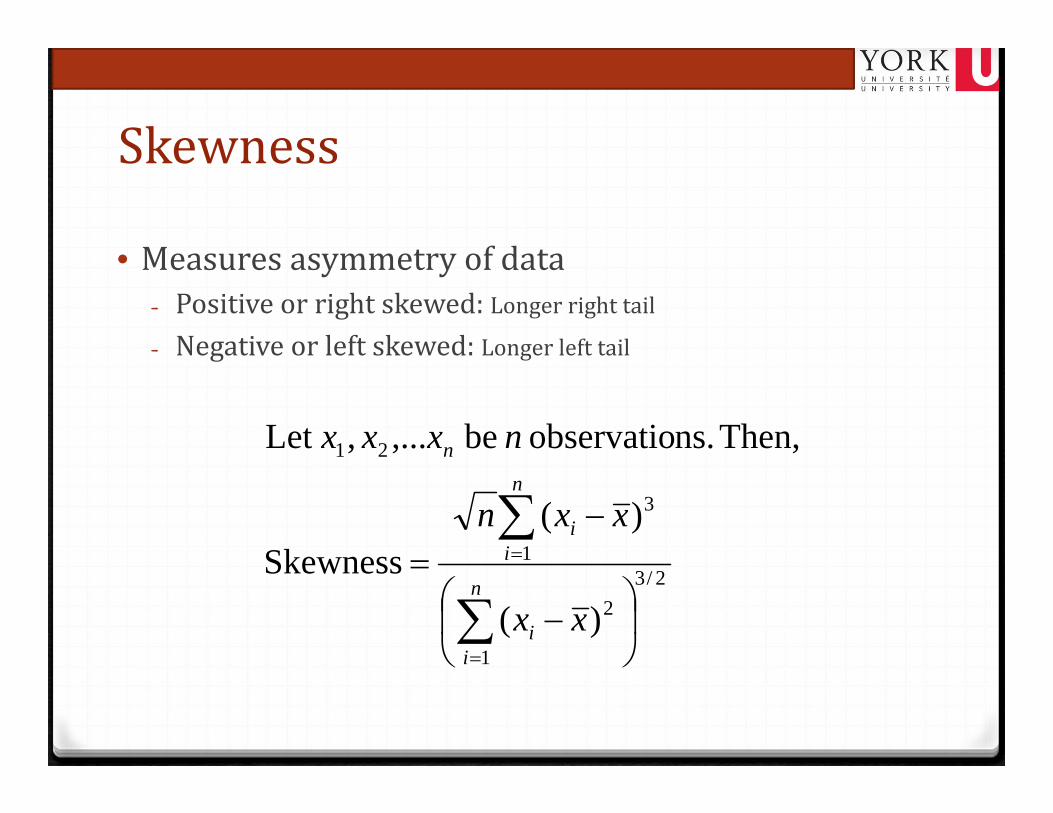
Skewness
• Measuresasymmetryofdata- Positiveorrightskewed:Longerrighttail- Negativeorleftskewed:Longerlefttail
2/3
1
2
1
3
21
)(
)(Skewness
Then, ns.observatio be ,...,Let
n
ii
n
ii
n
xx
xxn
nxxx

Kurtosis
• Measurespeakednessofthedistributionofdata.Thekurtosisofnormaldistributionis0.
3)(
)(Kurtosis
Then, ns.observatio be ,...,Let
2
1
2
1
4
21
n
ii
n
ii
n
xx
xxn
nxxx
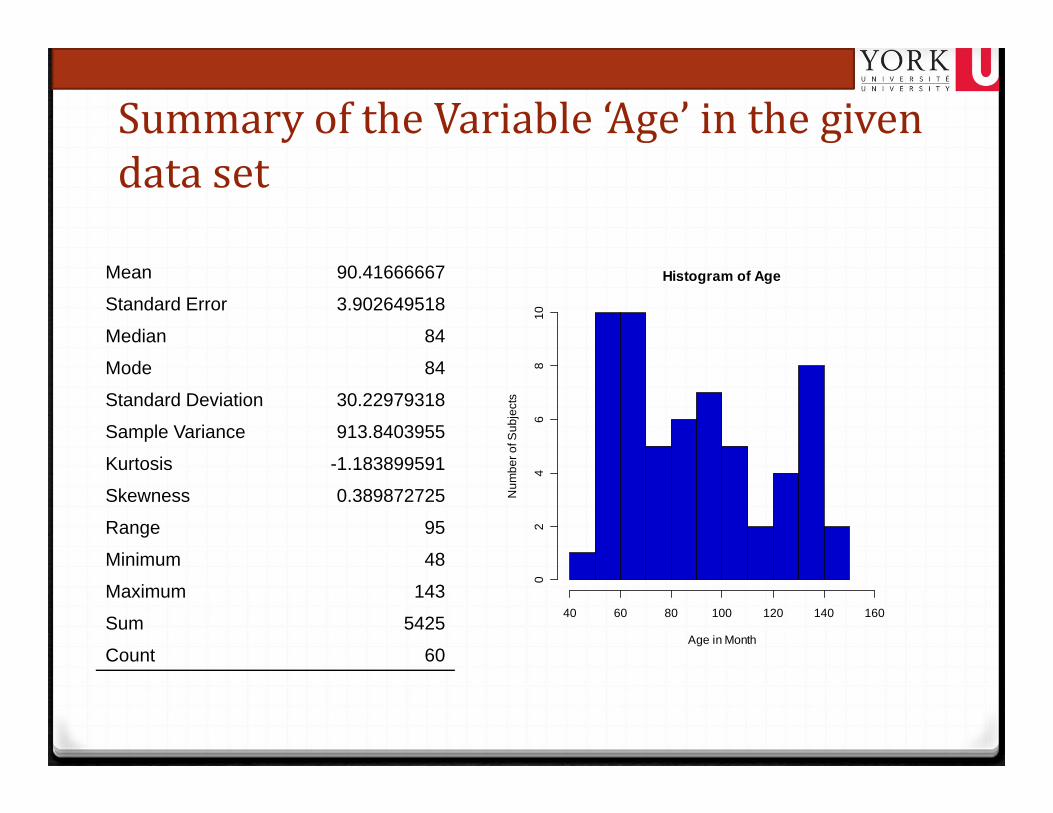
SummaryoftheVariable‘Age’inthegivendataset
Mean 90.41666667
Standard Error 3.902649518
Median 84
Mode 84
Standard Deviation 30.22979318
Sample Variance 913.8403955
Kurtosis -1.183899591
Skewness 0.389872725
Range 95
Minimum 48
Maximum 143
Sum 5425
Count 60
Histogram of Age
Age in Month
Num
ber o
f Sub
ject
s
40 60 80 100 120 140 160
02
46
810
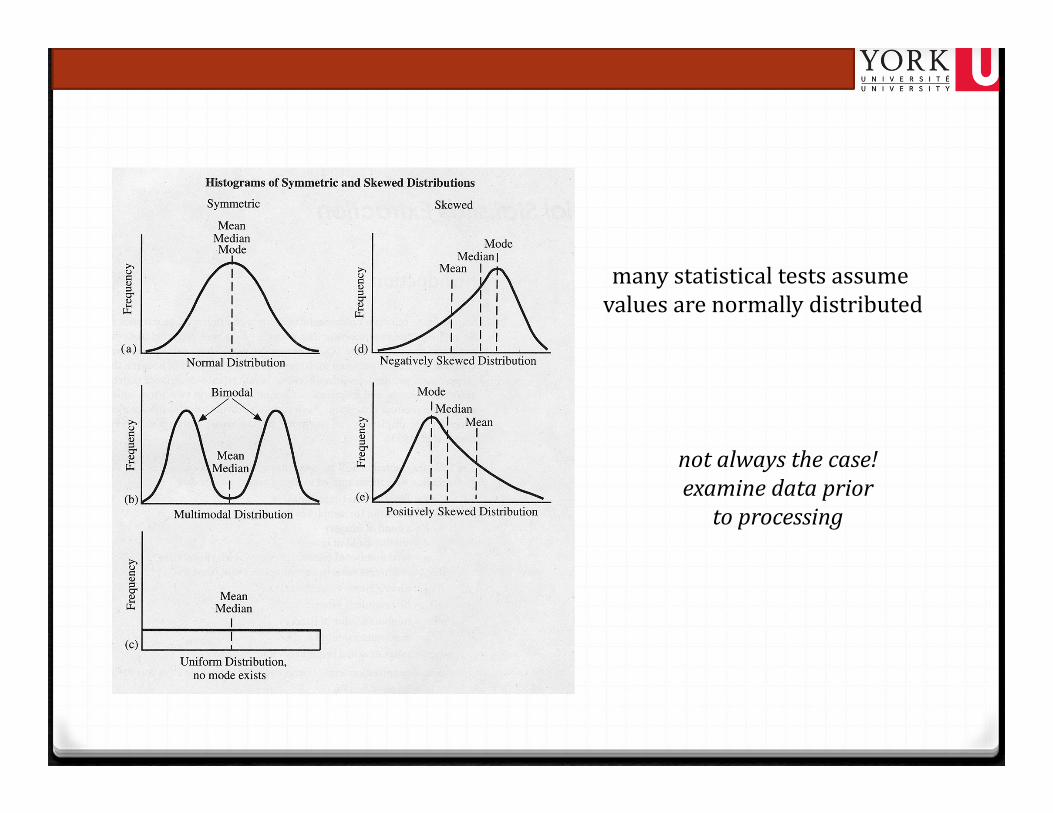
manystatisticaltestsassumevaluesarenormallydistributed
notalwaysthecase!examinedatapriortoprocessing

TheNormalDistribution

TheNormalDistribution
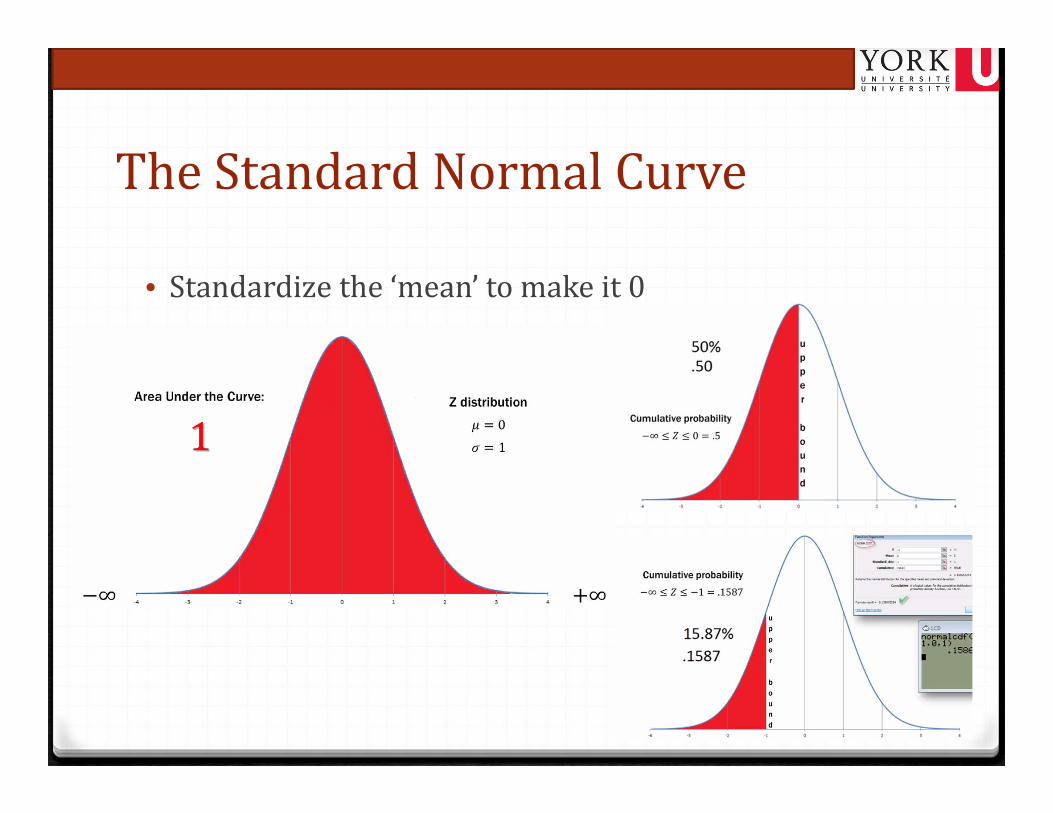
TheStandardNormalCurve
• Standardizethe‘mean’tomakeit0
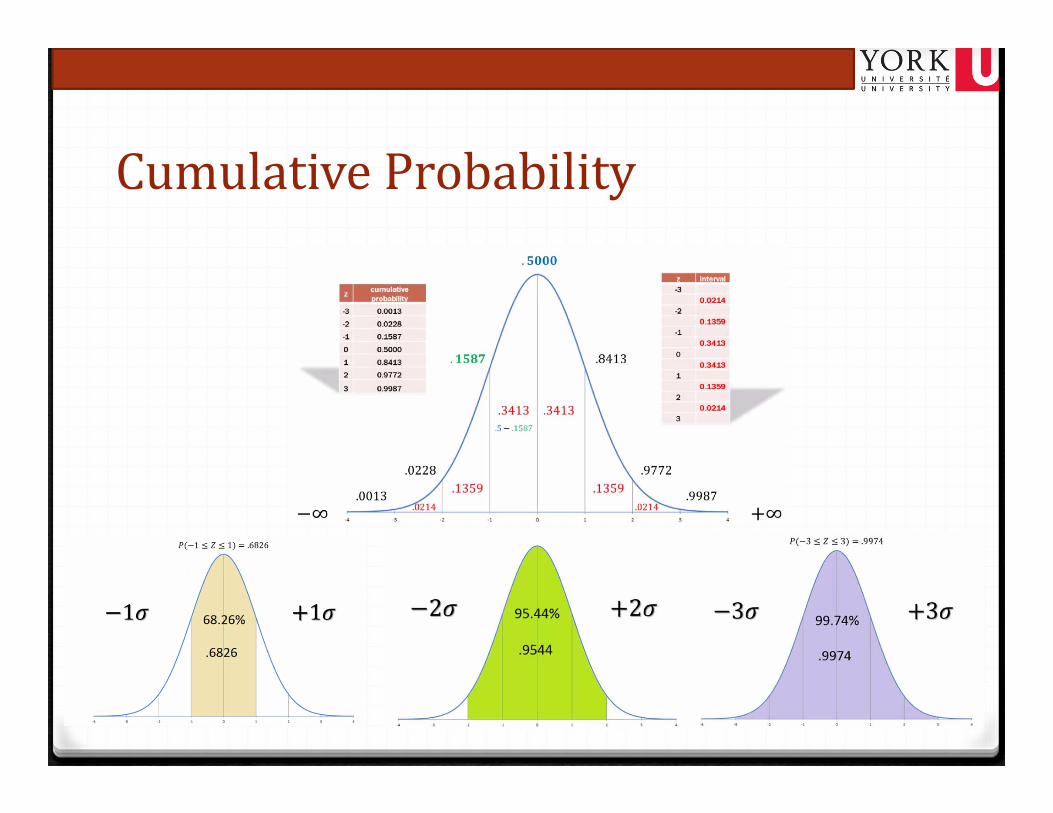
CumulativeProbability

TheEmpiricalRule
• Instatistics,the68–95–99.7rule,alsoknownasthethree‐sigmaruleorempiricalrule,statesthatnearlyallvaluesliewithinthreestandarddeviationsofthemeaninanormaldistribution.
• 68.27%ofthevaluesliewithinonestandarddeviationofthemean.

Exercise‐ 1
• Thetestscoresforaclassarenormallydistributed.Theaveragetestscoreis75andthestandarddeviationis10.Drawthedataonthenormalcurve.
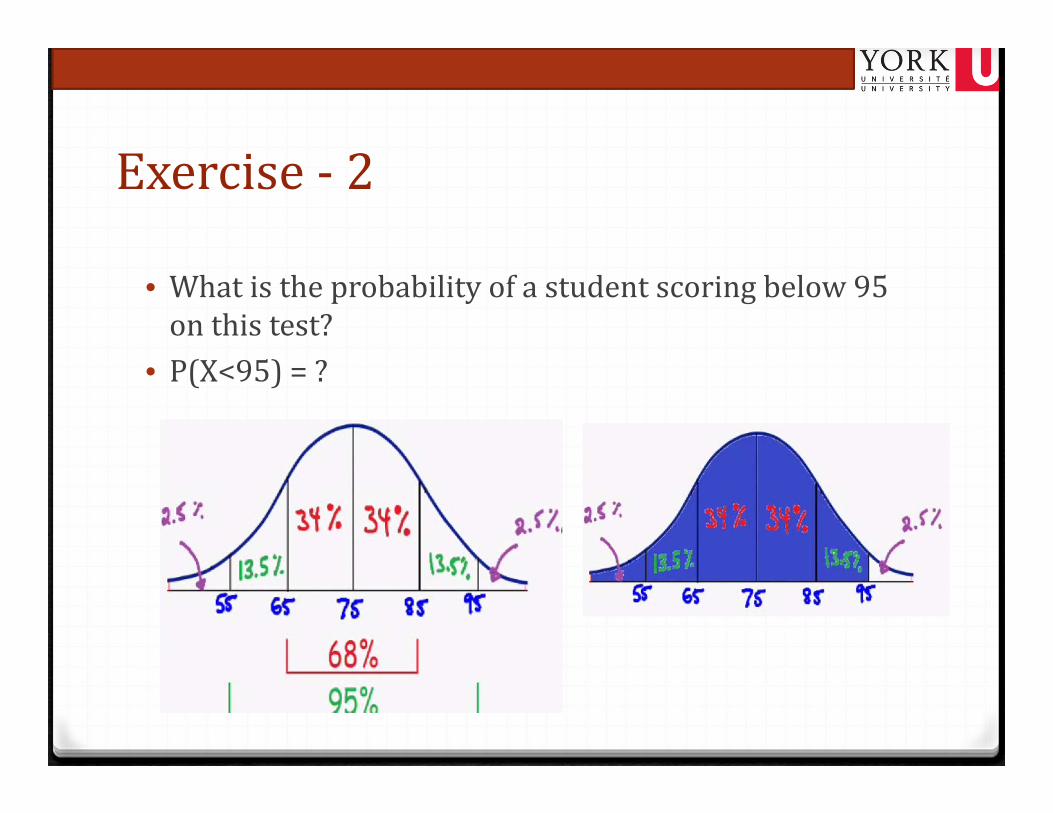
Exercise‐ 2
• Whatistheprobabilityofastudentscoringbelow95onthistest?
• P(X<95)=?
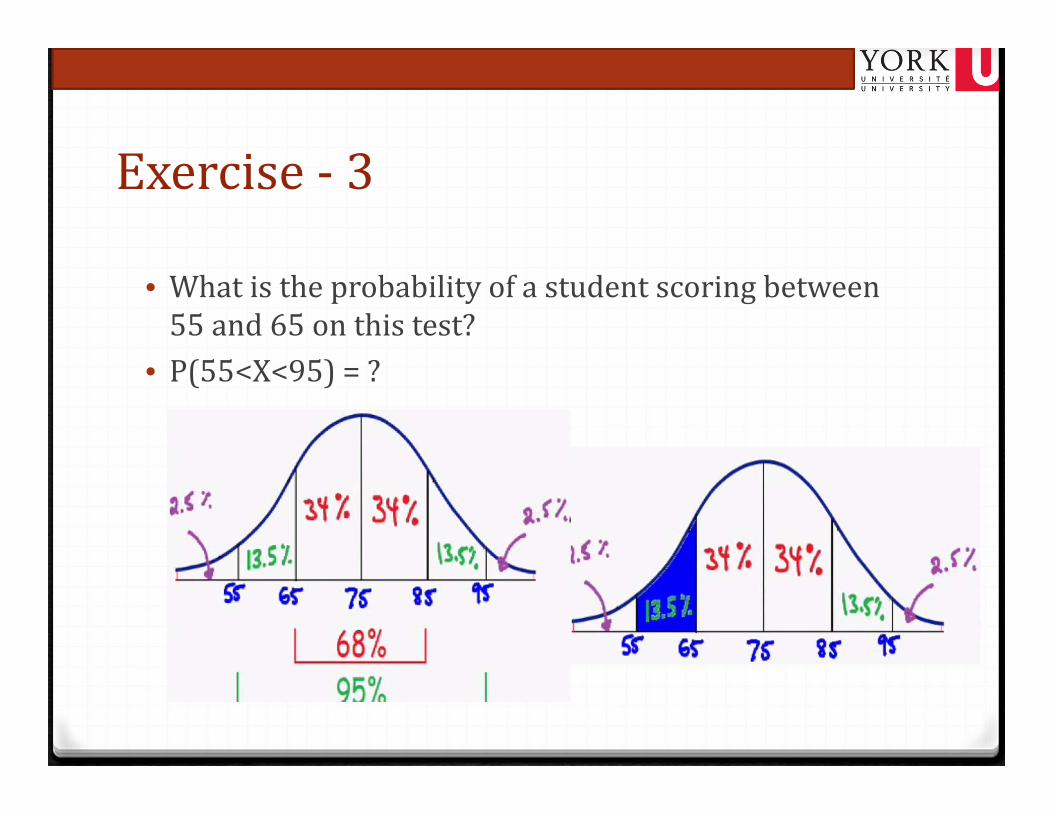
Exercise‐ 3
• Whatistheprobabilityofastudentscoringbetween55and65onthistest?
• P(55<X<95)=?

Z‐test:Exercise‐ 4
• Thetestscoresforaclassarenormallydistributed.Given, =75and =10Whatistheprobabilitythestudentscoredabovea60?
• Z‐distribution:
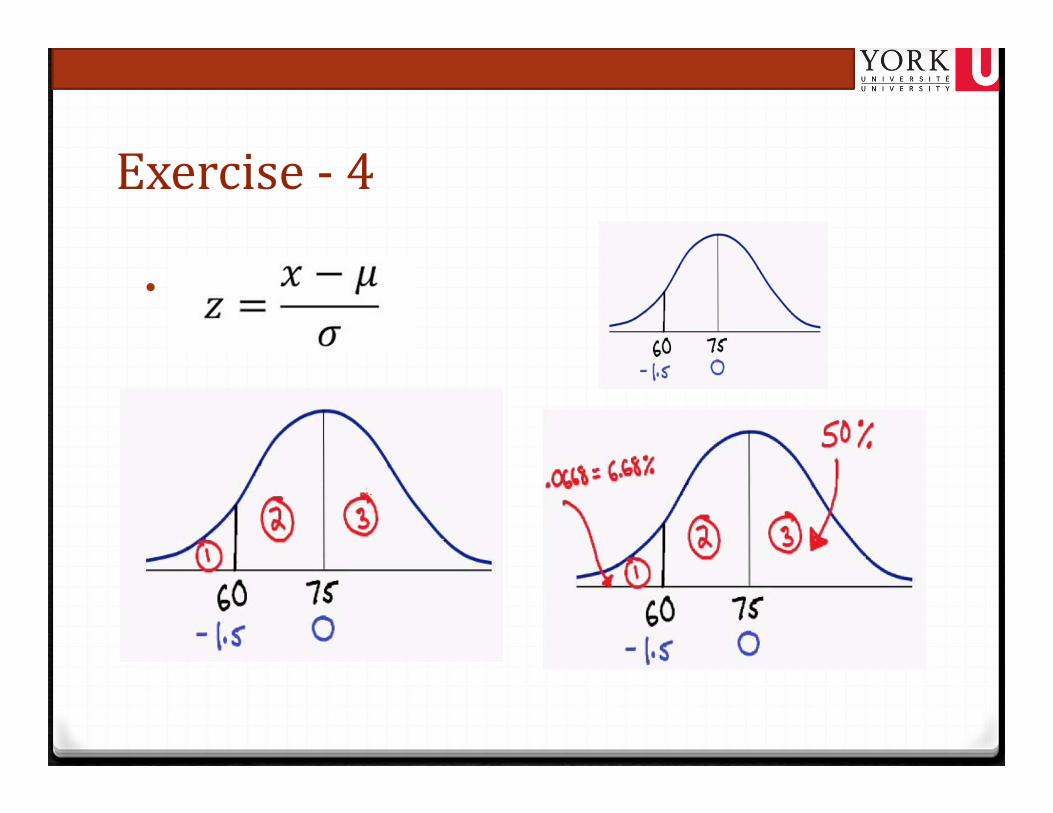
Exercise‐ 4
• Z
Z‐values
• http://medicalnights.com/table‐of‐z‐values/

T‐test:Conditions
• ThepopulationSDisunknown• Thesamplesizeislessthan30
• T‐distribution:
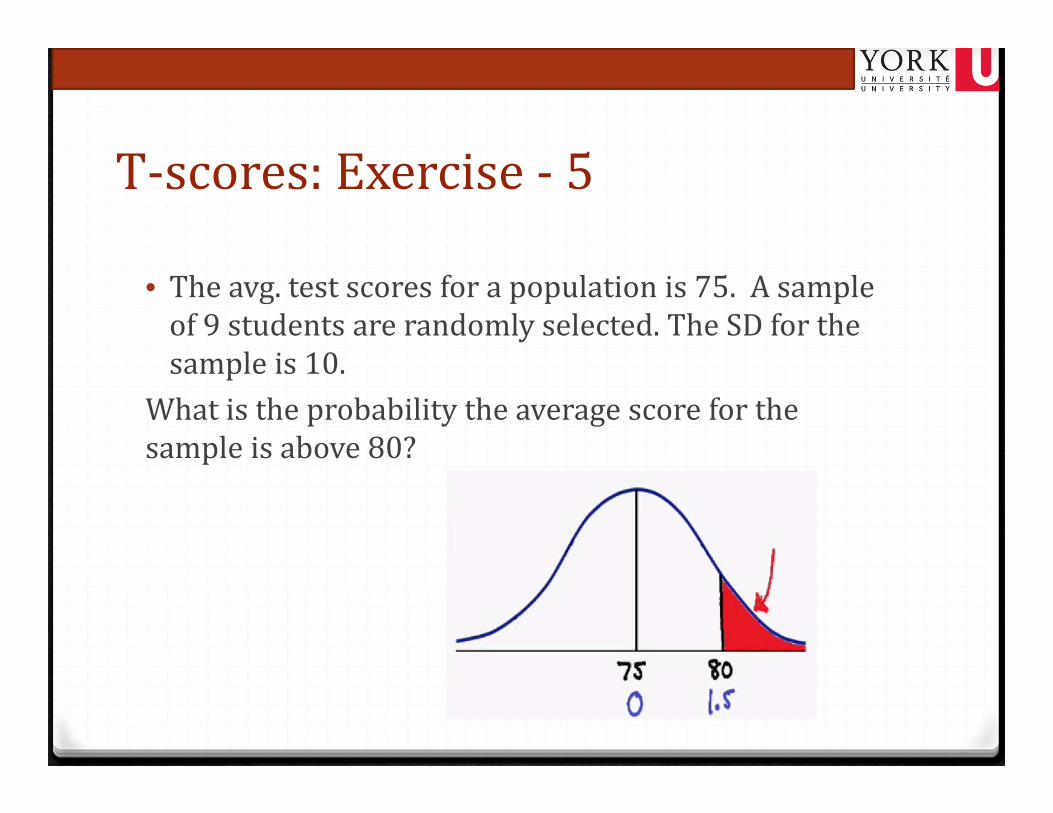
T‐scores:Exercise‐ 5
• Theavg.testscoresforapopulationis75.Asampleof9studentsarerandomlyselected.TheSDforthesampleis10.
Whatistheprobabilitytheaveragescoreforthesampleisabove80?
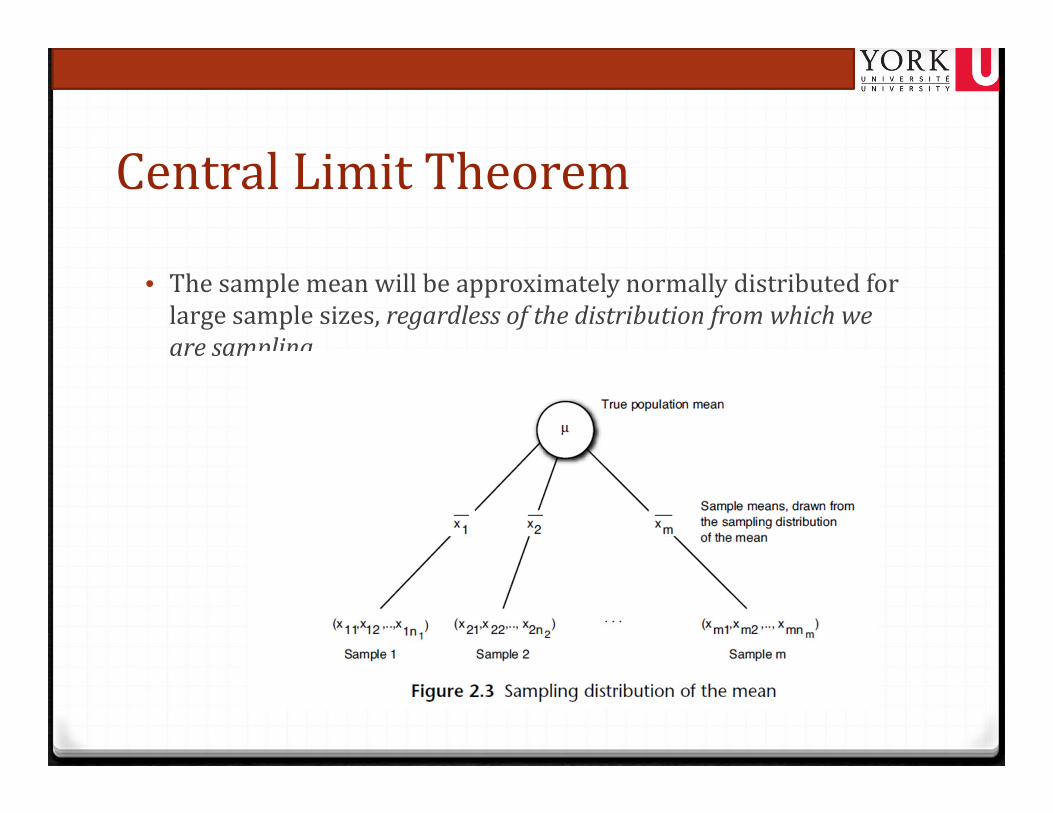
CentralLimitTheorem
• Thesamplemeanwillbeapproximatelynormallydistributedforlargesamplesizes,regardlessofthedistributionfromwhichwearesampling.
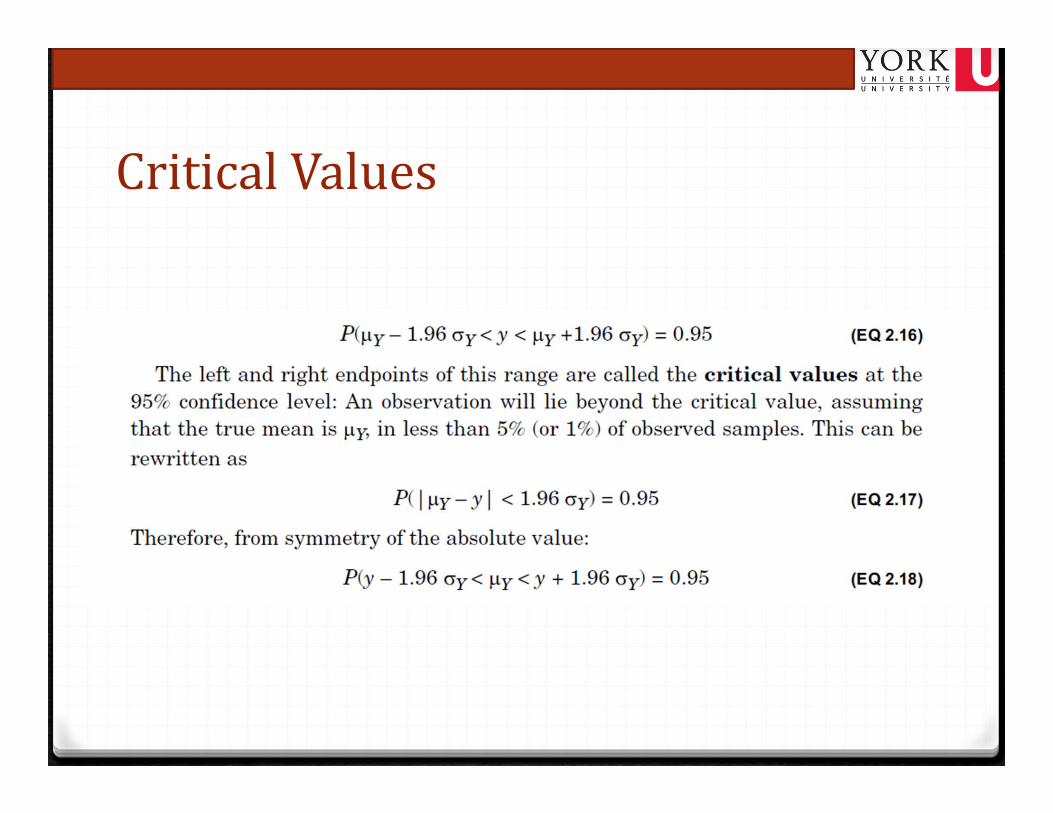
CriticalValues
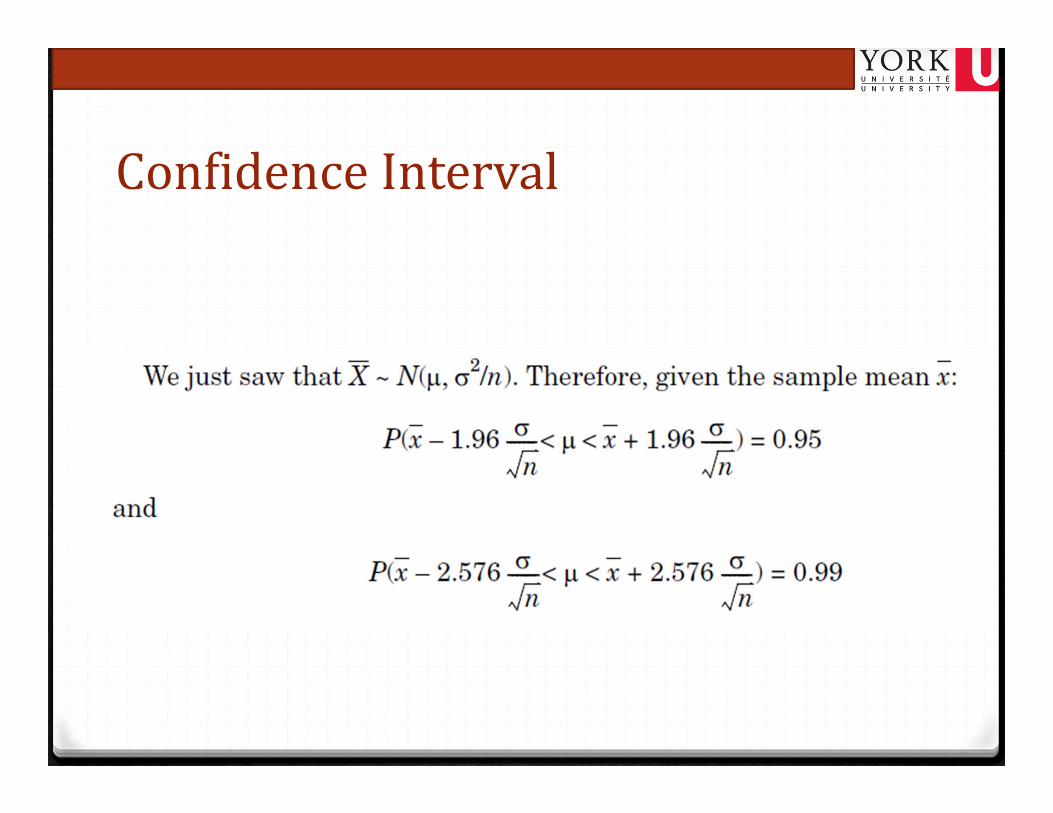
ConfidenceInterval
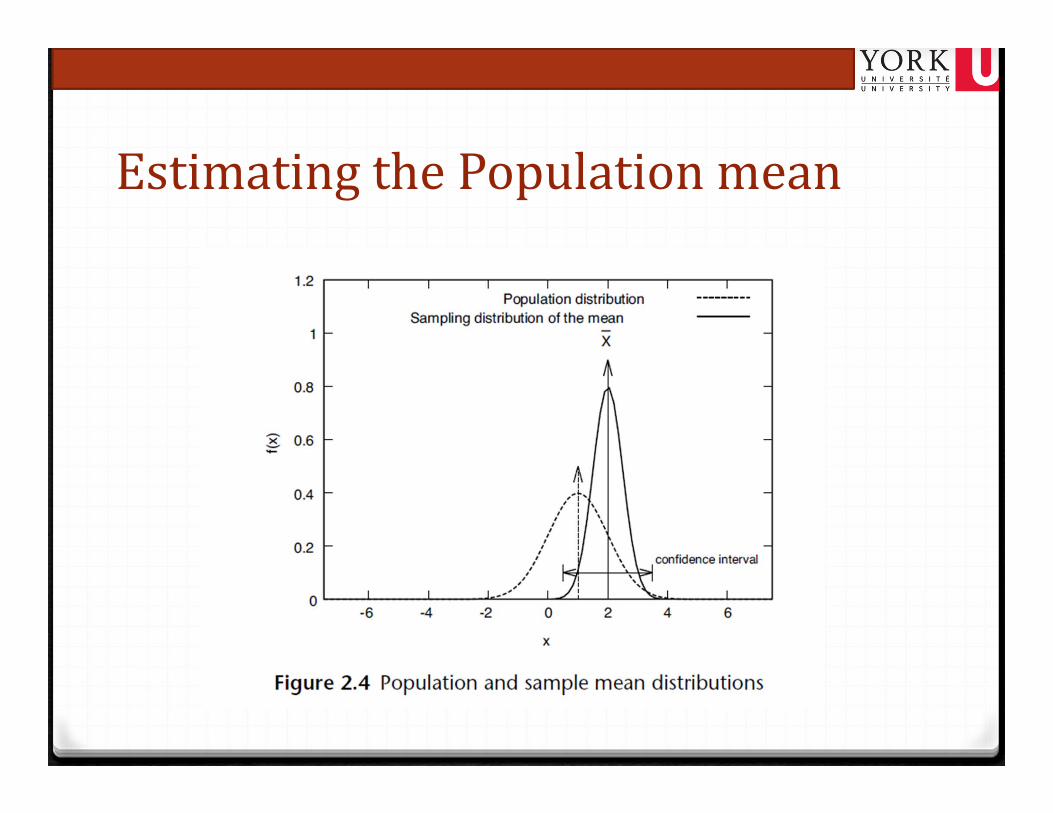
EstimatingthePopulationmean

ConfidenceIntervals
• Confidenceinterval=

ConfidenceLevel
• Themoreconfidentwewishtobe,thelargerourconfidenceintervalwillbe
• Note:ahighconfidenceisnotalwaysveryuseful• i.e.– “Icanguaranteethatthevalueisbetween1~1million.”
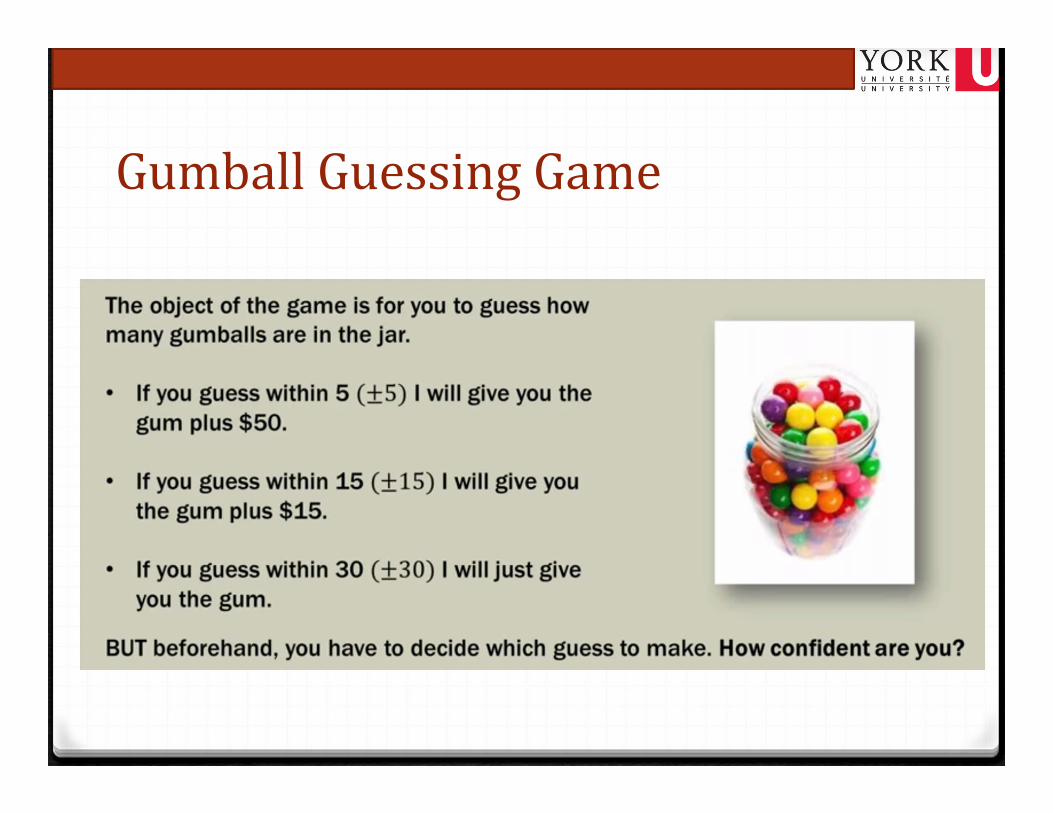
GumballGuessingGame
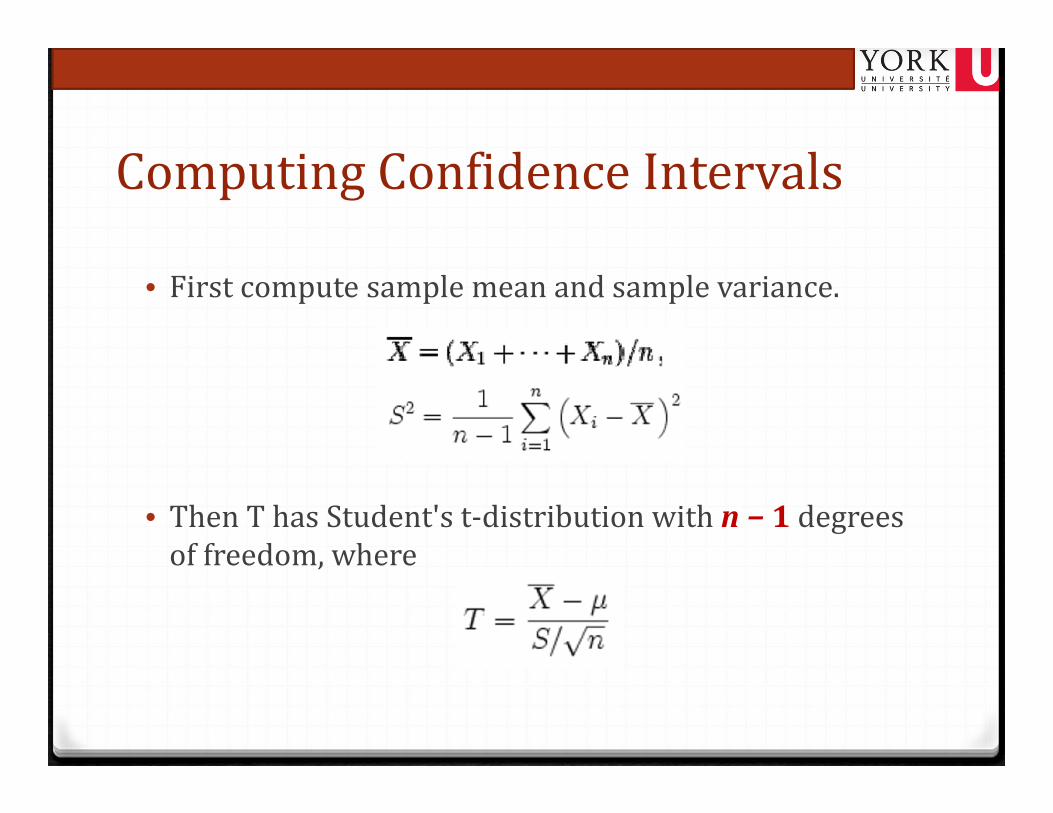
ComputingConfidenceIntervals
• Firstcomputesamplemeanandsamplevariance.
• ThenThasStudent'st‐distributionwithn− 1degreesoffreedom,where

T‐table
• http://en.wikipedia.org/wiki/Student's_t‐distribution
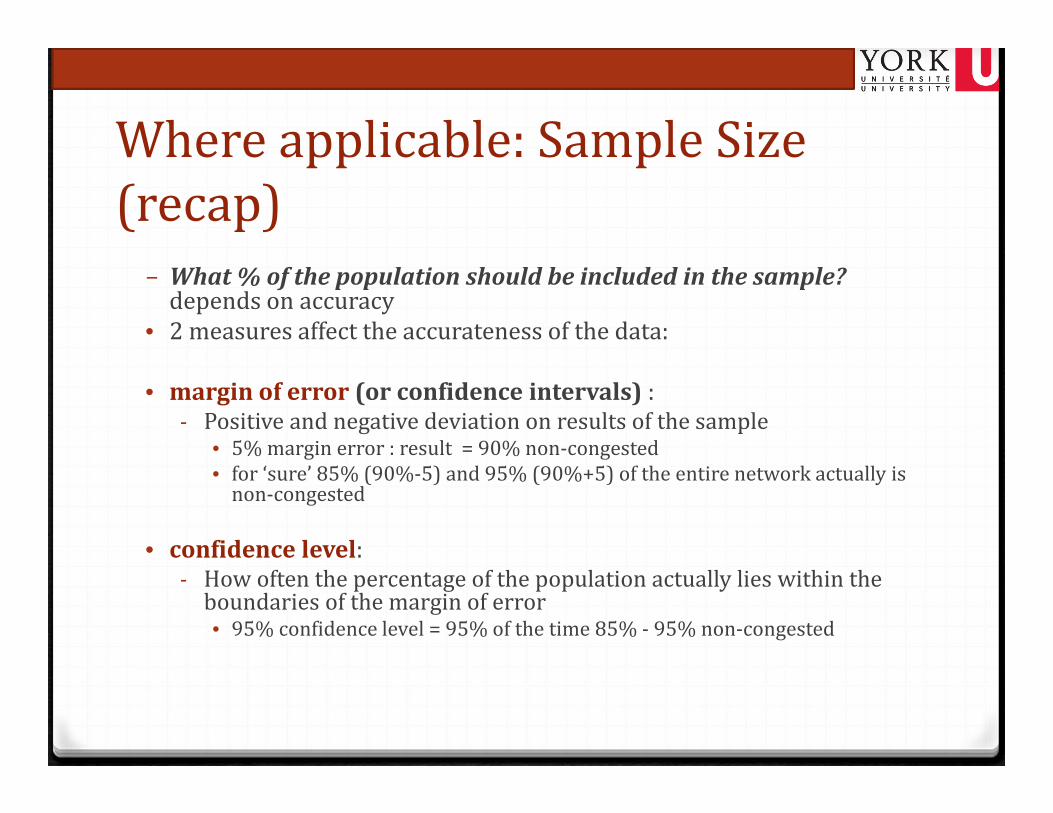
− What%ofthepopulationshouldbeincludedinthesample?dependsonaccuracy
• 2measuresaffecttheaccuratenessofthedata:
• marginoferror(orconfidenceintervals):‐ Positiveandnegativedeviationonresultsofthesample
• 5%marginerror:result=90%non‐congested• for‘sure’85%(90%‐5)and95%(90%+5)oftheentirenetworkactually isnon‐congested
• confidencelevel:‐ Howoftenthepercentageofthepopulationactuallylieswithintheboundariesofthemarginoferror• 95%confidencelevel=95%ofthetime85%‐ 95%non‐congested
Whereapplicable:SampleSize(recap)
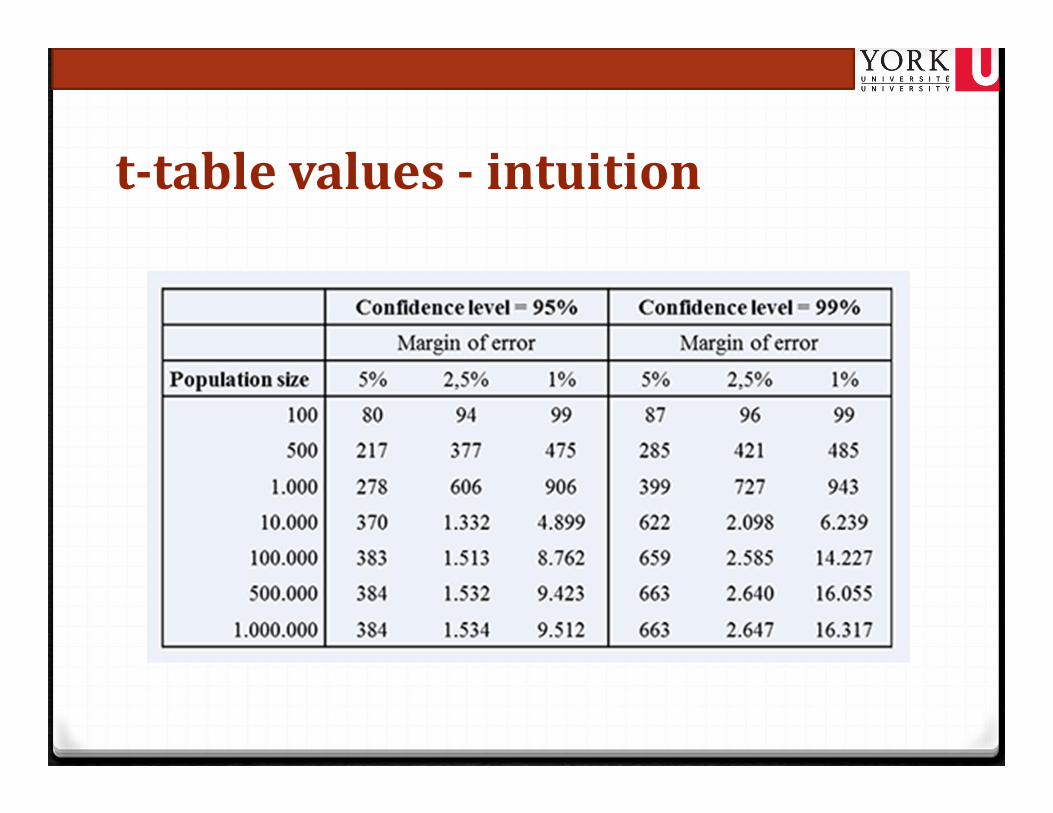
t‐tablevalues‐ intuition
NextLecture
• HypothesisTesting
• Correlation,Regression