laser induced alignment - aarhus universitet
TRANSCRIPT

Laser-induced alignmentTOWARDS FIXED-IN-SPACE MOLECULES
PhD Dissertation
Christer Zoffmann BisgaardDepartment of Physics and Astronomy
University of Aarhus
August 2006


Preface
This Dissertation has been submitted to the Faculty of Science at the University ofÅrhus, in order to fulfill the requirements for the PhD degree. The work presented hasbeen carried out at the Department of Physics and Astronomy in the years 2002-2006under the supervision of Henrik Stapelfeldt from the Department of Chemistry.
AcknowledgementsFirst of all, I am very grateful to Henrik Stapelfeldt for four excellent years under hisalways encouraging supervision. It has been an exciting journey with many stimulat-ing discussions.
The people with whom I have shared many joyful (and sometimes very late!) hoursin the lab are (in order of appearance): Emmanuel Péronne, Mikael D. Poulsen, Si-mon S. Viftrup, Tine Ejdrup, Lotte Holmegaard and Vinod Kummarappan. In theircheerful company time flies by with ease and suddenly you find that four yeas havepassed. Many of the things I have learned in the meanwhile can be traced to my in-teraction with them. A special thanks goes to Vinod for careful proof-reading of themanuscript for this Dissertation. In the lab Jan Thøgersen has been an indispensableasset, always ready to get the laser in shape and assist on any question that may arise.Also thanks to Christian Petersen for good companionship during all of my eight yearsat the university.
During my time as a PhD student I have benefitted from our collaboration with
i

Edward Hamilton and Tamar Seideman at the Northwestern University in Evanston,IL, USA. Their calculations have brought my understanding of alignment further thanany experiment alone would permit. All calculations on asymmetric tops presented inthis Dissertation were carried out by Edward and Tamar.
Early on during my time in the group a very fruitful collaboration on strong-fieldionization of molecules was initiated with Thomas K. Kjeldsen and Lars Bojer Madsenfrom the Department of Physics and Astronomy. Without the guidance of Lars withboth rigorous theory and transparent physical arguments, my insight to strong-fieldphysics would not have been the same. The calculations on strong-field ionizationpresented in this Dissertation were carried out by Thomas.
Over the years I have also benefitted greatly from the excellent support from thetechnical staff at the Department of Chemistry, especially the superb skills of PerStrand in the mechanical workshop must be mentioned, and the Vacuum and Elec-tronics workshops at the Department of Physics and Astronomy have helped on manyoccasions.
In the summer of 2005 I also had the pleasure of spending two months in the groupof Daniel M. Neumark at the University of California, Berkeley. I am thankful to Danfor allowing me to visit his lab and my best thoughts go to Jan R. R. Verlet, AsterKammrath, Graham Griffin and the rest of the group for two unforgettable monthsthere.
Last, but certainly not least, I am very thankful for the never ceasing love andsupport from my wife Kathrine.
Christer Zoffmann BisgaardAugust 2006
ii

OutlineChapter 1 This chapter provides a brief, historically inspired introduction to the idea
of controlling the spatial orientation orientation of molecules.
Chapter 2 The theory of laser-induced alignment of molecules is described in detailand some illustrative numerical results are presented. This chapter forms theconceptual foundation for all the following chapters.
Chapter 3 An introduction to our detection technique, photo-fragment ion imaging,is given and the experimental setup is described.
Chapter 4 Our experimental results on nonadiabatic alignment of symmetric andasymmetric top molecules are presented. In particular the appearance of ro-tational revivals for both classes of molecules is demonstrated.
Chapter 5 The ‘old’ problem of adiabatic alignment is reconsidered in the light ofsome new experimental results which emphasize the crucial role of the rota-tional temperature.
Chapter 6 In this chapter it is demonstrated that for nonadiabatic alignment, twoproperly timed pulses can lead to a significant improvement of the degree ofalignment over that obtainable in single-pulse experiments.
Chapter 7 Some applications of aligned molecules are discussed, in particular theiruse in photoelectron spectroscopy and in strong-field physics.
Chapter 8 In this final chapter some ideas for future experiments and directions arediscussed.
iii

List of PublicationsThe work presented in this dissertation has lead to the following publications:
I Nonadiabatic Alignment of Asymmetric Top Molecules: Field-Free Alignmentof IodobenzeneE. Péronne, M. D. Poulsen, C. Z. Bisgaard, H. Stapelfeldt and T. Seideman.Phys. Rev. Lett. 91, 043003 (2003).
II Role of symmetry in strong-field ionization of moleculesT. K. Kjeldsen, C. Z. Bisgaard, L. B. Madsen and H. Stapelfeldt. Phys. Rev. A.68, 063407 (2003).
III Nonadiabatic laser-induced alignment of iodobenzene moleculesE. Péronne, M. D. Poulsen, H. Stapelfeldt, C. Z. Bisgaard, E. Hamilton and T.Seideman. Phys. Rev. A 70, 063410 (2004).
IV Nonadiabatic alignment of asymmetric top molecules: Rotational revivalsM. D. Poulsen, E. Péronne, H. Stapelfeldt, C. Z. Bisgaard, S. S. Viftrup, E.Hamilton and T. Seideman. J. Chem. Phys. 121, 783 (2004).
V Observation of Enhanced Field-Free Molecular Alignment by Two Laser PulsesC. Z. Bisgaard, M. D. Poulsen, E. Péronne, S. S. Viftrup and H. Stapelfeldt.Phys. Rev. Lett. 92, 173004 (2004).
VI Tunneling ionization of atomsC. Z. Bisgaard and L. B. Madsen. Am. J. Phys. 72, 249 (2004).
VII Influence of molecular symmetry on strong-field ionization: Studies on ethylene,benzene, fluorobenzene, and chlorofluorobenzeneT. K. Kjeldsen, C. Z. Bisgaard, L. B. Madsen and H. Stapelfeldt Phys. Rev. A71, 013418 (2005).
VIII Alignment of symmetric top molecules by short laser pulsesE. Hamilton, T. Seideman, T. Ejdrup, M. D. Poulsen, C. Z. Bisgaard, S. S.Viftrup and H. Stapelfeldt. Phys. Rev. A 72, 043402 (2005).
IX Alignment enhancement of a symmetric top molecule by two short laser pulsesC. Z. Bisgaard, S. S. Viftrup and H. Stapelfeldt. Phys. Rev. A. 73, 053410(2006).
X Three-dimensional alignment of molecules using a long and a short laser pulseS. S. Viftrup, C. Z. Bisgaard, V. Kumarappan, L. Holmegaard, H. Stapelfeldt,E. Hamilton and T. Seideman. In preparation (2006).
iv

XI Adiabatic alignment of very cold moleculesV. Kumarappan, C. Z. Bisgaard, S. S. Viftrup, L. Holmegaard and H. Stapelfeldt.In preparation (2006).
XII Controlling the rotational revival structure of asymmetric topsL. Holmegaard, V. Kumarappan, S. S. Viftrup, C. Z. Bisgaard and H. Stapelfeldt.In preparation (2006).
v


CONTENTS
1 Introduction 1
2 Theory of alignment 52.1 Introduction . . . . . . . . . . . . . . . . . . . . . . . . . . . . . . . 52.2 Adiabatic alignment . . . . . . . . . . . . . . . . . . . . . . . . . . . 7
2.2.1 Numerical approach . . . . . . . . . . . . . . . . . . . . . . 92.3 Nonadiabatic alignment . . . . . . . . . . . . . . . . . . . . . . . . . 13
2.3.1 Symmetric tops . . . . . . . . . . . . . . . . . . . . . . . . . 142.3.2 Asymmetric tops . . . . . . . . . . . . . . . . . . . . . . . . 202.3.3 Focal volume averaging . . . . . . . . . . . . . . . . . . . . 222.3.4 Anisotropic M distributions . . . . . . . . . . . . . . . . . . 24
2.4 3D alignment . . . . . . . . . . . . . . . . . . . . . . . . . . . . . . 27
3 Experimental setup 293.1 Photo-fragment imaging . . . . . . . . . . . . . . . . . . . . . . . . 293.2 The setup . . . . . . . . . . . . . . . . . . . . . . . . . . . . . . . . 30
3.2.1 Vacuum and detection system . . . . . . . . . . . . . . . . . 313.2.2 Laser pulses . . . . . . . . . . . . . . . . . . . . . . . . . . . 34
4 Nonadiabatic alignment 414.1 Post-pulse evolution . . . . . . . . . . . . . . . . . . . . . . . . . . . 41
vii

4.2 Long delays — revivals . . . . . . . . . . . . . . . . . . . . . . . . . 464.2.1 Symmetric tops . . . . . . . . . . . . . . . . . . . . . . . . . 464.2.2 Asymmetric tops . . . . . . . . . . . . . . . . . . . . . . . . 53
5 Adiabatic alignment 615.1 Choosing the probe . . . . . . . . . . . . . . . . . . . . . . . . . . . 625.2 Large, cold molecules . . . . . . . . . . . . . . . . . . . . . . . . . . 655.3 Negative ions . . . . . . . . . . . . . . . . . . . . . . . . . . . . . . 71
6 Two-pulse alignment 756.1 Introduction . . . . . . . . . . . . . . . . . . . . . . . . . . . . . . . 756.2 Detailed study: tert-butyliodide . . . . . . . . . . . . . . . . . . . . . 77
6.2.1 Experimental results . . . . . . . . . . . . . . . . . . . . . . 776.2.2 Numerical results . . . . . . . . . . . . . . . . . . . . . . . . 816.2.3 Discussion . . . . . . . . . . . . . . . . . . . . . . . . . . . 84
6.3 Other methods for manipulating rotational wave packets . . . . . . . 86
7 Applications of aligned molecules 897.1 Photoelectron spectroscopy . . . . . . . . . . . . . . . . . . . . . . . 90
7.1.1 Demonstration of a working spectrometer . . . . . . . . . . . 927.2 Strong field physics . . . . . . . . . . . . . . . . . . . . . . . . . . . 96
7.2.1 Single ionization . . . . . . . . . . . . . . . . . . . . . . . . 977.2.2 High-order harmonic generation . . . . . . . . . . . . . . . . 102
8 What’s next? 1038.1 Three-dimensional alignment . . . . . . . . . . . . . . . . . . . . . . 1038.2 Flexible molecules . . . . . . . . . . . . . . . . . . . . . . . . . . . 107
9 Summary 111
A Calculating the degree of alignment 115A.1 Symmetric top matrix elements . . . . . . . . . . . . . . . . . . . . . 115A.2 Angular distributions . . . . . . . . . . . . . . . . . . . . . . . . . . 116A.3 Numerical implementation for calculating nonadiabatic alignment . . 118
References 121
viii

CHAPTER 1
Introduction
The idea of using light induced forces to control and manipulate matter has lead toimportant progress in modern atomic, molecular and biological physics; it is at thevery core of popular techniques such as laser cooling and optical tweezers. Bothtechniques can be used to control the translational degrees of freedom and opticaltweezers can also be used to control the spatial orientation of cell-size objects. Inthis Dissertation the use of non-resonant infrared laser pulses to strongly confine thespatial orientation of small gas phase molecules will be described. Before doing so,a brief introduction to the topic shall be given; for a more detailed review of laserinduced alignment the reader is referred to [1].
The initial drive for seeking control over the spatial orientation of molecules camefrom reactive scattering experiments with molecular beams. While steric effects havehad a central role in chemistry for a long time, these experiments aim to quantify theeffects in terms of reaction rates for different collision geometries. A standard examplefrom introductory organic chemistry is SN2 type reactions like the substitution of Clwith I in CH3Cl
I− + CH3Cl −−→ ICH3 + Cl−.
For this reaction the rate is significantly higher when the iodine ion attacks methylchlo-ride along the C−Cl bond from the carbon end, as opposed to approaching themolecule from the chlorine end. To study bimolecular reactions in detail it is, there-
1
2 Introduction
fore, highly desirable to be able to control the relative orientation of the two collisionpartners prior to the reaction. For symmetric tops this has been accomplished by us-ing electrostatic hexapole focusing to select molecules in a specific rotational statefollowed by orientation in a static electric field [2]. This technique utilizes the stableprecession of the angular momentum vector around the external electric field for sym-metric tops, for asymmetric tops with the permanent dipole moment µ along the A-or C-axis, and for linear molecules with either electronic or vibrational angular mo-mentum, but is limited by the fact that, with a few exceptions, pure |JKM〉 states areonly modestly confined. An alternative approach is the technique nicknamed ‘brute-force orientation’, where a strong static field alone is used to orient the molecules bycreating directional hybrids of the field-free rotational states [3, 4]. If the moleculesare very cold (kT < µE) they will be forced into confined librational motion aroundthe electric field with the dipole moment preferentially pointing in the direction of theelectric field. Early in the development of this technique it was realized that the verystrong electric field in the focus of a pulsed laser would be able to confine the rota-tional motion much more efficiently [3] and this lead to the proposal of using infrarednon-resonant lasers to align molecules [5]. The drawback of using the AC field of alaser to confine the rotational motion is that since the electric field of near-infraredlaser pulses oscillates at a frequency much higher than molecular rotational frequen-cies, the head-vs-tail preference induced by a DC field is lost.
In parallel to this, the idea of laser-induced alignment was developed indepen-dently from studies of multi-electron dissociative ionization of molecules by stronglaser fields. It was observed that the fragment ions from small, linear molecules wereprimarily ejected along the polarization axis. Two mechanisms, named geometricaland dynamical alignment, were proposed to explain these observations [6, 7]. In ge-ometrical alignment the directionality of the fragments is caused by a strong angulardependence for the ionization probability which selects a subset of the sample of ran-domly oriented molecules. Contrasting this, dynamical alignment describes a situationwhere the laser field actually exerts a torque on the molecule and forces all of the mole-cules into alignment close to the polarization axis prior to ionization. In reality, bothmechanisms may have played important roles for the observed fragment patterns; inparticular, enhanced ionization provides a mechanism for a strong angular dependenceof the production of molecules in high charge states [8, 9].
One concept that will be encountered many times throughout this Dissertation isthat of rotational wave packets. A wave packet is a coherent superposition of eigen-states of different energies and is thus a non-stationary state. Since short laser pulsesinherently come with large bandwidths, they provide a powerful way to create wavepackets. An intense, non-resonant pulse with a duration much shorter than the rota-tional period will, for instance, create a superposition of rotational states in the elec-tronic ground state via stimulated Raman transitions [10, 11]. If, instead, a short pulse,which is resonant with the transition to an electronically excited state, is used then arotational wave packet is created in the excited state [12, 13]. Seideman [14] realized
2

3
that under conditions typical for many femtosecond pump-probe experiments, a broadrotational wave packet could (unintentionally) be created in both the ground and ex-cited states via sequential Rabi cycling and that the phasing of the rotational stateswas such that the molecules would become aligned shortly after the pulse. Since awave packet corresponds to a non-stationary state, the expectation value of a givenobservable is in general time-dependent. Rotational wave packets may, for instance,become angularly confined, but only during short intervals. On the positive side, thetemporal evolution of the wave packet can lead to alignment under field-free condi-tions; Seideman [15] showed using an analytical approximation that the rotational kickby a near-resonant, short laser pulse in general leads to a higher degree of alignmentafter the pulse than during the pulse and Ortigoso et al. [16] showed numerically thata short, non-resonant pulse can induce similar behavior, even when thermal averagingis taken into account.
The field of laser-induced alignment has been characterized by fruitful interplaybetween theory and experiment. The initial inspiration for the pioneering theoreti-cal papers [5, 14] came from experiments. The proposal of adiabatic alignment wasquickly followed by a experimental confirmation by Kim and Felker [17] and laterdetailed studies followed from Stapelfeldt and co-workers [18, 19] culminated withthe demonstration of three dimensional alignment [20]. Meanwhile, the idea of us-ing short laser pulses to induce dynamical alignment, was proposed by theoreticians[14–16]. Once again, experiments followed soon after; the work by Rosca-Pruna andVrakking [21], who made the first demonstration of dynamical alignment and showedthe appearance of rotational revivals, marked the starting point for a vast amount ofexperimental studies on nonadiabatic alignment by many different groups. Many ofthese studies will be discussed together with the results presented below.
By now, laser induced alignment by both long and short pulses are well knownphenomena and focus is moving towards applications of aligned molecules; indeedlaser induced alignment is currently maturing as a valuable tool for fundamental re-search in several areas of physics and chemistry. Some of these application will bediscussed in the end of this Dissertation.
3


CHAPTER 2
Theory of alignment
In this chapter the theory of molecular alignment by non-resonant laser fields is de-scribed. The chapter will serve as a reference for both a qualitative and a quantitativediscussion of the experimental results.
2.1 IntroductionThe interaction of a molecule with a nonresonant, nonionizing, near-infrared laser fieldis well described by the interaction between the polarizability of the molecule and theelectric field of the laser. The interaction of the electric field with the permanentdipole moment (if the molecule happens to possess one) cycle-averages to zero sincethe direction of the electrical field reverses every half-cycle (∼1.3 fs at 800 nm) [5,22]. The interaction with the polarizability, on the contrary, corresponds to the laserinducing an electric dipole which then interacts with the external field. Since thedirection of the induced dipole reverses with the direction of the electrical field thisinteraction does not average to zero. To put it simply, the induced dipole correspondsto the electrons being pulled away from their equilibrium position. As moleculesoften have structures extending into different directions in space, some directions aremore favorable than others for the electrons. A consequence is that the interactionbetween the molecule and the laser field depends on the relative orientation between
5

6 Theory of alignment
the molecule and the polarization of laser and a torque is exerted on molecules whichare not oriented in the most favorable geometry. If the laser pulse is short compared tothe timescale for rotational dynamics of the molecule we can think of the laser pulse asgiving the molecules a rotational kick that makes them spin. If, on the other hand, theduration of the laser pulse is long compared to rotational dynamics of the molecule,the electric field will slowly guide the molecules into the most favorable orientation.
From a quantum mechanical point of view, the confinement of the spatial orienta-tion of a molecule requires a corresponding uncertainty in the conjugate coordinate.For the polar angle the conjugate coordinate is the angular momentum. What we needis thus a superposition of angular momentum states; more states leads to a higher limiton the angular confinement and thus makes feasible a higher degree of alignment.At optical frequencies this can be obtained via Raman transitions, either resonant ornon-resonant.
To be more quantitative, the interaction of a molecule with a laser field E(t) =E0(t) cos(ωt) can be described by an induced potential
V (t) = −14
∑
i,j
E0,i(t)αij E∗0,j(t), (2.1)
where i, j = X, Y, Z are the space-fixed coordinates and αi,j is the polarizabilitytensor. Quantum mechanically the polarizability is determined by the probability forRaman transitions amongst the manifold of rotational states in the vibronic groundstate [23]. The total Hamiltonian for the molecule-field system is the sum of the field-free Hamiltonian
Hrot =J2
x
2Ixx+
J2y
2Iyy+
J2z
2Izz, (2.2)
and the induced potential. That is,
H = Hrot + V (t). (2.3)
In order to analyze the behavior of the system described by this Hamiltonian we needsome more information. First of all we must know how rapidly the interaction poten-tial changes with time; that is, the pulse duration must be specified. If, on the onehand, the pulse duration is long compared to rotational period of the molecule themolecule will undergo an adiabatic transition from a field-free state to a field-dressedstate. Short pulses, on the other hand, lead to nonadiabatic interactions that create acoherent superposition of eigenstates, i.e., a wave packet. One thing is common forboth regimes: perturbation theory cannot be used. Typical rotational constants for themolecules we have investigated are on the order of a few GHz (in frequency units).Typical intensities are on the order of 500 GW/cm2 or more and polarizabilitiesa are a
aMore precisely this is the polarizability volume. See Appendix A.3.
6

2.2 Adiabatic alignment 7
few Å3. The interaction term is then on the order of several hundreds of GHz; obvi-ously non-perturbative methods must be used for solving the equations.
This chapter will present an analysis of the two regimes of interaction exposingtheir advantages and disadvantages. The main focus will be on the interaction witha linearly polarized laser field which renders possible the control of one axis in themolecule. The final section deals with scenarios for full three-dimensional alignment.
2.2 Adiabatic alignmentAdiabatic alignment of linear molecules was first considered by Friedrich and Her-schbach [5, 24], inspired by their earlier work on brute force orientation in molecularbeam experiments [3]. The theoretical treatment of a symmetric top in an intense, non-resonant laser field was considered 20 years prior to Friedrich and Herschbach by Zonand Katsnel’son [25]. These authors, however, only consider the effect on the rota-tional spectrum, not the consequences for the spatial orientation of the molecules. If amolecule is exposed to a laser pulse with a slowly evolving envelope, the adiabatic the-orem states that each state in the field-free system is transferred to the correspondingeigenstate in the presence of the field [26]. Explicit integration of the time-dependentSchrödinger equation by Ortigoso et al. [16] shows that for τ > 5 ·Trot and for real-istic intensities the evolution is purely adiabatic and recent work by Torres et al. [27]indicates that adiabatic behavior is found already when τ & Trot. The eigenstates inthe presence of the field are called pendular states since the bound states correspondto a molecule librating in the induced potential well, a motion much similar to theoscillations of a pendulum. In the case of a linear molecule interacting with a linearlypolarized laser field the interaction potential is
V = −E20
4(∆α cos2 θ + α⊥
), (2.4)
where the polarizability anisotropy, ∆α = α‖−α⊥, is the difference in polarizabilityalong and perpendicular to the internuclear axis and θ is the angle between the polar-ization of the laser and the internuclear axis. With ∆α > 0 we see that the energy isminimized for θ = 0, π, that is when the molecules are aligned with the internuclearaxis parallel to the polarization of the laser field. Due to the cylindrical symmetryaround the polarization of the laser the projection of the angular momentum vectoronto the space fixed Z axis, M , is a conserved quantum number. In Fig. 2.1 the in-teraction potential has been plotted for the iodine molecule exposed to an intensity ofI = 100 GW/cm2. Also shown are the energy levels for the pendular states (onlythose with M = 0). The pendular states are labelled by J which corresponds to the Jquantum number of the field-free state that the given states correlates with when thefield is adiabatically turned off. That is, the state J = 1 goes into the J = 1 statewhen the field is turned off slowly.
7

8 Theory of alignment
0 0.2 0.4 0.6 0.8 1
−450
−400
−350
−300
−250
θ / πV
/ h (
GH
z)
J = 0,1
J = 2,3
J = 6,7
J = 4,5
FIGURE 2.1: Interaction potential for I2 at an intensity of 100 GW/cm2. Also shown arethe energy levels for the pendular states, J (M = 0). The splitting of the nearly degeneratestates (J < 7) has been exaggerated for illustrative purposes.
A striking feature of the energy level spacing is that the lower levels come in veryclosely spaced pairs. These pairs occur because the potential is a double well, theirspacing correspond the tunnelling frequency between the two parts of the well. Al-though the energy levels are only shown in the upper (θ > π/2) part of the potentialeach of the pendular states are delocalized in both ends of the potential since a trap-ping in one end would correspond to orientation which cannot be achieved by a singlefrequency near infrared laser in the adiabatic regime [5]. It is worth noting that foreach pair, the two states have opposite parity. Secondly it is seen that the pairs up toJ = 4, 5 have equidistant spacing. The reason is that the lowest states are confined tothe region close the polar axis where the potential is well approximated by a harmonicpotential and the molecules can be considered harmonic librators. From the figure itis clear that each of the pendular pairs experiences different confinement and there-fore have different degrees of alignment. In a typical experiment a thermal sampleof molecules is used and even for very cold molecules a range of field-free rotationalstates will be populated: a temperature of 1 K corresponds to an energy on the order of20 GHz (compared to the rotational constants of a few GHz). Since each initial state isadiabatically transferred to the corresponding pendular state the same range of pendu-lar states will be populated. To complicate things further, the degree of alignment alsodepends on the M quantum number (in a classical model M is just another measurefor polar angle between the polarization of the laser and the angular momentum vectorof the molecule). As shown by Friedrich and Herschbach the effective potential in theθ coordinate is strongly modified by a centrifugal term for M 6= 0 [24]. It is thereforeclear that one must consider the ensemble average of the degree of alignment when
8

2.2 Adiabatic alignment 9
comparing with an experiment.For symmetric tops the interaction potential is identical to the one for linear mole-
cules; in the molecular frame the symmetry dictates that the two components of thepolarizability tensor perpendicular to the top axis are identical. This class of mole-cules have an extra quantum number describing their field-free rotational motion: theprojection, K, of the angular momentum vector onto the top axis (the z axis in themolecular frame). Since the interaction potential is invariant under rotations aroundthe z axis (independent of the Euler χ angle), K is a conserved quantum number. Boththe field-free energy and the energy of the pendular states do, however, depend on K.
Finally, we have asymmetric tops. This class of molecules is characterized byhaving three distinct moments of inertia in the molecular frame (or more precisely inthe principal axes frame). Since there are no general restrictions from the symmetryof the molecules we must also expect them to have three distinct components of thepolarizability tensor in the molecular frameb. The potential created by interacting witha linearly polarized laser field is then
V = −E20
4[sin2 θ
(αxx cos2 χ + αyy sin2 χ
)+ αzz cos2 θ
], (2.5)
where αii are the components of the polarizability tensor in the molecular frame. Theextra terms reflect the fact that for molecules who are not perfectly aligned (θ 6= 0, π)it is advantageous to have the axis of second highest polarizability in the plane spannedby the polarization vector and the axis of highest polarizability. M is still a conservedquantum number due to the cylindrical symmetry (independence of φ). The projectionof the angular momentum vector onto the z axis cannot be used to describe the field-free rotation of asymmetric tops, instead levels with the same value of J and M aregiven an index τ . States of different τ are mixed by the interaction with a non-resonantlaser.
After these qualitative considerations it is now appropriate to consider how we cancarry out a more detailed study of adiabatic alignment. As stated in the introductionthe intensities applied in a typical experiment call for non-perturbative methods. Inthe following Section it will be outlined how to carry out such calculations and afew numerical results are presented to highlight the general properties of adiabaticalignment.
2.2.1 Numerical approachTo study adiabatic alignment is to study the properties of the pendular states. Forlinear molecules, the time-independent Schrödinger equation can be reduced to the
bThe discussion is restricted to molecules were the principal axis frame is also the frame where the po-larizability tensor is diagonal. This is ensured by the symmetry for molecules with point group symmetriesD2, C2v and D2h or higher.
9
10 Theory of alignment
well-studied spheroidal wave equation [5, 25]. The focus here will be on the pendularstates of symmetric tops where this reduction cannot be carried out. Numerically, theresults for linear molecules can trivially be obtained in the approach described belowsince linear molecules can be treated as symmetric tops with K = 0. The way toextend the methods presented here to asymmetric tops will be briefly outlined.
For a prolate symmetric top, the field-free Hamiltonian is
Hrot = BJ2 + (A−B)J2z , (2.6)
and the total Hamiltonian is the sum of this term and Eq. (2.4). The time-independentSchrödinger equation can be written as a matrix equation by expanding the pendularstate in the basis of symmetric top states
|JKM〉 =∑
J′dJ′KM |J ′KM〉, (2.7)
and projecting the Schrödinger equation(Hrot + V
)|JKM〉 = EJKM |JKM〉, (2.8)
onto a specific eigenstate, |JKM〉
EJK dJKM +∑
J ′dJ′KM 〈JKM |V |J ′KM〉 = EJKM dJKM . (2.9)
The second equation is exactly the sought matrix equation, H · d = EJKMd. Theelements of the Hamiltonian matrix can all be expressed analytically: the diagonalterm EJK = BJ(J + 1) + (A− B)K2 is just the field-free energy and the couplingterms 〈JKM |V |J ′KM〉 can be expressed in terms of Wigner 3-j symbols (see Ap-pendix A.1). The pendular states can thus be found by diagonalizing this Hamiltonian,a trivial operation that can be carried out using standard routines, for instance thosefound in [28]. With the wave function at hand we have all the knowledge about thesystem we can ever obtain and one can for instance calculate the angular distribution,P (θ), of the symmetry axis (see Appendix A.2). To characterize the degree of align-ment an often used measure is the expectation value of cos2 θ. It is straightforwardto calculate the value of this observable using the angular distribution or using theexpansion in the field-free states. There is, however, an easier way of calculating thisobservable without even finding the wave function! Using the Hellmann-Feynmanntheorem [29], it is possible to extract this observable just from the energies of thependular states as function of intensity since it follows from the theorem that
〈cos2 θ〉JKM = − ∂(EJKM + 1
4E20α⊥
)
∂(
14E2
0∆α) . (2.10)
10

2.2 Adiabatic alignment 11
As stated at the beginning of this Section the degree of alignment depends stronglyon which pendular state we consider. For comparison with experiments it is thereforeessential that effects of thermal averaging are considered. In order to do so we mustknow the distribution of initial states. It is usually assumed that the populations followthe Boltzmann distribution. In this case the probability that a given initial state ispopulated is given by
wi =e−Ei/kBT
∑j e−Ej/kBT
, (2.11)
with Ei the field-free energy of the i’th initial state. As will be discussed later, exper-iments show that the state distribution for cold molecular beams does not follow theBoltzmann distribution, for instance anisotropic distributions of M states have beenobserved. The deviations from the Boltzmann distribution are however small enoughthat we can safely neglect this effect for now. The thermally averaged value, 〈cos2 θ〉T ,can thus be obtained as
〈cos2 θ〉T =∑
i
wi〈cos2θ〉i, (2.12)
with i = J,K,M being the initial state.For calculations of the pendular states of an an asymmetric top the overall pro-
cedure is just as described above but the matrix elements of the Hamiltonian becomeslightly more involved. For asymmetric tops it is still an advantage to expand thependular state wave function in the symmetric top basis since all matrix elements canthen be expressed analytically. The basis of field-free rotational states for the asym-metric top is inconvenient since no analytical expressions exist for these states; theyare most commonly found by diagonalizing the Hamiltonian matrix in the symmetrictop basis. Once the total Hamiltonian has been expressed in the symmetric top basis,the procedure outlined above can readily be followed. The major challenge regardingasymmetric tops is a numerical one: since the interaction in Eq. (2.5) couples statesof different indices τ , the blocks in the Hamiltonian are dramatically expanded com-pared to the symmetric top case (where the Hamiltonian is block diagonal in both Kand M ).
The black lines in Figure 2.2 shows the thermally-averaged expectation value〈cos2 θ〉T for tert-butyliodide as a function of intensity for a range of rotational tem-peratures. In the figure several general features can be observed. First and foremost,the strong influence of rotational temperature on the degree of alignment is clearlyseen. In an experiment at room temperature, for instance in a gas cell, only a weakdegree of alignment can be obtained at non-ionizing intensities; for this molecule ion-ization by the aligning laser field will most likely set in at intensities of 2 · 1012 W/cm2
or soc. In pulsed, supersonic molecular beams temperatures below 10 K are com-monly achieved and temperatures down to 0.1 K are feasible [30, 31]. In this cold
cThis intensity was estimated from experiments on adiabatic alignment of iodobenzene which has asimilar ionization potential.
11

12 Theory of alignment
250 500 750 1,000 1,250 1,500 1,750
0.4
0.5
0.6
0.7
0.8
0.9
Intensity (GW/cm2)
⟨ cos
2 θ⟩T
0.5 K
2.5 K
5 K
10 K
25 K
50 K100 K
1 K
FIGURE 2.2: Left: The black curves show the degree of adiabatic alignment for tert-butyliodide as function of intensity calculated for a range of rotational temperatures bysolving the time-independent Schrödinger equation. The red curves show the estimategiven in Eq. (2.13). Right: Polar plots of the angular distribution, P (θ), at 1 K and anintensity of 100 GW/cm2 (upper) and 1200 GW/cm2 (lower) for a vertically polarizedalignment laser. The radial scale is goes to 1.8 (6.8) in the upper (lower) graph.
regime, very high degrees of alignment can be obtained at quite modest intensitiessince only the lowest rotational states are populated. At low temperatures the align-ment curves also reveal a saturation-like intensity dependence. Once all the pendularstates are trapped in the harmonic region of the potential, increasing the intensity doesnot change the degree of alignment significantly. In a real experiment where moleculesexposed to a range of intensities of the aligning laser are probed one can therefore ob-tain an almost uniform degree of alignment.
For linear molecules Seideman [32] gave an approximate expression for the degreeof alignment in the high temperature limit
〈cos2 θ〉 ≈ 1−√
πkT
∆αE20
(34
hB
kT+ 1
). (2.13)
The red curves in Fig. 2.2 shows the degree of alignment calculated from this equationfor the temperatures from 0.5 K to 25 K. Surprisingly, the equation, which was derivedfor linear molecules, gives at very good estimate for the degree of alignment at lowtemperatures: at 0.5 K the numerically calculated curve and that obtained from thesimple estimate are indistinguishable at intensities above 200 GW/cm2. At the highertemperatures we observe significant deviations, especially at the lower intensities; the
12

2.3 Nonadiabatic alignment 13
domain of validity of this approximation is therefore hB ¿ kT ¿ ∆αE20 . A general
property that can be derived from Eq. (2.13) is that for high temperatures (kT ÀhB, which is fulfilled even at very low temperatures for the iodine containing speciesconsidered in this work since kT/h ≈ 20 GHz at 1 K) the degree of alignment onlydepends on the parameter kT/∆αE2. Friedrich and Herschbach [33] showed thatin the high temperature, low intensity limit (kT À ∆αE2
0 , hB) adiabatic is welldescribed by classical mechanics and that the degree of alignment in this limit onlydepends on this single parameter as well. If the degree of alignment only dependson this parameter we have a very powerful scaling law: by calculating the degreeof alignment as function of intensity at one temperature we can find the degree ofalignment at other temperatures simply by re-scaling the intensities. The scaling lawwas tested with the full numerical calculations for a symmetric top with temperaturesin the range 1 K to 100 K and can be used with high precision.
Figure 2.2 also shows the angular distributions calculated at 1 K and an intensityof 100 GW/cm2 and 1200 GW/cm2 respectively. In both cases the distributions arestrongly peaked along the laser polarization. Especially for high intensities and lowtemperatures it is reasonable to think of the molecule as being fixed-in-space. Investi-gations of orientational effects in molecules can thus be carried out systematically viafixation of the target by an alignment laser rather than having to worry about tediousdeconvolutions. This qualitative picture is, of course, based on the assumption that therotational degrees of freedom are decoupled from the process being investigated.
2.3 Nonadiabatic alignmentThe term ‘nonadiabatic alignment’ covers a very broad range of scenarios since itbasically deals with any pulse duration too short to be adiabatic. In this Dissertationonly the short pulse limit, where pulse durations are on the order of 1/100th of therotational period or less, is considered. This limit is particularly interesting sincethese pulse durations are in general capable of creating rotational wave packets thatbecome highly localized when the external field is no longer present: the moleculescan become aligned under field-free conditions. To show that this post-pulse alignmentis a general feature of molecules exposed to the rotational kick from a short pulseinteracting with the polarizability Seideman [32] and Averbukh and co-workers [34,35] independently analyzed the rotational dynamics of a molecule exposed to a δ-kick and indeed found that the excited wave packet had relative phases encoded thatinevitably lead to alignment. As shown by Averbukh and co-workers the short-timeevolution of the rotational ground state can be fully understood by classical mechanics.Their model considers a classical ensemble of isotropically distributed linear, rigidrotors with negligible angular velocity. If these rotors interact with a very short laserpulse through the polarizability interaction (Eq. (2.4)) we can find their final angularvelocity. The torque, τ = −r × ∇V can be used to find the angular momentum,
13

14 Theory of alignment
J = |J|, transferred to the rotors
J =∫
τ dt = 14∆α
∫E2
0 dt sin(2θ0) ≡ IP sin(2θ0), (2.14)
where θ0 is the initial angle, I is the moment of inertia and P is the interaction strength.Using |J | = I|θ| we thus find
θ = −P sin(2θ0). (2.15)
It readily follows that rotors starting close the polarization of the laser (θ ∼ 0, π)obtain an angular velocity proportional to their angle with the polarization axis. Attime t = 1/(2P ) all these rotors will be aligned along the polarization axis. Since thelinear approximation of a sine function is a good approximation for quite large angles itwill be a large fraction of the rotors that reach the polarization axis at nearly the sametime; the ensemble becomes aligned albeit only for a short time. Two fundamentallimitations of short pulse alignment are readily extracted from this simple model. Firstof all the molecules are only aligned for a short time. If the alignment is to be utilizedin short pulse experiments this need not be a limitation at all. Secondly there is a limitto the degree of alignment. No matter how hard we kick the molecules starting at largeangles (close to the equator) will always lag behind. In Chapter 6 it is experimentallyand numerically shown that this limitation can be overcome by using more than onepulse.
The treatment of nonadiabatic alignment is organized as follows. First, details aregiven on the quantum mechanical theory of nonadiabatic alignment of symmetric tops.Second, the extension of this theory to asymmetric tops is sketched. Next, the effectsof probing a finite volume in the focus is considered. This turns out to be importanteven for a qualitative comparison of numerical and experimental results. Finally, theconsequences of an anisotropic distribution of M quantum numbers in the molecularbeam are considered.
2.3.1 Symmetric topsThe fundamental difference between adiabatic and nonadiabatic alignment is that thetime evolution must be considered explicitly in the latter case. Two time ranges areconsidered independently: the interaction with the laser pulse and the field-free evo-lution after the pulse. During the interaction between the molecules and the laserpulse we must resort to numerical methods to solve the time-dependent Schrödingerequation
i~ ∂t|ψ(t)〉 = H|ψ(t)〉, (2.16)
where the Hamiltonian, H , is the sum of Eq. (2.6) and Eq. (2.4). Just as for theadiabatic case, we start by expanding the unknown wave function in the field-free
14

2.3 Nonadiabatic alignment 15
eigenstates of the symmetric top
|ψi(t)〉 =∑
J ′Ci
J′(t) |J ′KM〉, (2.17)
where i = Ji,Ki,Mi is a collective index denoting the initial state and K, M havebeen omitted in labelling the expansion coefficients, Ci
J ′(t), since these are conservedquantum numbers. Inserting this expansion into the time-dependent Schrödinger equa-tion and projecting onto a specific eigenstate |JKM〉 we find
i~CiJ(t) = EJKCi
J(t) +∑
J ′Ci
J ′(t) 〈JKM |V |J ′KM〉. (2.18)
This is a set of coupled, linear, first order differential equations. Details on the nu-merical approach taken to solve these equations are given in Appendix A.3. In brief,an adaptive step-size routine is used to propagate the differential equations during theinteraction with the laser pulse. To minimize computational time the size of the ba-sis set, that is the number of J states included, is dependent on the intensity of thealignment pulse. After the interaction with the laser pulse, the molecules rotate freeof any external fields. The time evolution of the wave packet is then trivially found byconsidering the time evolution of each component in the wave packet
|ψi(t)〉 =∑
J ′Ci
J ′(t0) |J ′KM〉 eiEJ′K(t−t0)/~, (2.19)
where t0 is the time when the molecules become field-free.d Once the expansioncoefficients are found the expectation value of cos2 θ is readily calculated
〈cos2 θ〉i(t) =∑
J,J′Ci∗
J ′(t)CiJ(t) 〈J ′KM | cos2 θ|JKM〉. (2.20)
The thermal average is then obtained using Eq. (2.12).To substantiate the theory outlined and to highlight some general features of non-
adiabatic alignment a specific case will now be considered: tert-butyliodide interact-ing with a 1 ps laser pulse having a peak intensity of 6 TW/cm2. According to theclassical δ-kick model the molecules should align at about 0.5 ps after the laser pulse.Since this is shorter than the pulse duration we can immediately see that the moleculeswill start to align while they are still interacting with the laser pulse. This contradictsthe assumptions in the δ-kick model, but the model can still be used to estimate andrationalize the effects of the pulse. We start by estimating the magnitude of the kick.The relevant quantity is the average angular momentum transferred to the ensemble.Using Eq. (2.14) we find
〈J〉δ-kick =√〈J2〉 = 1√
2IP = 33, (2.21)
dChosen as the time where the intensity is below some fraction of the peak intensity.
15

16 Theory of alignment
0 5 10 15 20 25 30 35 40 45 500
0.05
0.1
0.15
0.2
J
Popu
latio
n
FIGURE 2.3: Open bars: relative population of the initial states at a temperature of 1 K.Shown is the relative populations (including M degeneracy) in the K = 0 subset ofstates. Full bars: relative population amongst the J states in the wave packet excited fromthe |JKM〉 = |000〉 initial state by a laser pulse with I = 6 TW/cm2 and τ = 1 ps.
with J measured in units of ~. Solving the time-dependent Schrödinger equation wecan extract the corresponding expectation value in the quantum mechanical treatmentof the problem. The full bars in Fig. 2.3 show the populations in the J states, i.e.|CJ |2, in the wave packet created from the |JKM〉 = |000〉 initial state. Using thesepopulations we can calculate the expectation value of the quantum mechanical J2
operator for the wave packet and thus find the average angular momentum in the wavepacket
〈J〉wp =√〈J2〉 =
∑
J′|CJ ′ |2 J ′(J ′ + 1) = 33. (2.22)
Surprisingly, the classical model gives the correct value for the average angular mo-mentum of the wave packet. However, the distribution of J states does show noticeabledifferences between the classical and quantum mechanical model.
In the quantum mechanical description, the wave packet is created by a sequenceof rotational Raman transitions. The angular momentum of the wave packet thereforealso reveals the large number of transitions used to create the wave packet. In Fig. 2.3the open bars show the relative population amongst the K = 0 subset of initial statesin an ensemble at a temperature of 1 K. Clearly at such low temperatures we can safelysay that the rotation of the molecules is completely dominated by the kick from thelaser pulse. If the initial ensemble was at room temperature, the peak in the Boltzmanndistribution would be at J = 44 with a long tail extending to larger J values; inthat case thermal motion cannot be neglected. Another property of the wave packetwhich is apparent from Fig. 2.3 is that it is very broad in J space. As discussed
16
2.3 Nonadiabatic alignment 17
0 5 10 15 20
0.2
0.3
0.4
0.5
0.6
0.7
0.8
0.9
Time (ps)
⟨ cos
2 θ ⟩ i
70 75 80 85 90
Time (ps)
|000⟩|311⟩|333⟩
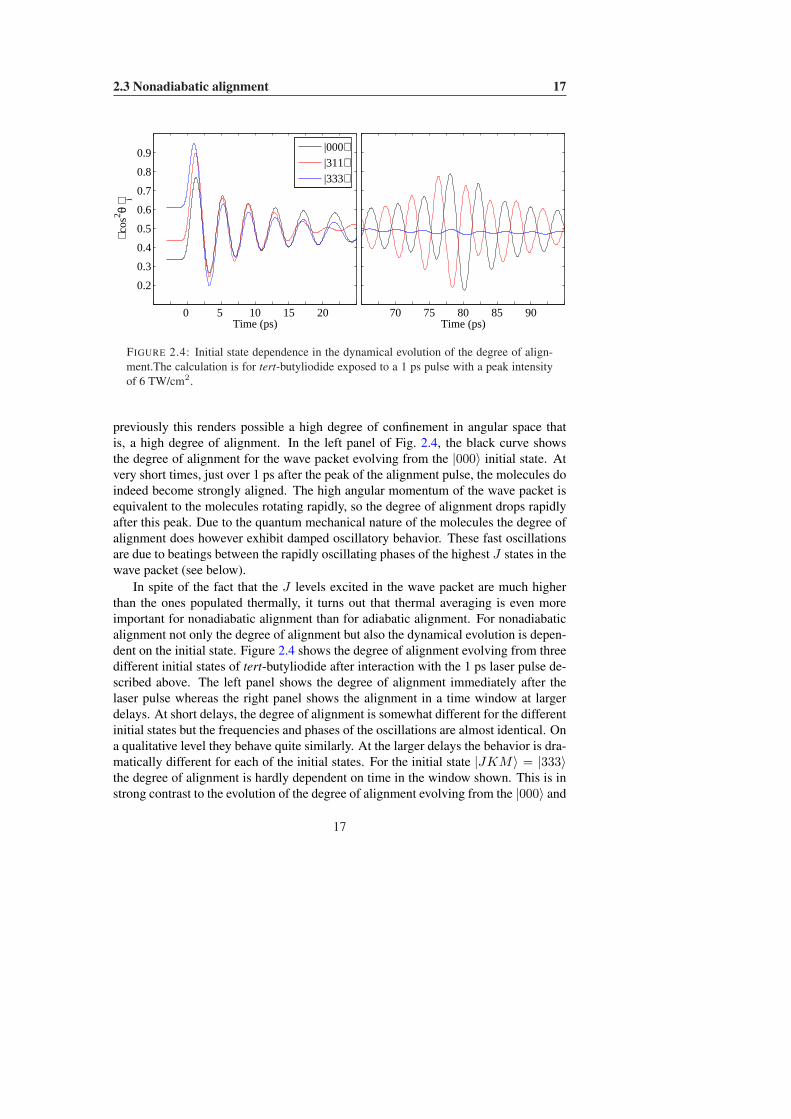
FIGURE 2.4: Initial state dependence in the dynamical evolution of the degree of align-ment.The calculation is for tert-butyliodide exposed to a 1 ps pulse with a peak intensityof 6 TW/cm2.
previously this renders possible a high degree of confinement in angular space thatis, a high degree of alignment. In the left panel of Fig. 2.4, the black curve showsthe degree of alignment for the wave packet evolving from the |000〉 initial state. Atvery short times, just over 1 ps after the peak of the alignment pulse, the molecules doindeed become strongly aligned. The high angular momentum of the wave packet isequivalent to the molecules rotating rapidly, so the degree of alignment drops rapidlyafter this peak. Due to the quantum mechanical nature of the molecules the degree ofalignment does however exhibit damped oscillatory behavior. These fast oscillationsare due to beatings between the rapidly oscillating phases of the highest J states in thewave packet (see below).
In spite of the fact that the J levels excited in the wave packet are much higherthan the ones populated thermally, it turns out that thermal averaging is even moreimportant for nonadiabatic alignment than for adiabatic alignment. For nonadiabaticalignment not only the degree of alignment but also the dynamical evolution is depen-dent on the initial state. Figure 2.4 shows the degree of alignment evolving from threedifferent initial states of tert-butyliodide after interaction with the 1 ps laser pulse de-scribed above. The left panel shows the degree of alignment immediately after thelaser pulse whereas the right panel shows the alignment in a time window at largerdelays. At short delays, the degree of alignment is somewhat different for the differentinitial states but the frequencies and phases of the oscillations are almost identical. Ona qualitative level they behave quite similarly. At the larger delays the behavior is dra-matically different for each of the initial states. For the initial state |JKM〉 = |333〉the degree of alignment is hardly dependent on time in the window shown. This is instrong contrast to the evolution of the degree of alignment evolving from the |000〉 and
17

18 Theory of alignment
|311〉 states where large oscillations are observed. The oscillations are almost exactlyout of phase.
Let us start by discussing the reason for the similarities at the early delays. Asstated previously, the interaction term surpasses the field-free energy by orders ofmagnitude. It is therefore hardly surprising that three different initial states evolveinto wave packets with very roughly the same content of J states — in all three casesthe peak of the distribution is at J ∼ 40. About two picoseconds after reaching itspeak value the intensity of the laser field becomes negligible and the evolution of thewave packet fully determined by the field-free evolution of each component given inEq. (2.19). From there we find that the J th component of the wave packet acquires aphase of
ϕJ = EJK∆t/~ = 2π(BJ(J + 1) + (A−B)K2
)∆t (2.23)
upon propagating for a delay of ∆t. In the case of linear alignment where K is aconserved quantum number, the second term contributes only to an overall phase shiftof the wave function and need not be considered. From this equation we can directlyextract the source of the ∼ 4 ps period for the oscillations in the degree of alignment:they are due to beatings in the phase of the high J states in the wave packet (which arethe ones with the highest population, see Fig. 2.3).
For a more detailed explanation we can write the temporal evolution of the observ-able 〈cos2 θ〉i(t) in Eq. (2.20) as
〈cos2 θ〉i(t) =∑
J′,J ′′Ci∗
J′(t0)CiJ ′′(t0)e
−i(EJ′′−EJ′ )∆t/~〈J ′KM | cos2 θ|J ′′KM〉
=∑
J′|Ci
J′ |2〈J ′KM | cos2 θ|J ′KM〉
+∑
J′2 |Ci
J′ | |CiJ ′−1|〈J ′ − 1KM | cos2 θ|J ′KM〉 cos
(ω
(1)J ′ ∆t− φ
(1)J′
)
+∑
J′2 |Ci
J′ | |CiJ ′−2|〈J ′ − 2KM | cos2 θ|J ′KM〉 cos
(ω
(2)J ′ ∆t− φ
(2)J′
),
(2.24)
with ∆t = t − t0 the delay from the time when the molecules became field-free,ω
(n)J′ = (EJ′ − EJ′−n)/~ and φ
(n)J′ is the phase difference at time t0 between the com-
ponents J ′ and J ′ − n of the wave packet. The equation shows three contributions tothe temporal evolution of 〈cos2 θ〉: a constant term, a term corresponding to beatingsbetween levels with ∆J = ±1 and a term with beatings between ∆J = ±2 levels.Beatings between states with ∆J > 2 cannot be observed in the time-evolution of〈cos2 θ〉 due to the selection rules for the cos2 θ operator. The strength of the oscilla-tions is determined by two factors: the weight of the beating states in the wave packet,|Ci
J ′ | |CiJ′′ |, and the matrix element of the observable, cos2 θ, connecting these states.
The first factor turns out to show large differences for the three states considered here;
18

2.3 Nonadiabatic alignment 19
for the wave packet emerging from the |000〉 state parity is conserved and only even Jstates are populated whereas for the wave packet emerging from the |333〉 state thereis an equal population in the even and odd J states. The similar appearance of theoscillations must therefore be due to the matrix elements, 〈J ′KM | cos2 θ|J ′′KM〉.As shown in Appendix A.1 these can be expressed in terms of Wigner 3-j symbols.By examining the properties of the Wigner 3-j symbols (see Zare [36, Table 2.4])it is found that the matrix element connecting states with ∆J = ±1 scales as J−2
whereas for the element connecting ∆J = ±2 the leading term in a series expansionis independent of J . With the distribution of J states peaking at high values of Jthe observable 〈cos2 θ〉 is not sensitive to the beatings between neighboring J states.The differences observed at the larger delays must be attributed to differences in theinitially excited wave packet. Both the relative phases and the population in the indi-vidual J states are different for each of the initial states. The absence of alignmentfor the wave packet excited from the |333〉 state can be attributed to the fact that itcontains an equal population in the even and odd J states — at t = 1/(8B) = 80 psthe ∆J = ±2 beatings for even and odd J states are exactly out of phase by π.
The result of a calculation taking into account the thermal averaging at a temper-ature of 1 K is shown in Fig. 2.5. For comparison the degree of alignment for thewave packet excited from the |000〉 state is shown. About half the oscillations seenin the 0 K calculation are absent in the 1 K calculation whereas the rest persist. Acloser inspection of the results reveal that the dynamics is perfectly periodic. At in-tervals spaced exactly by the rotational period of the molecule, Trot = 1/2B (B infrequency units) the initial wave packet is reconstructed [15, 21, 37–39]. This eventis called a revival and is a purely quantum mechanical effect which can occur whenthe corresponding classical motion is stable. The reason for this peculiar behavior isfound in the energy level structure of the molecule. If we consider the phase differenceaccumulated between two neighboring J states due to the field-free evolution
ϕJ − ϕJ−1 = 2π (2B ∆t) J, (2.25)
we find that at time delays of ∆t = Trev = 1/2B the phase difference between allneighboring states in the wave packet is exactly an integer multiple of 2π. The wavefunction is thus only changed by an unimportant overall phase. At the so-called halfrevival at time t = Trev/2 we see that the relative sign between the components ofthe wave packet alternates. We note that the fractional revivals at times Trevp/q (withp, q mutual prime numbers) contain rich dynamics beyond that observed in the time-evolution of 〈cos2 θ〉 [34, 37, 40, 41]
Fig. 2.5 reveals another general feature of nonadiabatic alignment. The averagevalue of 〈cos2 θ〉T away from the revivals is about 0.5, significantly higher than thevalue of 1
3 for the initial isotropic distribution. This elevated basis level for the degreeof alignment is sometimes referred to as the permanent alignment and is due to ananisotropic distribution of the angular momentum vectors after the interaction with
19

20 Theory of alignment
0.2
0.4
0.6
0.8
⟨ cos
2 θ ⟩ T
0 50 100 150 200 250 300 350
0.2
0.4
0.6
0.8
Time (ps)
⟨ cos
2 θ ⟩
T = 0 K
T = 1 K
FIGURE 2.5: Alignment of tert-butyliodide exposed to a non-resonant laser pulse with anintensity of 6 TW/cm2 and a pulse duration of 1 ps. The lower figure shows the dynamicalevolution of the degree of alignment from the laser pulse until past the first full revival(Trev = 319.7 ps) for a sample at zero Kelvin whereas the upper figure is for an rotationaltemperature of 1 K.
the laser pulse. In the wave packet very high J states become populated (Fig. 2.3)whereas M is conserved for the interaction with a linearly polarized laser pulse. Theresult is an ensemble with 〈J2〉T À 〈J2
Z〉T corresponding classically to the angularmomentum being confined close to the plane perpendicular to the polarization axis.The absence of angular momenta close to the polar axis (molecules rotating in theplane perpendicular to polarization axis) is the reason for the higher value of 〈cos2 θ〉[38]. Quantum mechanically we can ascribe the permanent alignment to the constantterm in Eq. (2.24).
2.3.2 Asymmetric topsIn the general case of asymmetric tops the numerical treatment becomes somewhatmore involved. Part of the reason for this was outlined in the section on adiabaticalignment. The Hamiltonian representing an asymmetric top interacting with a lin-early polarized non-resonant laser field is the sum of Eq. (2.2) and Eq. (2.5). As dis-cussed previously the asymmetric top basis is inconvenient since the matrix elementsof the interaction potential cannot be found analytically. Instead the wave function isexpanded in the symmetric top basis, but now K is no longer a good quantum number
|ψi(t)〉 =∑
J′,K′Ci
J ′,K′(t) |J ′K ′M〉. (2.26)
20
2.3 Nonadiabatic alignment 21
Inserting into the time-dependent Schrödinger equation and projecting onto a specificstate |JKM〉 the coupled differential equations for the expansion coefficients become
i~ CiJK(t) =
∑
J′,K′Ci
J′,K′(t)〈JKM |Hrot|J ′K ′M〉 δJ,J′ + 〈JKM |V |J ′K ′M〉
.
(2.27)The first term corresponding to matrix elements of the field-free Hamiltonian is readilyevaluated, see for instance Chapter 6 in Zare [36]. It is noted that the parity of K isconserved for this term. To evaluate the interaction term it is convenient to rewriteit in terms of Wigner rotation matrices since the matrix element is then reduced toan integral over a product of three rotation matrices which is readily evaluated usingEq (3.118) in Zare [36]. The interaction operator in Eq. (2.5) then becomes
V = −E20
4
23 ∆α‖D2
00 − 1√6
∆α⊥(D202 + D2
0−2)
, (2.28)
with ∆α‖ = αzz − 12 (αyy + αxx) and ∆α⊥ = αyy − αxx the parallel and per-
pendicular polarizability anisotropy. An angle independent term corresponding to anoverall energy shift has been omitted. From this expression we readily find the selec-tion rules K−K ′ = 0,±2 and J−J ′ = 0,±1,±2. The parity of K is thus conservedand a block diagonal representation of the Hamiltonian should be used in a numericalimplementation.
After the interaction with the laser pulse the molecules rotate free of external fieldsand the evolution is determined solely by the Hamiltonian in Eq. (2.2). In this case it isadvantageous to expand the wave packet in the eigenstates of this Hamiltonian ratherthan in the symmetric states. The transformation matrix is found by diagonalizingthe asymmetric top Hamiltonian in the symmetric top basis. With the wave packetexpressed in the field-free eigenstates the time evolution is merely a matter of phaseevolution for each of the basis states
|ψi(t)〉 =∑
J ′,τ ′Ci
J′,τ ′(t0) |J ′τ ′M〉 e−iEJ′τ′ (t−t0)/~. (2.29)
With the wave packet expanded in the asymmetric top basis a transformation backto the symmetric top basis must be carried out to calculate the expectation value〈cos2 θ〉i. Numerically this is still advantageous over direct propagation of the wavepacket in the symmetric top basis.
When observables like 〈cos2 θ〉T are considered at short delays after the alignmentpulse, asymmetric tops behave much like symmetric tops. Under the right conditionsan appreciable degree of alignment can be obtained in field-free conditions but themolecules only stay aligned for a brief period. The long term evolution of asymmetrictops is qualitatively different from the symmetric tops — it is not periodic on the timescale of the classical rotational period. The reason is that asymmetric tops do not
21

22 Theory of alignment
5 10 15 20 25 30 35
0.1
0.3
0.5
0.7
0.9
Radius (µm)
I(r)
/I0 a
nd d
Y/d
r
FIGURE 2.6: Radial intensity profile for the alignment (full line, ω0 = 25 µm) and probe(dotted, ω0 = 20 µm) laser pulses. Also shown is the relative detection probability prradius (dashed). All three curves are normalized to their peak value.
have the regular energy level structure of symmetric tops, thus a complete rephasingof the wave packet is not obtained. Rather, for near symmetric tops partial rephasingsare observed at times close to the revival time for the corresponding symmetric top.Partial rephasings are however also seen at other delays, more on this in Sec. 4.2. Themain message is that the global maximum in the degree of alignment is always foundduring or immediately after the alignment pulse for asymmetric tops.
2.3.3 Focal volume averaging
To obtain even qualitative agreement between calculations and experiments on non-adiabatic alignment it turns out to be important to consider the consequences of thevariation of the intensity of the aligning laser pulse within the volume being probed.This is particularly true for the experiments based on probing via single-photon res-onant dissociation where the probe efficiency remains high in a large region of thepump focal volume. The main reason for the importance of these considerations isthat the dynamical evolution of the degree of alignment is dependent on the intensityof the aligning laser field. More precisely, changing the intensity of the aligning laserchanges the population distribution in the excited wave packet so the period and phasefor the fast oscillations change.
Let us consider reconsider the example used above: tert-butyliodide at a rotationaltemperature of 1 K exposed to an alignment laser pulse with τ = 1 ps and I =6 TW/cm2. Now, however, we will calculate the evolution of 〈cos2 θ〉T when themolecules are probed with an efficiency proportional to the intensity of the probe laser.The spot sizes are chosen as ω0(align) = 25 µm and ω0(probe) = 20 µm. In Fig. 2.6
22

2.3 Nonadiabatic alignment 23
290 310 330 350
0.2
0.3
0.4
0.5
0.6
0.7
0.8
Time (ps)
⟨ cos
2 θ ⟩ T
290 310 330 350Time (ps)
FIGURE 2.7: Focal volume averaging effects in the degree of alignment for tert-butyliodide at a temperature of 1 K exposed to a 6 TW/cm2, 1 ps laser pulse. Left panel:peak intensity calculation, right panel: focal volume averaged result assuming a linearintensity dependence for probe efficiency.
the radial intensity distribution at the beam waist is shown for the alignment and probelaser beams assuming a Gaussian profile for both. Also shown is the relative detectionprobability as function of radius. For calculating this curve, it is assumed that thedetection probability is independent of the position in the longitudinal direction suchthat the probed volume has cylindrical symmetry — this is a reasonable assumptionfor our molecular beam experiments. In this case the yield from a cylindrical shell ofradius r and thickness dr is
dY = σ I(r) n dV = A exp
(− 2 r2
ω20,p
)r dr, (2.30)
with σ the photoabsorbtion cross section and n the number density of molecules. Therelative detection probability plotted in Fig. 2.6 is dY
dr normalized to its peak value. Inthe numerical implementation the probe focal volume (cut off at r = 1.7 ω0(probe))is divided into 30 cylindrical isointensity shells. Calculations are then carried outat intensities corresponding to the value in the middle of each shell and the results,〈cos2 θ〉T (I(r), t), are given a weight proportional to dY
dr . The result of such averag-ing is shown in Fig. 2.5 together with the result from a calculation only at the peakintensity. Clearly a lot of information is lost due to focal volume averaging. Unlesscare is taken to avoid these effects it might be important to remember what may liehidden under the observed results. This is especially true for experiments on strong-field ionization of molecules where intensity dependence and geometrical effects maybe strongly coupled [8, 42].
Carrying out the focal volume averaging does of course imply longer computa-
23

24 Theory of alignment
tional times but the situation is not as bad as it may appear. First of all, in the numer-ical implementation for the symmetric tops an adaptive step size routine was chosen.This saves time during the slow evolution in the low intensity regions. Further one canmake the size of the basis set dependent on the intensity, speeding up the calculationseven further in the low intensity regions. See Appendix A.3 for further details.
2.3.4 Anisotropic M distributionsAs noted previously, experiments show that in cold molecular beams the initial statesare not populated according to the Boltzmann distribution [3, 43–45]. In the Boltz-mann distribution the population is solely determined by the ratio of energy of thegiven initial state to the thermal energy kT . Degenerate M states are thus evenlypopulated for a given J . Experiments on seeded beams show that this is not the case.Choosing the molecular beam axis as the laboratory fixed X-axis, it is found that statesof high |MX | are suppressed. The origin of this discrepancy lies in the geometricalcross section for collisions between the seeded molecules and the carrier gas. For alinear molecule the geometrical cross section is different for edge-on and broadsidecollisions with the latter collision geometry leading to the largest cross section. Inthe classical limit high |MX | states correspond to molecules rotating with their inter-nuclear axes confined to the plane perpendicular to the the beam axis. These stateswill therefore primarily undergo broadside collision with the carrier gas atoms andsince both elastic and inelastic collisions may change the M quantum number a non-thermal distribution is created. The anisotropic distribution of M states correspondsto an alignment of the angular momentum vector and thereby an anisotropic distribu-tion of internuclear axis. The phenomenon is therefore often referred to as collisionalalignment.
To quantify the degree of anisotropy, one can approximate the distribution of Mstates along the beam axis for a given J by
ρX(J,MX) = PJ NJ [1 + a2P2(cos ϑ)] , (2.31)
with P2(x) the second Legendre polynomial, cosϑ = MX/√
J(J + 1) and PJ =exp(−EJ/kBT ) the Boltzmann probability for populating the given |JM〉 state. NJ
is a normalization constant chosen such that∑
MX
ρX(J,MX) = (2J + 1) exp(− EJ
kBT
). (2.32)
In most of our experiments the alignment laser is polarized perpendicular to the beamaxis. The distribution in Eq. (2.31) must therefore be rotated by 90 when the directionof the laser polarization is used as the polar axis. The distribution of M states is thisreference frame is
ρZ(J,MZ) =∑
MX
∣∣ dJMZMX
(π2
)∣∣2 ρX(J,MX), (2.33)
24

2.3 Nonadiabatic alignment 25
0 1 2 3 4 5 6
0.8
0.9
1.0
1.1
Mi
Rel
ativ
e po
pula
tion
FIGURE 2.8: Relative population of |J = 6, M〉 states parallel to the beam axis (circles)and perpendicular to the beam axis (triangles) using a2 = −0.3 in Eq. (2.31). Connectinglines serve to guide the eye; the dotted line marks the Boltzmann distribution where all Mstates are equally populated.
where dJM ′M (θ) are the elements of the reduced Wigner rotation matrix. Figure 2.8
shows the relative distribution of M states within the J = 6 subset obtained fromEq. (2.31) and Eq. (2.33) using a2 = −0.3. This value was chosen from the experi-ments by Friedrich et al. on I2 seeded in He [3]. From the figure we readily see thatthe probability for populating a given M level can be changed by more than 20 %along the beam axis and by 10 % perpendicular to the beam axis.
Since the dynamical evolution of the degree of alignment shows a strong initialstate dependence (see Fig. 2.4), one could be worried that these deviations from aBoltzmann distribution would affect observables like 〈cos2 θ〉T . To test this concerncalculations have been carried out using the initial state distribution represented inEq. (2.33). The upper graph in Fig. 2.9 shows the result from a calculation of the ther-mally averaged degree of alignment resulting from a 100 fs, 2.5 · 1013 W/cm2 pulseinteracting with I2 assuming a Boltzmann distribution at a temperature of 5 K. Thelower graph shows the difference between the calculation using the Boltzmann dis-tribution and one using the anisotropic distribution of M states. The deviations arenormalized to the permanent degree of alignment obtained for the Boltzmann distri-bution. In spite of changes in the M distribution of about 10%, the resulting degreeof alignment deviates only by a few percent and there are no qualitative differencesin the evolution. Calculations have also been carried out for CO2 using the resultsfrom Weida and Nesbitt [43]. Instead of using a J dependent value of a2, a constantvalue of −0.15 was chosen. From the results presented in their paper this represents aclear upper limit to the anisotropy under the conditions in our experimental setup (see
25

26 Theory of alignment
0.2
0.4
0.6
0.8
⟨ cos
2 θ ⟩ T
0 100 200 300 400 500
−0.01
0
0.01
0.02
Time (ps)
Fra
ctio
nal d
evia
tion
FIGURE 2.9: Upper graph: Degree of alignment for I2 exposed to a 100 fs,2.5 · 1013 W/cm2 laser pulse. Thermal averaging is carried out assuming a Boltzmanndistribution of initial states at a temperature of 5 K. Lower graph: difference between thecalculation using the Boltzmann distribution and one using Eq. (2.33) normalized to thepermanent degree of alignment for the Boltzmann ensemble.
below). The reduced value compared to I2 is at least partly due to the smaller veloc-ity slip between CO2 and He compared to I2 and He. The resulting differences wereonce again on a few percent. A final concern comes from the experiments on O2 byAquilanti et al. [44]. Their experiments show that the degree of collisional alignmentchanges dramatically within the molecular pulse, with the fast molecules in the lead-ing edge of the pulse exhibiting largest anisotropy. Since the anisotropies measured inFriedrich et al. [3] and Weida and Nesbitt [43] are averaged over the molecular pulsethey may underestimate the effect in the leading edge of the pulse where the moleculesare coldest and we therefore carry out our experiments.e As a worst case scenario wecan assume an anisotropy a2 = −1.0 and a very low temperature (at low tempera-tures the number of initial states that effectively contribute to the thermal averaging islow and the average becomes more sensitive to the actual states used). A calculationhas been carried out for I2 at a rotational temperature of 1 K with laser parameters asabove. On a qualitative level the result are hardly different from the result of a calcula-tion based on the Boltzmann distribution — nearly all deviations are within 5 % of the
eMolecular beam experiments using ns or shorter laser pulses are effectively using a velocity selectedbeam since the combination of a short interaction time and even a modestly tight focusing selects a smallfraction of the molecular pulse.
26

2.4 3D alignment 27
permanent level with a single point showing an 8 % deviation. Considering the largeuncertainties in the experimental determination of 〈cos2 θ〉 it is reasonable to assumea Boltzmann distribution for the initial states.
One flaw in the above argument is the fact that the conditions in the experimentsmentioned above do not match the conditions present in our experiments. In the ex-periments cited typical stagnation pressures were a few hundred Torr ·mm whereas inour experiments they are typically at least an order of magnitude higher. This leads toa significantly higher number of collisions. From the detailed investigation in Weidaand Nesbitt [43] it is still not clear what would happen at such high stagnation pres-sures. These authors do however speculate that the degree of collisional alignmentwill decrease at higher stagnation pressures. Our conditions may thus be even closerto the Boltzmann limit.
2.4 3D alignmentThe theory outlined above applies to the case when the alignment laser is linearlypolarized and it was shown that this can lead to control of the spatial orientation of onemajor axis in the molecule. Since most molecules are asymmetric tops with complexthree dimensional structures it is interesting to identify schemes for controlling thecomplete three dimensional orientation (or alignment) of molecules. To obtain thiskind of control the electrical field must have components in two orthogonal directionsin space: once control is obtained over two axes in the molecule the third axis willautomatically be fixed if the molecule is rigid.
The interaction potential created with electrical fields that are no longer linearlypolarized can be obtained from Eq. (2.1) by using the direction cosines (Eq. (3.36) inthe book of Zare [36]) to carry out the transformation between the space- and body-fixed components of the polarizability tensor. For an elliptical field the expression israther involved (see Eq. (6.3) in Larsen [46]) and will not be reproduced here. Themost important feature of the interaction potential for an elliptical field is that the po-tential now depends on all three Euler angles with the global energy minimum formolecules aligned with the axis of highest polarizability along the major axis of theelectrical field and the axis of second highest polarizability along the minor axis ofthe field. Please note, that for elliptical polarization the space fixed Z axis is con-ventionally along direction of propagation for the laser. To clarify the transition fromlinear to elliptical polarization it is more convenient to define a space fixed frame forthe latter case where the major axis of the electrical field defines the Z axis and theminor axis defines the X axis. In this frame the presence of the X component of theelectrical field breaks cylindrical symmetry and facilitates a mixing of M states. Justas a superposition of J states can lead to a confinement of the θ angle, a superpositionof M states can lead to a confinement of the φ angle (as noted previously rotations ofthe χ angle is already restricted in the case of linear polarization).
27

28 Theory of alignment
Several schemes have been suggested for three-dimensional alignment [20, 47,48]. A more detailed consideration of their individual strengths will be postponedto Chapter 8. For now the straightforward generalizations of the one dimensionalalignment schemes will briefly be outlined. In the adiabatic limit the physical pictureis clear. Just as for a linearly polarized field, an elliptically polarized field will slowlyguide the molecules into the most energetically favorable configuration with the degreeof alignment limited by the thermal energy of the molecule. The two important fieldparameters are the intensity and the eccentricity. The intensity will always be limitedby ionization of the molecules whereas the choice of eccentricity is more subtle. Itsvalue must be determined by a trade-off between the confinement of the axis of highestpolarizability compared to the confinement of the molecular plane to the plane ofpolarization. In the other limit where the molecules are exposed to a short pulse ofelliptical polarization things become complicated by the fact that we must considerthe dynamical aspect along with the properties of the interaction. In this case thechoice of eccentricity becomes restrained by the fact all three Euler angles must beconfined at the same time. In a simplified picture we can think of the molecules asgetting a kick around two perpendicular body fixed axes with different moments ofinertia. These kicks must lead to alignment at the same time so the eccentricity mustbe chosen the match the kick strengths to the moments of inertia. In a classical picture,the kick strength depends on the initial orientation of the molecule and the choice ofeccentricity becomes non-trivial.
28

CHAPTER 3
Experimental setup
Molecular alignment can be measured in a number of different ways. Many methodsrely on the fact that the interaction between polarized light and molecules depend ontheir relative orientation. Amongst these angle-dependent effects are linear dichroism[49, 50], the optical Kerr effect [51–54] and recently high-order harmonic generationin molecules has been shown to be very sensitive to alignment [55–59]. Measuring thechange of the rotational contour of a Raman transition has also been used to track thetransition from field-free states to pendular states [17]. Finally, adiabatic alignment hasbeen observed in an electron diffraction experiment [60]. In our lab we have chosena different approach that directly visualizes the orientation of the molecule: photo-fragment imaging, a technique also used by several other groups [21, 40, 61, 62]. Theidea of using photo-fragment imaging for studying molecular orientation is elaboratedbelow. The equipment used for inducing and measuring molecular alignment is thenintroduced.
3.1 Photo-fragment imagingAt the core of all our experiments lies the idea of using photo-fragment imaging to re-veal the spatial orientation of a molecule. Conceptually this approach is very straight-forward and consist of two steps. The first step is to make the molecule break up into
29

30 Experimental setup
charged fragments. This can, for instance, be accomplished through dissociation intoneutral fragments by a UV pulse followed by ionization at a later instant or throughmultiple ionization by a very intense laser pulse. In the latter case the multiply chargedmolecular ion is often not stable and rapidly breaks into charged fragments, a processcalled Coulomb explosion since it is the Coulomb repulsion between the nuclei thatdrives the fragments away from each other. In both cases it is crucial that fragmentsseparate according to the axial recoil approximation, that is, that their recoil veloc-ity is along the bond axis.a If this condition is fulfilled, the recoil velocities of thefragments carry direct information about the spatial orientation of the molecule. Forrapid dissociation of the fragments, this statement remains true even if the moleculeis rotating: as soon as the fragments start to separate the moment of inertia increasesand by conservation of angular momentum the angular velocity must decrease, thusfreezing the rotational motion. The second step is to measure the recoil velocity ofthe fragments. This can be carried out by using moderate electrostatic fields to projectthe ions onto a position sensitive detector. When using an appropriate configurationof electrodes and fields, the position of impact on the detector depends only on theinitial ion velocity. Further, the fragments arrive at times determined by their mass tocharge ratio so ion-specific detection can be accomplished by time-gating the gain ofthe detector. The experimentally measured quantity is thus the recoil velocity of onespecific fragment ion.
As an example, consider tert-butyliodide. For this molecule the absorbtion of266 nm light drives a n → σ∗ transition that leads to a fast and direct breakage ofthe C−I bond. The neutral iodine atom can subsequently be ionized and the recoildirection be detected. If, instead, an intense 800 nm pulse is used one may, for in-stance, rip off three electrons leading to an unstable triply-charged molecular ion thatcan fragment into a singly-charged iodine ion and some carbohydride fragments. Inboth cases the recoil velocity of the iodine ion contains information about the orienta-tion of the molecule or more precisely the direction of the C−I bond at the instant offragmentation. Repeating this measurement many times yields an ensemble-averageddistribution of orientations.
3.2 The setupTo carry out an experiment as described above a number of ingredients are needed.First of all, we need some laser pulses to induce and detect the alignment of the mole-cules. Secondly, charged particle imaging requires that the experiments be carried outunder high-vacuum conditions. Finally, in order to obtain a high degree of alignment
aFor polyatomic molecules it is easy to envisage scenarios where the axial recoil approximation is notvalid. For dissociation into neutral fragments a slow, indirect process will give the molecule time to rotatebefore dissociating and in Coulomb explosion a charge-asymmetric ion maybe created (having a relativeexcess charge in one side of the molecule) [63].
30

3.2 The setup 31
CCDMCP
GasValve
Ion
Laser beams
FIGURE 3.1: Schematic drawing off both vacuum systems — see text for details.
we must be able to prepare a sample of cold molecules.
3.2.1 Vacuum and detection system
For the experiments described in this Dissertation, two different vacuum systems havebeen used. The basic principle of operation is the same, but the more recently buildchamber offers some advantages. Figure 3.1 shows a sketch of the basic principle ofthe vacuum systems.
At first the molecules are mixed with a carrier gas and leaked into the vacuumsystem through a pulsed valve with a small nozzle. During this expansion the seededmolecules undergo a large number of collisions with carrier gas atoms. Eventually,all carrier gas atoms and seed molecules fly at almost the same speed — the gas hasbeen cooled. Since the seed gas can reach speeds higher than the local speed of soundthis process is called a supersonic expansion [64]. The cooling thus obtained canbe dramatic — sub-Kelvin temperatures have been reported by Even and co-workers[30, 31]. In the old chamber the molecular sample is sent into the pulsed valve us-ing a gas flow system. In this system a continuous flow of He or Ar at a pressure ofa few bar is bubbled through a liquid sample, dragging some molecules along. Thepulsed valve (R. M. Jordan, PSV C–211) is a Gentry-Giese type valve that producesgas pulses with a duration of 60 µs at a repetition rate of 20 Hz; translational androtational temperatures down to a few Kelvin can be obtained. Better cooling is ob-tained using Ar as carrier gas but the signal level is in general low compared to thatobtained with He. The superior cooling in Ar is due to the large momentum transferin each collision during the expansion, while the higher signal level in He is due tonarrower angular distribution for the heavy seed molecule caused by the large differ-ence in Mach numbers [64]. The superior cooling in Ar can partly be compensated bythe fact that higher backing pressures of He can used, typically 3–4 bars of He is used
31

32 Experimental setup
while only 1 bar Ar can be used, since the signal typically becomes too small at higherbacking pressures. In the new vacuum system we use an Even-Lavie valve. This valveis a miniaturized, solenoid-actuated valve that can operate at repetition rates of up to40 Hz. One major advantage of the valve is that the sample holder is placed inside thevalve body which can be heated to 250 C, thus facilitating the use of both liquid andsolid samples. Gaseous samples can be used by feeding an appropriate gas mixtureto the valve. Another advantage of this valve is that very high backing pressures canbe used — up to 100 bar of Heb — whereby sub-Kelvin cooling can be achieved. Inorder to maintain high-vacuum conditions with low pumping requirements the valvedelivers very short gas pulses with durations down to about 10 µs. Finally the valveuses a conical nozzle which reduces the divergence of the molecular beam and thusincrease the sample density in the interaction region. All in all the Even-Lavie valveshows superior performance on all parameters compared to the Jordan valve: a higherdensity of colder molecules with lower pumping requirements is obtained. As an ex-tra feature it possible to access much larger range of temperatures in the molecularbeam, see Chapter 5. Most of the experiments presented using this Dissertation werecarried out on the old system; only the experiments on adiabatic alignment and onphotoelectron spectroscopy were carried out in the new vacuum chamber.
In the vacuum chamber the molecules are sent towards the region where they in-teract with the laser beams. To reach the best possible vacuum conditions (thus min-imizing the background signal from the residual gas) the vacuum system is dividedinto two (new system) or three (old system) independent sections. In the new systemthe intermediate chamber was left out to minimize the distance between the pulsedvalve and the interaction region; this maximizes the sample density in the laser focus.Between each of the sections a small skimmer (Beam Dynamics) with an opening of1 mm in diameter is placed. First of all, this skimmer controls the width of the mole-cular beam that reaches the interaction region. Second, it enables differential pumpingwhereby a pressure difference of three orders of magnitude can be maintained. In theold vacuum system the typical operating pressure (that is with the pulsed valve run-ning) in the target chamber is in the range of 5 · 10−8 – 2 · 10−7 mbar whereas in thenew system the typical pressure is 3 · 10−9 mbar.
In the interaction region the molecular beam is crossed at right angles by a numberof focused laser beams (between two and four). As discussed above the measurementis carried out using one or more laser pulses to disintegrate the molecule into chargedfragments and measuring their recoil direction. For a point source of ions it is notdifficult to measure the recoil direction of the fragments — a homogeneous electricfield can be used to accelerate the ions towards a position sensitive detector [65].Under realistic experimental conditions we must however consider the spatial profileof the laser beam. In our experiments we typically use modest focusing (f# ∼ 30) and
bAr cannot be used since the high polarizability compared to He causes these atoms to form neat clustersat a backing pressure of about 30 bar [31].
32
3.2 The setup 33
obtain typical beam waists of about 30 µm and Rayleigh ranges of a few millimeters.Our ions thus come from a line source (with a length determined by the width ofthe molecular beam, 1 and 3 mm for the old and new vacuum system respectively)which would lead to a significant blurring of the image. This problem was solved bythe introduction of velocity map imaging by Eppink and Parker [66]. The techniqueexploits the fringing fields of electrostatic plates with circular apertures to project theions onto a position sensitive detector in such a way that the position on the detectoronly depends on the initial velocity of the ion, not on the spatial position (within somefinite volume). Further, since all ions of the same charge state experience the sameforce their acceleration and thus their velocity during the field flight is only dependenton their mass. The arrival time of a specific ion on the detector is thus determinedby its charge to mass ratio. In cases where the original distribution of ion velocitiespossesses cylindrical symmetry about an axis parallel to the plane of the detector thisdistribution can be retrieved from the two-dimensional projection by using the inverseAbel transform [66–68].
The detector used in our setup is a chevron-stacked micro-channel plate (MCP)backed by a phosphor screen (El-Mul Technologies). When an energetic particle (ki-netic energy above 1 keV) hits the detector a number of electrons are released fromthe surface layer. When a sufficiently high voltage difference (1500 V or so) is appliedbetween the front and back side of the MCP these electrons cause an avalanche in thematerial, creating a pulse of thousands of electrons. As the electron pulse propagatesthrough the material it remains confined in the transverse direction by the capillarychannels in the detector. If the phosphor screen is kept at a high potential comparedto the back side of the MCP these electrons are extracted from the MCP to the screenwhere their impact causes localized phosphorescence. This flash of light is a directmeasure of the position of the ion’s impact on the detector and can be recorded by acamera out-side the vacuum system. The detector can be gated by applying a shorthigh-voltage pulse to the front side of the detector and fragment-specific images canthus be recorded. In our data acquisition program these images are analyzed on a shot-to-shot basis to extract the position of each ion hit (typically about 10 ions are detectedper laser shot). In a normal experiment each data point is obtained by building a distri-bution of ion hits from 2,000 laser shots or more whereas the accumulation of 10,000shots is necessary for images that are intended to be Abel-inverted. Time-of-flightmeasurements, where the ion yield as function of flight time is recorded, can also becarried out by using the MCP as a fast, high-gain amplifier. Using capacitative readout to a fast oscilloscope it is possible to measure the small but rapid voltage changesinduced by the ions. Under typical conditions an extraction voltage of a few kV is usedto project the ions onto the detector. For our setup the time-of-flight is then betweenslightly less than 1 µs for protons and roughly 10 µs for iodine. Since we can applyfast high-voltage pulses with an adjustable width down to 90 ns and no common frag-ments have masses close to that of iodine, we can easily carry out selective detectionof iodine ions. Other ions can, of course, be used as well.
33

34 Experimental setup
In the new vacuum system we have also initiated work on the detection of elec-trons. In principle, electrons can be imaged by simply reversing the voltages on theextraction plates, but due to their very low mass they need special attention. Thething to worry about is stray magnetic fields, including the magnetic field of the Earth.For a charged particle accelerated by a voltage difference, V , moving in a homoge-nous magnetic field, B, the radius for the circular trajectory around direction of B isR =
√2mV/qB2. At a magnetic field strength of 1 Gauss and a voltage of 2 kV
this radius becomes about 1.5 m for electrons, not much larger than the distance fromthe interaction region to the detector (20–60 cm) and a deflection of many centimeters(i.e. the electrons not hitting the detector) would be the consequence. Heavy ions aremuch simpler; they have radii of hundreds of meters and therefore remain unaffected.Stray magnetic fields perpendicular to the TOF-axis can be removed by shielding thetime-of-flight region with a cylindrical sheet of µ-metal (metal of high magnetic per-meability) [69]. Stray magnetic fields parallel to the TOF axis are less critical: theyonly lead to a uniform rotation of the electron distribution around the TOF axis. Takingthe value of the Earth’s magnetic field (which has a large inclination angle in Århus)the angle of rotation can be estimated to about 5 for electrons accelerated at 1.5 kV.Further, in experiments using UV light care must be taken to avoid scattered light;if the photon energy is larger than the work function of steel, scattered light hittingthe repeller plate will have a very high probability for liberating an electron from thematerial and thus creating a very large background signal. A large fraction of the straylight can be removed by coating the electrostatic plates and the µ-metal with graphite.
3.2.2 Laser pulsesIn Figure 3.2 an overview of the laser setup is given. The workhorses of our laboratoryare two laser systems: a femtosecond laser and a nanosecond laser. The femtosecondlaser consist of an Ti:sapphire oscillator and two independent chirped pulse amplifiers.The output of the oscillator (Spectra Physics, Tsunami), a 88 MHz train of ∼100 fspulses, is used to seed the two amplifiers (Clark MXR, CPA 1000 and Spectra Physics,Spitfire-HPR), both operating at 1 kHz delivering 800 µJ and 2.3 mJ per pulse respec-tively. The nanosecond laser is an injection-seeded, Q-switched Nd:YAG laser (Spec-tra Physics, Quanta Ray Pro 270-20) operating at 20 Hz and delivering 9 ns pulseswith energies up to 1.5 J per pulse at 1064 nm. The nanosecond laser is locked elec-tronically to the femtosecond laser with sub-nanosecond jitter. This combination oflasers yields a very flexible setup where we are able to carry out experiments on bothadiabatic and nonadiabatic alignment. Further, we can probe the molecular alignmentusing two different processes with complementary advantages and disadvantages: res-onant dissociation and Coulomb explosion. The basic philosophy behind these twodetection techniques is discussed below, along with an overview of how the necessarypulses are generated. At first, however, the generation of the pulses used to inducemolecular alignment is discussed.
34
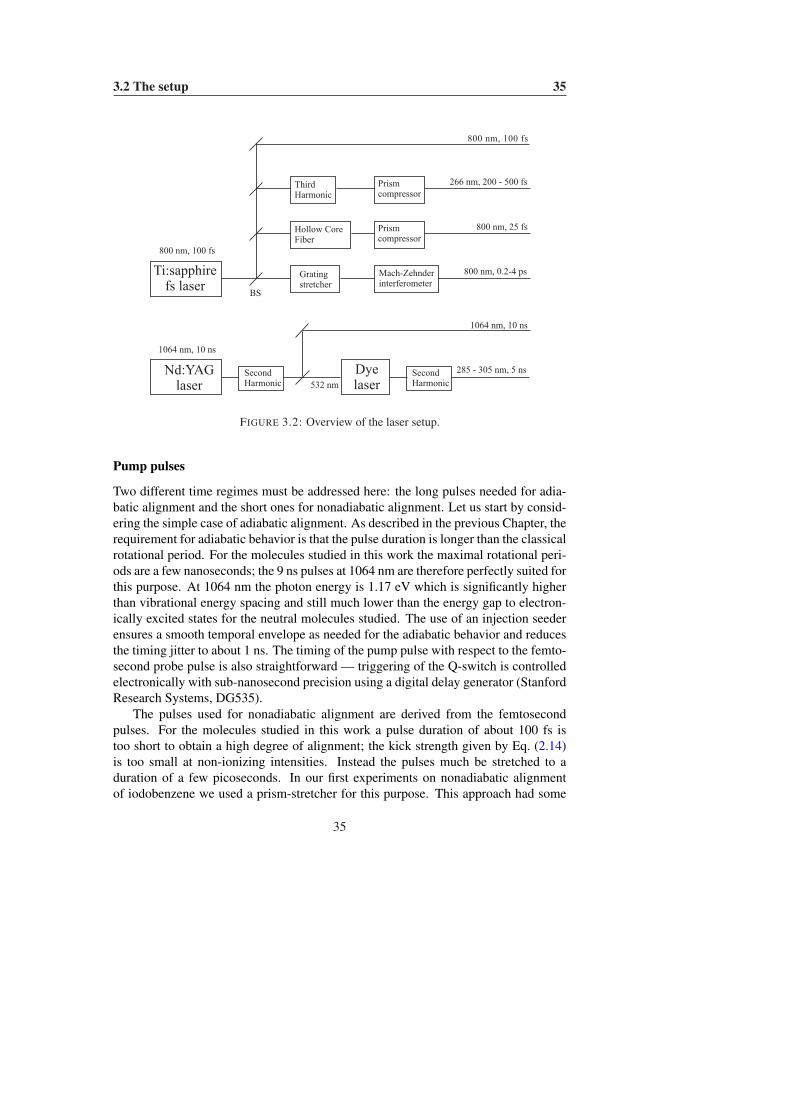
3.2 The setup 35
800 nm, 100 fs
Gratingstretcher
Mach-Zehnderinterferometer
1064 nm, 10 ns
SecondHarmonic
BS
266 nm, 200 - 500 fs
800 nm, 0.2-4 ps
285 - 305 nm, 5 ns
Ti:sapphirefs laser
Nd:YAGlaser
Dyelaser
1064 nm, 10 ns
532 nm
Hollow CoreFiber
Prismcompressor
800 nm, 25 fs
800 nm, 100 fs
SecondHarmonic
ThirdHarmonic
Prismcompressor
FIGURE 3.2: Overview of the laser setup.
Pump pulses
Two different time regimes must be addressed here: the long pulses needed for adia-batic alignment and the short ones for nonadiabatic alignment. Let us start by consid-ering the simple case of adiabatic alignment. As described in the previous Chapter, therequirement for adiabatic behavior is that the pulse duration is longer than the classicalrotational period. For the molecules studied in this work the maximal rotational peri-ods are a few nanoseconds; the 9 ns pulses at 1064 nm are therefore perfectly suited forthis purpose. At 1064 nm the photon energy is 1.17 eV which is significantly higherthan vibrational energy spacing and still much lower than the energy gap to electron-ically excited states for the neutral molecules studied. The use of an injection seederensures a smooth temporal envelope as needed for the adiabatic behavior and reducesthe timing jitter to about 1 ns. The timing of the pump pulse with respect to the femto-second probe pulse is also straightforward — triggering of the Q-switch is controlledelectronically with sub-nanosecond precision using a digital delay generator (StanfordResearch Systems, DG535).
The pulses used for nonadiabatic alignment are derived from the femtosecondpulses. For the molecules studied in this work a pulse duration of about 100 fs istoo short to obtain a high degree of alignment; the kick strength given by Eq. (2.14)is too small at non-ionizing intensities. Instead the pulses much be stretched to aduration of a few picoseconds. In our first experiments on nonadiabatic alignmentof iodobenzene we used a prism-stretcher for this purpose. This approach had some
35

36 Experimental setup
f
f + e
M1
M2G
L
(a) Grating stretcher
PBSTS
BS
l/2l/2l/2 TFP
(b) Modified Mach-Zehnder interferometer
FIGURE 3.3: Details from the optical setup.
major disadvantages: the apex to apex distance between the prisms had to be about2 meters and the temporal profile of the pulses was unsatisfactory, most likely dueto self-phase modulation in the SF11 prisms. Therefore we built a grating stretcher(Fig. 3.3(a)) allowing for easy tuning of the pulse duration. The input is a collimatedbeam of transform limited pulses. From the grating different frequency componentsof the beam are reflected at different angles so a cylindrical lens and a folding mirrorare used to image the beam back onto the grating. The beam reflected from the gratingis now both temporally and spatially chirped. To remove the spatial chirp the beamis reflected back towards the grating and makes another passage through the stretcher.The total group velocity dispersion (GVD) added to the pulse is [70]
d2φ(ω)dω2
= − 2 ε λ3
πc2d2
[1−
(λ
d− sin γ
)2]−3/2
, (3.1)
where λ is the wavelength, γ = 28.7 is the Littrow angle of the grating, d is thegroove spacing (d−1 = 1200 mm−1) and ε is the displacement of the grating fromthe focal point. With an input pulse duration of 100 fs we can obtain an output pulseduration of 2 ps with a displacement of about 1 cm. With careful alignment goodspatial and temporal profiles can be obtained.
In some experiments we used two alignment pulses to optimize the degree ofalignment. For maximum flexibility we wanted to be able to control both the rela-tive intensity and timing of the two pulses. This was obtained by building a modifiedMach-Zehnder interferometer (Fig. 3.3(b)). At the entrance of the interferometer weused a half-wave plate in front of a polarizing beamsplitter to adjust the relative en-ergy in the two pulses. A half-wave plate placed in one of the arms was used to rotatethe polarization by 90 and a translation stage enabled us to delay one of the pulsesby 0–1000 ps with respect to the other pulse. The two arms of the interferometerwere recombined on a 50/50 beamsplitter. The total pulse energy was controlled by ahalf-wave plate and a thin film polarizer placed before the interferometer.
36

3.2 The setup 37
Probe pulses
As already mentioned, we use two different probe techniques: resonant dissociationand Coulomb explosion. These probe processes each have their own strengths — forthe resonant dissociation we can, under some circumstances, extract the full angulardistribution of the molecule, whereas the use of Coulomb explosion is much moregenerally applicable since it does not rely on any specific transitions.
Several of our studies concern simple carbohydrides with a singly-bonded iodineatom: iodobenzene (C6H5I), methyliodide (CH3I) and tert-butyliodide (C4H9I). Com-mon to these molecules is the fact that they all absorb light at 266 nm via a n → σ∗
transition localized on the C−I bond. The promotion of an electron from a non-bonding orbital to an anti-bonding one leads to prompt dissociation into two neutralfragments with the iodine atom either in the ground state or in the spin-orbit excitedstate 0.943 eV above the ground state [71–76]. For iodobenzene there is a competingπ → π∗ transition that also leads to the formation of ground state iodine atoms. Inthat case the molecule is excited to a predissociative state that couples to the dissocia-tive state via vibrational relaxation. The dissociation then occurs to a vibrationally hotphenyl radical and thus an iodine atom with significantly lower translational energy[71, 73]. Hence the iodine atoms from this competing channel are easily separatedfrom those stemming from the direct dissociation channel by using the fact that thelatter ones occupy the outermost radial region on the detector. State selective ioniza-tion of the iodine atom can be obtained using 2+1 photon resonance-enhanced mul-tiphoton ionization (REMPI) using UV light at either 304.59 nm (ground state) or303.96 nm (excited state). For methyliodide Eppink and Parker [72] report a nearlyparallel transition for the I∗ channel in the n→ σ∗ transition and a small perpendicularcomponent in the ground state I channel; we observe similar behavior for iodoben-zene, in good agreement with the results from Unny et al. [76]. An advantage of usingthe I∗ channel for detection is the fact that dissociation induced by (weak) absorp-tion at 304 nm leads almost solely to the formation of ground state iodine. If bothalignment and probe laser pulses are linearly polarized (parallel to the detector) wecan reconstruct the three-dimensional distribution of recoil velocities, fion(θ), from itstwo dimensional projection via the inverse Abel transform. Since we know the angularselectivity of the probe, Pdiss(θ), we can thus find the angular distribution of the C−Ibond axis, f(θ), by using the relation
fion(θ) = f(θ) ·Pdiss(θ). (3.2)
It is in this step that the assumption of axial recoil is crucial: if the dissociation is non-axial the ion velocity distribution, fion(θ), will become a convolution of f(θ) ·Pdiss(θ)with the recoil distribution in the molecular frame. With the angular distribution for theC−I bond in hand, we have all the information we can possibly obtain with this probetechnique. For comparison with theoretical results we can, for instance, calculate the
37
38 Experimental setup
expectation value of cos2 θ as
〈cos2 θ〉 =∫
cos2 θf(θ) sin θ dθ. (3.3)
The major drawback of using UV dissociation as a probe is that the detection efficiencyfor molecules with the C−I axis perpendicular to the polarization of the UV pulse isclose to zero; planar delocalization is thus hard to detect. In many of our experimentswe have only been interested in seing whether the molecules are aligned or not; notto extract the exact degree of alignment. This can be accomplished by analyzing thetwo-dimensional distribution of ion hits that we obtain from the images. As long asthe molecule fragments via well-defined dissociation or Coulomb explosion channelsit is often possible to identify radial regions in the image that primarily contain contri-butions from a given channel. In our data analysis we can therefore extract the angulardistribution from a specific radial region and from this calculate the expectation value〈cos2 θ2D〉 for the two-dimensional distribution on the detector. Numerical simula-tions of adiabatic alignment show that there is a one-to-one correspondence between〈cos2 θ2D〉 and 〈cos2 θ〉 [46, Chap. 4.1]; it is our experience that 〈cos2 θ2D〉 in generalprovides a good qualitative measure for the degree of alignment. It is important tobear in mind that the value of 〈cos2 θ2D〉 is a convolution of the angular distributionof the molecule with the angular selectivity of the probe and can thus only be used asa relative measure for one specific molecule at a time.
The 266 nm light needed to dissociate the molecules is readily obtained as thethird harmonic of the 800 nm output from the femtosecond laser. A prism compressorconsisting of two Brewster-angle fused silica prisms is used to tune the pulse durationof the UV light; often pulse durations of about 500 fs are used to suppress multiphotonionization. To generate the UV light for REMPI we use the nanosecond laser. Thesecond harmonic of the output from the Nd:YAG laser (532 nm) is used to pump adye laser (Lambda Physik, ScanMate 2) using Rhodamine 640 dissolved in methanol.The output at ∼609 nm is then doubled in a thick KDP crystal and tunable UV light isgenerated with a narrow bandwidth (∼1 cm−1) determined by the dye laser.
For molecules that do not contain iodine and in cases where we do not need to ex-tract the full angular distribution we use Coulomb explosion to probe the orientation ofthe molecule. The basic idea is to rip off several electrons from the molecule in orderto create a very unstable molecular ion that rapidly dissociates due to the Coulomb re-pulsion between the nuclei. This requires a very intense laser pulse. Such a laser pulsecould exert a large torque on the molecules and thus on its own change the orienta-tion of the molecules before they dissociate. The most clear-cut Coulomb explosion isthus obtained by using very short pulses since the molecule will then dissociate beforedynamical alignment sets in. In our setup we use pulses with a duration of ∼25 fsand focused intensities on the order of 2 · 1014 W/cm2 [77]. These short pulses aregenerated from the 100 fs output of the laser by first broadening the spectrum usingself-phase-modulation in an argon-filled hollow core-fiber and then recompressing the
38

3.2 The setup 39
pulses in a prism compressor. When Coulomb explosion is used to probe molecularorientation we cannot extract the angular distribution of the molecules prior to ion-ization since several explosion channels with different angle and intensity dependenceare in general open. The distribution of ion recoil velocities can, however, still be usedto track changes in the degree of alignment on a qualitative level.
Combining the beams
In all of our experiments the different laser beams are overlapped collinearly. To ob-tain this we use combinations of dichroic mirrors or beamsplitters. The beams arethen focused onto the molecular beam using a f = 30 cm lens. In order to probeonly those molecules that have been exposed to the aligning laser field, we alwaysensure that the beam waist of the probe laser pulse at the intersection with the mole-cular beam is smaller than that of the aligning laser beam. This can be ensured byslightly de-focusing telescopes placed in the alignment laser beam. For the exper-iments involving the 1064 nm output from the nanosecond laser we use a standardBK7 anti-reflection coated lens, whereas for the experiments with the 266 nm beamas probe we use a custom-made achromatic lens (Eksma). The spatial overlap is ob-tained by first overlapping the beams in a 10 or 20 µm pinhole outsize the vacuumchamber and then optimizing an ion signal from the target molecule, for instance theC+ or I+ yield. For the short pulses we find the temporal overlap by carrying out across-correlation measurement in a BBO crystal, while the temporal overlap with thenanosecond pulses can be found using a fast photodiode and an oscilloscope.
39


CHAPTER 4
Nonadiabatic alignment
In this Chapter experimental results on nonadiabatic alignment induced by a shortnon-resonant laser pulse are presented. Results are presented for both symmetric andasymmetric tops. The first Section focuses on the evolution immediately after the laserpulse; the first 10 ps interval is the relevant time window for the iodine-containingmolecules considered in this work. In the second Section long-time the evolution isconsidered, focusing on the observation of revivals for both symmetric and asymmetrictops.
4.1 Post-pulse evolutionIn this first Section the dynamics of the rotational wave packet is considered in thetemporal region immediately after the pulse. In this region it turns out that if we onlyprobe the direction of the axis of highest polarizability the dynamics is on a qualitativelevel very similar for symmetric and asymmetric tops. Since we have carried out anextensive study on the alignment properties of the asymmetric top iodobenzene thisSection will focus on the asymmetric top case.
As stated in the previous Chapter the best quantitative measurement of linear align-ment we can carry out with the present setup is the measurement of the probabilitydistribution for the C−I bond axis. The detailed study of the alignment dynamics of
41

42 Nonadiabatic alignment
(a) No alignment (b) t = 2.5 ps (c) t = 6 ps (d) t = 8 ps
FIGURE 4.1: Alignment of iodobenzene detected by ion imaging of I+ ions created fromUV photo-dissociation followed by 2+1 REMPI of I∗. The images show the dynamicalevolution of the alignment induced by a 1.9 ps, 800 nm laser pulse with a peak intensityof 3 · 1012 W/cm2. t is the delay between the alignment pulse and the UV pulse.
iodobenzene was thus carried out using UV dissociation followed by REMPI of iodinefor the probe step. The polarizations of both of the UV beams and of the alignmentbeam are linear and parallel to the plane of the detector. For the results shown belowthe wavelength of the REMPI laser was tuned to ionization of I∗, but we note that iden-tical behavior is observed when ground state iodine is detected. Figure 4.1(a) showsan ion image of I+ ions obtained when a randomly oriented sample of iodobenzeneis dissociated by 266 nm light and the spin-orbit excited iodine atoms subsequentlyare selectively ionized. To obtain this image a background image, recorded with onlythe 266 nm pulse present, has been subtracted; multi-photon absorbtion at 266 nmleads, through dissociative ionization, to the creation of I+ ions with kinetic energiesoverlapping with those of iodine atoms from the neutral dissociation channel. Thebackground image typically accounts for about 10% of the total number of iodine ions— there is a tradeoff between getting enough signal and inducing dissociative ioniza-tion (and saturating the transition to the dissociative state in the neutral molecule). Theanisotropy in the image is a direct fingerprint of the parallel transition dipole for theneutral dissociation channel. Via Abel inversion of this image we can directly extractthe angular selectivity for our probe. Next, we include a 1.9 ps, 800 nm laser pulsewith a peak intensity of 3 · 1012 W/cm2. Fig. 4.1(b)–(d) show snapshots of the sub-sequent evolution. On the first image, at delay of 2.5 ps, a reduction in the angularwidth of the ion distribution is seen. This is a direct observation of macroscopic align-ment induced in the sample by the non-resonant laser pulse. The following imagesreveal a non-monotonous behavior for the angular width. Comparing the image takenat 6 ps with the one at 2.5 ps shows the rapid de-phasing of the components of thewave packet while the image at 8 ps shows a small, partial rephasing analogous to thedamped, oscillatory behavior in Fig. 2.5.
For a more quantitative discussion we can carry out the analysis described in theprevious Chapter and extract the angular probability distribution for each delay of the
42

4.1 Post-pulse evolution 43
FIGURE 4.2: Probability density plot for the polar angle θ showing the dynamical align-ment of iodobenzene. Left: Experimental measurement with a 2.2 ps pulse having a peakintensity of 3.4 · 1012 W/m2. Also shown is the expectation value of cos2 θ at each delay(triangles) and a cross-correlation of the alignment pulse (dashed line). Right: Numericalcalculation using a 3.8 ps pulse with a peak intensity of 6 · 1011 W/m2 at a temperature of400 mK.
probe pulse with respect to the pump pulse. The result is shown in the left panel of Fig-ure 4.2 along with the evolution of 〈cos2 θ〉 calculated from this distribution and withthe measured cross-correlation for the alignment pulse. Before the alignment pulsethe probability distribution is flat corresponding to a randomly oriented sample. Themeasurements during the alignment pulse should only be considered to be indicativeof the evolving dynamics since the temporal overlap of the 800 nm and 266 nm pulsescauses the opening of competing dissociative ionization channels leading to iodineions of higher kinetic energya as well as depletion to higher charge states. Since thehigher (total) charge state channels typically have higher angular selectivity, it is verylikely that the most well aligned molecules are removed and we thus underestimatethe degree of alignment. This explains the dip in the degree of alignment at the seconddata-point. At the end of the alignment pulse (around t = 2 ps) we see a peak in thedegree of alignment reaching a value of 〈cos2 θ〉 = 0.60: the molecules are alignedunder (nearly) field-free conditions! Following the maximum in the degree of align-ment comes a rapid (∼ 4 ps) decrease corresponding to the de-phasing of the wavepacket. In the angular distribution we see that within our time-resolution the peak inthe degree of alignment corresponds to the simultaneous build-up of density close toθ = 0 and decrease close to θ = 90. The apparent maximum in the probability den-sity at θ ≈ 5 is caused by centerline noise from the Abel inversion routine and thusan artifact resulting from our analysis; there is nothing in the raw images to support
aThe angular distribution is extracted by integrating over a small range of kinetic energies correspondingto the specific dissociation channel of interest.
43
44 Nonadiabatic alignment
such a shift in the maximum. After the peak in the degree of alignment the densityquickly decreases close to the polar axis and with a slight shift starts to build up in theequatorial plane. At the end of time range shown, a small increase in the degree ofalignment is seen corresponding to the rephasing in Fig. 4.1(d).
The right panel of Fig. 4.2 shows the angular probability density resulting from anumerical calculation using slightly different pulse parameters. On a qualitative levelthere is very good agreement between our measurements and the calculated results.All major features are well reproduced: the build-up at small angles, the depletion atlarge angles and the partial rephasing during the initial field-free evolution. One in-teresting feature in the numerical results that we were not able to fully resolve experi-mentally is shear angle of the ridge and crest in the interval 0–10 ps. What this showsis that the maximum probability density close to the polar axis is reached before theminimum in the probability in the equatorial plane. This is in good, qualitative agree-ment with the δ-kick model: it has the simple classical interpretation that a moleculestarting at large angles will lag behind a molecule initially oriented at a small anglewith respect to the alignment laser polarization, see Eq. (2.15).
Now that we have established that the rotational kick induced by a short, non-resonant laser pulse does indeed lead to alignment of iodobenzene molecules the ob-vious next step is to study how the induced dynamics depends on the parameters thatwe can control experimentally, for instance the intensity of the alignment pulse andthe temperature of the molecular sample.
Figure 4.3(a) shows how the induced alignment dynamics changes when the in-tensity is changed. For both curves the pulse duration is 2.7 ps and the moleculesare seeded in helium at a pressure of 3 bar. The circles (connected by a full line thatserves to guide the eye) show the data points measured when the alignment pulse hada peak intensity of 1.0 · 1012 W/cm2 while the triangles were obtained with a peakintensity nearly three times higher, 2.7 · 1012 W/cm2. Two overall changes are read-ily observed: the dynamics is significantly faster with the more intense pulse and themaximum degree of alignment is higher. These two observations have the same ori-gin, that the more intense pulse produces greater rotational excitation. With a broaderwave packet we can obtain better confinement but the different components also getout of phase faster — the rate of dephasing is proportional to square of the width of thewave packet in angular momentum space, ∆J [78]. This is a good example of a fun-damental property of nonadiabatic alignment: there is always a compromise betweenhow high a degree of alignment one can obtain and for how long it can be sustained.
The second parameter we can change is the rotational temperature. Experimentallythis can be carried out by changing the backing pressure in the supersonic expansion[64]. Fig. 4.3(b) shows measurements of the alignment dynamics with constant laserparameters but using 1 and 3 bar helium in the supersonic expansion. We see that forthe first four picoseconds or so the change between the curves looks like a constantshift. The reason that the rate of dephasing does not change significantly is that the Jstates populated in the wave packet are much higher than the one populated thermally
44

4.1 Post-pulse evolution 45
-2 0 2 4 6 80.32
0.40
0.48
0.56
0.64
<cos
2>
Delay (ps)
(a) Intensity dependence.
-2 0 2 4 6 80.32
0.40
0.48
0.56
0.64
<cos
2>
Delay (ps)
(b) Temperature dependence.
FIGURE 4.3: Measurement of the dependence of the degree of alignment, 〈cos2 θ〉, onthe rotational temperature and on the intensity of the alignment pulse for iodobenzeneseeded in He and exposed to a short 800 nm laser pulse. In both graphs the dotted curveshows a cross-correlation of the alignment pulse with a duration of (a) 2.7 ps and (b) 1.7 psrespectively. In (a) the full curve (circles) is with a peak intensity of I = 1.0 · 1012 W/cm2
and the dashed curve (triangles) is with I = 2.7 · 1012 W/cm2. Both experiments werecarried out with 3 bar backing pressure. In (b) the alignment pulse has a peak intensity of3.4 · 1012 W/cm2 and the full curve (circles) shows the degree of alignment obtained with1 bar backing pressure while the dashed curve (triangles) is for 3 bar backing pressure.
under both conditions (previous work suggests that the temperature in both cases isless than 10 K [18]). The reduced Boltzmann averaging at the lower temperaturetherefore primarily leads to an improved degree of alignment. At significantly highertemperatures we expect qualitative changes in the observed dynamics. However, withthe valve used for these experiments it was not possible to run the experiment undersuch conditions.
The final parameter that can easily be adjusted is the pulse duration and once againits optimal value is determined by two counteracting effects [38, 79]. On the one hand,the peak intensity of the alignment pulse is always limited by the onset of multi-photonionization and the degree of rotational excitation is (in the impulsive limit) determinedby the pulse area, Eq. (2.14) and [32]. This leads us to conclude that we do not wantvery short pulses. On the other hand, the primary strength of nonadiabatic alignmentis the possibility of obtaining alignment under field-free conditions. To obtain thisthe pulse must not be too long since then the maximum degree of alignment appearsduring the pulse and eventually rotational de-excitation takes place on the trailing edgeof the alignment pulse as we start to approach adiabatic behavior. Recent studies inour group show that the optimal pulse duration for iodobenzene is about 1 ps [79]. Forother molecules and temperatures we must expect other pulse durations to be optimalsince the dynamics depends on both the rotational constant and the polarizability.
45

46 Nonadiabatic alignment
4.2 Long delays — revivalsWith post-pulse alignment established, we are now ready to investigate the evolutionat larger delays. As discussed in the previous Section, we can, at least on a qualitativelevel, understand the behavior immediately after the alignment pulse by using classicalmechanics. For the wave packet dynamics at larger delays we must turn to quantummechanics. First, results for symmetric tops are shown; afterwards the more complexcase of asymmetric tops is treated.
4.2.1 Symmetric topsIn the context of laser-induced alignment, symmetric top molecules are very similarto the well-studied case of linear molecules: their interaction potentials with the laserhave the same mathematical expression and their energy level structure is nearly iden-tical. In fact, since K is conserved, the K-dependent contribution to the field-freeenergy for symmetric tops only leads to an unimportant overall phase shift for thewave packet during the field-free evolution. The only point where the two classes ofmolecules do differ is that their selection rules for Raman transitions are different: forlinear molecules we have ∆J = 0,±2 only while for symmetric tops ∆J = ±1 tran-sitions are also allowed when K,M 6= 0. All in all, this leads us so expect that theoverall behavior will be much like a linear molecule.
To settle this question and to bridge the gap between linear molecules and asym-metric tops (described below, but those experiments were carried out before the sym-metric top ones) we carried out a series of experiments on two symmetric tops:methyliodide (CH3I) and tert-butyliodide (C(CH3)3I). Unless otherwise noted, theUV dissociation + REMPI probe scheme was used for both molecules. For methylio-dide there is a significant contribution to the detected signal from molecules that havebeen dissociated by the 304 nm light. These ions are easily distinguished by to theirlower kinetic energy and the transition does not lead to any depletion effects since theREMPI pulse arrives 10 ns after the alignment and dissociation pulses.
Methyliodide
In the upper panel of Fig. 4.4 an experimental measurement of the alignment dynam-ics in methyliodide is shown. The alignment was induced by a 0.75 ps pulse withan intensity of 1.3 · 1013 W/cm2. The first data point shown is taken at 0.8 ps wherethe intensity of the alignment pulse is only a few percent of its maximum value. Injust 1 ps the wave packet dephases and the alignment drops to its permanent level.This is very similar to the results for iodobenzene show above, but the dynamicsis faster due to the lower rotational constant of methyliodide. From the figure it isclearly seen that the permanent level for 〈cos2 θ2D〉 = 0.75 is elevated compare to thevalue measured without the alignment pulse, 0.71. As discussed in Sec. 2.3, this is a
46

4.2 Long delays — revivals 47
0.65
0.69
0.73
0.77
0.81
⟨ cos
2 θ2D
⟩
0 10 20 30 40 50 60 70
0.3
0.4
0.5
0.6
0.7
Time (ps)
⟨ cos
2 θ ⟩
FIGURE 4.4: Dynamical alignment of methyliodide within one rotational period. Upperpanel: Experimental measurement using an alignment pulse with a duration of 0.75 psand an intensity of 1.3 · 1013 W/cm2. The dotted line marks the value of 〈cos2 θ2D〉 inthe absence of the alignment pulse. In the supersonic expansion 3 bar helium was used.Lower panel: Numerical calculation using an alignment pulse with the same duration butat an intensity of 1.0 · 1013 W/cm2 and assuming a temperature of 10 K. Focal volumeaveraging is included.
clear signature of the high rotational excitation via M -conserving transitions leadingto an ensemble with 〈J2〉 À 〈J2
Z〉. During the course of the first 75 ps we see thatthe permanent alignment level is interrupted by two short transients located at about34 ps and 67 ps. These are the half and the full revivals which correspond to briefrephasings of the wave packet — at the full revival the entire initial wave packet isreconstructed while at the half revival the even and odd J states are out of phase by π.From Eq. (2.25) and the known rotational constant [80] we expect the revival time tobe Trev = 1/2B = 66.655 ps. The experimentally determined revival time is in excel-lent agreement. We note that during the transient structure the molecules do not onlybecome aligned: at some delays we see that the value of 〈cos2 θ2D〉 drops below 0.71,the value for an isotropic distribution. At these delays there is a higher probability forfinding the molecules close to the equatorial plane rather than close to the polar axis,a phenomenon often referred to as planar delocalization or anti-alignment. Techni-cally, the term planar delocalization is probably more correct since the molecules areactually confined in a manner similar to the 2D-alignment that can be obtained with acircularly polarized laser pulse (at least in the adiabatic case). The extrema of the tran-
47

48 Nonadiabatic alignment
sient revival structures were measured with high statistics such that we could extractthe degree of alignment, 〈cos2 θ〉, prior to the probe; at the half revival the maximumand minimum values are 0.46 and 0.29 respectively while the degree of alignment atthe full revival changes between 0.31 and 0.49. The permanent degree of alignmentwas found to be 〈cos2 θ〉 = 0.39. These measurements agree with the information ex-tracted from 〈cos2 θ2D〉 and in particular it is worth noting that we do observe planardelocalization in spite of our low probe efficiency close to the equatorial plane.
For comparison, the lower panel of Fig. 4.4 shows the result from a numericalcalculation of alignment dynamics for methyliodide exposed to a 0.75 ps pulse withan intensity of 1.0 · 1013 W/cm2. The calculation assumes an initial temperature of10 K (which must be considered an upper limit to the actual temperature) and takesinto account the effects of focal volume averaging. Qualitative agreement between ex-perimental and numerical curves is very good, but a quantitative comparison exposessignificant differences. At first we note that the calculation is carried out at a reducedintensity. If the calculation is carried out with a peak intensity corresponding to theone quoted for the experiments the shapes of the revivals change dramatically — theybecome more symmetric such that the half revival consists primarily of one big dipand the full revival is dominated by one peak, both with small and symmetric oscil-lations on either side of the dip/peak. The experimental intensity is estimated fromthe duration and the energy of the pulse combined with the measured beam size at thefocus. We must therefore ascribe a significant uncertainty to the quoted number. Fur-ther an imperfect overlap would lead to an lower effective peak intensity. Therefore, itis reasonable to compare with calculations at a slightly lower peak intensity based onmatching the shape of the revival (which, for the full revival, is not very sensitive tominor temperature changes once focal volume averaging is taken into account). Thisdoes, however, still leave us with a clear discrepancy in the quantitative comparison.In the calculation the degree of alignment at the half revival takes the extreme values〈cos2 θ〉 = 0.62 and 0.22, while at the full revival we find 〈cos2 θ〉 = 0.29 and 0.68.The permanent degree of alignment is found to be 〈cos2 θ〉 = 0.45. These values,obviously, do not agree with the experimentally measured degree of alignment — inparticular the degree of alignment at instants when the molecules are aligned along thepolarization axis is strongly underestimated.
There are several factors that could lead to an underestimation of the degree ofalignment. The first is, of course, an imperfect overlap but based on the shape of therevival it is reasonable to assume that the peak intensities in the experiment and in thecalculation are fairly close (at lower intensities the maximum degree of alignment athalf revival becomes high relative to that at the full revival). A second cause mightbe found in our data analysis: the images are analyzed on a shot-to-shot basis andthe centroid of each ion hit is extracted. If the molecules are well aligned, ion hitson the detector will be highly confined and the individual ion hits may start to over-lap. We deal with this by calculating the asymmetry of the intensity pattern on thephosphor screen for each ion hit. For single ion hits the intensity distribution is nearly
48

4.2 Long delays — revivals 49
circular so a large asymmetry is a strong indicator of two overlapping ion hits. In theacquisition program we keep track of the number of hits with an asymmetry above acertain threshold and do always make sure that this number is kept reasonably low.In the event of a double hit this will only be counted as a single hit. At these mod-est degrees of alignment we do not believe this to be an important effect. The finalissue regarding the measurements is the intensity of the probe pulse. If the intensityis too high the transition to the dissociative state will be saturated. This will lead toa change in the angular selectivity and cause us to find a wrong angular distributionfor the neutral molecule. We have checked if saturation could be the reason for thestrong underestimate by comparing measured degrees of alignment at different inten-sities for the probe pulse. The conclusion was that we are close to saturation but notenough to strongly distort our measurements. We find in general that measurementsusing the photo-dissociation probe underestimate the degree of alignment comparedwith calculations. This is the case not only for methyliodide, but also for iodobenzeneand tert-butyliodide.
The discrepancy may instead have much more fundamental cause: iodine contain-ing molecules have large quadrupole hyperfine splittings [81–83]. Using first orderperturbation theory the energy shift due to the quadrupole interaction is found to be[36, 84]
∆EHF = 12 eQq0
[ 34C(C + 1)− I(I + 1)J(J + 1)
I(2I − 1)(2J + 3)(2J − 1)
](1− 3K2
J(J + 1)
), (4.1)
where C = F (F + 1) − J(J + 1) − I(I + 1) with I being the nuclear spin ( 52
for iodine) and F is the total angular momentum. Methyliodide, for instance, hasa rotational constant of B = 7.501 GHz but the quadrupole coupling is as large aseQq0 = −1.934 GHz [82]. This means that the field-free states are no longer therigid-rotor states, instead the hyperfine coupled states must be used and we see thatthe phase shifts induced by the hyperfine coupling are not negligible on the timescaleof Trev = 1/2B. Whether this is the cause for the discrepancy between the measuredand calculated degrees of alignment remains to be tested by explicit calculations.
Now that we have established the occurrence of revivals of the rotational wavepacket, one question that immediately comes to mind is: how long do the revivals per-sist? For a pure rigid rotor in a perfect vacuum we would expect the wave packet to ex-hibit perfect rephasing for indefinitely long, but in reality the molecule is not a rigid ro-tor and will not be in a collision-free environment (although a molecular beam comesvery close). Figure Fig. 4.5 shows a measurement of some later revivals in methylio-dide: the first, the second, the 16th and the 42nd. The most important conclusion fromthese measurements is that the revivals can indeed persist for very long times. Forthese measurements the temporal scan was purely limited by the length of the trans-lation stage we use to delay the probe pulse with respect to the alignment pulse. Ateach sub-figure a dotted line shows the position of the time t = n ·Trev + 0.4 ps. The
49

50 Nonadiabatic alignment
63 65 67 69 71
0.72
0.76
0.80
0.84
⟨ cos
2 θ 2D ⟩
129 131 133 135 137
1063 1066 1069
0.72
0.76
0.80
0.84
Time (ps)
⟨ cos
2 θ 2D ⟩
2797 2800 2803Time (ps)
1st 2nd
16th 42nd
FIGURE 4.5: Measurement of some late revivals for methyliodide seeded in 2 bar argon.Panels show the 1st, the 2nd, the 16th and the 42nd revival respectively. In each panel thedotted line marks the time t = n ·Trev + 0.4 ps where n is the order of the revival.
position of each revival conform remarkably well with the expected value. To obtainthis good agreement it is necessary to correct for the difference between the speeds oflight for 266 nm and 800 nm pulses propagating in air. A closer look at the figure does,however, reveal a small, gradual change in the shape of the revivals. The first and thesecond revival are almost identical in shape. As we continue to the 16th and furtherto the 42nd we observe two trends: 1) the maximum degree of alignment decreasesand 2) the dip after the peak in the degree of alignment becomes more pronounced. Itcould be tempting to ascribe observation 1) to an increasingly worse overlap. First ofall, we checked the stability of the translation stage by monitoring the focused probebeam in a 10 µm pinhole. Secondly, a poor overlap cannot explain the dip after thepeak in the degree of alignment. The origin of the observed change in the shape andmagnitude of the revivals lies in the fact that molecules are not rigid rotors: the averageangular momentum for the molecules is very high and the molecules therefore becomeslightly stretched compared to the equilibrium position. To a good approximation thiscan be accounted for by adding the centrifugal distortion term
ECDJK = −DJ [J(J + 1)]2 −DJKJ(J + 1)K2 −DKK4, (4.2)
to the field-free energies. Calculations of the alignment dynamics at these late revivalshave been carried out using values for the Di constants measured by microwave spec-
50

4.2 Long delays — revivals 51
troscopyb [80]. These calculations (not shown) reveal that the observed changes canall be attributed to centrifugal distortion [85]. Similar effects were also seen in N2
by Corkum and co-workers [40]. At the very low temperatures and densities in ourmolecular beam we do not see any effects of inelastic collisions. On top of the lowcollision rate in the molecular beam, the decoherence due to the inelastic collisionsbecome even further suppressed by the excitation to high J states in the moleculesince the rate of inelastic collisions decreases with J [86] . Further, the mere fact thatSussman et al. [23] were able to observe revivals persisting for hundreds of ps at roomtemperature and a pressure of 300 Torr also supports the neglect of collisional effectsin our experiments.
tert-butyliodide
Experiments have also been carried out on another symmetric top: tert-butyliodide.Fig. 4.6(a) shows a scan of the alignment dynamics for this molecule under conditionsmuch similar to those used for methyliodide; the alignment pulse had a duration of1.3 ps and an intensity of 8.9 · 1012 W/cm2. Apart from the different timescale due tothe increased moment of inertia, the trace is similar to that recorded for methyliodide(Fig. 4.4). Within one rotational period the permanent degree of alignment is inter-rupted by two transients: a half revival at about 162 ps and a full revival at 322 ps.The expected revival time for tert-butyliodide based on the rotational constant foundfrom microwave spectroscopy [87] is Trev = 319.8 ps, in perfect agreement with ourexperimental findings. The time for the half and the full revivals are both slightly off-set because the initial peak in the degree of alignment is off-set from t = 0 by about2 ps. The extremal points at the two revivals were measured with high statistics andthe degree of alignment calculated. At the half revival we found 〈cos2 θ〉 = 0.50 and0.28, at the full revival 〈cos2 θ〉 = 0.29 and 0.49. As for methyliodide these num-bers to not agree with numerically calculated ones although the shape of the revivalscompare well.
Fig. 4.6(b)+(c) show the half and full revival measured using the Coulomb explo-sion probe. These revivals are qualitatively very different from the trace shown inFig. 4.6(a). The reason is found by comparing with Fig. 2.7: in (b) and (c) only mole-cules from a small portion of the focus of the alignment laser beam are being probed.This can be obtained since the multiple ionization needed for Coulomb explosion hasa highly non-linear dependence on the intensity. By keeping the intensity of the probelaser low we effectively restrict the probe volume to a region smaller than the beamwaist (and the probe beam already has a smaller beam waist ωprobe/ωalign ∼ 2/3). Theeffect was discovered by accident on the old system, but was not investigated furthersince the signal levels were too low at the reduced intensities. Since then two ex-perimental improvements have paved the way for making experiments with strongly
bThe DK constant is not measured in the cited work, but just as the K-dependent term in the rigid-rotorenergy it only contributes with an overall phase to the wave function.
51

52 Nonadiabatic alignment
0 50 100 150 200 250 300
0.72
0.76
0.80
0.84
⟨ cos
2 θ 2D ⟩
150 155 160 165 1700.5
0.6
0.7
0.8
Time (ps)
⟨ cos
2 θ 2D ⟩
310 315 320 325 330Time (ps)
(a)
(b) (c)
FIGURE 4.6: Revivals for tert-butyliodide seeded in 3 bar helium. (a): A full scan of thealignment dynamics using the UV photodissociation probe. The alignment pulse has aduration of 1.3 ps and an intensity of 8.9 · 1012 W/cm2. The dotted line shows the valueof 〈cos2 θ2D〉 in the absence of the alignment pulse. (b) and (c): Half and full revivaldetected using the Coulomb explosion probe scheme. The alignment pulse duration is1.6 ps and the intensity 4.0 · 1012 W/cm2.
reduced focal volume averaging. First of all, a new amplifier was bought for thefemtosecond laser, delivering three times higher pulse energies and thus enabling usto increase the beam waist of the alignment pulse without reducing the peak intensity.Secondly, the molecular beam in our new vacuum system has a higher density andthus allows us to use probes with significantly lower ionization probabilities.
Symmetric tops versus linear molecules
In the beginning of this Section the similarities between linear molecules and symmet-ric tops were briefly outlined and it was mentioned that one would expect these twoclasses of molecules to behave similarly. The only two differences are the K depen-dent term in the field-free energy and the allowed ∆J = ±1 transitions. As alreadydiscussed the K dependent term is of no consequence since K is a conserved quantumnumber. The changed selection rules do, of course, make the two cases fundamentallydifferent, but using 〈cos2 θ〉 as observable effectively suppresses the beating betweenstates with J−J ′ = ±1 as discussed in connection with Eq. (2.24). Finally, the addeddegree of freedom for symmetric tops (rotation about the symmetry axis) makes a dif-
52

4.2 Long delays — revivals 53
ference for the thermal averaging when the temperature is above the energy spacingbetween the K = 0 and K = 1 subsets. For the heavy molecules considered here thisis not likely to make any major difference since a very large number of initial statesare populated already at one Kelvin no matter if the molecule is linear of a symmetrictop. Indeed the observed revivals for symmetric tops look very similar to those ob-served for linear molecules when differences due to nuclear spin statistics are takeninto account [21, 40, 51].
Oscillations beyond the up-down structure (as in Fig. 2.7(a) and Fig. 4.6(b)+(c))have only in one case been seen for linear molecules [21, 38, 39]. This is, however,just a matter of interaction strength. The most popular linear molecules, N2, O2 andCO2, all have small polarizability anisotropies combined with small moments of in-ertia. The small polarizability anisotropy keeps the coupling between adjacent levelssmall and the small moment of inertia means that the pulse must be kept very short toremain nonadiabatic. All in all the degree of rotational excitation was too low in thoseexperiments to observe such effects.
4.2.2 Asymmetric tops
The prediction of the field-free alignment dynamics for symmetric top molecules, inparticular the occurrence of revivals for the wave packet, was straight forward. Fromjust a few lines of algebra it was directly evident that in the rigid rotor approximationthe dynamics is periodic with the period Trev = 1/2B. But what do we then do inthe case of asymmetric tops? For these molecules there are no analytical expressionsfor the energy level structure. Further the wave packet induced by a sequence of Ra-man transitions is much more complicated in structure since M is the only conservedquantum number — in the basis of symmetric top eigenstates the wave packet is asuperposition of states with both J and K different. On the other hand partial rephas-ings of rotational wave packets in asymmetric top molecules form the foundation ofrotational coherence spectroscopy (RCS) [12, 13]. The wave packets formed in thoseexperiments, however, consist only of the superposition of a few eigenstates, dictatedby the selection rules for a single transition. For the extremely broad wave packetsneeded to induce a high degree of alignment, the content of the wave packet cannotbe obtained from the selection rules for a single transition since typically many tensof transitions are used to excite the wave packet as is revealed by the very high meanangular momentum (see Fig. 2.3). All in all, where does this leave us? For an experi-mentalist the best way to find the answer is to carry out the experiment. Experimentalresults on two molecules, iodobenzene (Fig. 4.7) and iodopentafluorobenzene, are pre-sented and discussed below. The observed results are compared to non-perturbativequantum mechanical calculations and then reconsidered in the framework of classicalmechanics.
53

54 Nonadiabatic alignment
a
b
c
Z,eq
c
FIGURE 4.7: Left: The principal axes of iodobenzene. Right: Definition of the Euler χand θ angles. The φ angle corresponds to a precession of the symmetry axis around thepolarization vector.
Experimental results
Our first experiments concentrated on studying iodobenzene. From the rotational con-stants, A = 5671.89 MHz, B = 750.416 MHz and C = 662.627 MHz [81], it isreadily seen that the molecule is a near-prolate top, as is also revealed by the asym-metry parameter κ = (2B − A − C)/(A − C) = −0.965. In the limit of a prolatesymmetric top κ takes the value −1. A good approximation for the energy level struc-ture is therefore
E(J,K−1) = BJ(J + 1) + (A− B)K2−1, (4.3)
where B = (B +C)/2 is the average rotational constant perpendicular to the symme-try axis. From our treatment of symmetric tops we would therefore expect revivals atTJ = 1/2B = 1/(B + C) = 707.7 ps where the revival time has been labelled TJ
for reasons that will become clear below.Figure Fig. 4.8(a) shows a scan in steps of 2 ps of the alignment dynamics in-
duced in iodobenzene by a 2.7 ps pulse with a peak intensity of 4 · 1012 W/cm2. Onceagain the alignment was probed using UV dissociation by a 266 nm pulse followedby REMPI of the iodine photo-fragments. After the pulse we see the post-pulse align-ment (Fig. 4.2) lasting just a few picoseconds. After the initial transient the value of〈cos2 θ2D〉 levels off at a value of 0.79, significantly higher than the 0.69 recordedwithout the presence of the alignment pulsec. This permanent alignment has exactlythe same cause as for the symmetric top case: the confinement of the angular momentaclose to the equatorial plane. During the first 800 ps we see the permanent level being
cThese data were recorded over the course of two days. The shift in the permanent level at ∼400 ps istherefore due to slightly different experimental conditions on these two days. Both the post-pulse alignmentand the transient at 380 ps were used to check that conditions were comparable.
54
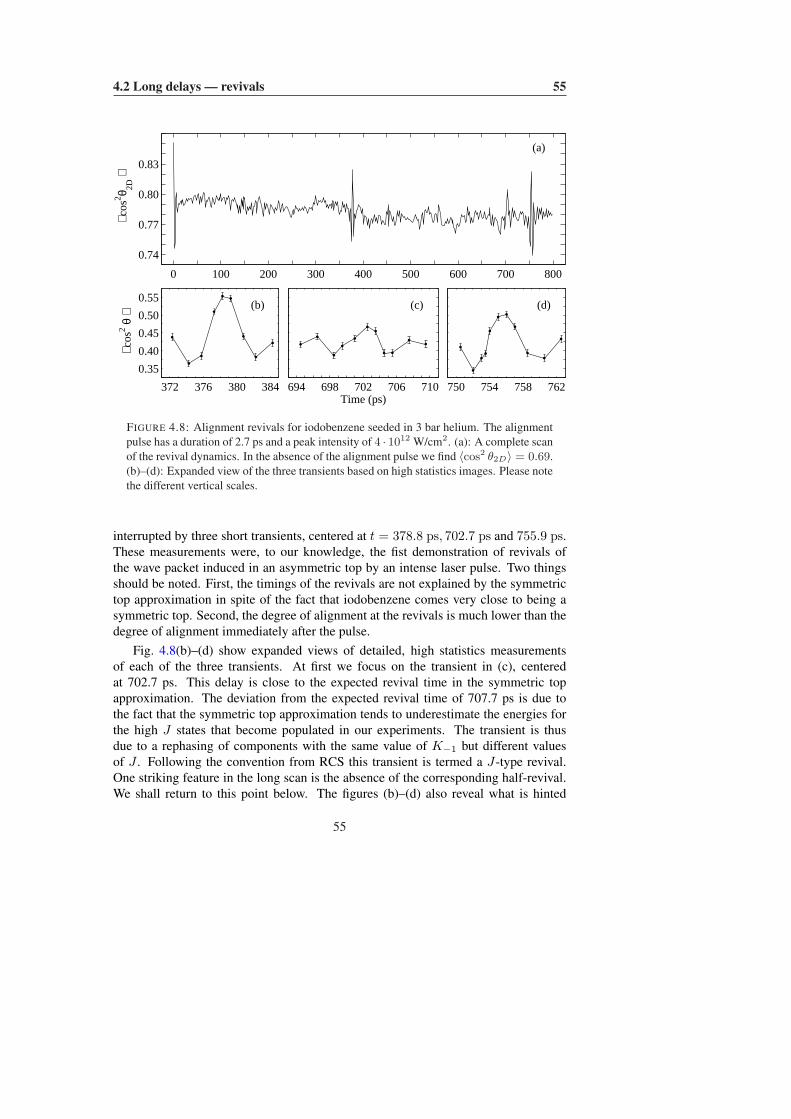
4.2 Long delays — revivals 55
0 100 200 300 400 500 600 700 800
0.74
0.77
0.80
0.83
⟨ co
s2 θ 2D ⟩
372 376 380 384
0.35
0.40
0.45
0.50
0.55
⟨ cos
2 θ ⟩
694 698 702 706 710Time (ps)
750 754 758 762
(a)
(b) (c) (d)
FIGURE 4.8: Alignment revivals for iodobenzene seeded in 3 bar helium. The alignmentpulse has a duration of 2.7 ps and a peak intensity of 4 · 1012 W/cm2. (a): A complete scanof the revival dynamics. In the absence of the alignment pulse we find 〈cos2 θ2D〉 = 0.69.(b)–(d): Expanded view of the three transients based on high statistics images. Please notethe different vertical scales.
interrupted by three short transients, centered at t = 378.8 ps, 702.7 ps and 755.9 ps.These measurements were, to our knowledge, the fist demonstration of revivals ofthe wave packet induced in an asymmetric top by an intense laser pulse. Two thingsshould be noted. First, the timings of the revivals are not explained by the symmetrictop approximation in spite of the fact that iodobenzene comes very close to being asymmetric top. Second, the degree of alignment at the revivals is much lower than thedegree of alignment immediately after the pulse.
Fig. 4.8(b)–(d) show expanded views of detailed, high statistics measurementsof each of the three transients. At first we focus on the transient in (c), centeredat 702.7 ps. This delay is close to the expected revival time in the symmetric topapproximation. The deviation from the expected revival time of 707.7 ps is due tothe fact that the symmetric top approximation tends to underestimate the energies forthe high J states that become populated in our experiments. The transient is thusdue to a rephasing of components with the same value of K−1 but different valuesof J . Following the convention from RCS this transient is termed a J-type revival.One striking feature in the long scan is the absence of the corresponding half-revival.We shall return to this point below. The figures (b)–(d) also reveal what is hinted
55

56 Nonadiabatic alignment
0 10 20
0.65
0.69
0.73
0.77
⟨ cos
2 θ2D
⟩
900 910 920 930 940Time (ps)
1.820 1.830 1.840 1.850 1.860
(a) (b) (c)
FIGURE 4.9: Revivals for iodopentafluorobenzene in 3 bar helium. The alignment pulsehas a duration of 2.5 ps and an intensity of 5.0 · 1012 W/cm2. Without the alignment pulsethe value of 〈cos2 θ2D〉 is 0.65.
from the long scan in (a): the two transients at 378.8 ps and 755.9 ps are very similarin shape and have a higher amplitude than the J-type revival. Taking a closer lookat the numbers we see that the difference in timing of the former two transients is377.1 ps so taking into account the off-set of the initial alignment peak with respectto t = 0 these transients form a periodic pattern. To find the origin for the transientsone must compare these numbers to the rotational constants of the molecule; althoughthe molecule does not have a regular energy level structure the field-free dynamics isstill solely determined by the moments of inertia, see Eq. (2.2). Using the rotationalconstants for iodobenzene we find that 1/4C = 377.29 ps revealing a very simplerelation to the structure of the molecule. In RCS this kind of transients is knownas a C-type rephasing and it has been shown that these are due to beatings betweencomponents with ∆J = ∆K1 = 2 [13]. The transients at 379 ps and 756 ps are thusthe first and second C-type revival. They appear because although the inertial tensoris close to that of a symmetric top, the polarizability tensor is highly asymmetricd,αa = 21.5 Å
3, αb = 15.3 Å
3and αc = 10.2 Å
3. An intuitive, classical model that
explains the occurrence of these two types of transients will be presented below.To test the influence of the asymmetry molecular structure we measured the align-
ment dynamics for a more asymmetric molecule: iodopentafluorobenzene. The rota-tional constants for this molecule have to our knowledge not been measured, but a verysimple estimate yields: A = 1026.6 MHz, B = 368.6 MHz and C = 271.2 MHz.The asymmetry parameter is readily found to be κ = −0.742. While the structureis considerably more asymmetric than iodobenzene the polarizabilties are remarkablysimilar: αa = 23.8 Å
3, αb = 17.9 Å
3and αc = 10.5 Å
3. Fig. 4.9 shows parts of a
scan of the alignment dynamics of iodopentafluorobenzene exposed to a pulse similarto that used in the iodobenzene experiments. After the pulse the molecules become
dLinear response theory calculation at 800 nm by M. D. Poulsen.
56

4.2 Long delays — revivals 57
well-aligned, at the maximum reaching 〈cos2 θ〉 = 0.57. In about 10 ps the wavepacket dephases and as for the other molecules studied here, the degree of alignmentlevels off to a permanent level. Within the first 2 ns, the permanent level is interruptedby the two transients shown Fig. 4.9 in (b) and (c). Their timing, t = 924 ps andt = 1845 ps, reveals that together with the initial alignment peak at ∼4 ps they forman almost periodic pattern (with a decreasing amplitude). The spacing between the re-vivals, 921 ps, fit well with TC = 1/4C = 921.8 ps based on the estimated rotationalconstants. What we have observed are therefore the first two C-type revivals. At thefirst revival the degree of alignment takes the extreme values 〈cos2 θ〉 = 0.32 and 0.44,while at the second revival we find 〈cos2 θ〉 = 0.33 and 0.42. Post-pulse alignment isonce again superior to the degree of alignment at the revivals. A J-type revival wouldbe expected to appear close to TJ = 1/(B + C) = 1563 ps. Experimentally we findno structures in a region of ±15 ps around this delay. The absence of a J-type revivalis ascribed to the larger asymmetry of this molecule, as confirmed by the numericalresults below.
Numerical calculations and classical considerations
To gain more insight to the appearance of revivals of asymmetric tops, in particularstudying how the relative strength of the J- and C-type revivals depend on variousparameters, a series of numerical calculations were performed by our collaborators,Edward Hamilton and Tamar Seideman. The results are included here because theycomplement the experimental results well.
All of results shown here were obtained assuming a rotational temperature of400 mK. This temperature is probably about an order of magnitude below the temper-ature of the molecules in our experiments. Nevertheless, it is reasonable to comparethese calculations directly with our experiments because the primary effect of ther-mal averaging is to remove the oscillatory structures away from the transients [88].The intensity of the alignment pulse is a parameter that can easily be changed exper-imentally and it is therefore worth considering how this affects the revivals. Further,the observed experimental results have, as previously discussed, contributions froma large region of the focal volume. Understanding the intensity dependence helps usin predicting the consequences of this averaging. Figure 4.10 shows a calculation ofthe alignment dynamics in iodobenzene at four different intensities for the alignmentpulse. The figure reveals that both the relative strengths and the shapes of the revivalsare dependent on intensity. At the lowest intensity we see that J-type revivals areclearly dominant while at the higher intensities C-type revivals dominate. This is invery good agreement with our experiments since they were carried out at a higher in-tensity than any of the calculations. The calculations also justify the absence of theJ-type half-revival. The revival structure overlaps with the oscillations from the firstC-type revival and it therefore seems reasonable to assume that it disappears due tothe spatial averaging.
57

58 Nonadiabatic alignment
To confirm the changes seen when we changed the molecule from iodobenzene toiodopentafluorobenzene another set calculations was carried out where the C-constantwas varied for an artificial molecule with all other properties identical to those ofiodobenzene. Fig. 4.11 shows the results. In (a) the symmetric top limit is recoveredby letting C = B and strong periodic revivals are observed. Fig. 4.11(b) shows theresult for iodobenzene (identical to Fig. 4.10(c)), while Fig. 4.11(c) and (d) show thechanges as we increase the asymmetry by lowering the C-constant. As we increase theasymmetry away from that of iodobenzene, we see that the J-type revivals completelydisappear while the C-type revivals become broader and consist of increasingly moreoscillations. The absence of J-type revivals agrees well with our experimental obser-vations. We did not observe an increased number of oscillations, but this is most likelydue to the spatial averaging.
Although the calculations presented above show good agreement with our exper-imental results and allow us to draw general conclusions from our limited number ofexperiments, it would be helpful to find a simple explanation for the appearance of theobserved revivals. It is, therefore, tempting to consider how we would expect the mole-cules to behave classically. Let us take iodobenzene as an example. Due to the highasymmetry in the polarizability and inertial tensors we need to consider the rotationaround all three major axes. The first step is to decompose the torque into its compo-nents along the three major axes. Take as an example a molecule with θ, χ 6= n · π
2 ,that is the electrical field vector is not coincident with any of the three planes spannedby the three principal axes. The component of the electrical field in the plane spannedby the b- and c-axes will induce a torque along the a-axis (see Fig. 4.7). This torquerotates the molecular plane about the a-axis such that the angle between this plane(spanned by the a- and b-axes) and the electric field is reduced. Similar torques applyalong the two other axes in order to minimize the energy of the molecule in the pres-ence of the field. If the pulse is truly short the torque is applied impulsively and themolecule starts to rotate after the pulse. The angular frequency is obtained as the trans-ferred angular momentum (the time-integral of the torque) divided by the moment ofinertia (see Eq. (2.15)). Since the polarizability anisotropies are of similar magnitudefor all three axes, the angular momentum components along each axis are similar. Themoments of inertia are, however, very different: the A-constant is nearly an order ofmagnitude larger than the B- and C-constants and the frequency of rotation aroundthe a-axis (rotations in the χ-angle) is thus much higher than the frequency of rotationaround the other two axes. For the slower motion perpendicular to the a-axis (rotationsin the θ-angle), the b- and c-axis effectively become indistinguishable — the moleculebehaves as a symmetric top with an effective rotational constant B = (B + C)/2.
The separation of time-scales that underpinned the preceding discussion alsomeans that, if the pulse duration is not truly short compared to the time-scale forre-orientation of the molecule in the field, there exist a range of pulse durations werethe symmetry axis becomes aligned after the pulse, but the molecular plane will beconfined to the plane spanned by the symmetry axis and the polarization of the laser
58

4.2 Long delays — revivals 59
FIGURE 4.10: Numerical calculation of the intensity dependence of the revivals iniodobenzene at 400 mK. The pulse duration is 2.6 ps and the peak intensity is (a)6.0 · 1011 W/cm2, (b) 1.0 · 1012 W/cm2, (c) 2.0 · 1012 W/cm2 and (d) 3.0 · 1012 W/cm2.
FIGURE 4.11: Numerical calculations showing how the revivals change at fixed laser pa-rameters but with changed values of the C-constant. The pulse duration is 2.6 ps, the in-tensity 2.0 · 1012 W/cm2 and the temperature 400 mK. While all other parameters are fixedthe C-constant takes the values (a) 787.44 MHz (prolate symmetric top), (b) 660.87 MHz(iodobenzene, ab-initio) (c) 500 MHz and (d) 300 MHz.
59
60 Nonadiabatic alignment
(i.e. χ ∼ 0) during the interaction with (the last part of) the pulse . In other words,the molecules are forced to rotate around the c-axis. For a molecule rotating with|J| ≈ Jc, that is with the angular momentum vector nearly parallel to the c-axis, theclassical frequency of rotation is 2CJ and our observable, which has no up-down se-lectivity will thus be modulated at 4CJ . These are all multiples of the fundamentalfrequency 4C and the molecules will thus rephase at TC = 1/4C [13]. The semi-classical model thus explains both the timing of J- and C-type revivals and why theseare only ones observed. To the latter point it should be noted that rotations aroundthe a-axis are not observable in 〈cos2 θ〉 and rotations around the b-axis are classicallyunstable.
If these semi-classical arguments hold true, the pulse parameters in the experimenton iodobenzene must have been in a regime between the two limiting cases presentedhere. Very recent results from our lab seem to confirm this simple interpretation. Inthose experiments revivals of iodobenzene were recorded for a range of pulse dura-tions under conditions where focal volume averaging could be neglected. For veryshort pulses strong J-type revivals were seen (including the previously missing J-type half-revival) while the C-type revivals were completely absent. For longer pulsesthe J-type revivals completely vanished but clear C-type revivals appeared with manyoscillations visible. At intermediate pulse durations both revival types were seen. Theabsence of focal volume averaging is crucial since the peak intensity of the alignmentpulse was shown to produce a similar modulation of the revivals (see also Fig. 4.10).
In the framework of RCS the appearance of partial rephasings for asymmetric topshas been know for many year. Besides using simple, semi-classical arguments as out-lined above, a thorough quantum mechanical analysis of the beat structures that formthe basis of the observed transients has been carried out. The somewhat surprisingresult that significant transients were seen even for highly asymmetric tops was sum-marized by Felker and Zewail [13] ‘The reason for this is that significant patches ofrotational-level structure in asymmetric tops retain symmetric-top regularities’. Withthis encouraging remark I will conclude this Chapter in the hope that future workwill shed more light on revivals for asymmetric tops in the framework of quantummechanics.
60

CHAPTER 5
Adiabatic alignment
Many experiments have unambiguously established and characterized adiabatic align-ment of linear, symmetric and asymmetric top molecules [17–19, 60]. In spite of this,there have been a multitude of motivations for studying this technique again. First ofall, adiabatic alignment served as a good testing ground for our new valve. Becauseadiabatic alignment is both simple and well studied it allowed us to examine the prop-erties of the valve. Second, the new valve has opened some new opportunities for usregarding both controlling the rotational temperature and the size of the molecules wecan study. These points have become important with the proposals for using alignmentas a tool in gas phase diffraction experiments on small molecules and even proteins[89, 90]. Third, our newly proposed scheme for obtaining three-dimensional align-ment (see Sec. 8.1) relies on the use of adiabatic alignment for fixing one axis of themolecule. Finally, independent of the previous points, alignment of negative ions wasattempted.
This Chapter starts with some considerations about the choice of an optimal probeof adiabatic alignment. The problem to worry about is whether the presence of amoderately intense infrared field disturbs the measurement. Next, results on adiabaticalignment on large molecules are presented, demonstrating wide control over the tem-perature of the molecular beam. Finally the attempts to align negative ions are brieflyreviewed.
61

62 Adiabatic alignment
5.1 Choosing the probe
For the study of adiabatic alignment it is of particular importance to pay attention tothe choice of probe. The primary effect to worry about is the presence of the aligninglaser field — to obtain a high degree of alignment it often necessary to work at inten-sities close to the onset of ionization. The alignment pulse may therefore change theprobe process in an unpredictable manner. This has been the case in previous experi-ments in our lab where UV photodissociation was used to probe adiabatic alignmentof iodobenzene [91]. In that case the presence of the alignment laser opened a newdissociation channel into I∗ fragments with higher kinetic energy. It was shown thatthis new channel corresponded to the absorbtion of one photon from the alignmentlaser during the dissociation, a process that may be expected to be quite general forpolyatomic molecules where the density of excited states often becomes high.
Therefore, in our recent studies of adiabatic alignment we turned to Coulombexplosion for probing the alignment. Some caveats do however also pertain to thisprocess, in particular if the ionization pulse is not ultra-short. For the experimentspresented below ionization pulses with a duration of ∼ 130 fs and intensities of1 − 3 · 1014 W/cm2 were used. The red curve in the lower panel of Fig. 5.1 showsa mass spectrum that was obtained by ionizing iodobenzene with a pulse polarizedperpendicular the flight direction and with a peak intensity of 3.4 · 1014 W/cm2. Onlya small amount (a few mV) of the molecular ion was seen, but is not shown in thefigure. In the spectrum the most important peaks have been assigned. A profounddisintegration of the molecule is revealed: iodine ions are found in charge states upto 4+ and carbon is primarily found as single carbon ions (the peaks to the left ofiodine 2+, 3+ and 4+ respectively are CnH+
m fragments with n = 4, 3, 2). The blackcurve shows the spectrum obtained when we include a 1064 nm pulse with a durationof 9 ns and a peak intensity of 8.0 · 1011 W/cm2 to align the molecules parallel to thepolarization of the ionization laser (and thus perpendicular to the flight direction). Thepeak intensity is about a factor of four below the onset of ionization. In spite of thelow intensity the nanosecond pulse has a profound effect on the spectrum. All carbonfragments larger than C+
2 almost completely disappear while the yield of I3+ ions isnearly doubled. Further we observe a narrowing of the I+ and I2+ peaks, caused byalignment of molecules prior to ionization. To get an indication of what causes thevery different yields we recorded another mass spectrum where the only change isthat the nanosecond pulse is now polarized perpendicular to the ionization laser. Thered curve in the upper panel of Fig. 5.1 shows the result together with the spectrumobtained for parallel polarizations (same as in the lower panel). The changes in thespectrum are astonishing: iodine in high charge states (3+ and 4+) has completelydisappeared from the spectrum. The yield of the doubly charged iodine ion is alsostrongly suppressed and the peak has become split, just as the peak for singly chargedions. This splitting is a manifestation of alignment: for the perpendicular polarizationsthe alignment laser is polarized along the flight direction, so if the molecules are well
62

5.1 Choosing the probe 63
2468
101214
Sign
al (
mV
)
20 40 60 80 100 120 140
2468
101214
m / q
Sign
al (
mV
)
||
⊥
||No
I+
I2+I3+
I4+
C+
C2+
C6H
n+
FIGURE 5.1: Mass spectra for iodobenzene. For all curves ionization is caused by a 130 fs,800 nm pulse polarized perpendicular to the flight direction and with a peak intensityof ∼ 3.4 · 1014 W/cm2. In the lower panel the red curve show the spectrum with onlythe 800 nm pulse present. The other graphs show the spectra obtained by including a9 ns, 1064 nm pulse (I ∼ 8.0 · 1011 W/cm2, polarization parallel to the 800 nm). Thepolarization of the 1064 nm pulse relative to 800 nm pulse is shown in the legends.
aligned along this direction some ions are ejected directly towards the detector whileothers go off away from the detector and have to be turned around in the extractionfield before they fly towards the detector. The flight time for the latter ones is thuslonger and they appear as larger masses. The minimum in center is due to the absenceof molecules aligned perpendicular to the flight direction. For the carbon ions only theC2+ yield is strongly influenced.
So, what can we learn about the ionization process from these observations and,in particular, what influence does it have on our choice of probe for detecting align-ment? An important question to settle is which effects are due to further ionizationof the fragments caused by the presence of the alignment laser and which are due toalignment of the neutral molecule prior to ionization by the short pulse. The resultsstrongly indicate that the large carbon fragments, CnH+
m (n = 3, 4, 6), are ionizedby the 1064 nm laser pulse: a strong modulation of their yields are observed whenthe alignment laser is included independently of how the molecules are aligned. Incontrast to this behavior, the highly-charged iodine ions bear evidence of preferentialionization when the C−I bond is aligned along the polarization of the short laser pulse.The dramatic change in their yields, observed when comparing the parallel and per-
63

64 Adiabatic alignment
pendicular polarizations of the two laser, does not on its own tell anything about thecause for the changes. The fact that an almost similar modulation is observed whengoing from no alignment to perpendicular alignment, is what indicates a strongly pref-erential ionization of molecules aligned parallel to the polarization of the ionizationpulse. The changes from no alignment to parallel alignment conform well with thispicture: the yield of singly charged iodine ions is reduced by depletion into highercharge state channels, whose yield are then enhanced. By changing the rotational tem-perature of the sample it would be possible to check if this interpretation is correct.Even better, a similar experiment should be carried out on field-free aligned mole-cules. Although the limited experiments shown here cannot unravel the mechanismbehind the strongly preferential ionization for channels leading to high charge statesof iodine, we speculate that enhanced ionization is at play [8, 9]. To try to settle thispoint studies should be carried out on field-free aligned molecules with a range ofdurations and intensities for the ionization pulse.
For the present, the purpose of these studies was to clarify which probe geometrywe should use. It is immediately clear that the parallel geometry is ill-suited. Thehigher charge states of iodine cannot be used since the recoil direction of these frag-ments is highly directional even when the molecules are not aligned so their angulardistributions cannot be used. Tracking the changes in the yield of these ions as func-tion of the intensity of aligning laser field does not give an unambiguous measure ofalignment. Singly charged iodine cannot be used either — as evidenced by the lowerpanel in Fig. 5.1 there is a pronounced depletion from this channel when the moleculesbecome aligned so the ions would primarily stem from the low intensity regions of thefocal volume. The perpendicular channel is contrarily well suited for the detectingalignment. First of all, it is unbiased in the plane of the detector meaning that for anunaligned sample the detected distribution is circularly symmetric. Second, since thehigh charge states are so strongly suppressed, the only depletion effects to worry aboutare for weakly aligned molecules. In that case there may be a relatively larger fractionof the signal stemming from the outer regions of the focal volume due to depletion ofthe high intensity regions. This effect was minimized by reducing the peak intensity ofthe short pulse to ∼ 1.0 · 1014 W/cm2. At this intensity the channels leading to singlyand double charged iodine ions become dominant.
For the other molecules studied in this Chapter the modulation of the mass spec-trum for parallel versus perpendicular polarizations of the alignment and ionizationpulses was far less dramatic than what we observed for iodobenzene. Maybe the useof different intensities and pulse durations for the ionization pulse could lead to similareffects. For now we shall stay pleased with the absence of these effects as it gives us aprobe method that we can have high confidence in.
64

5.2 Large, cold molecules 65
5.2 Large, cold moleculesWe have just seen that strong evidence for the alignment induced by a nanosecondpulse can be found in the mass spectrum. A more direct measure for the alignmentinduced in the molecules can be obtained from the angular distribution of selectedfragments, just as it was done in the previous Chapter. In this Section results are pre-sented on adiabatic alignment of four molecules: iodobenzene, p-diiodobenzene, 3,4-dibromothiophene (DBT) and 4,4′-dibromobiphenyl (DBBP). The structure of thesemolecules is shown in top row of Fig. 5.2. For all of the molecules we used the per-pendicular pump-probe geometry with the short, intense (1 · 1014 W/cm2) probe pulsepolarized perpendicular to the plane of the detector while the alignment pulse waspolarized parallel to the plane of the detector. Images were recorded for a range of in-tensities of the alignment pulse (to the onset of ionization) and for a range of backingpressures. The fragments chosen were I+ for iodobenzene and p-diiodobenzene, S+
for DBT and Br+ for DBBP.In the middle row of Fig. 5.2 false color-scale ion images obtained with only the
probe pulse present are shown. All four images are as expected circularly symmetric(for the iodobenzene image a small detector inhomogeneity is revealed). In the DBTimage the center has been cut out. The reason is that S+ has the same m/q as O+
2 , soa small amount of O2 from the molecular beam gives rise to a big, concentrated peakin the center (these ions nearly have zero recoil velocity). The lower row of imageswere obtained by including the alignment pulse with an intensity just below the onsetof ionization and with the coldest possible molecular beam conditions. The contrastis striking. For all four molecules we observe a very strong confinement of the recoildirection for the detected fragments. Since the probe pulse is unbiased in the planeof the detector this is direct evidence of alignment of the neutrals prior to Coulombexplosion. In the cases of iodobenzene and p-diiodobenzene two channels with distinctkinetic energies are seen in the outer regions of the images. These correspond thecreation of I+ with a singly and doubly charged counter-ion respectively. As a measurefor the degree of alignment we chose 〈cos2 θ2D〉 (Sec. 3.2.2). The angular distributionused to calculate this number is extracted from the region dominated by the channelcorresponding to a singly charged counter-ion. For DBT and DBBP a less well definedradial structure is seen and the radial distribution was thus extracted from broad radialrange covering most of the peak. The ion hits just outside the cut-out region in theDBT image are most likely O+
2 from thermal oxygen in residual background gas inthe interaction region.
After establishing that the molecules do indeed become strongly aligned by the9 ns pulse and having defined the radial region of interest for extracting 〈cos2 θ2D〉,we are now ready to conduct a systematic study of adiabatic alignment of these mole-cules. For a given molecule two parameters determine the degree of alignment: theintensity of the alignment laser and the rotational temperature of the molecules (seeFig. 2.2). As already discussed the rotational temperature can be controlled by chang-
65
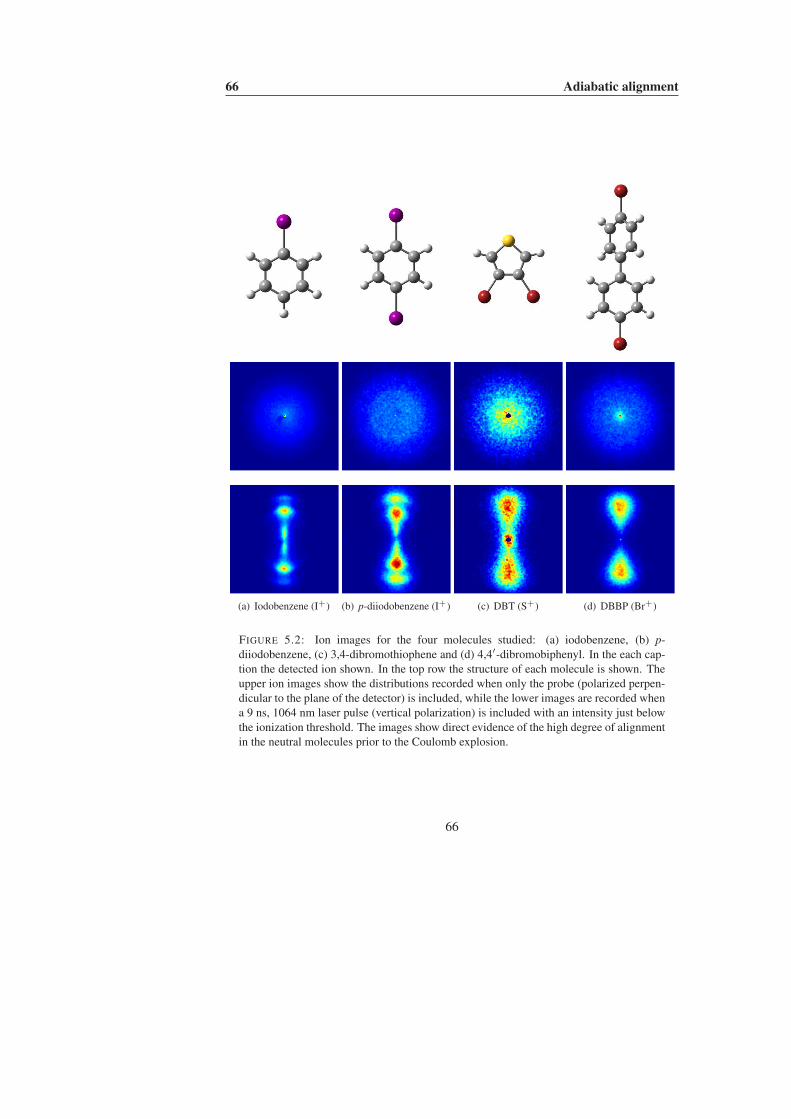
66 Adiabatic alignment
(a) Iodobenzene (I+) (b) p-diiodobenzene (I+) (c) DBT (S+) (d) DBBP (Br+)
FIGURE 5.2: Ion images for the four molecules studied: (a) iodobenzene, (b) p-diiodobenzene, (c) 3,4-dibromothiophene and (d) 4,4′-dibromobiphenyl. In the each cap-tion the detected ion shown. In the top row the structure of each molecule is shown. Theupper ion images show the distributions recorded when only the probe (polarized perpen-dicular to the plane of the detector) is included, while the lower images are recorded whena 9 ns, 1064 nm laser pulse (vertical polarization) is included with an intensity just belowthe ionization threshold. The images show direct evidence of the high degree of alignmentin the neutral molecules prior to the Coulomb explosion.
66

5.2 Large, cold molecules 67
ing the backing pressure in the supersonic expansion. Figure 5.3 summarizes the re-sults obtained for the four molecules. Shown is 〈cos2 θ2D〉 as function of intensity ofthe alignment laser for different backing pressures. The data points stop at roughly thehighest intensity that could be used without causing ionization. A quick look at thefour graphs reveal a very similar behavior: when high backing pressures are used themolecules become very well aligned at modest intensities, whereas for low backingpressures only a small degree of alignment can be obtained at non-ionizing intensities.Comparing the graphs in Fig. 5.3 with Fig. 2.2 immediately reveals that we have avery high degree of control over the temperature in the molecular beam (the x-axisshould be re-scaled according to the polarizability anisotropy). Below, the results foriodobenzene are used to set an upper limit of 1.5 K on the rotational temperature andvery likely the molecules are colder. From the low pressure results in Fig. 5.3(b)–(d)we roughly estimate the rotational temperature to be ∼ 50 K. This large dynamicalrange has not been accessible before, but may turn out to be very helpful for studiesusing adiabatic alignment.
Two comments on the pressures used should be given. First, for iodobenzene andp-diiodobenzene the maximum pressures shown are quite low. Higher pressures (up to100 bar) were also used, but lead to curves identical to the curve for the highest pres-sure shown. Second, the absolute pressures should not be directly compared betweenthe different molecules since another parameter was also changed: the magnitude ofthe driving current for the solenoid. The amplitude of this current determines ampli-tude of the excursion for the plunger. We have observed that the temperature of themolecular beam (the width of the gas pulse) is sensitive to this amplitude, so we havechanged two parameters that both influence the temperature in the molecular beam.We believe that the reason that the amplitude of the current pulse influences the tem-perature in the beam is that the expansion does not have time to settle during the veryshort opening time. Larger excursions for the plunger will therefore lead to larger ef-fective backing pressures in the expansion. This is a point we became aware of whilecarrying out these experiments. That said, we believe that the temperature of the mole-cular beam is similar for the highest pressures shown. This is based on measurementsof the duration of the gas pulse in the interaction region — unless the translationaltemperature is very low the gas pulse will disperse significantly during the ∼ 45 cmflight from the nozzle to the interaction region.
For a more detailed analysis of the results shown in Fig. 5.3, let us start by com-paring the results for iodobenzene and DBT. If we only look at the shape of the curvesthese two molecules behave very similarly, in particular the bend in the high pres-sure curve occurs at exactly the same intensity. This is indeed what we should ex-pect — the polarizability tensor of DBT is remarkably similar to that of iodoben-zene: αb = 20.6 Å
3, αa = 16.0 Å
3and αc = 10.1 Å
3for DBTa [20] versus
ab is the symmetry axis, a is the axis in the molecular plane being perpendicular to the b axis and c isout of the plane
67

68 Adiabatic alignment
0.5
0.6
0.7
0.8
0.9
⟨ cos
2 θ 2D ⟩
0 2 4 6 8 10 12 14 16
0.5
0.6
0.7
0.8
0.9
Intensity (1011 W/cm2)
⟨ cos
2 θ 2D ⟩
0 2 4 6 8 10 12 14 16
Intensity (1011 W/cm2)
80 bar
60 bar
40 bar
20 bar
10 bar
90 bar
70 bar
40 bar
30 bar
10 bar
50 bar
35 bar
21 bar
10 bar
60 bar
40 bar
20 bar
10 bar
(a) (b)
(c) (d)
FIGURE 5.3: Adiabatic alignment of (a) Iodobenzene, (b) p-diiodobenzene, (c) 3,4-dibromothiophene and (d) 4,4′-dibromobiphenyl. The curves show 〈cos2 θ2D〉 as functionof the intensity of the alignment laser for a range of pressures (see legend).
αa = 21.5 Å3, αb = 15.3 Å
3and αc = 10.2 Å
3for iodobenzene. In the heavy
molecule limit the degree of alignment is solely determined by the the ratio of thethermal energy to the interaction energy (Eq. (2.13) and [32]), that is the competitionbetween the confining action from the interaction with the laser field and the random,thermal motion. If we now take a closer look at sub-figures (a) and (c), it is seen thatthe maximum degree of alignment is different for the two molecules. For iodoben-zene the maximum degree of alignment is 〈cos2 θ2D〉 = 0.95, while for DBT a valueof 〈cos2 θ2D〉 = 0.89 is reached. Assuming that the rotational temperature is verysimilar in the two cases (which is very reasonable based on the position where thecurve bends), the most likely explanation for this difference is a break down of theaxial recoil approximation for DBT. It does not seem unreasonable to imagine that thesulphur atom, being confined inside an aromatic ring, does not with unity probabilityrecoil along the symmetry axis of the molecule. If for instance, a charge-asymmetricmolecular ion is created, the force on the sulphur atom will be at an angle to the sym-
68

5.2 Large, cold molecules 69
metry axis. As discussed previously, the blurring caused by such effects will reducethe observed degree of alignment.
Moving to p-diiodobenzene (sub-figure (b)) we are now faced with a molecule forwhich we do not know the polarizability tensor. If a direct comparison is carried outbetween the 60 bar data for iodobenzene and the 50 bar data for p-diiodobenzene itturns out that they are indistinguishable. Although it is expected that p-diiodobenzenehas a larger polarizability than iodobenzene the data at least indicate that the polariz-ability anisotropy is not very much different (assuming once again that the temperatureis the same). The final molecule is DBBP and again we do not know the polarizabil-ities. Comparing the 80 bar data to the best iodobenzene data there is a slower onsetof the saturation like behavior. This may be due to a factor of ∼2 lower effectivepolarizability anisotropy, but this larger molecule may not reach the same rotationaltemperature in the supersonic expansion. Further, the molecule is not rigid since thetwo aromatic rings can perform torsional motion. How this influences the cooling inthe supersonic expansion and the response to the laser field is not known.
Finally, we use the iodobenzene data to try to estimate the rotational tempera-ture of the molecules. To do this we compare with numerically calculated values of〈cos2 θ2D〉 as function of intensity for different temperatures. The numerical modelis based on treating iodobenzene as a symmetric top (for numerical simplicity). Asdiscussed previously this is a good approximation for the inertia tensor but not forthe polarizability. For the polarizability anisotropy we use the average polarizabil-ity perpendicular to the symmetry axis. To calculate the value of 〈cos2 θ2D〉 we firstcalculate the thermally averaged angular distribution for the θ-angle. Next, we findthe two-dimensional projection of this distribution by taking a large number of pointsin (θ, φ) and find their two dimensional projections (x2D, y2D). From the intensitydistribution in (x2D, y2D) we can build radial and angular distributions for the two-dimensional distribution and calculate 〈cos2 θ2D〉 for a specific radial region. Thismodel does not take into account the angular selectivity of the probe, but for wellaligned molecules this is not a problem since all molecules are confined along an axisperpendicular to the polarization of the probe.
The left panel of Figure 5.4 shows the 60 bar data for iodobenzene plotted togetherwith results obtained with this model by assuming rotational temperatures of 0.5, 1.0and 2.0 K respectively. At the low intensities the measured points lie in between the1.0 and 2.0 K curves, while at higher intensities the measured points seem to followthe 2.0 K curve. The strong similarities between the measured and calculated curvesis encouraging: it simultaneously shows that the molecules are very cold and that thesimplified model is most likely not too far off. It turns out that if the intensities ofthe numerical data are allowed to be re-scaled, a very good agreement can be found(Fig. 5.4, right panel). There is a good physical explanation for allowing such re-scaling. Part of the problem is the use of the average polarizability perpendicular tothe symmetry axis — we know that the χ-angle is confined (see Eq. (2.5) and [20]).In the limit of perfect confinement of the χ-angle we overestimate the polarizability
69

70 Adiabatic alignment
0 200 400 600 800 1000
0.5
0.6
0.7
0.8
0.9
Intensity (GW/cm2)
⟨ cos
2 θ2D
⟩
0 200 400 600 800 1000Intensity (GW/cm2)
Experiment2K, re−scaled
ExperimentT = 0.5 KT = 1 KT = 2 K
FIGURE 5.4: Comparison between experimental and calculated data for iodobenzene.Left: Calculations at three different temperatures using the average polarizability perpen-dicular to the symmetry axis. Right: the calculation at 2 K with the intensities re-scaled to75%.
anisotropy by ∼ 40%. Since the polarizability only enters the Hamiltonian via theproduct with the intensity we can correct for a wrong polarizability by re-scaling theintensity axis. This is, however, only half the story. In Sec. 2.2 we found that at theintensities used in the experiments the degree of alignment only depends on the ratiokBT/∆αI . This means that from the intensity dependence of the degree of alignmentwe can only determine the ratio T/∆α. Numerically it was found that this scalingalso holds for 〈cos2 θ2D〉 for a symmetric top (using the results shown in Fig. 5.4).If we assume that the use of the average polarizability is correct, then the estimatedtemperature is 1.5 K, whereas if the anisotropy in the plane of the molecule is usedthe estimated temperature is ∼1 K. In order to settle this point, full asymmetric topcalculations would be needed.
No matter which of the estimates we rely on we are about an order of magnitudehigher than the temperatures measured by Hillenkamp et al. [31]. The origin of thisdiscrepancy is at the moment unresolved, but focal volume averaging and non-axialrecoils are likely to limit our observations. Hillenkamp et al. measured the rotationalcontour for the S0 → S1 00
0 transition in aniline and estimated the rotational temper-ature by comparing with simulated contours. Since the rotational spectrum of anilinehas been measured with high precision this is a very direct measurement of the rota-tional temperature, unlike the modelling presented here.
70
5.3 Negative ions 71
5.3 Negative ionsIn the group of Daniel M. Neumark, adiabatic alignment of negative ions detectedby photoelectron angular distributions (PADs) was attempted. Previous experimentshave shown that PADs are sensitive to the mild alignment induced by a single photontransition to an excited state [92, 93], so guided by theory [94, 95] we expect thatPADs should also be sensitive to the potentially high degrees of alignment that can beobtained using adiabatic alignment. When adiabatic alignment is used in combinationwith PADs one has to be particularly careful about the intensity in the alignment laser:if the intensity becomes too high the angular distributions become distorted by pon-deromotive acceleration of the electrons out of the focus of the nanosecond laser [96].In our experiments the intensity of the alignment laser was kept below 1011 W/cm2 sothe ponderomotive potential was Up = e2E2/4mω < 10 meV. With typical electronkinetic energies of 1 eV or more, the relative energy shift would be less than 1%. Inthe images we observed no signs of distortion.
The experiments were carried out on the anionic carbon clusters C –n (n = 2 –
8) and CnH – (n = 2, 4, 6, 7), which are all linear chains. A detailed descriptionof the experimental setup can be found in [97]. Briefly, the carbon clusters werecreated in the supersonic expansion of a mixture of a few percent C2H2 and CO2in Ne passing through a pulsed discharge. A 1200 eV electron beam was used as astabilizing charge source for the anion formation. The ions were injected orthogonallyinto a time-of-flight mass spectrometer, where a pulsed, high-voltage reflector wasused to discriminate ions with unit mass selectivity. The selected ion bunch was thencrossed by the focused laser beams: 8 ns pulses at 1064 nm were used for alignmentand 100 fs, 265 nm pulses synchronized to the peak of the nanosecond pulse were usedfor electron detachment. A velocity map imaging spectrometer was used to project theelectrons onto a MCP backed by a phosphor screen and images were recorded with aCCD-camera.
One of the main reasons for choosing the carbon clusters for these experiments isthat they are known to have very large polarizabilities (and polarizability anisotropies).For the neutral C6 clusters, for instance, ab initio calculations have predicted a polar-izability anisotropy of about 22 Å3 [98]. The polarizability of the anion clusters arenot known. Closely related to the large polarizabilities is the fact that the anion carbonclusters all have excited states below the detachment threshold. For the even, bareclusters C –
4 , C –6 and C –
8 this turns out to be a problem. When we sent the 1064 nmpulses onto these clusters we observed a very high number of electrons being detachedeven without the UV pulse present and at very low intensities for the YAG laser. Thephotoelectron distributions were peaked at zero energy, had an exponential fall-off andwere circularly symmetric. These are the signatures of thermionic emission where amolecule with an internal energy above the detachment threshold emits the electron ina statistical process. The first excited state of these three ions are found slightly morethan one eV above the ground state and the X → A transitions are dipole allowed [99].
71

72 Adiabatic alignment
With the energy of a 1064 nm photon being 1.165 eV, the alignment laser is very closeto being resonant with the X → A transitions. Once the molecules are excited into theA-state, strong vibronic coupling brings the molecule back to the X-state with the ex-cess energy distributed on the vibrational degrees of freedom. The molecules can thengo through this cycle several times, each time heating the molecules with 1.165 eV, soafter only four cycles the total vibrational energy will be larger than the detachmentenergy and the electron can then be ‘boiled off’.
For the clusters C –2 , C2H – , C6H – , C –
7 and C7H – there was little or no sign ofdetachment induced by the 1064 nm laser at intensities up to 1011 W/cm2. Unfortu-nately there were no changes in the angular distributions either. This leaves us withC –
3 and C4H – . For both of these ions the presence of the YAG laser clearly changedthe photoelectron kinetic energy distribution at low energies. In the case of C –
3 thepresence of the YAG laser gave rise to a broad, featureless distribution a low energiesand a very significant depletion of the high energy peaks. The angular distribution forsome of the high energy peaks did change with the intensity of the nanosecond laser,but the amount of signal were at the noise level. For the C4H – ions some complexfeatures appeared at low electron energies in the presence of the YAG laser; the photo-electron spectrum seemed broad and featureless but the in the images complex angulardistributions were observed. The high energy region of the spectrum, correspondingto direct detachment by the absorbtion of a UV photon, consist of three peaks: onebig slightly broad peak which actually consist of several unresolved peaks and twosmaller peaks. When the YAG laser was included we observed some changes in oneof the small peaks, but none in the dominant peak.
All in all we did not observe any conclusive signs of alignment in the photoelec-tron angular distributions. There are two comments attached to this. First of all, itmight be worth trying nonadiabatic alignment of the clusters although the intensity ofthe alignment pulse will be severely restricted by the low detachment threshold (3–4 eV). If the changes in the PADs are small they will be easier to separate from noisewhen the changes appear periodically as is the case for a rotational wave packet inlinear molecules. This was beautifully demonstrated in the work of Bragg et al. [93].An important motivation for trying this is that it gives a direct measurement of therotational constant, which can be difficult to obtain for anions. Second, it is worthspeculating why we did not observe any changes in the PADs. The most likely answerseems to be the rotational temperature; if the rotational temperature is high then theinduced degree of alignment will be low (see Fig. 2.2). Since the anions are created ina quite harsh environment (a high voltage discharge stabilized by 1200 eV electrons)during the stagnation of the supersonic expansion we cannot expect the internal de-grees of freedom of the ions to relax to the temperature of the carrier gas. Indeed forthe carbon clusters the vibrational temperature can be thousands of Kelvin, whereasthe rotational temperature can change from day to day. The best way to estimate therotational temperature is by using the rotational contour of the vibronic transitions.In this way the temperature has been estimated to 50 K under good conditions. If
72

5.3 Negative ions 73
we make a guess for the polarizability we can estimate the degree of alignment fromFig. 2.2 using the re-scaling discussed above. For neutral C4 calculations estimate thepolarizability anisotropy to be ∼ 10 Å3 [98]. This would correspond to a temperatureof 20 K for tert-butyliodide, so from Fig. 2.2 it can be concluded that the degree ofalignment must have been very low at the modest intensities used in the experiments.
73


CHAPTER 6
Two-pulse alignment
In this Chapter a systematic study of nonadiabatic alignment by the use of two shortpulses is made. It will be shown that for the right choice of pulse durations, intensitiesand delay, the alignment induced by two pulses is clearly superior to that induced bya single pulse.
6.1 IntroductionFor many experiments utilizing aligned molecules it is desirable to have the mole-cules as well aligned as possible. In the case of adiabatic alignment we saw that twoadjustable parameters, the rotational temperature and the intensity of the alignmentlaser, determined the degree of alignment. To obtain a strong alignment, the mole-cules must initially be cold and the intensity must be close to the ionization threshold.But that is all we can do. For nonadiabatic alignment we discussed a third parameter,the pulse duration, but we should rather be thinking of an optimal shape for the electricfield. One way of shaping the electric field is to create two or more pulses, for instanceby the use of an interferometer.
The first proposal for using multiple pulses to optimize the degree of alignment (ororientation) was made by Averbukh and co-workers [34, 35, 100]. The starting pointfor their work is the δ-kick model. In Sec. 2.3 we saw that according to this model it
75

76 Two-pulse alignment
-2 0 2 4 6 8 10 12 14
0.4
0.5
0.6
0.7
<cos
2>
Time (ps)
FIGURE 6.1: Two-pulse alignment of iodobenzene. The dotted curves show a cross-correlation of the two alignment pulses (I1 = 1.4 · 1012 W/cm2, I2 = 4.1 · 1012 W/cm2).Also shown is the degree of alignment as function of time for the first pulse only (opensquares), the second pulse only (open triangles) and both pulses are present (full circles).
is the lag of the molecules initially oriented perpendicular to the laser polarization thatcauses the saturation of the degree of alignment induced by a single pulse. A moreoptimal kick is given if the molecules are aligned prior to the kick since a larger num-ber of molecules will then obtain an angular velocity proportional to their initial angle(see Eq. (2.15)). The original proposal by Averbukh and Arvieu [34] was thereforeto use a train of identical pulses, each of these synchronized to the maximum degreeof alignment from the previous pulses. In practice it is difficult to produce a train ofmany pulses with different delays between each pair of pulses. Fortunately, it wasshown that the degree of alignment can be significantly enhanced by the use of onlytwo pulse with correctly chosen intensities and delays [35].
The dotted curve in Figure 6.1 shows a cross-correlation of the two-pulse combi-nation that was experimentally found to be optimal (in a limited parameter search) foriodobenzene [101]. The two pulses are closely spaced and the peak intensity of thefirst pulse is about one third of the peak intensity in the second pulse. The figure alsoshows the degree of alignment due to the first pulse, the second pulse and both pulses.The first thing to notice is that with a single pulse, increasing the intensity by a factorof three only changes the degree of alignment by a small amount (〈cos2 θ〉 = 0.52 and0.56 respectively). If all of the pulse energy is collected in a single pulse we obtain〈cos2 θ〉 = 0.57 — clearly the degree of alignment has become saturated. When thetwo-pulse combination is used, this saturation is overcome and a degree of alignmentof 〈cos2 θ〉 = 0.66 is reached. From the figure we see that the optimal timing is to sendthe second pulse close to the peak in the degree of alignment due to the first pulse. Bypre-aligning the molecules with a relatively weak pulse we push a large fraction of the
76

6.2 Detailed study: tert-butyliodide 77
molecules into the harmonic region of the interaction potential for the second kick,while keeping their angular velocities low.
In the following Sections a detailed experimental and numerical study of two-pulsealignment of tert-butyliodide is presented. The optimal choices of pulse duration,intensity and delay between the two pulses are considered. At the end of this Chapter,other methods for manipulating rotational wave packets are briefly discussed.
6.2 Detailed study: tert-butyliodide
In the experiments on two-pulse alignment of iodobenzene that were briefly discussedabove, the delay between the two alignment pulses was scanned near the initial peakin the degree of alignment from the first pulse. For asymmetric tops this initial peak isthe global maximum in the degree of alignment, but since the peak occurs briefly afterthe pulse has vanished the choice of delay between the two pulses becomes severelyrestricted if we want to avoid interference between the two pulses. For symmetric topsthis restriction can be overcome by tuning the delay to the first full revival. There, thewave packet is an exact replica of the wave packet immediately after the pulse, butinterference effects are no longer a concern. For this reason, and because symmetrictops are simpler to handle numerically, we chose the symmetric top tert-butyliodidefor a detailed study of two-pulse alignment. The timing sequence used in these studiesis shown in Figure 6.2. The upper graph gives an overview and the regions markedin red are shown in detail in the lower graphs. The first alignment pulse is sent att = 0 inducing a modest degree of alignment, peaking at about t = 5 ps. At thefull revival (t ∼ 323 ps) the second alignment pulse is sent, forcing the moleculesinto a high degree of alignment which is then probed at the following full revival(t ∼ 645 ps). To optimize the degree of alignment we changed the intensity in the firstpulse I1, the (common) duration of the alignment pulses τ and the delay between thealignment pulses ∆t. For each setting, the delay of the probe was scanned to identifythe highest degree of alignment. The intensity of the second pulse I2, is fixed, in theexperiments at the ionization limit and in the calculations at 6 TW/cm2 (due to thelong computational times at the intensities used in the experiment).
6.2.1 Experimental results
To carry out the desired study of two-pulse alignment of tert-butyliodide we must beable to create two pulses with variable duration, delay and intensities. As described inSec. 3.2.2 the alignment pulses are obtained from the output of the femtosecond laserby first stretching the ∼130 fs pulses in a grating stretcher and then create a pair ofpulses with variable delay and intensities using a modified Mach-Zehnder interferom-eter (see Fig. 3.3(b)). For probing the degree of alignment we used dissociation by a
77

78 Two-pulse alignment
0 5 10
0.1
0.3
0.5
0.7
0.9
⟨ cos
2 θ ⟩
310 315 320 325 330Time (ps)
640 645 650
0 100 200 300 400 500 600
0.1
0.3
0.5
0.7
0.9
⟨ cos
2 θ ⟩
(a)
(a)
(b)
(b)
(c)
(c)
FIGURE 6.2: Optimal timing sequence for two-pulse alignment of tert-butyliodide. Thegray areas in (a) and (b) show the alignment pulses while the black area in (c) shows theprobe pulse. The dashed curve shows the degree of alignment when only the first pulse(I1 = 2 TW/cm2) is used and the full curve shows the alignment obtained when thesecond pulse (I2 = 6 TW/cm2) is included. The calculation assumes a temperature of1 K, pulse durations of 1 ps and includes focal volume averaging.
266 nm pulse followed by resonant ionization of the iodine fragments, just as in thestudy of revivals for tert-butyliodide (Sec. 4.2).
First, we compare the shapes of the revivals when either one or two pulses areused for alignment. The results, shown in Fig. 6.3, focus on the alignment dynam-ics around the first half and full revivals following the second pulse. In both casesthe pulse duration is 0.5 ps and the intensity of the second pulse, I2, is 9.4 TW/cm2,just below the intensity where ionization and fragmentation of tert-butyliodide sets in.The relative timing of the two alignment pulses is chosen such that the second pulseis sent at the time where the degree of alignment due to the first pulse reaches thepeak value. Starting with the revivals measured with only the second pulse presentwe observe shapes identical to those presented in Fig. 4.6(a). We note that for thepulse duration considered, an almost identical peak value for the degree of alignment,corresponding to 〈cos2 θ2D〉 ∼ 0.86, is observed at the half and the full revival. Whenthe other alignment pulse is included prior to the strong alignment pulse, the revivalschange towards a more symmetric shape. Furthermore, we observe that the two-pulsesequence increases the maximum degree of alignment at the full revival to 〈cos2 θ2D〉∼ 0.88. At the half revival we do not observe the expected corresponding decrease inthe minimum degree of alignment (see Fig. 6.2). We ascribe this to the low sensitiv-ity of the parallel transition, used to probe the spatial orientation, to perpendicularly
78

6.2 Detailed study: tert-butyliodide 79
150 155 160 165 170
0.70
0.75
0.80
0.85
Time (ps)
⟨ cos
2 θ 2D ⟩
310 315 320 325 330Time (ps)
(a) (b)
FIGURE 6.3: (a) Half and (b) Full revival for tert-butyliodide exposed to one pulse (I =9.4 TW/cm2, triangles) and two alignment pulses (I1 = 4.5 TW/cm2, I2 = 9.4 TW/cm2,circles). The time shown is the delay from the last alignment pulse applied. All pulseshave a duration of 0.5 ps.
aligned molecules.Hereafter, we seek to find the laser parameters leading to the best degree of two-
pulse alignment. Guided by the results of Fig. 6.3 we restrict the measurements of thealignment to the first full revival after the second pulse. This approach is justified bythe numerical results presented below. We begin by investigating the dependence onthe delay, ∆t, between the two alignment pulses. To do this, we initially measure thedegree of alignment around the first full revival following the first pulse [correspond-ing to the dashed curve in Fig. 6.2(b)]. Next, we include the second pulse and measurethe degree of alignment at the first full revival after the second pulse [correspondingto Fig. 6.2(c)] for different delays between the two pulses. The results are displayedin Fig. 6.4. In this figure the full circles show the degree of alignment due to the firstpulse. The open triangles show the highest degree of alignment obtained when thesecond pulse is sent at the time given on the x-axis. Again referring to Fig. 6.2 thiscorresponds to plotting the maximum in Fig. 6.2(c) as a function of the delay betweenthe two alignment pulses. The left graph [Fig. 6.4(a)] is obtained with a pulse durationof 1 ps and the first pulse having a peak intensity ∼ 1/4th of the intensity in the sec-ond pulse. There is nearly a one to one correspondence between the curves. The bestdegree of alignment is, however, obtained when the second pulse is sent slightly afterthe degree of alignment, due to the first pulse, reaches its peak value. The right graphis obtained with a pulse duration of 0.5 ps and nearly equal intensity in the two pulses.Again, the shape of the degree of alignment obtained with two pulses nearly followsthe degree of alignment due to the first pulse at the time when the second pulse is sent.
Next, we investigate the dependence of two-pulse alignment on the intensity in thefirst pulse, I1. The intensity of the second pulse, I2, is fixed just below the value whereionization and fragmentation of the molecules start to occur. For each value of I1 we
79
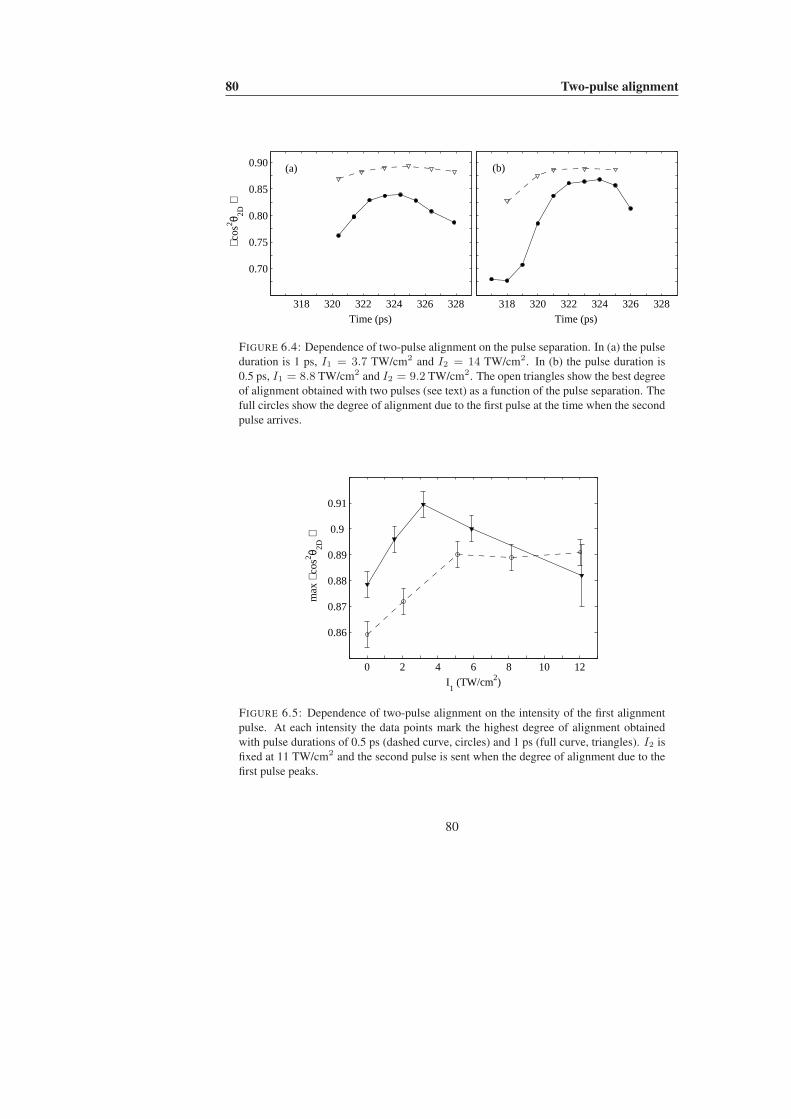
80 Two-pulse alignment
318 320 322 324 326 328Time (ps)
318 320 322 324 326 328
0.70
0.75
0.80
0.85
0.90
⟨ cos
2 θ 2D ⟩
Time (ps)
(a) (b)
FIGURE 6.4: Dependence of two-pulse alignment on the pulse separation. In (a) the pulseduration is 1 ps, I1 = 3.7 TW/cm2 and I2 = 14 TW/cm2. In (b) the pulse duration is0.5 ps, I1 = 8.8 TW/cm2 and I2 = 9.2 TW/cm2. The open triangles show the best degreeof alignment obtained with two pulses (see text) as a function of the pulse separation. Thefull circles show the degree of alignment due to the first pulse at the time when the secondpulse arrives.
0 2 4 6 8 10 12
0.86
0.87
0.88
0.89
0.9
0.91
I1 (TW/cm2)
max
⟨ co
s2 θ 2D ⟩
FIGURE 6.5: Dependence of two-pulse alignment on the intensity of the first alignmentpulse. At each intensity the data points mark the highest degree of alignment obtainedwith pulse durations of 0.5 ps (dashed curve, circles) and 1 ps (full curve, triangles). I2 isfixed at 11 TW/cm2 and the second pulse is sent when the degree of alignment due to thefirst pulse peaks.
80

6.2 Detailed study: tert-butyliodide 81
start by finding the time when the maximum degree of alignment at the revival due tothe first pulse occurs. Then we include the second pulse at this time and measure thedegree of alignment at the first revival after the second pulse. The results, showing themaximum degree of two-pulse alignment as a function of I1, are displayed in Fig. 6.5for pulses with a duration of 0.5 and 1 ps. The full curve, representing the resultsrecorded with 1 ps pulses, exhibits a clear maximum when the intensity of the firstpulse is ∼ 1/3rd the intensity of the second pulse. For the results obtained with 0.5 pspulses it is seen that the degree of alignment is enhanced with two pulses, but no clearmaximum is observed. In general, the results show that almost any ratio I1/I2 ≤ 1of two optimally timed pulses leads to a significantly higher degree of alignment thanthat obtained with just one pulse.
6.2.2 Numerical resultsWe now turn to the numerical exploration of two-pulse alignment of tert-butyliodide.In the calculations we used intensities and temperatures lower than those used in theexperiments. Our aim is a qualitative rather than a quantitative agreement with theexperiments. Unless otherwise noted, all calculations take focal volume averaginginto account (see Sec. 2.3.3).
We start by investigating how the degree of alignment at both the half and thefull revival after the second pulse depends on the time separation between the twoalignment pulses. The calculations are carried out at four different intensities for thefirst pulse, I1 = 0.5, 2, 4 and 6 TW/cm2. All other parameters are fixed: τ = 1 ps,T = 1 K and I2 = 6 TW/cm2. The results are shown in Fig. 6.6. For easy comparisonwith the experimental results, we use the same notation as in Fig. 6.4. Thus, the fullcurves show the degree of alignment due to the first pulse around the times wherethe second pulse is sent and the dashed curves in the left (right) column show the bestdegree of two-pulse alignment at the first half (full) revival after the second laser pulse.
At first we focus on the right column showing the degree of alignment at the fullrevival after the second laser pulse. These graphs should be compared with the ex-perimental results presented in Fig. 6.4. Several similarities are seen between thetwo figures. First of all, Fig. 6.6 shows that the best degree of two pulse alignmentat the full revival nearly follows the degree of alignment from the first pulse at thetime when the second pulse is sent. A closer inspection of Fig. 6.6 (e)–(h) revealsthat as the intensity of the first pulse is increased the optimal timing changes fromslightly after (∼ 1 ps) [(e),(f)] to approximately at [(g),(h)] the alignment peak due tothe first pulse. The strongest two-pulse alignment, 〈cos2 θ〉 = 0.84, is obtained forI1 = 2 TW/cm2 = 1/3 I2. We now turn to the degree of alignment obtained at thehalf revival after the second pulse, shown in Fig. 6.6 (a)–(d). At low intensities of thefirst pulse [(a),(b)] the best two-pulse alignment is obtained when the second pulse issynchronized to the time where the minimum in the degree alignment from the pre-
81

82 Two-pulse alignment
305 315 325 335
0.2
0.4
0.6
0.8
Time (ps)
⟨ cos
2 θ ⟩
305 315 325 335Time (ps)
0.2
0.4
0.6
0.8
⟨ cos
2 θ ⟩
0.2
0.4
0.6
0.8
⟨ cos
2 θ ⟩
0.2
0.4
0.6
0.8
Half revival
⟨ cos
2 θ ⟩
Full revival
(a)
(b)
(c)
(d)
(e)
(f)
(g)
(h)
FIGURE 6.6: Theoretically determined dependence on the delay between the two align-ment pulses. The full curve is degree of alignment due to first pulse and the dashedcurve shows the best degree of alignment obtained with two alignment pulses separatedby the given delay. In the left (right) column the dashed curves show the best degree ofalignment at the half (full) revival after the second pulse. For all calculations τ = 1 ps,I2 = 6 TW/cm2 and Trot = 1 K. Through each column the intensity of the first pulse isvaried: (a),(e) I1 = 0.5 TW/cm2; (b),(f) I1 = 2 TW/cm2; (c),(g) I1 = 4 TW/cm2; (d),(h)I1 = 6 TW/cm2.
82

6.2 Detailed study: tert-butyliodide 83
0 1 2 3 4 5 6
0.65
0.70
0.75
0.80
0.85
0.90
I1 (TW/cm2)
max
⟨ co
s2 θ ⟩
FIGURE 6.7: Calculated intensity dependence of the two-pulse alignment for pulse du-rations of 0.5 ps (red), 1 ps (black, full) and 2 ps (blue) with focal volume averagingincluded. The black, dashed curve shows the result for a duration of 1 ps when focalvolume averaging is not included.
pulse occurs. At the highest intensity [(d)] the optimal timing occurs when the secondpulse is sent slightly after the one-pulse minimum at the point where 〈cos2 θ〉 = 0.33a.The strongest two-pulse alignment is 〈cos2 θ〉 = 0.81 and occurs for I1 in the range1–2 TW/cm2. Two important conclusions to be drawn from Fig. 6.6 are: 1) The high-est degree of two-pulse alignment is found at the full revival after the second pulse and2) An optimal intensity exists for the first pulse. The first conclusion re-validates ourexperimental approach of focusing on the alignment at the full revival. The secondconclusion confirms the observations in Fig. 6.5.
Systematically exploring even just the most relevant combinations of pulse inten-sities, durations and separations for achieving optimal two-pulse alignment is beyondour computational capacity. Instead we use the results from Fig. 6.6 to limit our search.From these results we find that sending the second pulse at the time of maximal align-ment due to the first pulse rather than at the optimal delay leads to an error in 〈cos2 θ〉of no more the 2% and most often less. The time of maximal alignment at the firstfull revival after the first pulse is therefore chosen as a (good) approximation for theoptimal value of ∆t1.
With the optimal timing in place, we now seek to find the optimal intensity ofthe first pulse, while keeping the intensity of the second pulse fixed. The procedureis similar to that used in the experiments. First, the optimal value of ∆t1 must bedetermined. To do this we calculate the degree of alignment due to the first pulse
aAlthough this is also the value for a uniform distribution of molecules this does not mean that themolecules are uniformly distributed [40].
83

84 Two-pulse alignment
and identify the time at which the maximum (at the first full revival) occurs. Next,the second pulse is included in the calculation. From this calculation we extract thehighest degree of alignment at the next full revival. Finally, this peak value is plottedas a function of I1, just as in Fig. 6.5. Calculations were carried out for pulse durationsof 0.5, 1.0 and 2.0 ps, with the peak intensity in the second pulse fixed at 6 TW/cm2
and a rotational temperature of 1 K. The results, shown in Fig. 6.7, reveal the existenceof an optimal I1 value for each pulse duration. All four curves exhibit a monotonousincrease of 〈cos2 θ〉, at low intensities of the prepulse, to the peak value followed bya decrease as I1 is increased towards the value of I2. For the 0.5 and 1.0 ps durationsthe two-pulse alignment is stronger than the alignment obtained with only the secondpulse at any value of I1 ≤ I2. For the 2.0 ps duration 〈cos2 θ〉 drops below theone-pulse degree of alignment when I1 is increased above the optimal value.
Fig. 6.7 shows that the optimal I1 value is a decreasing function of the pulse dura-tion. In the 0.5, 1.0 and 2.0 ps cases the strongest two-pulse alignment is reached forI1 = 3, 2 and 1 TW/cm2, respectively. Furthermore, we observe that the maximum〈cos2 θ〉 value depends critically on the pulse duration. For the 0.5, 1.0 and 2.0 psdurations the maximum value for 〈cos2 θ〉 is 0.75, 0.82 and 0.86 respectively. Calcu-lations were also carried out for a pulse duration of 4 ps (not shown). A maximumdegree of alignment of 〈cos2 θ〉 = 0.82 was reached at an intensity of 0.3 TW/cm2. Itis therefore concluded that an optimal pulse duration exists for the two-pulse scheme.Based on the four durations studied here, the strongest alignment seems to be obtainedfor a duration close to 2.0 ps at an intensity of 6 TW/cm2 for the second pulse.
6.2.3 DiscussionIn addition to the parameters discussed in the previous section there is one more im-portant parameter to consider when a high degree of alignment is desired. In an ex-periment where a large region of the focal volume of the alignment pulse(s) is probed,the measured degree of alignment is severely reduced compared to that obtained justat the peak intensity (see Fig. 2.7). The reason is that the alignment dynamics dependson the intensity of alignment pulse — different regions of the focal volume reach thehighest degree of alignment at different delays. The observed maximum is thus onlythe best compromise. As a consequence, the value of ∆t in a two pulse experimentcannot be optimal for all of the focal volume. This leads to a clear reduction in thedegree of alignment that can be obtained.
The dashed black curve in Fig. 6.7 shows the intensity dependence of the two-pulse alignment obtained with 1 ps pulses when focal volume averaging is not takeninto account. Comparing with the full black curve we immediately see the severe re-duction in the degree of alignment caused the focal volume averaging. Starting withthe one-pulse results (I1 = 0) it is seen that without focal volume averaging the de-gree of alignment (〈cos2 θ〉 = 0.79) is significantly higher than with focal volumeaveraging (〈cos2 θ〉 = 0.69). In fact, the degree of one-pulse alignment without fo-
84
6.2 Detailed study: tert-butyliodide 85
cal volume averaging is close to the best degree of two-pulse alignment when focalvolume averaging is included (〈cos2 θ〉 = 0.82). The I1-dependence of the non fo-cal averaged results is similar to that for the focal volume averaged results, althoughthe maximum (〈cos2 θ〉 = 0.92) is reached at a lower intensity (I1 = 1 TW/cm2).All in all, Fig. 6.7 shows that experiments employing nonadiabatic alignment can besignificantly improved by minimizing focal volume averaging.
This discussion lead us to consider a comparison with adiabatic alignment. Whenadiabatic alignment is used the dynamical aspect is absent and for a molecular sampleat a given rotational temperature the degree of alignment is solely determined by theintensity. At a low rotational temperature the degree of alignment can be made veryhigh over a large region of the focal volume by saturation of the alignment process(see Fig. 2.2). For instance, at Trot = 1 K we find 〈cos2 θ〉 = 0.87 and 0.90 forI = 1.0 TW/cm2 and 1.7 TW/cm2, respectively. The latter is probably the maximumthat the molecule can withstand without ionizing. Since the two-pulse calculationswere carried out at intensities lower than those employed in the experiment, it seemsthat two-pulse alignment is superior to adiabatic alignment in the center of the focus.As discussed in the previous Chapter, a potential complication of adiabatic alignmentis the presence of the field while the molecules are aligned. This can, however, beavoided by truncating the alignment field rapidly using the switched wave packet ap-proach of Stolow and co-workers [53].
In both experiments and calculations we kept the temperature of our moleculesfixed. One interesting, remaining question is how the optimal choice of pulse param-eters depends on the temperature. Calculations by Leibscher et al. [100] indicate thatwhen the temperature is raised, a higher intensity is needed in the first pulse. This ishardly surprising — at higher temperatures we need higher intensities to induce a sig-nificant degree of alignment. Under such conditions one must re-investigate whetherthe peak of the degree of alignment due to the first pulse is still the optimal time for thesecond pulse. In the δ-kick model this would not be unexpected — the basic ansatz,that the initial angular velocity is small compared to the angular velocity imparted bythe kick from the interaction with the laser pulse, will fail in that case. This leads usto a comparison with work on two-pulse alignment of N2 by Lee et al. [102]. Theymeasured the degree of alignment as function of the delay between the two alignmentpulse with the intensity of the alignment pulses fixed, both being close to the onset ofmulti-photon ionization and the pulse durations were 50 fs (due to the small momentof inertia the rotational dynamics of N2 is very fast). The temperature in their mole-cular beam has previously been estimated to be about 100 K [40] and they found thatthe optimal timing was to send the second alignment pulse between the minimum andmaximum in the degree of alignment. By comparing the Boltzmann distribution forN2 at 100 K with the thermally averaged distribution of J-states for the wave packetinduced by a single pulse [40, Fig. 6(a)] it is revealed that the molecules are not trulyin the strongly driven regime; although the peak of the population distribution shifts byabout 10 J-states the two distributions still have a significant overlap and the thermal
85

86 Two-pulse alignment
motion cannot be neglected. The conclusion is that both the intensities and the timingneed attention when two-pulse alignment is used.
6.3 Other methods for manipulating rotational wavepackets
With the advent of nonadiabatic alignment a number of schemes for manipulatingrotational wave packets have been presented. Some schemes have been proposed asroutes to optimize the degree of alignment, others were meant as general ways ofchanging the shape of the revivals. Let us start by mentioning another approach foroptimizing the degree of alignment, which was recently demonstrated in our group[79]. In that work a combination of a long and a short pulse was used. The ideawas to use adiabatic alignment instead of short-pulse alignment pulse to pre-align themolecules before the kick from the second pulse (which was sent at the peak of thelong pulse). A wave packet of pendular states was thus created and it was shown thatsoon after the short pulse the molecules indeed became very strongly aligned. Sinceadiabatic alignment in our experience is superior to short-pulse alignment (at least forlow temperatures), the use of a long pulse to pre-align the molecules is expected toyield a higher degree of alignment. To obtain field-free aligned molecules it wouldtherefore seem ideal to use a long turn on/short turn off pulse [23, 53] to pre-alignthe molecules. Another approach to optimize the degree of alignment was recentlypresented by Horn et al. [103]. They used a pulse shaper controlled by a geneticalgorithm to optimize the degree of alignment and found asymmetric pulse shapes tolead to the highest degree of alignment; the optimal pulses had a slow turn-on andfast turn-off, but were not comparable to the pulses used by Stolow and co-workers[23, 53]; the turn-on time of the pulses were too short to be adiabatic, but maybethis is a matter of the total pulse energy available — as the pulses are chirped thepeak intensity drops and the degree of rotational excitation goes down. It would bevery interesting to see these experiments repeated at higher pulse energies to see ifthe adiabatic turn-on/abrupt turn-off pulses turn out to be optimal. One point worthmentioning here is that the combination of a very long and a very short pulse seemsunlikely to be found by a genetic algorithm and thus highlight the importance of thephysical insight that is often gained by quite simple models such as the δ-kick model.
The studies of two-pulse alignment presented in the previous Section focused onoptimizing the degree of alignment, but we observed that in doing so we also changedthe shape of the revivals (see Fig. 6.3). Using several short pulses is therefore anotherway two manipulate the revivals. Renard et al. [104] used a pulse shaper to create apair of equally intense pulses and showed that when the delay between these pulseswere exactly Trev/2, no revivals were seen after the second pulse. Lee et al. [105]later showed theoretically and experimentally that the pulse pair together form a zero-
86

6.3 Other methods for manipulating rotational wave packets 87
effect pulse pair, where the second pulse annihilates the wave packet formed by thefirst pulse. Even more surprisingly, if a wave packet is excited prior to the zero-effectpulse pair, then the initially excited wave packet survives the two pulses. Anotherscheme for manipulating revivals was proposed theoretically by Spanner et al. [41] anddemonstrated experimentally by Lee et al. [106]. The scheme relies on adding phasechanges to parts of the wave packet at the fractional revivals. It was demonstrated thatwith the use of relatively weak pulses it was possible to effectively turn revivals offand then on again, or to double the number of revivals observed within a rotationalperiod.
Finally, Spanner et al. [41] showed that by using a half-cycle pulse to induce aphase shift at a fractional revival, a high degree of orientation could be induced. Thestrength of that proposal is that the degree of orientation is solely determined by the de-gree of alignment in the initial wave packet (but only 50% of the molecules achieve theforward-backward asymmetry). This is in contrast to brute-force orientation, wherethe degree of orientation is determined by the ratio of the thermal energy kT to the in-teraction energy µE [3]. The combination of brute force orientation with laser inducedalignment has been suggested [107–109], but at least in the parallel field configuration(and kT/h À B) the laser only confines the angular distribution — it does not changethe forward-backward population ratio. The scheme for orientation proposed by Span-ner et al. also seems superior to schemes relying solely on the use of half-cycle pulses[110] because the angular confinement is induced by the alignment pulse (which caninduce a significantly broader wave packet than the half-cycle pulse).
All in all rotational wave packets exhibit very rich dynamics and it will be inter-esting to see to what extend these control schemes can be transferred to asymmetrictops.
87


CHAPTER 7
Applications of alignedmolecules
Although the study of laser induced alignment and rotational wave packets is interest-ing on its own, the main motivation for developing these techniques has been to utilizethe aligned molecules for other studies. The original inspiration for studying laser in-duced alignment came from the use of static electric fields in stereochemical studies,with the hope that molecular alignment could be used as a tool in the study of orien-tational effects in chemical reactions [3, 4]. Over the years many other applicationshave started to appear. In this Chapter a few of these will be discussed.
Probably the first application of laser-induced alignment of molecules was thedemonstration of control over the photodissociation of I2 and later of iodobenzene[49, 50]. In these experiments the branching ratio between two competing dissoci-ation channels was controlled by utilizing the different orientations of the transitiondipoles in the molecular frame. If, for instance, the polarization of the dissociationlaser pulse was parallel to that of the alignment laser, then the channel with a paral-lel (to the internuclear axis) transition dipole was enhanced while the channel witha perpendicular transition dipole was suppressed. These experiments therefore bearstrong resemblance to the experiments by Dong and Miller [111] where the directionof vibrational transition dipole moments were measured by orienting bio-molecules
89

90 Applications of aligned molecules
in liquid helium droplets with electrostatic fields. Laser-induced alignment may be abetter-suited tool for measuring the orientation of transition dipoles. First of all, theangular confinement obtained with laser induced alignment is much higher than forbrute-force orientation due to the much larger electric fields that can be obtained witha pulsed laser. Secondly, the head-versus-tail order given by the orientation is of nouse for spectroscopic measurements — since the optical period for visible light is onthe order of a femtosecond, the probe (i.e. the laser pulse) has no head-versus-tailpreference.
Just as light can be used to change the spatial orientation of molecules, a macro-scopic sample of aligned molecules can affect light. For instance, the refractive in-dex for light polarized parallel and perpendicular to the internuclear axis of a linearmolecule will in general be different. A gas of aligned molecules is therefore a bire-fringent medium, in fact such induced birefringence is the cause of the optical Kerreffect [112]. For short-pulse alignment the induced birefringence becomes particularlyinteresting: since the induced alignment at the revivals changes from planar delocal-ization to maximum alignment within a few hundred femtoseconds, the medium hasan extremely rapidly modulated index of refraction. This rapidly changing index of re-fraction has been shown theoretically and experimentally to be a valuable and flexibletool for the generation of ultra-short UV pulses [113, 114]. The transient birefrin-gence has also been proposed as a way to obtain very broadband phase-matching forthird-harmonic generation in a gas filled hollow-core fiber [115].
Two research fields where the use of aligned molecules have caught special atten-tion are UV photoelectron spectroscopy and strong field physics. These topics will bediscussed in the following two Sections.
7.1 Photoelectron spectroscopyFor the study of excited state processes in polyatomic gas-phase molecules, clustersand anions, time-resolved photoelectron spectroscopy (TRPES) has emerged as a valu-able tool being sensitive to both electronic and nuclear dynamics [116–119]. In a typ-ical TRPES experiment the molecule is excited by a short visible or UV pulse andthen at various delays the photoelectron spectrum resulting from ionization by a UVpulse is measured. Several TRPES experiments have examined the coupling betweentwo electronically excited states. In the most favorable case, the photoelectrons corre-sponding to ionization of each state have different kinetic energies so the dynamicalevolution of the electronic wave packet can be followed by observing the intensityof the corresponding peaks. In this case the accompanying nuclear dynamics, whichoften promote the coupling between the electronic states via non Born-Oppenheimercouplings, can be seen as changes in the shape of each photoelectron peak due tochanges in Franck-Condon overlaps. In less favorable cases the photoelectron peakfrom different electronic states overlap and the dynamics becomes difficult to observe.
90

7.1 Photoelectron spectroscopy 91
Measuring the angular distribution of the emitted electrons could enhance the amountof information extracted in such experiments [120–122], but it requires some degreeof alignment; for a sample of randomly oriented molecules most of the information inthe photoelectron angular distribution (PAD) is removed [94, 123–125].
Two approaches can be used to connect the laboratory fixed frame and molecularframe. If the molecule dissociates, coincidence measurements of electron and photo-fragment recoil velocities allows one to find the electron angular distribution in therecoil frame [126–131]. The other approach is to actively align the sample molecules,for instance by the methods described in the previous Chapters. Several recent calcula-tions indicate that PADs are indeed very sensitive to the alignment that can be inducedby a laser pulse [94, 95, 132]. Just as alignment may prove important to measurementsof PADs, the PADs may therefore also turn out to be useful probes of alignment. Forinstance, when moving attention to larger and more complex molecules than previ-ously studied, photofragment imaging may not give an unequivocal measure for thedegree of alignment anymore. Suzuki and co-workers have experimentally demon-strated that the PADs resulting from two-photon ionization of the S1 state in pyrazinewere sensitive to the evolution of the rotational wave packet created in the excited stateby single photon excitation from the ground state [92, 133]. This experiment is anal-ogous to the rotational coherence spectroscopy experiments mentioned in Sec. 4.2, inparticular is the degree of alignment of the excited state not very high. This fact is,however, only encouraging since the anisotropy of the observed PADs may then beexpected to become further enhanced if the molecules are strongly aligned.
One concern regarding the use of PADs as a probe was discussed by Reid andco-workers [134, 135]. They found that the PADs from 1 + 1′ resonance enhancedtwo-photon ionization of p-difluorobenzene via the S1 state were almost independentof the alignment in the S1 state. Instead the PADs were primarily determined by thekinetic energy of the electrons. This behavior was ascribed to the presence of a shaperesonance (a single-electron excited state at energies above the ionization threshold).In other words, there is a chance that the emitted electron is temporarily trapped in thevicinity of the ion core and this interaction gives rise to large phase shifts for thoseoutgoing partial waves that posses the same symmetry as the resonant state. Bellmet al. [135] made a tentative assignment of the shape resonance to a delocalized π∗
state on the benzene ring and speculate that such resonances may commonly be foundin benzene derivatives. Their work pin-points the importance of taking structures inthe continuum into consideration when planning future experiments and calls for inputfrom theory to determine if the presence of a shape resonance, in general, reduces thesensitivity of PADs to alignment prior to ionization.
A part of my work in the laboratory was dedicated to establishing a setup for car-rying out time-resolved photoelectron imaging. In the paragraph below it is demon-strated that a working photoelectron imaging spectrometer was indeed build. Unfor-tunately, there was no time to carry out experiments measuring PADs from alignedmolecules. Such experiments are planned for the very near future in the laboratory.
91

92 Applications of aligned molecules
7.1.1 Demonstration of a working spectrometerTo prove that we can detect electrons and to calibrate the spectrometer, a test exper-iment was carried out on aniline. For this experiment, aniline was ionized with UVpulses created as the frequency-doubled output from the nanosecond dye laser. Thelow bandwidth of the dye laser (< 1 cm−1 or 0.12 meV) combined with the narrowline-width of the vibronic levels (< 2 cm−1 or 0.25 meV for the S0 → S1 00
0 transi-tion) means that electrons are produced with a perfectly well-defined kinetic energy;the measured energy distributions therefore directly reveal the resolution of our detec-tion technique. Aniline was chosen for calibration since its photoelectron spectrumhas been measured with high resolution and a full assignment carried out [136, 137].We chose 1+1 resonance enhanced two-photon ionization (R2PI) via the S0 → S1 00
0
transition to ionize the molecule (transition dipole perpendicular to the plane of themolecule). Fig. 7.1(c) shows a schematic energy level diagram for the process. Theenergy splitting between the ground state and the excited singlet state is larger thanhalf the adiabatic ionization potential IP. The photon energy needed for the transitionbetween these two states is therefore also high enough to ionize the molecule from theS1 state. The excess energy from the photon is shared between vibrational motion inthe molecular ion and kinetic energy for electrons
Eel = 2 hν − IP − Evib, (7.1)
where Evib is the vibrational energy (above the zero point energy) in the molecular ion.In the absence of vibronic couplings the relative strength of the photoelectron peaks isgiven be the Franck-Condon overlap between the S1 state and the ionic ground state[119]. The reasons for choosing R2PI are that first of all, the required wave length(λ = 293.785 nm in vacuum) is easily produced with our dye laser. Secondly, wecan directly compare our measured electron energies with the results from Meek et al.[136].
First, we must produce light at the wavelength for the S0 → S1 000 transition.
The dye laser is pumped by the 532 nm output from the nanosecond Nd:YAG laser,so using Rhodamine 610 dissolved in methanol we can produce tunable light in therange ∼570–600 nm with a maximum gain around 580 nm [138]. By doubling theoutput of the dye laser in a thick KDP-crystal we can then produce tunable UV light atwavelengths around 290 nm. The wavelength (or rather the frequency) of the visiblelight from the dye laser was calibrated with the Ne lines from a Th/Ne hollow-cathodelampa and checked with the sodium D-lines in another hollow cathode lamb. Carewas taken to avoid power broadening during both the calibration and while record-ing the photoelectron spectra. The next step was to ionize aniline. First, we foundthe wavelength for the S0 → S1 00
0 transition by focusing the UV pulses onto ourmolecular beam and while monitoring the yield of aniline molecular ions in the time-of-flight spectrum we scanned the wavelength of the dye laser (the power of the UV
aThe lines at 585.249 nm and 588.19 nm were used [75]
92

7.1 Photoelectron spectroscopy 93
(a) Aniline
(b) p-bromoaniline
Eel
hν
hν
M
M*
M+
IP
(c) Energy level scheme for R2PI
FIGURE 7.1: Photoelectron images for resonance enhanced two-photon ionization (R2PI)of (a) aniline and (b) p-bromoaniline. The relevant energy level scheme is shown in (c).
pulses was constantly monitored with a photodiode). At the intensities used for theseexperiments we observed no fragmentation of the aniline ions. The observed reso-nance wavelength λ = 293.785 nm was 0.09 nm (10 cm−1) lower than the previouslyreported value [137]. A possible explanation is that these authors may not have cor-rected for the refractive index for the UV light in air — they calibrated the laser usinga grating spectrometer which measures the wavelength rather than the frequency. Atslightly larger wavelengths λ = 294.13 nm we observed a small signal (at high power)from the hot band transition S0 → S1 I0
1 . This signal was very small compared to thesignal at the band origin and only observed at a low backing pressure (10 bar) so therelative population in the vibrationally excited state is very small under the conditionswhere the experiment was carried out (60 bar helium).
Now that we have identified the resonance frequency for the desired intermediatetransition we are ready to look for the electrons produced by the two-photon ionizationprocess. Fig. 7.1(a) shows the raw photoelectron image resulting from R2PI of ani-line; the center has been cut out to highlight the features at large radii (high energies).Careful examination of the image reveals several sharp rings, corresponding the cut-off radii for electrons at specific energies. The polarization the UV pulse was parallelto the plane of the detector so the original distribution of electron velocities possessedcylindrical symmetry. From the two-dimensional distribution on the detector we cantherefore extract the three-dimensional distribution of electron velocities via the in-
93

94 Applications of aligned molecules
0 100 200 300 400 500 600 700 8000
1
2
3
4
5
Electron kinetic energy (meV)
Sign
al (
arb.
uni
ts)
0+
1,2
34
5
6
789
1011
12
FIGURE 7.2: The photoelectron spectrum for R2PI of aniline via the S0 → S1 000 tran-
sition. The dominant peak at 720 meV are electrons coming from ions formed in thevibrational ground state. The assignment of the numbered peaks is given in Table 7.1.
verse Abel transformation (see Sec. 3.2.2), which can then further be converted to adistribution of electron kinetic energies. The obtained photoelectron kinetic energydistribution is shown in Fig. 7.2. The horizontal scale was fixed at one point only:by assigning the dominant, high-energy peak (0+) to electrons correlated with ionsin the vibrational ground state and making use of the well-known photon energy andionization potential (7.720 eV [139]) we can via Eq. (7.1) find the conversion fromradius (in pixels) to electron velocity. The radial distribution from the Abel inver-sion was then re-scaled according to this conversion factor and thereafter transformedto a kinetic energy distribution (taking into account the Jacobian determinant for thetransformation).
The peaks at energies below 720 meV are electrons correlated with ions created invibrationally excited states. All prominent peaks down to energies of 320 meV havebeen labelled with numbers on the graph; their assignment is shown in Table 7.1 andthe corresponding vibrational energy of the ion is compared with the results reportedby Meek et al. [136]. Most peaks agree within 10 meV, which at the highest electronenergies correspond to a distance of only half a pixel at the camera. It is concludedthat the observed energies agree well within the uncertainty in the determination of theposition of the electron hit. If needed the resolution could be enhanced by extendingthe flight distance or reducing the voltage on the extraction plates — the diameter ofthe outer ring in the image was only about half the size of the detector.
94

7.1 Photoelectron spectroscopy 95
TABLE 7.1: Assignment of peaks in the aniline photoelectron spectrum Fig. 7.2. Thereference energies in the last column are from Meek et al. [136].
Peak number Ekin (meV) Eion (meV) Ion state Erefion (meV)
1 684 36 16a1 452 664 56 6a1 673 617 103 11 994 594 126 121 1205 570 150 9a1 1456 520 200 8a1 1957 468 252 8a16a1 / 9a1 11 — / 2468 439 281 9a1 121 2639 422 298 8a1 11 29710 399 321 8a1 121 31311 378 342 8a1 9a1
12 325 395 8a2
Figure 7.1(b) show a photoelectron image for R2PI of p-bromoaniline via theS0 → S1 11
0 transition. The photoelectron spectrum, shown in Fig. 7.3, is domi-nated by two peaks, one at 470 meV which is correlated with ions formed in the 9a1
vibrational state and one at 275 meV corresponding to the formation of ion the 8a19a1
vibrational state [140]. Overall, the spectrum seems more noisy and further assign-ment of the other peaks has not been attempted.
Apart from the electron energies, the imaging technique also allows us to extractthe angular distribution of the photoelectrons. From the images in Fig. 7.1 one maybe tempted to conclude that for aniline there is no angular preference, while for p-bromoaniline an anisotropy can be observed in the image. To substantiate this wefitted the angular distributions from the Abel inversion to an expansion in Legendrepolynomials. For a two-photon transition we must include the two first even-orderpolynomials [124], that is
I(θ) = I0[1 + β2P2(cos θ) + β4P4(cos θ)]. (7.2)
For aniline we indeed find that the asymmetry parameters βi are very small (−0.01 <β2 < 0.06(±0.02), depending on the electron energy). The angular distributions forp-bromoaniline on the contrary are asymmetric at most energies and β2 changes sign,that is the preferred direction for the electrons changes from parallel to perpendic-ular to the laser polarization. For the three kinetic energy ranges marked with theshaded area in Fig. 7.3 we found β
(1)2 = 0.15± 0.01, β
(2)2 = 0.03± 0.02 and β
(3)2 =
−0.16±0.02. The β4-parameters were found to be negligible in all three cases. This isexactly the same behavior as that observed for p-difluorobenzene by Bellm et al. [135].
95

96 Applications of aligned molecules
0 100 200 300 400 5000
1
2
3
4
5
6
7
8
Electron kinetic energy(meV)
Sign
al (
arb.
uni
ts)
(1) (2) (3)
FIGURE 7.3: Photoelectron spectrum for p-bromoaniline resulting from R2PI via theS0 → S1 11
0 transition. The dominant peaks at 470 meV and 275 meV correspond toions in the 9a1 and 8a19a1 vibrational states respectively.
It is therefore tempting to ascribe it to the presence of a shape resonance, but such as-signment would require a detailed study like that of Bellm et al. [135]. It would beinteresting to align the molecules adiabatically and measure the photoelectron angulardistributions for the aligned molecules to test if the PADs are insensitive to alignment.In that case one must be careful about the intensity for the alignment laser. First ofall, the Stark shift induced by the infrared laser will shift the resonance. Secondly, onemust be careful to avoid ponderomotive acceleration of the electrons by the intensitygradient of the focused nanosecond laser [96].
In conclusion, a working photoelectron imaging spectrometer has been demon-strated with a resolution of ∼20 meV at 700 meV kinetic energy. This resolution canprobably be nearly doubled.
7.2 Strong field physics
Stable, table-top femtosecond lasers delivering milli-Joule pulses with durations below50 fs have almost become standard in laboratories seeking to study high intensityeffects. Modest focusing of such pulses easily produces intensities above 1015 W/cm2.At these intensities most atoms and molecules will become at least singly ionized,but the emitted electron is born in the presence of a strong, oscillating electric fieldso in the case of linear polarization the electron is steered back and may re-scatterwith its parent ion within one or two half-cycles for the optical field. This scatteringevent can occur in three ways: 1) elastically, 2) inelastically or 3) as a recombination
96
7.2 Strong field physics 97
between the electron and the ion [141]. If the electron scatters elastically, the outcomeis an unusually high electron kinetic energy; this process is known as above thresholdionization (ATI) since it corresponds to the absorbtion of a higher number of photonsthan needed to reach the ionization threshold. In the case that the electron scattersinelastically, it will cause either direct double ionization or excitation in the residualion which will then subsequently be further ionized by the laser field [142, 143]. Thisprocess leads to unusually high double ionization rates at intensities below saturationof single ionization and is known as non-sequential double ionization. For moleculesthe process can also lead to fragmentation if the doubly-charged molecular ion is notstable. Finally, the electron can recombine with the parent ion with the emission of asingly VUV/XUV photon, a process known as high-order harmonic generation (HHG)[144]. This process is particularly interesting for a number of reasons. First of all, itallows generation of high intensity laser pulses in the VUV/XUV spectral regions bytable-top systems [145] and progress has been made towards the generation of X-ray laser pulses. Secondly, the generated XUV pulses are actually trains of attosecondpulses and when special care is taken, single attosecond pulses can be generated [146].Such pulses are the shortest pulses created to date and open the possibility for directtemporal studies of correlated electron dynamics [147]. Finally, the harmonics emittedfrom a molecule are sensitive to the structure of the molecule and may therefore beused as probes for molecular dynamics with sub-femtosecond time-resolution [148].
7.2.1 Single ionizationSingle ionization is the event that triggers all of these scattering events, so it is ofcourse crucial to understand this step in detail. Ab inito models are numerically toodemanding for anything more complex than the hydrogen molecule, so approximatesingle-active electron models must be used. For atoms the models by Kelysh andReiss can be used to calculate multi-photon ionization rates [149, 150]. The com-mon foundation for these models is the strong field approximation: the assumptionthat in the final state the interaction of the electron with the laser field dominates overits Coulomb interaction with the residual ion. The final state used in these models istherefore a Volkov state. This assumption leads to ionization rates that are about twoorders of magnitude too low. The discrepancy is often resolved by introducing a WKBcorrection [151, 152]. Keldysh introduced an adiabaticity parameter γ =
√Ip/2Up,
where Ip is the ionization potential and Up = E20/4ω2 (in atomic units) is the pon-
deromotive potential for the quiver motion of the electron in the oscillating electricfield E(t) = E0 cos(ωt). In the limit of a large Keldysh parameter the ionization dy-namics becomes quasistatic and the ionization rate is determined by the instantaneousamplitude of the electric field. In this limit the ionization event can be described by astunnelling of an electron through the barrier created by the external field and the fieldfrom the ion. The tunnelling model derived by Keldysh underestimates the ionizationrate by one or two orders of magnitude, but an improved model by Ammosov, Delone
97

98 Applications of aligned molecules
and Krainov (the ADK-model) [153] that takes into account the Coulomb interactionin the final state describes the ionization rate of atoms well in the quasistatic limit forintensities below barrier suppression [154].
For molecules the situation is more complicated. Measurements of the ionizationrates of small molecules compared to atoms of nearly the same ionization potentialrevealed that ADK theory was insufficient to describe tunnelling ionization of mole-cules [155–161]. It was realized that the theoretical models had to take into accountthe structure of the molecular orbitals, in particular, the occurrence of nodal planes isimportant [159, 162–164]. A simple argument can be made to illustrate why this isthe case. During strong field ionization by a linearly polarized laser the electrons areusually emitted close to polarization vector since this is the direction of the externalforce; in the tunnelling picture this is the direction where the barrier is most narrow.If we now consider ionization of a molecule with a nodal plane in the highest occu-pied molecular orbital and oriented such that the polarization of the laser field is inthe nodal plane, then the electron density is zero in the direction of the laser field. Forsuch orientations the ionization rate is therefore strongly suppressed compared to thatof an atom.
These considerations have inspired several theoretical studies of ionization ofaligned molecules [165–171]. As the simple argument from above suggests, the cal-culations show that both the total ionization rate and the angular distribution of theemitted electrons depend on the relative orientation of the molecule and the laser field.Significant discrepancies still persist between measured and calculated (orientation av-eraged) ionization rates [172], but the recent measurements of strong field ionizationof aligned molecules [173, 174] may provide important clues to the discrepancies. Forinstance, based on the measurement of the ionization rate for aligned N2 molecules[173], Kjeldsen and Madsen [168] showed that the choice of gauge the strong fieldapproximation plays an important role; while the velocity gauge formulation of thestrong field approximation gave the wrong qualitative behavior for the angular depen-dence of the ionization rate, the length gauge SFA agreed with the experiments.
As an example, lets us consider ionization of the ethylene molecule (Fig. 7.4(a))by an 800 nm laser pulse. To calculate the ionization rate we use the length gaugeSFA. Consistent with the neglect of electron correlations implied by the single-activeelectron approximation, we use the Hartree-Fock wave function for the initial state.Assuming a Slater determinant with the highest occupied orbital (HOMO) replaced bya Volkov state for the final state(i.e. an un-relaxed ion core), the N -electron problemreduces to a one-electron problem involving only the transition from the HOMO ψ(r)to the laser-dressed continuum. The angular differential ionization rate can then beexpressed as [171, 175]
dW
dq=
∞∑n=n0
∣∣Aqn
∣∣2 qn, (7.3)
where q is the direction of the outgoing electron and n0 is smallest number fulfilling
98

7.2 Strong field physics 99
Z,e
zq
(a) HOMO of ethylene
0 10 20 30 40 50 60 70 80 900
2
4
6
8
10
12
θ (degrees)
Y(θ
) / Y
(θ=
0)
Average
χ = 0°
χ = 90°
(b) Ionization rate W (θ) for ethylene
FIGURE 7.4: Angular dependence for the ionization yield of ethylene exposed to a 20 fs,800 nm pulse with a peak intensity of 5 · 1013 W/cm2. (a) HOMO of ethylene and thedefinition of the molecule- and space-fixed z (Z) axes. χ is zero for the shown orientation(the body fixed (x, y) component of the polarization is perpendicular to the plane of themolecule). (b) Angular dependence of the ionization rate calculated in the strong-fieldapproximation (length gauge) for three situations: χ = 0, 90 and averaged over allvalues of χ.
energy conservation n~ω ≥ Ip + Up. The transition amplitudes
Aqn =1T
∫ T
0
dt(−Ip − 1
2Q2n(t)
)ψ (Qn(t))
× exp i
(nωt + qn ·α0 sin(ωt) +
Up
2ωsin(2ωt)
), (7.4)
are evaluated at the average momentum for the electron in the oscillating electric fieldqn =
√2(nω − Ip − Up). Qn(t) = qn + A(t) is the time-dependent momentum
for the electron is the laser field with vector potential A(t) = A0 cos(ωt), and α0 =A0/ω is the quiver radius for the electron. We see that the initially bound state entersthe expression via its momentum space representation ψ(q). For the length gaugeversion of the strong-field approximation, the Coulomb correction factor is not needed[168, 172].
Figure 7.4(b) shows the result of calculations of the total ionization rate
W = 2π
∞∑n=n0
∫ ∣∣Aqn
∣∣2 qndq, (7.5)
as a function of the relative orientation between the C−C axis and the polarizationof the laser field. Three curves are shown, one for χ = 0 where the polarization of
99
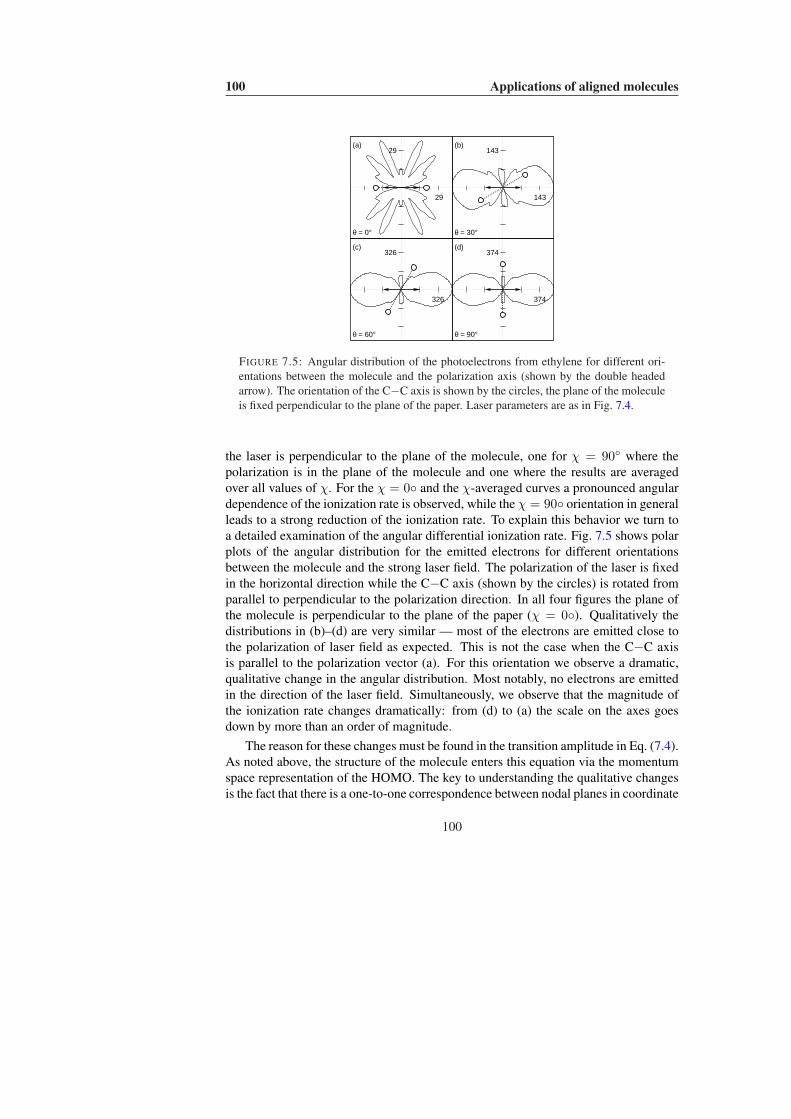
100 Applications of aligned molecules
29
29
(a)
θ = 0°
143
143
(b)
θ = 30°
326
326
(c)
θ = 60°
374
374
(d)
θ = 90°
FIGURE 7.5: Angular distribution of the photoelectrons from ethylene for different ori-entations between the molecule and the polarization axis (shown by the double headedarrow). The orientation of the C−C axis is shown by the circles, the plane of the moleculeis fixed perpendicular to the plane of the paper. Laser parameters are as in Fig. 7.4.
the laser is perpendicular to the plane of the molecule, one for χ = 90 where thepolarization is in the plane of the molecule and one where the results are averagedover all values of χ. For the χ = 0 and the χ-averaged curves a pronounced angulardependence of the ionization rate is observed, while the χ = 90 orientation in generalleads to a strong reduction of the ionization rate. To explain this behavior we turn toa detailed examination of the angular differential ionization rate. Fig. 7.5 shows polarplots of the angular distribution for the emitted electrons for different orientationsbetween the molecule and the strong laser field. The polarization of the laser is fixedin the horizontal direction while the C−C axis (shown by the circles) is rotated fromparallel to perpendicular to the polarization direction. In all four figures the plane ofthe molecule is perpendicular to the plane of the paper (χ = 0). Qualitatively thedistributions in (b)–(d) are very similar — most of the electrons are emitted close tothe polarization of laser field as expected. This is not the case when the C−C axisis parallel to the polarization vector (a). For this orientation we observe a dramatic,qualitative change in the angular distribution. Most notably, no electrons are emittedin the direction of the laser field. Simultaneously, we observe that the magnitude ofthe ionization rate changes dramatically: from (d) to (a) the scale on the axes goesdown by more than an order of magnitude.
The reason for these changes must be found in the transition amplitude in Eq. (7.4).As noted above, the structure of the molecule enters this equation via the momentumspace representation of the HOMO. The key to understanding the qualitative changesis the fact that there is a one-to-one correspondence between nodal planes in coordinate
100
7.2 Strong field physics 101
space and in momentum space. As seen from Fig. 7.4(a) the plane of the moleculeis a nodal plane for the coordinate space representation of the wave function. Themolecular plane is therefore also a nodal plane for the momentum space representationof the HOMO. When the polarization vector coincides with the molecular plane theterm ψ (Qn(t)) (where Qn(t) = qn + A(t)) in Eq. (7.4) is therefore zero for qn
parallel to A(t). Not only does this explain the angular dependence for the χ = 0orientation, it also explains why the ionization rate is so much lower for the χ = 90orientation: for χ = 90 the laser polarization always coincides with the molecularplane independent of θ. We are hereby lead to a general statement: for moleculesof symmetry species Cs or higher (containing a plane of reflection) and containing anodal plane the ionization rate is expected to be reduced for orientation where the laserpolarization coincides with the nodal plane.
The dramatic changes in the photoelectron angular distributions imposed by thepresence of a nodal plane in the HOMO may be important to take into account wheninterpreting re-scattering experiments on molecules. Bhardwaj et al. [176] were thefirst to consider this point. They measured the ellipticity dependence of the yield ofdoubly charged benzene ions and of some fragments ions. From the measurementsthey concluded that re-scattering the was the dominant mechanism behind the produc-tion of these ions, but observed an anomalous behavior at small ellipticities. The effectwas ascribed to the presence of nodal planes in the HOMO of benzene; as demon-strated by the calculations above, nodal planes in the HOMO are, for some orienta-tions, transferred to the wave packet in the continuum. For these orientations we may,therefore, expect a a lower re-scattering cross section for linear polarization than fora slightly elliptical polarization. The experiments were carried out on randomly ori-ented molecules so the observed effect was very small. Repeating the experiment withaligned molecules may help to confirm the interpretation. Alnaser et al. [177, 178]carried out experiments where they measured the angular dependence of dissociativeionization induced by re-scattering for a range of small molecules. The observeddependence was ascribed to the angular dependence of the first ionization step by aqualitative comparison with molecular ADK calculations. One may, however, spec-ulate on the importance of a plausible angular dependence of the re-scattering stepas just described. The experiments by Alnaser et al. cannot disentangle the angularselectivity of the ionization step and of the re-scattering step. Further measurement ofthe angular dependence of the single ionization rate and of the photoelectron angulardistribution may help to elucidate the details of the mechanism.
In ending the discussion of single ionization of molecules we note that the the-ory discussed above is only valid in the limit where multi-photon excitation to ex-cited states can be neglected. For larger molecules nonadiabatic multi-electron effectsbecome important due to the larger delocalization of the valence electrons and thepresence of low lying excited states [179–182]. There is a lack of both theory andexperiment on the orientational dependence of these effects, but based on the quali-tative arguments behind these models it might be expected that these phenomena are
101

102 Applications of aligned molecules
strongly alignment dependent.
7.2.2 High-order harmonic generationDue to its many future applications, high-order harmonic generation has attracted avast amount of attention over the years. Most recently, there has been a rapidly grow-ing interest in HHG from aligned molecules [55–59, 183–186]. In particular exper-iments on aligned molecules have shown that the intensity of the emitted harmonicsare sensitive to the relative orientation between the molecule and the polarization ofthe driving laser. Lein et al. [187] showed that this angular dependence can qualita-tively be explained by considering the atoms in the molecule as point emitters whosephase is determined by the phase of the re-colliding wave packet as it returns to eachof these sites. Since there is perfect temporal coherence between these point emit-ters the harmonics emitted from the atomic sites in the molecule will interfere inthe far field. For a diatomic molecule with the vector R pointing from one atomto the other, the phase difference between the harmonics emitted from the two atomsis kel ·R = 2πR/λel cos(θ) with kel being the wave vector for the returning electronand θ the angle between the electric field and the internuclear axis. Harmonics ofa given order correspond to electrons returning with a given kinetic energy and thusa given de Broglie wavelength, so the fixed magnitude of R/λel thereby determinesthe alignment angle for which there is positive interference (maximum yield) and themodulation depth is largest when the de Broglie wavelength is similar to the internu-clear distance. Since λel is determined by the energy of the emitted harmonics, theinterference is directly related to the structure of the molecule [57, 59], and structuralchanges should be observable as changes in the harmonic spectrum for aligned mole-cules. Perhaps even more spectacularly Itatani et al. [185] showed that by measuringthe harmonic spectrum (including all the relative phases) as a function of the align-ment angle it was possible to carry out a tomographic reconstruction of the highestoccupied orbital of N2. All in all these findings pave the way for a completely newtype of measurements of ultra-fast dynamics [148].
102
CHAPTER 8
What’s next?
The previous chapter dealt with some of the applications of aligned molecules thatshould emerge in the following years. Before ending this Dissertation it is appropriateto discus some ideas for future directions of laser induced alignment as well — whatdevelopments are needed to take laser induced alignment one step further in terms ofits usefulness as a tool? This Chapter starts with a discussion of the very importantproblem of three dimensional alignment where progress is currently made at a highspeed. The discussion involves a scheme that has recently been demonstrated in ourgroup. As previously mentioned three-dimensional alignment is important becausemost molecules are asymmetric tops. Studies of orientational effects in such mole-cules naturally involves confinement of all three Euler angles — free rotation of theφ-angle obscures the observation of anisotropies perpendicular to the axis of highestpolarizability. The second section contains a more speculative discussion about align-ment of flexible molecules. This necessarily includes considerations of how one canactually probe alignment of such molecules.
8.1 Three-dimensional alignmentThe idea of obtaining three-dimensional (3D) alignment was introduced in Section 2.4and two schemes based on the use of elliptically polarized pulses were discussed. The
103

104 What’s next?
use of a long pulse with elliptical polarization is conceptually clear: the moleculeswill slowly be guided into the orientations of minimum energy, that is with the axis ofhighest polarizability along the major axis of the field and the axis of second highestpolarizability along the minor axis of the field. The scheme inherently involves a trade-off between how well the axis of highest polarizability is aligned and the confinementin the φ-angle. With a short pulse the dynamical aspect complicates matters; themolecules get an asymmetric rotational kick which involves motion in all three Eulerangles, but the speed of rotation depends on the moments of inertia, the polarizabilitytensor and on the initial orientation of the molecule. In this scheme the ellipticity ofthe alignment pulse seems to be fixed by this delicate balance.
To circumvent or at least minimize the trade-off in the choice of ellipticity, Under-wood et al. [48] suggested the use of two temporally separated pulses with orthogonalpolarizations; the idea was to use the first pulse (defining the lab-fixed Z axis) to alignthe axis of highest polarizability and then, close to the time of best alignment, send thesecond pulse (defining the lab-fixed X axis) to kick the axis of second highest polar-izability into alignment in the plane perpendicular to the Z axis. In a numerical studythe authors compared this scheme to the two schemes proposed above (although thelong pulse was rapidly truncated to produce field-free alignment) and concluded thatthe use use of two separate pulses is superior. By sending an orthogonally polarizedpulse at the time where the molecules are best aligned, the deteriorating effect of theX-component of the electric field on the alignment of the axis of highest polarizabilityis minimized and a high degree of three dimensional alignment is obtained.
As a variant of this scheme we have studied 3D-alignment using a combination ofa long and a short pulse. The long (adiabatic) pulse is used to align the axis of highestpolarizability and the short pulse, synchronized to the peak of the long pulse, makesthe molecules spin around this axis. The advantage of using adiabatic alignment tolinearly align the axis of highest polarizability is that, as previously discussed, wegenerally find adiabatic alignment to be superior to one pulse nonadiabatic alignment.The scheme has been tested experimentally on 3,4-dibromothiophene (see Fig. 5.2).The components of the polarizability tensor for this molecule were given in Sec. 5.2;the axis of highest polarizability is along the C2 symmetry axis (the b axis), while theaxis of second highest polarizability is in the plane of the molecule and orthogonal tob axis (the a axis). The long pulse will therefore align the symmetry axis and shortpulse will, if the molecules are well aligned, enforce rotation around the b axis.
One remaining concern is if we are able to faithfully probe the degree of alignmentof both the symmetry axis and of the plane of the molecule. We chose to use laser-triggered Coulomb explosion, but as discussed in Sec. 5.1, the use of this technique forprobing alignment requires special attention to the artifacts that geometrical alignmentmay induce. To avoid enhanced ionization, which has strong angular selectivity andcan lead to depletion of subsets of molecules, we use very short (25 fs) and intense(2 · 1014 W/cm2) pulses to multiply ionize the molecules. By observing the recoildirection of S+ ions we obtain information about the linear alignment of the symmetry
104

8.1 Three-dimensional alignment 105
axis, whereas Br+ ions are used to reveal alignment of the molecular plane. Sinceour method of detection can only measure the two-dimensional projection of the iondistribution in a direction perpendicular to the propagation direction of the lasers, wemust align the molecules in two different directions compared to the time-of-flight axisto obtain information about the alignment of both the symmetry axis and the molecularplane. To (partially) measure alignment of the symmetry axis the molecules must bealigned with this axis parallel to the plane of the detector, while a measurement of thealignment of the molecular plane is best obtained when the symmetry axis is alignedperpendicular to plane of the detector. In both cases the polarization of the probe laseris linear and parallel to the polarization of the long pulse. On the one hand, this meansthat the detection of the sulphur ions is directionally biased, but we can still obtain arelative (qualitative) measure for the degree of linear alignment. On the other hand, thedetection of Br+ ions has no angular bias in the plane of the detector. One of the mostserious concerns regarding the use of Coulomb explosion to probe alignment is thatthe sometimes strong directional selectivity may result in only a subset of moleculesbeing probed. Here, strong alignment of the symmetry axis minimizes this effect andwe have good reason to believe that the S+ and Br+ ions do not stem from differentsubsets of the ensemble.
We now turn to the experimental results. Figure 8.1 shows a series of false colorion images which directly reveals 3D-alignment. In the lower left corner the polariza-tions of the three laser pulses relative to the plane of the detector are shown. WhenS+ is detected (rows A, C) the long alignment pulse and the probe pulse are verticallypolarized, whereas the short alignment pulse is polarized perpendicular to the plane ofthe detector. The centers of these images have been cut out to remove a large signalfrom O+
2 (the experiment was carried out on the old system; oxygen stems from resid-ual gas in the chamber and from the molecular beam). When Br+ is detected (rows B,D) all polarizations are rotated by 90. Column 1 shows images obtained with onlythe probe pulse present; as expected the Br+ distribution is circularly symmetric (B1),while the S+ image (A1) reveals the angular selectivity imposed by the probe. Whenthe long pulse (1064 nm, 9 ns, 1.4 · 1012 W/cm2) is included, the symmetry axis iswell aligned along the polarization of this pulse as revealed by image A2 but the φ-angle remains unrestricted, resulting in a still circularly symmetric Br+ image in B2.To induce 3D-alignment we now include the short alignment pulse (800 nm, 0.7 ps,10 · 1012 W/cm2 in rows A, B and 2.5 · 1012 W/cm2 in rows C,D). Columns 3–6 showion images obtained for different delays of the probe pulse with respect to the shortalignment pulse (time is shown under each pair of images). If we start with the resultsfor the strong kick (rows A and B), we see that immediately after the short alignmentpulse the Br+ distribution has been dramatically changed (B3) — rather than beingcircularly symmetric it now has an elongated, cigar shape. This image provides com-pelling evidence for alignment of the molecular plane. Referring to the correspondingS+ distribution (A3), we see that the symmetry axis is still strongly confined; in fact,the vertical strip is even narrower than in A2. This added confinement is a conse-
105

106 What’s next?
A
B
probe only probe & ns 1 ps 2 ps 3 ps 5 ps
Pulse polarizations 1 ps 3 ps 5 ps 7 ps
C
D
ns ps probe
ns ps probe
1 2 3 4 5 6
S+
Br+
S+
Br+
FIGURE 8.1: Ion images showing three-dimensional alignment of 3,4-dibromothiopheneby the combination of a short and a long pulse. See text for details.
quence of the confinement of the φ-angle to the plane perpendicular to the detector.More worrying is the fact that the radial distributions have also changed. This couldindicate that the molecules are aligned to the plane spanned by the polarization of thetwo alignment lasers, but that the symmetry axis is not aligned along the polarizationof the long pulse. A comparison with images taken with circular polarization for thelong pulse and no short pulse present reveals that linear alignment is to a large extendpreserved (the distribution in A3 still looks like a figure eight, not a pancake). Mea-surements of the full velocity distribution, for instance using slice imaging techniques[188, 189], are needed to provide more details on this point. The rows C and D showimages recorded with the intensity of the short alignment pulse reduced by a factor offour, all other parameters are fixed. The images show that the alignment of the mole-cular plane, as revealed by the Br+ images in D3–D6, evolves more slowly and thatthe maximum degree of alignment is slightly lower. Further, the S+ distribution is lessaffected by the weaker pulse. This is exactly the behavior that is expected from thelower kick strength.
Preliminary measurements indicate that this technique is superior to the use ofadiabatic alignment alone with an elliptically polarized pulse. A next generation of
106

8.2 Flexible molecules 107
experiments, which will benefit from the lower temperatures and thus higher degreesof alignment in the new setup, are planned for the very near future. The question ofwhich method to use for obtaining the optimal 3-D alignment is still not fully set-tled and will require further contributions from both theory and experiments to beanswered. It is, however, clear that the answer will depend on the type of applica-tion. Reactive scattering experiments on aligned molecules (or oriented by combininglaser induced alignment and electrostatic orientation [107, 108]) will require the mole-cules to be aligned for long periods of time since typical supersonic valves producegas-pulses with µs durations and the single-molecule diffraction scheme proposed bySpence and Doak [90] uses cw-sources. Contrarily, for studies of strong-field physics(Sec. 7.2) the molecules will only need to be transiently aligned.
A true challenge, not only for 3D-alignment but also for linear alignment, is toaddress the possible use of alignment in femtosecond pump-probe spectroscopy. Thispoint is far from trivial. Obviously, if adiabatic alignment is used, one runs the risk ofstrongly perturbing the process under study. Pump-probe experiments are particularlysensitive since they usually involve dynamics in electronically excited state. First ofall, excited states are much more easily ionized than the ground state and secondly,polyatomic molecules often contain a plethora of excited states so accidental reso-nances with higher lying states may be hard to avoid. If adiabatic alignment cannotbe used we must turn to nonadiabatic alignment, but then the molecules only stayaligned for a short time so, unless the process under study is ultra-fast, the degree ofalignment will change between the early and late probe stages. One could envisionthat, rather than aligning the molecules prior to the pump, the alignment pulse couldbe send briefly before the probe pulse. This approach must also be taken with caution.First of all, the alignment pulse may perturb the system in an unwanted way for thesame reason that adiabatic was found to be troublesome. Secondly, the response of thedifferent electronically excited states to the external electric field (the polarizability),and thereby the degree of alignment, may be very different.
8.2 Flexible moleculesDoes an intense, non-resonant laser pulse affect the conformation of flexible mole-cules? This question will be important to answer before laser induced alignment canfully mature to become a reliable tool in the study of large molecules.
Molecules often exist in many different conformations. Some of these confor-mations are trapped in potential wells that are deep compared to thermal energies atroom temperature and therefore exist as distinct chemical species — they are knownas isomers of the molecule. Z/E (or cis/trans) configurations of a C−−C double bondis a prominent example of this case. Other conformations exist as energy minima in ashallow potential, whose barriers may be crossed at thermal energies. The three stag-gered conformations that may be formed by rotations around a C−C single bond are
107

108 What’s next?
typically separated by barriers of about 130 meV, so at room temperature and on thetime-scale of minutes there is essentially free rotation around this bond. This changesunder the very cold, collision-free conditions in a supersonic jet: the three conformersthen exist as distinct, stable geometries. Since a barrier of 130 meV between themis still larger than the typical interaction energies for the molecules presented in thisDissertation, we do not expect that the presence of a non-resonant laser will changethe conformation of small molecules. As one goes to larger molecules the number oflocal minima increase correspondingly. The energy difference between these minimacan be very small, but the barriers are often still on the order of 50–100 meV andthe conformers that are found a room temperature can again be identified as isolatedspecies in supersonic expansions [190]. For moderately large molecules one shouldthus not expect the interaction with the laser to suppress the barrier between the dif-ferent conformers, but it may provide a coupling between the isolated wells and thusinduce conformational changes. A short pulse might, for instance, induce stimulatedRaman transitions to other conformations.
Even if the laser cannot change the conformation of a molecule, the different con-formers might still have different polarizabilities and moments of inertia and thus aligndifferently. Previous experiments in our lab were aimed at exploring nonadiabaticalignment of a molecule with different conformers [91]. The molecule used in thoseexperiments, 1-iodopropane, comes in one anti and two gauche conformers. The antiand gauche conformers have different moments of inertia and may thus be expectedto have different revivals times. The experiments were complicated by the fact thatthe principal axes of the inertia and the polarizability tensors are not coincident eitherwith each other or with the direction of the C−I bond (which is the recoil direction forthe iodine atom upon UV dissociation). The observed distribution of recoil directionsfor the iodine atoms is therefore a convolution of the probability of dissociating a C−Ibond with the lab-frame distribution of these bond directions. This distribution is itselfa convolution of the lab-frame distribution of the principal axes (for either the polariz-ability or inertia tensor) with the distribution of C−I bond directions in the molecularframe. All in all, the observed revival transients were very weak and hard to interpret,but did show small changes in the degree of alignment at times corresponding to therevival time for the two conformers.
Those experiments expose the difficulties in using resonant dissociation as a probeof alignment for molecules where the recoil frame does not coincide with the principalaxes frame. Obviously, Coulomb explosion will, to some extent, suffer from the samedifficulties and has its own issues regarding geometrical alignment and the accompa-nying depletion effects. Further, the breakup of larger molecules may be complicatedby charge-asymmetric states and fragments carrying away energy in rotational andvibrational modes. As focus is moved to larger molecules new probe techniques aretherefore needed. One such probe might be photoelectron angular distributions, butit is difficult to extract quantitative information about the degree of alignment fromthe PADs. Further theoretical work is needed to provide more insight to the amount
108

8.2 Flexible molecules 109
of information that can be extracted from such measurements. The most promisingroute may be to carry out linear dichroism measurements on electronic and vibrationaltransitions — this has as a very important application the possibility of assisting theassignment of spectroscopic transitions in samples containing molecules with differentconformers [111, 190].
109


CHAPTER 9
Summary
Molecules in general have asymmetric shapes and many of their properties, for in-stance bi-molecular reaction rates or their interaction with polarized light, depend ontheir orientation in space. In a normal gas-phase experiment the sample of mole-cules will be randomly oriented, so any measured observable will be orientationallyaveraged and details of the underlying physics may be obscured. In this Dissertationseveral methods of using intense non-resonant lasers to obtain control over the spa-tial orientation of molecules have been demonstrated. Laser-induced alignment is aversatile tool since the only requirement for the molecule is that the polarizability isanisotropic, that is have different values along different directions in the molecule, andthat the molecule is able to survive the applied field; the interaction with the electricfield of the laser will then lead to a torque on the molecule, forcing the most polariz-able axis in the molecules towards the polarization of the laser.
The experiments are carried out on a cold molecular beam and we use chargedphoto-fragment imaging to measure the degree of alignment. Either resonant dissoci-ation induced by an ultraviolet femtosecond pulse followed by resonant multi-photonionization by a nanosecond pulse or Coulomb explosion induced by a very shortand intense femtosecond pulse is used to probe the degree of alignment. When themolecule starts to dissociate (or explode due to the Coulomb repulsion) the momentof inertia increases rapidly, thus freezing out any rotational motion. If the fragments
111

112 Summary
recoil along a well-defined direction in a coordinate system fixed to the molecule, ameasurement of the recoil velocity of such fragments will reveal the orientation ofthe molecule in a laboratory-fixed coordinate system. We use electrostatic lenses toimage the recoil velocity onto a position-sensitive detector and use the distribution ofion hits on the detector to extract information about the average spatial orientation forour sample of molecules.
When the duration of the laser pulse is sufficiently short compared to the rotationaltimescale for the molecule, the molecule gets a rotational kick towards the polarizationaxis and becomes aligned after the pulse. The alignment does, however, persist onlyfor a short while — the angular velocity imposed by the kick from the laser causesthe molecules to rotate away from the polarization axis. The degree of alignment isobserved to depend on the intensity and duration of the alignment laser and on theinitial rotational temperature of the molecules. Lowering the rotational temperaturealways improves the degree of alignment. The choice of laser parameters, especiallythe pulse duration, is more subtle. The intensity is limited from above by the onset ofmulti-photon ionization, but the degree of alignment may saturate at lower intensities.Determining the optimal pulse duration involves balancing between maximizing thekick-strength of the laser pulse and keeping the molecules aligned under field-freeconditions, i.e. after the pulse.
In classical mechanics only the dynamics immediately after the pulse would beinteresting since this is the only time the molecules would be aligned, but the rotationalenergies are quantized so the wave packet induced by the short pulse can rephase,leading to recurrences in the degree of alignment with a period corresponding to therotational period. For linear molecules and symmetric tops the wave packet at therevivals is a perfect reconstruction of the wave packet immediately after the pulse sothe revivals continue to occur for long periods of time; experimentally we measuredthe 42nd revival for methyliodide and were limited only by the length of the delaystage. For asymmetric tops the revivals are only partial rephasings of the initiallyexcited wave packet, so the degree of alignment at the revivals is reduced comparedto that observed just after the pulse. For the near-symmetric top iodobenzene weobserved two different revival times, corresponding to rotational motion around anaxis perpendicular to the symmetry axis and with a moment of inertia equal to theaverage moment of inertia perpendicular to the symmetry axis, and to rotation aboutthe c-axis.
For many applications it is desirable to have the molecules as well aligned as pos-sible. It is therefore interesting to identify schemes that can optimize the degree ofalignment. Guided by a theoretical proposal, we showed experimentally and numeri-cally that two properly chosen pulses can significantly enhance the degree of alignmentcompared to that obtainable with just one pulse. The calculations also highlighted theimportance of considering the effects of focal-volume averaging, which may signifi-cantly reduce the effective degree of alignment compared to the alignment in the centerof the focus.
112

113
Some of the applications of aligned molecules that have appeared in the recentyears were also discussed. In strong field physics it is, for instance, now recognizedthat ionization rates for molecules depend on the orientation of the molecule with re-spect to the polarization of the laser. Measurements of ionization rates for alignedmolecules might therefore be important to settle current disputes on which theoreticalmodels to use. Also the emission of high-order harmonics has been shown to dependstrongly the alignment of the molecules with respect to the driving field. Anotherimportant future application of aligned molecules is in photoelectron spectroscopy.When randomly oriented molecules are ionized, the often richly structured molecularframe photoelectron angular distributions are concealed by orientational averaging.When molecules are aligned, the molecular frame is brought to coincide with the labo-ratory frame and the observed angular distributions should tend towards the molecularframe distribution.
113


APPENDIX A
Calculating the degree ofalignment
In Sections 2.2 and 2.3 the procedure for calculating adiabatic and nonadiabatic align-ment was outlined. In this Appendix the relevant matrix elements are given as well assome details on central points from the numerical implementation used for calculatingnonadiabatic alignment for symmetric tops. Further it is shown how angular distribu-tions can be extracted. All the relevant angular momentum algebra can be found in thebook of Zare [36].
A.1 Symmetric top matrix elements
For calculating both adiabatic and nonadiabatic alignment the critical point is to cal-culate the matrix elements of the Hamiltonian
H = Hrot + V
= BJ2 + (A−B)J2z −
E20
4(∆α cos2 θ + α⊥
). (A.1)
115

116 Calculating the degree of alignment
The first two terms in the last equation stem from the field-free symmetric top Hamil-tonian and are thus inherently diagonal in the symmetric top basis
〈J ′K ′M ′|Hrot|JKM〉 =[BJ(J + 1) + (A−B)K2
]δJ,J ′δK,K′δM,M ′ . (A.2)
In the interaction term the only nontrivial task is to calculate the matrix elements ofcos2 θ. To obtain this we rewrite cos2 θ in terms of the Wigner rotation matrix
cos2 θ =23D2
0,0(Ω) +13, (A.3)
with Ω = (φ, θ, χ) as a collective index for the three Euler angles. Since the spatialrepresentation of the symmetric top wave functions is proportional to a Wigner rotationmatrix
〈R|JKM〉 = (−1)M−K
[2J + 18π2
] 12
DJ−M−K(Ω), (A.4)
the matrix elements of cos2 θ are readily calculating using (3.118) in Zare. The resultis
〈JKM | cos2 θ|J ′K ′M ′〉= 2
3 〈JKM |D200(Ω)|J ′K ′M ′〉+ 1
3 〈JKM |J ′K ′M ′〉
=[
23 (2J + 1)
12 (2J ′ + 1)
12 (−1)M−K
(J J ′ 2K −K 0
)(J J ′ 2M −M 0
)
+ 13 δJ,J ′
]δM,M ′ δK,K′ .
(A.5)
This result explicitly shows that states of different K and M quantum numbers are notcoupled. The Wigner 3-j symbols are only nonzero when |J − J ′| ≤ 2 and for theseanalytical expressions can be found in Table 2.5 in Zare. In the case of nonadiabaticalignment this result is also used to calculate the observable 〈cos2 θ〉 for the wavepacket.
A.2 Angular distributions
For calculations of both adiabatic and nonadiabatic alignment the wave function foundby determining the expansion coefficients in the symmetric top basis, that is findingthe cJ′’s in
|ψ〉 =∑
J′cJ ′ |J ′KM〉, (A.6)
116

A.2 Angular distributions 117
Using this expansion, an expression for the angular distribution is readily found
P (θ) =∫ 2π
0
∫ 2π
0
|〈R|ψ〉|2 dφ dχ
=∑
J′|cJ′ |2
(J ′ + 1
2
) (dJ′−M−K(θ)
)2
+∑
J′<J ′′2 Re (cJ′c
∗J ′′)
(J ′ + 1
2
) 12
(J ′′ + 1
2
) 12 dJ ′
−M−K(θ) dJ′′−M−K(θ),
(A.7)
where dJM ′,M (θ) is Wigner’s reduced rotation matrix. The angular distribution is nor-
malized such that ∫ π
0
P (θ) sin θ dθ = 1. (A.8)
The elements of the reduced rotation matrix can be evaluated using (3.57) in Zare
dJM ′M (θ) =
∑ν
(−1)ν [(J + M)! (J −M)! (J + M ′)! (J −M ′)!]12
(J −M ′ − ν)! (J + M − ν)! (ν + M ′ −M)! ν!
×[cos
(θ
2
)]2J+M−M ′−2ν [− sin
(θ
2
)]M ′−M+2ν
,
(A.9)
where the index ν runs over all integer values for which the arguments of the factorialsare nonnegative.
For small, linear molecules like N2 and O2 thermally averaged angular distribu-tions can readily be calculated at experimentally realistic temperatures (50 K) andintensities (50 TW/cm2) on a standard PC. Calculating angular distributions for largersymmetric tops is on the other hand a computationally very demanding task due tothe smaller rotational constants and the extra degree of freedom. The reason for theangular distributions being so troublesome lies is the double sum over products ofreduced rotations matrices. Even at intensities lower than those employed in our ex-periments a basis set of 60 J states is needed and the size scaling of the computationtime is probably quadratic in J due to the double sum. These high J states also leadto another concern: the numerical stability in the calculation of the reduced rotationmatrix elements. The value of the matrix element is in the range [−1 ; 1] but is ob-tained by a fine tuned cancellation of large alternating terms in Eq. (A.9). For high Jvalues each of factorials involve very large numbers (and small for the reciprocals) androunding errors of the numbers in the computer therefore become an issue. The nu-merical stability was checked by monitoring the normalization of the rotation matrices(Eq. (3.113) in Zare). Starting from J in the low fifties (the exact number being depen-dent on K, M ) the normalization abruptly starts to diverge. For the heavy molecules
117

118 Calculating the degree of alignment
studied in our group it has therefore only been possible to extract angular distributionsat experimentally realistic conditions for adiabatic alignment.
A.3 Numerical implementation for calculating nonadiabaticalignment
Units of polarizability
In quantum chemistry calculations of molecular polarizability most often find whatis called the polarizability volume (given in Å3). The polarizability, αi, entering inEq. (2.1) is related to the polarizability volume, α′i, by α′ = α/(4πε0). The relationbetween electric field strength, E0 and the intensity of field is I = cε0E2
0/2. All in allthis yields
V0 = E20α =
8π
cIα′ (A.10)
With V0/~ in ps−1 (THz) we therefore find
V0
~=
8π
~cIα′ = 7.9495592825 · I(TW/cm2) ·α′(Å3
) [ps−1] (A.11)
Propagation in the field
While the molecules are interacting with the laser pulse we can only obtain the wavefunction by direct solution of the coupled differential equations in Eq. (2.18). Manyapproaches can be used to do so. Since we can expect the solutions to be well behaved,no singularities should occur and their magnitude is limited from above, we can readilymake use of Runge-Kutta methods. A well balanced method for carrying out adaptivestep-size integration of the equations is the Cash-Karp imbedded method which isbased on a clever combination of a fourth and a fifth order Runge-Kutta solution [28].By using an adaptive step-size routine we only need to be sure that the first couple ofsteps are sufficiently small and that the routine has enough flexibility for readjustingthe step-size during the evolution of the laser pulse. If these conditions are fulfilledthe routine will automatically adjust the temporal step size to to follow the evolutionof the coefficients faithfully. We can thus expect a gain in computational speed atlow intensities and during the rising edge of the pulse as compared to a fixed step-size routine. The numerical stability has been tested by changing the error tolerance.Further, calculations have been carried out on linear molecules using the same codewith K = 0 and compared to published results from several independent groups [27,52, 192]. Please note an error in the latter publication: in Eq. (3) the numerical factorin f(t) is a factor of two too low so that intensities quoted are a factor of two too high.
118

A.3 Numerical implementation for calculating nonadiabatic alignment 119
Partition function and the selection of initial states
Thermally averaged calculations are carried out by launching calculations from arange of initial states representing the thermal ensemble. The selection of initial statesis done according to their statistical weight. At first the partition function is calculatedby summing over all states in the basis (the size of the basis must always be largeenough that the contribution from the high J end of the basis is negligible and thesum has converged). The states are then sorted according to their statistical weight. Alist of populated initial states is then created by summing the statistical weights in thesorted list until the sum reaches a value of 99.9 % of the partition function. For tert-butyliodide at a temperature of 1 K about 300 states are included in the set of initialstates (counting only states of non-negative K, M ).
By examination of the interaction matrix elements it is readily seen that these onlydepend on the relative sign of K and M , not on their absolute values. Thus instead ofexploring all four combinations ±K,±M we need only the |K|, |M | and −|K|, |M |combinations (for the calculation of 〈cos2 θ〉); care must of course be taken to handlethe K = 0 and/or M = 0 situations correctly. This small symmetry considerationdoes however cut down the number of initial states by nearly a factor of two and thusreduces the computational time for thermally averaged calculations by the same factor.
The possible use of Monte Carlo sampling at high (dimensionless) temperaturesseems to be worth consideration. This could faithfully sample the thermal ensembleby using a significantly lower number of states.
Intensity dependent size of basis set
To make the most efficient use of the computer time the size of the basis set waschosen to be dependent on the intensity. This is particularly useful for carrying outfocal volume averaged calculations. The procedure is aimed at situations where manycalculations are to be carried out for the same molecule with only modest changes inthe conditions as was the case for the two pulse calculations on tert-butyliodide.
To find the minimal basis set size for tert-butyliodide calculations were carried outin a large basis set (Jmax = 90) for a few initial states. For each of these calculations thepopulation distribution was examined to find the highest state, Jm, with a populationabove 10−3. The minimal basis size was then chosen to be Jmax = Jm + 5 sincehigher J states may be populated during the interaction with the laser pulse (for longerpulse durations this effect can be quite pronounced). For tert-butyliodide the initialstates were |000〉 and |15, 5, 5〉 (highest J state populated at a temperature of 2 K). InFig. A.1 Jmax is plotted versus intensity for a 1 ps alignment pulse. Also shown is aquadratic fit to the points; in the intensity region examined the basis set size is wellfit by a second order polynomial. This fit is what the program use to determine thebasis. The intensity dependence is quite pronounced; in the intensity regime exploredin the two pulse calculations the size varies by a factor of two. The computational
119

120 Calculating the degree of alignment
1 2 3 4 5 6 7
30
40
50
60
70
Intensity (TW/cm2)
J max
FIGURE A.1: Dots: Estimate of the minimal basis size as function of peak intensity.Dotted line: quadratic fit to the points. See text for details.
time used at the low intensities turns out to faster by roughly the same factor. Forthe calculations with a pulse duration of 2 ps the size of the basis set was expandedby another 15 J states. Once the intensity dependence was settled calculations werecarried out at a fixed intensity for a handful of different initial states to check that thebasis was sufficient for these states as well. In general, the states with large initial Jrequired the largest basis but the initial states dependence was modest: about 10 morestates was necessary for Ji = 15 compared to Ji = 0. As a final check, the evolutionof 〈cos2 θ〉was calculated with intensity dependent choice of basis set and with a largebasis set. The results were almost exactly identical.
120

REFERENCES
[1] H. Stapelfeldt and T. Seidemann, Colloquium: Aligning molecules with stronglaser pulses, Rev. Mod. Phys. 75, 543 (2003).
[2] D. H. Parker and R. B. Bernstein, Oriented Molecule Beams via the Electro-static Hexapole: Preparation, Characterization, and Reactive Scattering, Ann.Rev. Phys. Chem. 40, 561 (1989).
[3] B. Friedrich, D. P. Pullman, and D. R. Herschbach, Alignment and Orientationof Rotationally Cool Molecules, J. Phys. Chem. 95, 8118 (1991).
[4] H. J. Loesch and A. Remscheid, Brute force in molecular reaction dynamics: Anovel technique for measuring steric effects, J. Chem. Phys. 93, 4779 (1990).
[5] B. Friedrich and D. Herschbach, Alignment and Trapping of Molecules in In-tense Laser Fields, Phys. Rev. Lett. 74, 4623 (1995).
[6] D. Normand, L. A. Lompre, and C. Cornaggia, Laser-induced molecular align-ment probed by a double-pulse experiment, J. Phys. B 25, L497 (1992).
[7] D. T. Strickland, Y. Beaudoin, P. Dietrich, and P. B. Corkum, Optical studies ofinertially confined molecular iodine ions, Phys. Rev. Lett. 68, 2755 (1992).
[8] E. Constant, H. Stapelfeldt, and P. B. Corkum, Observation of Enhanced Ion-ization of Molecular Ions in Intense Laser Fields, Phys. Rev. Lett. 76, 4140(1996).
121

122 REFERENCES
[9] T. Seideman, M. Y. Ivanov, and P. B. Corkum, Role of Electron Localization inIntense-Field Molecular Ionization, Phys. Rev. Lett. 75, 2819 (1995).
[10] C. H. Lin, J. P. Heritage, and T. K. Gustafson, Susceptibility Echos in LinearMolecular Gases, Apl. Phys. Lett. 19, 397 (1971).
[11] J. P. Heritage, T. K. Gustafson, and C. H. Lin, Observation of Coherent Tran-sient Birefringence in CS2 Vapor, Phys. Rev. Lett. 34, 1299 (1975).
[12] P. Felker, Rotational coherence spectroscopy: studies of the geometries of largegas-phase species by picosecond time-domain methods, J. Phys. Chem. 96,7844 (1992).
[13] P. M. Felker and A. H. Zewail, Molecular Structures from Ultrafast Coher-ence Spectroscopy, in Femtosecond Chemistry, edited by J. Manz and L. Wöste(VCH (Weinheim) 1995), pp. 193–260.
[14] T. Seideman, Rotational excitation and molecular alignment in intense laserfields, J. Chem. Phys. 103, 7887 (1995).
[15] T. Seideman, Revival Structure of Aligned Rotational Wave Packets, Phys. Rev.Lett. 83, 4971 (1999).
[16] J. Ortigoso, M. Rodriguez, M. Gupta, and B. Friedrich, Time evolution of pen-dular states created by the interaction of molecular polarizability with a pulsednonresonant laser field, J. Chem. Phys. 110, 3870 (1999).
[17] W. Kim and P. M. Felker, Spectroscopy of pendular states in optical-field-aligned species, J. Chem. Phys. 104, 1147 (1996).
[18] J. J. Larsen, H. Sakai, C. P. Safvan, I. Wendt-Larsen, and H. Stapelfeldt, Align-ning molecules with intense nonresonan laser fields, J. Chem. Phys. 111, 7774(1999).
[19] H. Sakai, C. P. Safvan, J. J. Larsen, K. M. Hilligsøe, K. Hald, and H. Stapelfeldt,Controlling the alignment of neutral molecules by a strong laser field, J. Chem.Phys. 110, 10235 (1999).
[20] J. J. Larsen, K. Hald, N. Bjerre, H. Stapelfeldt, and T. Seideman, Three Dimen-sional Alignment of Molecules Using Elliptically Polarized Laser Fields, Phys.Rev. Lett. 85, 2470 (2000).
[21] F. Rosca-Pruna and M. J. J. Vrakking, Experimental Observation of RevivalStructures in Picosecond Laser-Induced Alignment of I2, Phys. Rev. Lett. 87,153902 (2001).
122

REFERENCES 123
[22] C. M. Dion, A. Keller, O. Atabek, and A. D. Bandrauk, Laser-induced align-ment dynamics of HCN: Roles of the permanent dipole moment and the polar-izability, Phys. Rev. A 59, 1382 (1999).
[23] B. J. Sussman, J. G. Underwood, R. Lausten, M. Y. Ivanov, and A. Stolow,Quantum control via the dynamic Stark effect: Application to switched rota-tional wave packets and molecular axis alignment, Phys. Rev. A 73, 053403(2006).
[24] B. Friedrich and D. Herschbach, Polarization of Molecules Induced by IntenseNonresonant Laser Fields, J. Phys. Chem. 99, 15686 (1995).
[25] B. A. Zon and B. G. Katsnel’son, Nonresonant scattering of intense light by amolecule, Sov. Phys.-JETP 42, 595 (1976).
[26] L. D. Landau and E. M. Lifshitz, Quantum Mechanics (Non-relativistic theory)(Butterworth-Heinemann, Oxford 1991), third edition.
[27] R. Torres, R. de Nalda, and J. P. Marangos, Dynamics of laser-induced mole-cular alignment in the impulsive and adiabatic regimes: A direct comparison,Phys. Rev. A 72, 023420 (2005).
[28] W. H. Press, S. T. Teukolsky, W. T. Vetterling, and B. P. Flannery, NumericalRecipes in C++ (Cambridge University Press, Cambridge 2002).
[29] P. Atkins and R. Friedman, Molecular Quantum Mechanics (Oxford UniversityPress, Oxford 2005), fourth edition.
[30] U. Even, J. Jortner, D. Noy, N. Lavie, and C. Cossart-Magos, Cooling of largemolecules below 1 K and He clusters formation, J. Chem. Phys. 112, 8068(2000).
[31] M. Hillenkamp, S. Keinan, and U. Even, Condensation limited cooling in su-personic expansions, J. Chem. Phys. 118, 8699 (2003).
[32] T. Seideman, On the dynamics of rotationally broad, spatially aligned wavepackets, J. Chem. Phys. 115, 5965 (2001).
[33] B. Friedrich and D. Herschbach, Statistical mechanics of pendular molecules,Int. Rev. Phys. Chem. 15, 325 (1996).
[34] I. S. Averbukh and R. Arvieu, Angular Focusing, Squeezing, and RainbowFormation in a Strongly Driven Quantum Rotor, Phys. Rev. Lett. 87, 163601(2001).
[35] M. Leibscher, I. S. Averbukh, and H. Rabitz, Molecular Alignment by Trains ofShort Laser Pulses, Phys. Rev. Lett. 90, 213001 (2003).
123

124 REFERENCES
[36] R. N. Zare, Angular Momentum (Wiley-Interscience, New York 1988).
[37] I. S. Averbukh and N. F. Perelman, Fractional Revivals: Universality in thelong-term evolution of quantum wave packets beyond the correspondence prin-ciple dynamics, Phys. Lett. A 139, 449 (1989).
[38] F. Rosca-Pruna and M. J. J. Vrakking, Revival structures in picosecond laser-induced alignment of I2 molecules. II. Numerical modeling, J. Chem. Phys. 116,6579 (2002).
[39] F. Rosca-Pruna and M. J. J. Vrakking, Revival structures in picosecond laser-induced alignment of I2 molecules. I. Experimental results, J. Chem. Phys. 116,6567 (2002).
[40] P. W. Dooley, I. V. Litvinyuk, K. F. Lee, D. M. Rayner, M. Spanner, D. M. Vil-leneuve, and P. B. Corkum, Direct imaging of rotational wave-packet dynamicsof diatomic molecules, Phys. Rev. A 68, 023406 (2003).
[41] M. Spanner, E. A. Shapiro, and M. Ivanov, Coherent Control of RotationalWave-Packet Dynamics via Fractional Revivals, Phys. Rev. Lett. 92, 093001(2004).
[42] C. Ellert and P. B. Corkum, Disentangling molecular alignment and enhancedionization in intense laser fields, Phys. Rev. A 59, R3170 (1999).
[43] M. J. Weida and D. J. Nesbitt, Collisional alignment of CO2 rotational angularmomentum states in a supersonic expansion, J. Chem. Phys. 100, 6372 (1994).
[44] V. Aquilanti, D. Ascenzi, D. Cappelletti, and F. Pirani, Velocity dependenceof collisional alignment of oxygen molecules in gaseous expansions, Nature(London) 371, 399 (1994).
[45] F. Pirani, D. Cappelletti, M. Bartolomei, V. Aquilanti, M. Scotoni, M. Vescovi,D. Ascenzi, and D. Bassi, Orientation of Benzene in Supersonic Expansions,Probed by IR-Laser Absorption and by Molecular Beam Scattering, Phys. Rev.Lett. 86, 5035 (2001).
[46] J. J. Larsen, Laser Induced Alignment of Neutral Molecules, Ph.D. thesis, Insti-tute of Physics and Astronomy, University of Aarhus (2000).
[47] E. Péronne, M. D. Poulsen, C. Z. Bisgaard, H. Stapelfeldt, and T. Seideman,Nonadiabatic Alignment of Asymmetric Top Molecules: Field-Free Alignmentof Iodobenzene, Phys. Rev. Lett. 91, 043003 (2003).
[48] J. G. Underwood, B. J. Sussman, and A. Stolow, Field-Free Three DimensionalMolecular Axis Alignment, Phys. Rev. Lett. 94, 143002 (2005).
124

REFERENCES 125
[49] J. J. Larsen, I. Wendt-Larsen, and H. Stapelfeldt, Controlling the BranchingRatio of Photodissociation Using Aligned Molecules, Phys. Rev. Lett. 83, 1123(1999).
[50] M. D. Poulsen, E. Skovsen, and H. Stapelfeldt, Photodissociation of laseraligned iodobenzene: Towards selective photoexcitation, J. Chem. Phys. 117,2097 (2002).
[51] V. Renard, M. Renard, S. Guérin, Y. T. Pashayan, B. Lavorel, O. Fraucher,and H. R. Jauslin, Postpulse Molecular Alignment Measured by a Weak FieldPolarization Technique, Phys. Rev. Lett. 90, 153601 (2003).
[52] V. Renard, M. Renard, A. Rouzée, S. Guérin, H. R. Jauslin, B. Lavorel, andO. Faucher, Nonintrusive monitoring and quantitative analysis of strong laser-field-induced impulsive alignment, Phys. Rev. A 70, 33420 (2004).
[53] J. G. Underwood, M. Spanner, M. Y. Ivanov, J. Mottershead, B. J. Sussman,and A. Stolow, Switched Wave Packets: A Route to Nonperturbative QuantumControl, Phys. Rev. Lett. 90, 223001 (2003).
[54] S. Zamith, Z. Ansari, F. Lepine, and M. J. J. Vrakking, Single-shot measurementof revival structures in femtosecond laser-induced alignment of molecules, Opt.Lett. 30, 2326 (2005).
[55] R. Velotta, N. Hay, M. B. Mason, M. Castillejo, and J. P. Marangos, High-Order Harmonic Generation in Aligned Molecules, Phys. Rev. Lett. 87, 183901(2001).
[56] M. Lein, N. Hay, R. Velotta, J. P. Marangos, and P. L. Knight, Role of the In-tramolecular Phase in High-Harmonic Generation, Phys. Rev. Lett. 88, 183903(2002).
[57] C. Vozzi, F. Calegari, E. Benedetti, J.-P. Caumes, G. Sansone, S. Stagira,M. Nisoli, R. Torres, E. Heesel, N. Kajumba, J. P. Marangos, C. Altucci, andR. Velotta, Controlling Two-Center Interference in Molecular High HarmonicGeneration, Phys. Rev. Lett. 95, 153902 (2005).
[58] J. Itatani, D. Zeidler, J. Levesque, M. Spanner, D. M. Villeneuve, and P. B.Corkum, Controlling High Harmonic Generation with Molecular Wave Pack-ets, Phys. Rev. Lett. 94, 123902 (2005).
[59] T. Kanai, S. Minemoto, and H. Sakai, Quantum interference during high-order harmonic generation from aligned molecules, Nature (London) 435, 470(2005).
125

126 REFERENCES
[60] K. Hoshina, K. Yamanouchi, T. Ohshima, Y. Ose, and H. Todokoro, Directobservation of molecular alignment in an intense laser field by pulsed gas elec-tron diffraction I: observation of anisotropic diffraction image, Chem. Phys.Lett. 353, 27 (2002).
[61] F. Rosca-Pruna, E. Springate, H. L. Offerhaus, M. Krishnamurthy, N. Farid,C. Nicole, and M. J. J. Vrakking, Spatial alignment of diatomic molecules inintense laser fields: I. Experimental results, J. Phys. B 34, 4919 (2001).
[62] H. Tanji, S. Minemoto, and H. Sakai, Three-dimensional molecular orientationwith combined electrostatic and elliptically polarized laser fields, Phys. Rev. A72, 063401 (2005).
[63] F. Légaré, K. F. Lee, I. V. Litvinyuk, P. W. Dooley, A. D. Bandrauk, D. M. Vil-leneuve, and P. B. Corkum, Imaging the time-dependent structure of a moleculeas it undergoes dynamics, Phys. Rev. A 72, 052717 (2005).
[64] G. Scoles (editor), Atomic and molecular beam methods, volume I (OxfordUniversity Press 1988).
[65] D. W. Chandler and P. L. Houston, Two-dimensional imaging of state-selectedphotodissociation products detected by multiphoton ionization, J. Chem. Phys.87, 1445 (1987).
[66] A. T. J. B. Eppink and D. H. Parker, Velocity map imaging of ions and electronsusing electrostatic lenses: Application in photoelectron and photofragment ionimaging of molecular oxygen, Rev. Sci. Instr. 68, 3477 (1997).
[67] M. J. J. Vrakking, An iterative procedure for the inversion of two-dimensionalion/photoelectron imaging experiments, Rev. Sci. Intr. 72, 4084 (2001).
[68] V. Dribinski, A. Ossadtchi, V. A. Mandelshtam, and H. Reisler, Reconstructionof Abel-transformable images: The Gaussian basis-set expansion Abel trans-form method, Rev. Sci. Instr. 73, 2634 (2002).
[69] J. D. Jackson, Classical Electrodynamics (Wiley (New York) 1999), third edi-tion.
[70] S. Backus, C. G. Durfee III, M. M. Murnane, and H. C. Kapteyn, High powerultrafast lasers, Rev. Sci. Instr. 69, 1207 (1998).
[71] P. Y. Cheng, D. Zhong, and A. H. Zewail, Kinetic-energy, femtosecond resolvedreaction dynamics. Modes of dissociation (in iodobenzene) from time-velocitycorrelations., Chem. Phys. Lett. 237, 399 (1995).
126

REFERENCES 127
[72] A. T. J. B. Eppink and D. H. Parker, Energy partitioning following photodis-sociation of methyl iodide in the A band: A velocity mapping study, J. Chem.Phys. 110, 832 (1999).
[73] J. E. Freitas, H. J. Hwang, and M. A. El-Sayed, Molecular Rotation Clock-ing of the Subpicosecond Energy Redistribution in Molecules Falling Apart. 2.Excess Energy Dependence of the Rates of Energy Redistribution in the TwoPhotodissociation Channels of Iodobenzene, J. Phys. Chem. 97, 12481 (1993).
[74] Y. S. Kim, W. K. Kang, D.-C. Kim, and K.-H. Jung, Photodissociation of tert-Butyl Iodide at 277 and 304 nm: Evidence for Direct and Indirect Dissociationin A-Band Photolysis of Alkyl Iodide, J. Phys. Chem. A 101, 7576 (1997).
[75] NIST Physical Reference Data, http://physics.nist.gov/PhysRefData/contents.html (2006).
[76] S. Unny, Y. Du, L. Zhu, K. Truhins, R. J. Gordon, A. Sugita, M. Kawasaki,Y. Matsumi, R. Delmdahl, D. H. Parker, and A. Berces, Above-Threshold Ef-fects in the Photodissociation and Photoionization of Iodobenzene, J. Phys.Chem. A 105, 2270 (2001).
[77] J. Olesen, Generation of sub 20 fs laser pulses and Coulomb explosion studiesof D2, Master’s thesis, Department of Chemistry, University of Århus (1999).
[78] E. Péronne, M. D. Poulsen, H. Stapelfeldt, C. Z. Bisgaard, E. Hamilton, andT. Seideman, Nonadiabatic laser-induced alignment of iodobenzene molecules,Phys. Rev. A. 70, 63410 (2004).
[79] M. D. Poulsen, T. Ejdrup, H. Stapelfeldt, E. Hamilton, and T. Seideman, Align-ment enhancement by the combination of a short and a long laser pulse, Phys.Rev. A 73, 033405 (2006).
[80] W. J. O. Thomas, J. T. Cox, and W. Gordy, Millimeter Wave Spectra and Cen-trifugal Stretching Constants of the Methyl Halides, J. Chem. Phys. 22, 1718(1954).
[81] A. M. Mirri and W. Caminati, Quadrupole hyperfine structure in the rotationalspectrum of iodobenzene, Chem. Phys. Lett. 8, 409 (1971).
[82] S. H. Young and S. G. Kukolich, Microwave Measurements and Calculations ofQuadrupole Coupling Effects in CH3I and CD3I, J. Mol. Spec. 114, 483 (1985).
[83] W. Winkle and H. Hartmann, Microwave Spectrum of tert-butyliodide - Analysisof rotation spectra with quadrupole hyperfine structure, Zeitschrift für Natur-forschung A 25, 840 (1970).
127

128 REFERENCES
[84] C. H. Townes and A. L. Schawlow, Microwave spectroscopy (McGraw-Hill(New York) 1955).
[85] E. Hamilton, T. Seideman, T. Ejdrup, M. D. Poulsen, C. Z. Bisgaard, S. S.Viftrup, and H. Stapelfeldt, Alignment of symmetric top molecules by short laserpulses, Phys. Rev. A 72, 043402 (2005).
[86] S. Ramakrishna and T. Seideman, Intense Laser Alignment in Dissipative Mediaas a Route to Solvent Dynamics, Phys. Rev. Lett. 95, 113001 (2005).
[87] J. Q. Williams and W. Gordy, Microwave Spectra and Molecular Constants ofTertiary Butyl Chloride, Bromide, and Iodide, J. Chem. Phys. 18, 994 (1950).
[88] M. D. Poulsen, E. Péronne, H. Stapelfeldt, C. Z. Bisgaard, S. S. Viftrup,E. Hamilton, and T. Seideman, Nonadiabatic alignment of asymmetric topmolecules: Rotational revivals, J. Chem. Phys. 121, 783 (2004).
[89] S. Ryu, R. M. Stratt, and P. M. Weber, Diffraction Signals of Aligned Moleculesin the Gas Phase: Tetrazine in Intense Laser Fields, J. Phys. Chem. A 107,6622 (2003).
[90] J. C. H. Spence and R. B. Doak, Single Molecule Diffraction, Phys. Rev. Lett.92, 198102 (2004).
[91] M. D. Poulsen, Alignment of molecules induced by long and short laser pulses,Ph.D. thesis, Department of Chemistry, University of Aarhus (2005).
[92] M. Tsubouchi, B. J. Whitaker, L. Wang, H. Kohguchi, and T. Suzuki, Pho-toelectron Imaging on Time-Dependent Molecular Alignment Created by aFemtosecond Laser Pulse, Phys. Rev. Lett. 86, 4500 (2001).
[93] A. E. Bragg, R. Wester, A. V. Davis, A. Kammrath, and D. M. Neumark,Excited-state detachment dynamics and rotational coherences of C−2 via time-resolved photoelectron imaging, Chem. Phys. Lett. 376, 767 (2003).
[94] Y. Suzuki and T. Seideman, Mapping rotational coherences onto time-resolvedphotoelectron imaging observables, J. Chem. Phys. 122, 234302 (2005).
[95] J. G. Underwood and K. L. Reid, Time-resolved photoelectron angular distribu-tions as a probe of intramolecular dynamics: Connecting the molecular frameand the laboratory frame, J. Chem. Phys. 113, 1067 (2000).
[96] R. R. Freeman, T. J. McIlrath, P. H. Bucksbaum, and M. Bashkansky, Pondero-motive effects on angular distributions of photoelectrons, Phys. Rev. Lett. 57,3156 (1986).
128

REFERENCES 129
[97] A. E. Bragg, J. R. R. Verlet, A. Kammrath, and D. M. Neumark, C−6 electronicrelaxation dynamics probed via time-resolved photoelectron imaging, J. Chem.Phys. 121, 3515 (2004).
[98] A. Abdurahman, A. Shukla, and G. Seifert, Ab initio many-body calculationsof static dipole polarizabilities of linear carbon chains and chainlike boronclusters, Phys. Rev. B 66, 155423 (2002).
[99] A. Van Orden and R. J. Saykally, Small Carbon Clusters: Spectroscopy, Struc-ture, and Energetics, Chem. Rev. 98, 2313 (1998).
[100] M. Leibscher, I. S. Averbukh, and H. Rabitz, Enhanced molecular alignment byshort laser pulses, Phys. Rev. A 69, 013402 (2004).
[101] C. Z. Bisgaard, M. D. Poulsen, E. Péronne, S. S. Viftrup, and H. Stapelfeldt, Ob-servation of Enhanced Field-Free Molecular Alignment by Two Laser Pulses,Phys. Rev. Lett. 92, 173004 (2004).
[102] K. F. Lee, I. V. Litvinyuk, P. W. Dooley, M. Spanner, D. M. Villeneuve, andP. B. Corkum, Two-pulse alignment of molecules, J. Phys. B 37, L43 (2004).
[103] C. Horn, M. Wollenhaupt, M. Krug, T. Baumert, R. de Nalda, and L. Bañares,Adaptive control of molecular alignment, Phys. Rev. A 73, 031401 (2006).
[104] M. Renard, E. Hertz, S. Guérin, H. R. Jauslin, B. Lavorel, and O. Faucher,Control of field-free molecular alignment by phase-shaped laser pulses, Phys.Rev. A 72, 025401 (2005).
[105] K. F. Lee, E. A. Shapiro, D. M. Villeneuve, and P. B. Corkum, Coherent cre-ation and annihilation of rotational wave packets in incoherent ensembles,Phys. Rev. A 73, 033403 (2006).
[106] K. F. Lee, D. M. Villeneuve, P. B. Corkum, and E. A. Shapiro, Phase Con-trol of Rotational Wave Packets and Quantum Information, Phys. Rev. Lett. 93,233601 (2004).
[107] B. Friedrich and D. Herschbach, Enhanced orientation of polar molecules bycombined electrostatic and nonresonant induced dipole forces, J. Chem. Phys.111, 6157 (1999).
[108] B. Friedrich and D. Herschbach, Manipulating Molecules via Combined Staticand Laser Fields, J. Phys. Chem. A 103, 10280 (1999).
[109] L. Cai, J. Marango, and B. Friedrich, Time-Dependent Alignment and Orien-tation of Molecules in Combined Electrostatic and Pulsed Nonresonant LaserFields, Phys. Rev. Lett. 86, 775 (2001).
129

130 REFERENCES
[110] M. Machholm and N. E. Henriksen, Field-Free Orientation of Molecules, Phys.Rev. Lett. 87, 193001 (2001).
[111] F. Dong and R. E. Miller, Vibrational Transition Moment Angles in IsolatedBiomolecules: A Structural Tool, Science 298, 1227 (2002).
[112] R. Righini, Ultrafast Optical Kerr Effect in Liquids and Solids, Science 262,1386 (1993).
[113] R. A. Bartels, T. C. Weinacht, N. Wagner, M. Baertschy, C. H. Greene, M. M.Murnane, and H. C. Kapteyn, Phase Modulation of Ultrashort Light Pulsesusing Molecular Rotational Wave Packets, Phys. Rev. Lett. 88, 013903 (2002).
[114] V. Kalosha, M. Spanner, J. Herrmann, and M. Ivanov, Generation of Single Dis-persion Precompensated 1-fs Pulses by Shaped-Pulse Optimized High-OrderStimulated Raman Scattering, Phys. Rev. Lett. 88, 103901 (2002).
[115] R. A. Bartels, N. L. Wagner, M. D. Baertschy, J. Wyss, M. M. Murnane, andH. C. Kapteyn, Phase-matching conditions for nonlinear frequency conversionby use of aligned molecular gases, Opt. Lett. 28, 346 (2003).
[116] V. Blanchet, M. Z. Zgierski, T. Seideman, and A. Stolow, Discerning vibronicmolecular dynamics using time-resolved photoelectron spectroscopy, Nature(London) 401, 52 (1999).
[117] A. Stolow, Femtosecond Time-Resolved Photoelectron Spectroscopy of Poly-atomic Molecules, Annu. Rev. Phys. Chem. 54, 89 (2003).
[118] A. Stolow, A. E. Bragg, and D. M. Neumark, Femtosecond Time-Resolved Pho-toelectron Spectroscopy, Chem. Rev. 104, 1719 (2004).
[119] D. M. Neumark, Time-Resolved Photoelectron Spectroscopy of Molecules andClusters, Annu. Rev. Phys. Chem. 52, 255 (2001).
[120] T. Seideman, Time-resolved photoelectron angular distributions: A nonpertur-bative theory, J. Chem. Phys. 107, 7859 (1997).
[121] T. Seideman, Time-resolved photoelectron angular distributions as a probe ofcoupled polyatomic dynamics, Phys. Rev. A 64, 042504 (2001).
[122] T. Seideman, Time-Resolved Photoelectron Angular Distributions: Concepts,Applications and Directions, Annu. Rev. Phys. Chem. 53, 41 (2002).
[123] D. Dill, Fixed-molecule photoelectron angular distributions, J. Chem. Phys. 65,1130 (1976).
130

REFERENCES 131
[124] K. L. Reid, Photoelectron Angular Distributions, Annu. Rev. Phys. Chem. 54,397 (2003).
[125] A. M. Rijs, M. H. M. Janssen, E. t. H. Chrysostom, and C. C. Hayden, Femto-second Coincidence Imaging of Multichannel Multiphoton Dynamics, Phys.Rev. Lett. 92, 123002 (2004).
[126] J. A. Davies, R. E. Continetti, D. W. Chandler, and C. C. Hayden, FemtosecondTime-Resolved Photoelectron Angular Distributions Probed during Photodis-sociation of NO2, Phys. Rev. Lett. 84, 5983 (2000).
[127] R. E. Continetti, Coincidence Spectroscopy, Annu. Rev. Phys. Chem. 52, 165(2001).
[128] O. Gessner, A. M. D. Lee, J. P. Shaffer, H. Reisler, S. V. Levchenko,A. I. Krylov, J. G. Underwood, H. Shi, A. L. L. East, D. M. Wardlaw,E. t. H. Chrysostom, C. C. Hayden, and A. Stolow, Femtosecond Multidimen-sional Imaging of a Molecular Dissociation, Science 311, 219 (2006).
[129] P. Downie and I. Powis, Molecule-Frame Photoelectron Angular Distributionsfrom Oriented CF3I Molecules, Phys. Rev. Lett. 82, 2864 (1999).
[130] A. Landers, T. Weber, I. Ali, A. Cassimi, M. Hattass, O. Jagutzki, A. Nauert,T. Osipov, A. Staudte, M. H. Prior, H. Schmidt-Böcking, C. L. Cocke, andR. Dörner, Photoelectron Diffraction Mapping: Molecules Illuminated fromWithin, Phys. Rev. Lett. 87, 013002 (2001).
[131] R. R. Lucchese, A. Lafosse, J. C. Brenot, P. M. Guyon, J. C. Houver, M. Lebech,G. Raseev, and D. Dowek, Polar and azimuthal dependence of the molecularframe photoelectron angular distributions of spatially oriented linear mole-cules, Phys. Rev. A 65, 020702 (2002).
[132] K. L. Reid and J. G. Underwood, Extracting molecular axis alignment fromphotoelectron angular distributions, J. Chem. Phys. 112, 3643 (2000).
[133] M. Tsubouchi, B. J. Whitaker, and T. Suzuki, Femtosecond PhotoelectronImaging on Pyrazine: S1 → T1 Intersystem Crossing and Rotational Coher-ence Transfer, J. Phys. Chem. A 108, 6823 (2004).
[134] S. M. Bellm and K. L. Reid, Reevaluation of the Use of Photoelectron AngularDistributions as a Probe of Dynamical Processes: Strong Dependence of SuchDistributions from S1 Paradifluorobenzene on Photoelectron Kinetic Energy,Phys. Rev. Lett. 91, 263002 (2003).
131

132 REFERENCES
[135] S. M. Bellm, J. A. Davies, P. T. Whiteside, J. Guo, I. Powis, and K. L. Reid,An unusual π∗ shape resonance in the near-threshold photoionization of S1
para-difluorobenzene, J. Chem. Phys. 122, 224306 (2005).
[136] J. T. Meek, E. Sekreta, W. Wilson, K. S. Viswanathan, and J. P. Reilly, The laserphotoelectron spectrum of gas phase aniline, J. Chem. Phys. 82, 1741 (1985).
[137] X. Song, M. Yang, E. F. Davidson, and J. P. Reilly, Zero kinetic energy photo-electron spectra of jet-cooled aniline, J. Chem. Phys. 99, 3224 (1993).
[138] Exciton Laser dye catalog, http://www.exciton.com/ (2006).
[139] NIST Chemistry WebBook, http://webbook.nist.gov/chemistry/(2006).
[140] J. L. Lin, S. C. Yang, Y. C. Yu, and W. B. Tzeng, Mass analyzed thresholdionization of p-bromoaniline: heavy atom effects on electronic transition, ion-ization, and molecular vibration, Chem. Phys. Lett. 356, 267 (2002).
[141] P. B. Corkum, Plasma perspective on Strong Field Multiphoton Ionization,Phys. Rev. Lett. 71, 1994 (1993).
[142] D. N. Fittinghoff, P. R. Bolton, B. Chang, and K. C. Kulander, Observation ofNonsequential Double Ionization of Helium with Optical Tunneling, Phys. Rev.Lett. 69, 2642 (1992).
[143] G. L. Yudin and M. Y. Ivanov, Physics of correlated double ionization of atomsin intense laser fields: Quasistatic tunneling limit, Phys. Rev. A 63, 033404(2001).
[144] M. Lewenstein, P. Balcou, M. Y. Ivanov, A. L’Huillier, and P. B. Corkum, The-ory of high-harmonic generation by low-frequency laser fields, Phys. Rev. A49, 2117 (1994).
[145] P. Zeitoun, G. Faivre, S. Sebban, T. Mocek, A. Hallou, M. Fajardo, D. Aubert,P. Balcou, F. Burgy, D. Douillet, S. Kazamias, G. de Lachéze-Murel, T. Lefrou,S. le Pape, P. Mercére, H. Merdji, A. S. Morlens, J. P. Rousseau, andC. Valentin, A high-intensity highly coherent soft X-ray femtosecond laserseeded by a high harmonic beam, Nature 431, 426 (2004).
[146] M. Hentschel, R. Kienberger, C. Spielmann, G. A. Reider, N. Milosevic,T. Brabec, P. Corkum, U. Heinzmann, M. Drescher, and F. Krausz, Attosecondmetrology, Nature (London) 414, 509 (2001).
132

REFERENCES 133
[147] M. Drescher, M. Hentschel, R. Kienberger, M. Uiberacker, V. Yakovlev,A. Scrinzi, T. Westerwalbesloh, U. Kleineberg, U. Heinzmann, and F. Krausz,Time-resolved atomic inner-shell spectroscopy, Nature (London) 419, 803(2002).
[148] S. Baker, J. S. Robinson, C. A. Haworth, H. Teng, R. A. Smith, C. C. Chir-ila, M. Lein, J. W. G. Tisch, and J. P. Marangos, Probing Proton Dynamics inMolecules on an Attosecond Time Scale, Science 312, 424 (2006).
[149] L. V. Keldysh, Ionization in the field of a strong electromagnetic wave, Sov.Phys. JETP 20, 1307 (1965).
[150] H. R. Reiss, Effect of an intense electromagnetic field on a weakly bound system,Phys. Rev. A 22, 1786 (1980).
[151] V. P. Krainov, Ionization rates and energy and angular distributions at thebarrier-suppresion ionization of complex atoms and atomic ions, J. Opt. Soc.Am. B 14, 425 (1997).
[152] A. Becker and F. H. M. Faisal, Interplay of electron correlation and intense fielddynamics in the double ionization of helium, Phys. Rev. A 59, R1742 (1999).
[153] M. V. Ammosov, N. B. Delone, and V. P. Krainov, Tunnel ionization of complexatoms and of atomic ions in an alternating electromagnetic field, Sov. Phys.JETP 64, 1191 (1986).
[154] T. Brabec and F. Krauz, Intense few-cycle laser fields: Frontiers of nonlinearoptics, Rev. Mod. Phys. 72, 545 (2000).
[155] M. J. DeWitt, E. Wells, and R. R. Jones, Ratiometric Comparison of IntenseField Ionization of Atoms and Diatomic Molecules, Phys. Rev. Lett. 87, 153001(2001).
[156] C. Guo, M. Li, J. P. Nibarger, and G. N. Gibson, Single and double ionizationof diatomic molecules in strong laser fields, Phys. Rev. A 58, R4271 (1998).
[157] S. M. Hankin, D. M. Villeneuve, P. B. Corkum, and D. M. Rayner, Intense-fieldlaser ionization rates in atoms and molecules, Phys. Rev. A 64, 013405 (2001).
[158] S. M. Hankin, D. M. Villeneuve, P. B. Corkum, and D. M. Rayner, NonlinearIonization of Organic Molecules in High Intensity Laser Fields, Phys. Rev. Lett.84, 5082 (2000).
[159] A. Talebpour, S. Larochelle, and S. L. Chin, Multiphoton ionization of unsatu-rated hydrocarbons, J. Phys. B 31, 2769 (1998).
133

134 REFERENCES
[160] E. Wells, M. J. DeWitt, and R. R. Jones, Comparison of intense-field ionizationof diatomic molecules and rare-gas atoms, Phys. Rev. A 66, 013409 (2002).
[161] A. Talebpour, C.-Y. Chien, and S. L. Chin, The effect of dissociative recombi-nation in mulitiphoton ionization of O2, J. Phys. B 29, L677 (1996).
[162] J. Muth-Böhm, A. Becker, S. L. Chin, and F. H. M. Faisal, S-matrix theory ofionisation of polyatomic molecules in an intense laser pulse, Chem. Phys. Lett.337, 313 (2001).
[163] J. Muth-Böhm, A. Becker, and F. H. M. Faisal, Suppressed Molecular Ioniza-tion for a Class of Diatomcs in Intense Femtosecond Laser Fields, Phys. Rev.Lett. 85, 2280 (2000).
[164] X. M. Tong, Z. X. Zhao, and C. D. Lin, Theory of molecular tunneling ioniza-tion, Phys. Rev. A 66, 33402 (2002).
[165] T. K. Kjeldsen, C. Z. Bisgaard, L. B. Madsen, and H. Stapelfeldt, Role of sym-metry in strong-field ionization of molecules, Phys. Rev. A 68, 063407 (2003).
[166] A. Jaron-Becker, A. Becker, and F. H. M. Faisal, Dependence of strong-fieldphotoelectron angular distributions on molecular orientation, J. Phys. B 36,L375 (2003).
[167] Z. X. Zhao, X. M. Tong, and C. D. Lin, Alignment-dependent ionization prob-ability of molecules in a double-pulse laser field, Phys. Rev. A 67, 043404(2003).
[168] T. K. Kjeldsen and L. B. Madsen, Strong-field ionization of N2: length andvelocity gauge strong-field approximation and tunneling theory, J. Phys. B 37,2033 (2004).
[169] A. Jaron-Becker, A. Becker, and F. H. M. Faisal, Ionization of N2, O2, andlinear carbon clusters in a strong laser pulse, Phys. Rev. A 69, 023410 (2004).
[170] A. Jaron-Becker, A. Becker, and F. H. M. Faisal, Erratum: Ionization of N2,O2, and linear carbon clusters in a strong laser pulse [Phys. Rev. A 69, 023410(2004)], Phys. Rev. A 72, 069907 (2005).
[171] T. K. Kjeldsen, C. Z. Bisgaard, L. B. Madsen, and H. Stapelfeldt, Influence ofmolecular symmetry on strong-field ionization: Studies on ethylene, benzene,fluorobenzene, and chlorofluorobenzene, Phys. Rev. A 71, 013418 (2005).
[172] T. K. Kjeldsen and L. B. Madsen, Strong-field ionization of diatomic mole-cules and companion atoms: Strong-field approximation and tunneling theoryincluding nuclear motion, Phys. Rev. A 71, 023411 (2005).
134
REFERENCES 135
[173] I. V. Litvinyuk, K. F. Lee, P. W. Dooley, D. M. Rayner, D. M. Villeneuve,and P. B. Corkum, Alignment-Dependent Strong Field Ionization of Molecules,Phys. Rev. Lett. 90, 233003 (2003).
[174] D. Pinkham and R. R. Jones, Intense laser ionization of transiently aligned CO,Phys. Rev. A 72, 023418 (2005).
[175] G. F. Gribakin and M. Y. Kuchiev, Multiphoton detachment of electrons fromnegative ions, Phys. Rev. A 55, 3760 (1997).
[176] V. R. Bhardwaj, D. M. Rayner, D. M. Villeneuve, and P. B. Corkum, QuantumInterference in Double Ionization and Fragmentation of C6H6 in Intense LaserFields, Phys. Rev. Lett. 87, 253003 (2001).
[177] A. S. Alnaser, S. Voss, X.-M. Tong, C. M. Maharjan, P. Ranitovic, B. Ulrich,T. Osipov, B. Shan, Z. Chang, and C. L. Cocke, Effects of molecular structureon ion disintegration patterns in ionization of O2 and N2 by short laser pulses,Phys. Rev. Lett. 93, 113003 (2004).
[178] A. S. Alnaser, C. M. Maharjan, X. M. Tong, B. Ulrich, P. Ranitovic, B. Shan,Z. Chang, C. D. Lin, C. L. Cocke, and I. V. Litvinyuk, Effects of orbital sym-metries in dissociative ionization of molecules by few-cycle laser pulses, Phys.Rev. A 71, 031403(R) (2005).
[179] M. Lezius, V. Blanchet, D. M. Rayner, D. M. Villeneuve, A. Stolow, and M. Y.Ivanov, Nonadiabatic Multielectron Dynamics in Strong Field Molecular Ion-ization, Phys. Rev. Lett. 86, 51 (2001).
[180] M. Lezius, V. Blanchet, M. Y. Ivanov, and A. Stolow, Polyatomic molecules instrong laser fields: Nonadiabatic multielectron dynamics, J. Chem. Phys. 117,1575 (2002).
[181] A. N. Markevitch, S. M. Smith, D. A. Romanov, H. B. Schlegel, M. Y. Ivanov,and R. J. Levis, Nonadiabatic dynamics of polyatomic molecules and ions instrong laser fields, Phys. Rev. A 68, 011402(R) (2003).
[182] A. N. Markevitch, D. A. Romanov, S. M. Smith, and R. J. Levis, Coulomb Ex-plosion of Large Polyatomic Molecules Assisted by Nonadiabatic Charge Lo-calization, Phys. Rev. Lett. 92, 063001 (2004).
[183] N. Hay, R. Velotta, M. Lein, R. de Nalda, E. Heesel, M. Castillejo, and J. P.Marangos, High-order harmonic generation in laser-aligned molecules, Phys.Rev. A 65, 053805 (2002).
135

136 REFERENCES
[184] M. Lein, P. P. Corso, J. P. Marangos, and P. L. Knight, Orientation dependenceof high-order harmonic generation in molecules, Phys. Rev. A 67, 023819(2003).
[185] J. Itatani, J. Levesque, D. Zeidler, H. Niikura, H. Pépin, J. C. Kieffer, P. B.Corkum, and D. M. Villeneuve, Tomographic imaging of molecular orbitals,Nature 432, 867 (2004).
[186] K. Miyazaki, M. Kaku, G. Miyaji, A. Abdurrouf, and F. H. M. Faisal, Field-Free Alignment of Molecules Observed with High-Order Harmonic Generation,Phys. Rev. Lett. 95, 243903 (2005).
[187] M. Lein, N. Hay, R. Velotta, J. P. Marangos, and P. L. Knight, Interferenceeffects in high-order harmonic generation with molecules, Phys. Rev. A 66,023805 (2002).
[188] C. R. Gebhardt, T. P. Rakitzis, P. C. Samartzis, V. Ladopoulos, and T. N. Kit-sopoulos, Slice imaging: A new approach to ion imaging and velocity mapping,Rev. Sci. Instr. 72, 3848 (2001).
[189] D. Townsend, W. Li, S. K. Lee, R. L. Gross, and A. G. Suits, Universal andState-Resolved Imaging of Chemical Dynamics, J. Phys. Chem. A 109, 8661(2005).
[190] T. S. Zwier, Laser Probes of Conformational Isomerization in Flexible Mole-cules and Complexes, J. Phys. Chem. A 110, 4133 (2006).
[191] T. Kiljunen, B. Schmidt, and N. Schwentner, Intense-Field Alignment of Mole-cules Confined in Octahedral Fields, Phys. Rev. Lett. 94, 123003 (2005).
[192] M. Tsubouchi and T. Suzuki, Photoionization of homonuclear diatomic mole-cules aligned by an intense femtosecond laser pulse, Phys. Rev. A 72, 022512(2005).
136