lasata senior living campus
TRANSCRIPT

LASATA SENIOR LIVING CAMPUS

PLANNING STEPS
1. ASSESS: Current Financial Situation
- Financial Strength and Capabilities of your Community
- Current building stock assessment
2. ASSESS: Current Market Situation
- Market research
- Determine the primary market area (PMA)
- Determine the age and income qualified market
- Identify all competitors
- Calculate market share and market penetration
- Identify opportunities for growth, underserved components, concerns
- Use market research as a guide for planning

PLANNING STEPS
3. ACT: Conceptual Financial Plan
- Create a conceptual financial plan:
- Conceptual Building Space Allocation Program
- Conceptual Functional Program
- Conceptual Product/Services Mix
- Conceptual Master Plan
4. ACT: Financial + Architectural Plan
- Conceptual Building Space Allocation Program
- Conceptual Functional Program
- Conceptual Product/Services Mix
- Conceptual Master Plan
- Conceptual Financial Model with project costs
- Product/Services Mix revenues & expenses

OVERVIEW OF PLANNING PROCESS
Market Review
Current + Future Programming
Existing Facility Analysis
Current Financial Review
Financial Planning

LASATA SENIOR LIVING CAMPUSMARKET STUDY

MARKET STUDY PURPOSE
Conducted to provide supporting data
and documentation for the master
planning process and efforts for the
campus.
Evaluate the market need for an
assisted living facility in Cedarburg.
Evaluate the need for a small
Community Based Residential Facility
(CBRF) for frail elderly and elderly with
dementia, Alzheimer’s, and memory
loss on Lasata’s Campus.

MARKET STUDY METHODOLOGY
Evaluated secondary market data and information:Population and household income projections for the period 2012 to 2017
Competitive market data, including readily available information as well as
data collected via phone surveys
Market demand was assessed to determine:Market saturation currently
Market saturation, if a new CBRF were built
Total capacity the market can support, and
Ultimately, the size of the CBRF Ozaukee County could build, if any

MARKET AREA EVALUATED
Primary Market Area
Secondary Market Area
Secondary Market Area

COMPETITIVE ASSESSMENT
There were 345 total CBRF beds in the market area identified.
Facility Name Capacity LowRate HighRate
DateProbationary
Issued
TERMINALLY
ILL
PUBLIC
FUNDING
PHYSICALLY
DISABLED
IRREVERSIBLE
DEMENTIA/ALZHEIMER'S
ADVANCED
AGED
ANITAS GARDENS 19 SMA $ 3,600 $ 4,600 13-Mar-07 X X X X X
BELGIUM GARDENS 22 SMA $ 3,500 $ 5,000 1-Aug-08 X X X X X
CEDAR GARDENS 65 PMA $ 3,420 $ 4,170 1-Apr-06 X X X
CNC FAMILY LIVING LLC DBA DEKORA SPRINGS 7 SMA $ 3,450 $ 3,600 1-Jun-11 X X X X X
ELLENS HOME PORT WASHINGTON 44 SMA $ 4,000 $ 5,500 9-Sep-08 X X X
HARBOR CLUB (THE) 70 SMA $ 3,000 $ 4,500 1-Mar-95 X X X
HARRISON HOME 15 PMA $ 3,715 $ 5,700 1-Mar-95 X X X
HAMBRUG HOME 12 PMA $ 3,262 $ 5,040 1-Jul-88 X X X
LCS WESTMINSTER NEWCASTLE LLC 16 SMA $ 4,347 $ 5,347 1-Nov-12 X X
LUTHER MANOR AT RIVER OAKS 16 SMA $ 3,729 $ 5,400 11-Oct-00 X X X X
MILAN ESTATES 20 SMA $ 4,250 $ 5,000 10-Aug-10 X X X X
NEW PERSPECTIVE MEQUON LLC 16 SMA $ 3,870 $ 4,410 1-Jun-06 X X X
PORT HAVEN 6 SMA $ 3,460 $ 3,770 X X X X X
SARAH CHUDNOW CAMPUS 9 SMA $ 4,715 $ 4,885 X X X
SILVER SPRINGS 8 SMA $ 2,000 $ 6,955 4-Mar-08 X X
Source: DHS 2012 345 3,621$ 4,925$
For Lasata Care Center Market Study
Community Based Residential Facility Listing For The Market Area

Facility Name Street City Zip Class Capacity LowRate HighRate
FIVE STAR NORTHSHORE LLC D/B/A MEADOWMERE-NOR 10803 N PORT WASHINGTON RD MEQUON 53092 SMA CERTIFIED 60 $ 2,964 $ 3,900
HARBOR CLUB RCAC LLC 333 W WALTERS ST PORT WASHINGTON 53074 SMA REGISTERED 20 $ 717 $ 1,320
LASATA CROSSINGS ASSISTED LIVING W79N673 WAUWATOSA RD CEDARBURG 53012 PMA CERTIFIED 60 $ 1,100 $ 1,500
LCS WESTMINSTER NEWCASTLE LLC 12600 N PORT WASHINGTON RD MEQUON 53092 SMA REGISTERED 36 $ 4,337 $ 5,104
SARAH CHUDNOW CAMPUS 10995 N MARKET ST MEQUON 53092 SMA REGISTERED 45 $ 3,304 $ 4,354
WILLOWBROOK PLACE 205 GREEN BAY RD THIENSVILLE 53092 SMA CERTIFIED 65 $ 885 $ 2,560
Source: DHS 2012 286
Lasata Care Center Market Study
Residential Care Apartment Complex Listing For Market Area
COMPETITIVE ASSESSMENT
There were 286 total RCAC units in the market area identified.
3550 4650

COMPETITORS IN THE MARKET AREA
Red = RCACs Yellow = CBRFs

DEMOGRAPHIC PROJECTIONS
The senior populations are projected to grow significantly in Ozaukee County and the market area as defined. This suggests there will likely be an increasing need for more assisted living units for the next five years, and possibly longer.
Number % of Total Number % of Total Number % of Total
55 - 64 8,298 10.0% 12,284 13.9% 14,208 15.7% 32.4% 15.7%
65 - 74 5,700 6.8% 6,897 7.8% 8,722 9.6% 17.4% 26.5%
75 - 84 3,532 4.2% 4,443 5.0% 4,560 5.0% 20.5% 2.6%
85+ 1,181 1.4% 1,716 1.9% 2,108 2.3% 31.2% 22.8%
75+ 4,713 5.7% 6,159 7.0% 6,668 7.3% 23.5% 8.3%
65+ 10,413 12.5% 13,056 14.8% 15,390 17.0% 20.2% 17.9%
Total Population 83,269 100.0% 88,392 100.0% 90,773 100.0% 5.8% 2.7%
Source: Claritas 2012
For Lasata Senior Living Campus
2000-2012
% Change
2012-2017
% Change
Population Projections 2000 to 2017
Total Market Area
201720122000

MARKET STUDY CONCLUSIONS
The market demand model for the market area and Primary Market Area (PMA) suggested that there is a need for additional capacity.The market demand model for the PMA suggested that there is room in the PMA to
add up to 36-market rate CBRF beds.
Several of these beds would be filled by existing Lasata Senior Living Campus
residents.
Management should note, that if the project contracted with Family Care and
accepted residents on Medicaid waiver funding, the market demand model
suggested that there are not enough units in the PMA to meet the potential
demand, and the project could be larger than 36 units.

LASATA SENIOR LIVING CAMPUSCURRENT + FUTURE PROGRAMMING

Category of Space Area (SF) % of Total
Resident Spaces 38,845.12 29.11%
Social Spaces 21,594.29 16.18%
Support Spaces 40,874.48 30.63%
Circulation 32,127.60 24.08%
Totals 133,441.49 100.00%
Licensed Beds 175 (all SNF)
Area per resident 762.52
EXISTING BUILDING SPACE ALLOCATION

Category of Space Area (SF) % of Total
Resident Spaces 53,730 38.79%
Social Spaces 21,048 15.20%
Support Spaces 21,993 15.88%
Circulation 41,740 30.13%
Totals 138,511 100.00%
Licensed Beds 150 (120 SNF/30 ALF)
Area per resident 923.40
PROGRAM BUILDING SPACE ALLOCATION

Design Scenario Existing Remodeled
Area (SF)
New Construction
Area (SF)
Total Building
Area (SF)
Scenario A 133,441 0 133,441
Scenario B 111,642 72,614 184,256
Scenario C 43,881 94,630 138,511
Scenario D 0 138,511 138,511
PROGRAM BUILDING SPACE COMPARISON

LASATA SENIOR LIVING CAMPUSCURRENT FACIL ITY ANALYS IS

Building Exterior Systems
Roof - Existing roof coverings appear to be in average condition
Windows - recently replaced
Skin - work required on mortar and caulk joints
FACILITY ASSESSMENT

Interior Building Systems
Smoke/fire separations/shaft walls - are
assumed to not be up to current code
ACMs (Asbestos Containing Materials) -
Abatement required for all remodeling
components
Elevators - renovation required to comply
with current codes
FACILITY ASSESSMENT

MEP (Mechanical Electrical Plumbing) Systems
HVAC (Heating Ventilation Air Conditioning) – in
greatest need of repair/replacement
Centralize equipment to gain efficiencies for
maintenance and energy consumption
Update control system to digital controls to
increase occupant comfort and for efficient
control
FACILITY ASSESSMENT

MEP Systems
Plumbing – in greatest need of
repair/replacement
Re-pipe all mains and branches, new
valves, drains, traps, etc.
Fire Protection - in good condition and
complies with NFPA 13
FACILITY ASSESSMENT

MEP Systems
Electrical - distribution in good condition
Generator has additional load for
building expansion
Electrical service would need to be re-
evaluated for new HVAC equipment
FACILITY ASSESSMENT

LASATA SENIOR LIVING CAMPUSF INANCIAL + F INANCIAL PLANNING REV IEW

FINANCIAL MODELING ASSUMPTIONS
Phasing of project – SNF first, CBRF last
Financing – 3% interest, 20 year bond financing, 3 separate bond issues
Revenues – Based on current rates, Medicare and Medicaid inflated 1.5% annually, Private Pay inflated 3% annually
Revenues – Project does not qualify for state incentive program, cannot project budget neutrality to the state

Expenses – Non-salary expenses inflated 3% annually, salaries inflated 1.5% annually
Staffing – Based on current hours per patient day, adjusted for lower census. Efficiencies built into scenarios A and B to reflect the household model design
Census – Payor mix similar to current operations, other than Medicaid decrease in SNF which becomes the beginning census in the CBRF
Census – Upon completion of the project and fill up period, the campus will serve approximately the same number of residents as prior to the project
FINANCIAL MODELING ASSUMPTIONS
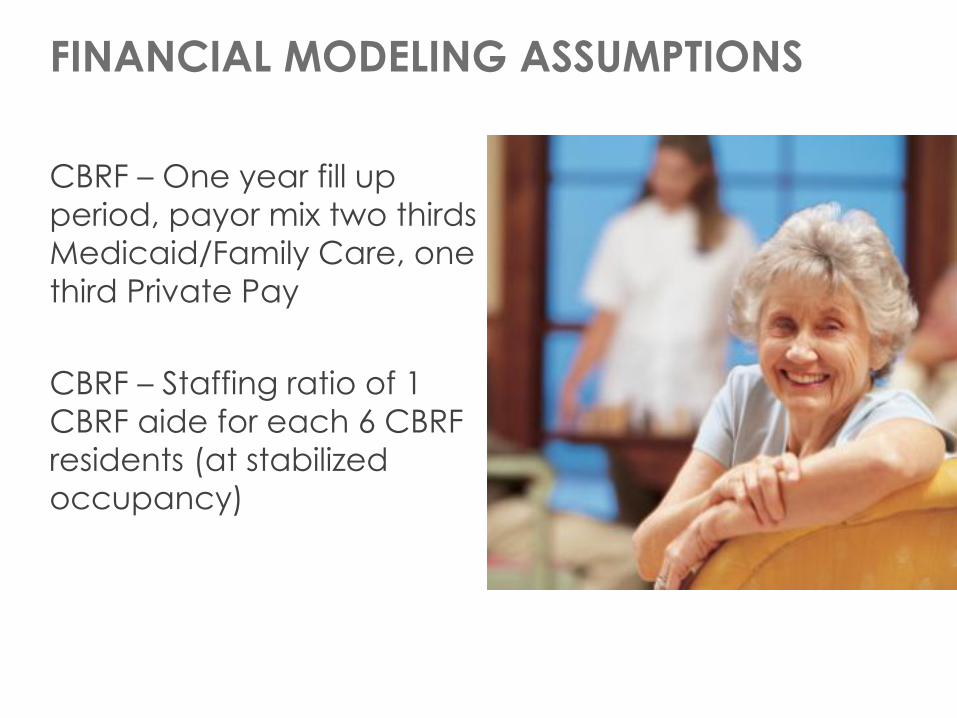
CBRF – One year fill up
period, payor mix two thirds
Medicaid/Family Care, one
third Private Pay
CBRF – Staffing ratio of 1
CBRF aide for each 6 CBRF
residents (at stabilized
occupancy)
FINANCIAL MODELING ASSUMPTIONS

LASATA SENIOR LIVING CAMPUSOPT ION A


SCENARIO A FINANCIAL RESULTS
No CBRF
No household design model staffing efficiencies
Significant losses during construction period due to the
need to reduce census, particularly Medicare, in order
to renovate each wing
Estimated Project Cost: $23,192,228
2015 2016 2017 2018 2019 2020 2021
Scenario A ($958,094) ($1,326,577) ($1,752433) ($1,454,980) $105,266 $21,312 $39,874

LASATA SENIOR LIVING CAMPUSOPT ION B


SCENARIO B FINANCIAL RESULTS
Includes a wing of CBRF
No household design model staffing efficiencies
Scenario loses money even after completion due to
increase staffing costs resulting from inefficient old
building design
Estimated Project Cost: $34,521,713
2015 2016 2017 2018 2019 2020 2021
Scenario B $202,367 ($291,306) ($561,062) ($750,337) ($831,891) ($685,830) ($629,883)

LASATA SENIOR LIVING CAMPUSOPT ION C


SCENARIO C FINANCIAL RESULTS
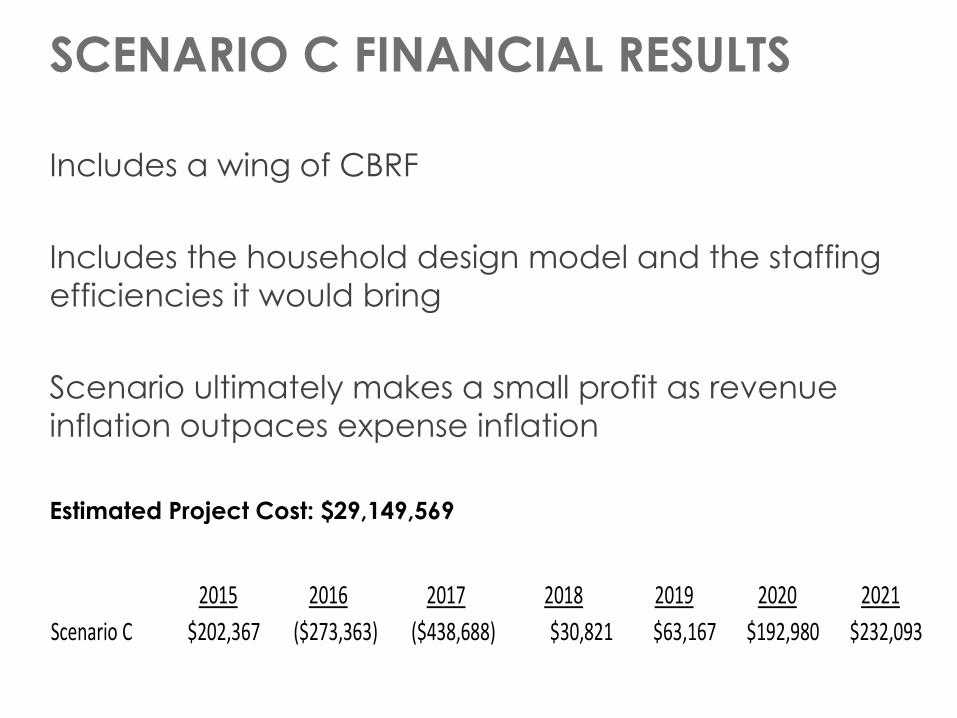
Includes a wing of CBRF
Includes the household design model and the staffing
efficiencies it would bring
Scenario ultimately makes a small profit as revenue
inflation outpaces expense inflation
Estimated Project Cost: $29,149,569
2015 2016 2017 2018 2019 2020 2021
Scenario C $202,367 ($273,363) ($438,688) $30,821 $63,167 $192,980 $232,093

LASATA SENIOR LIVING CAMPUSOPT ION D


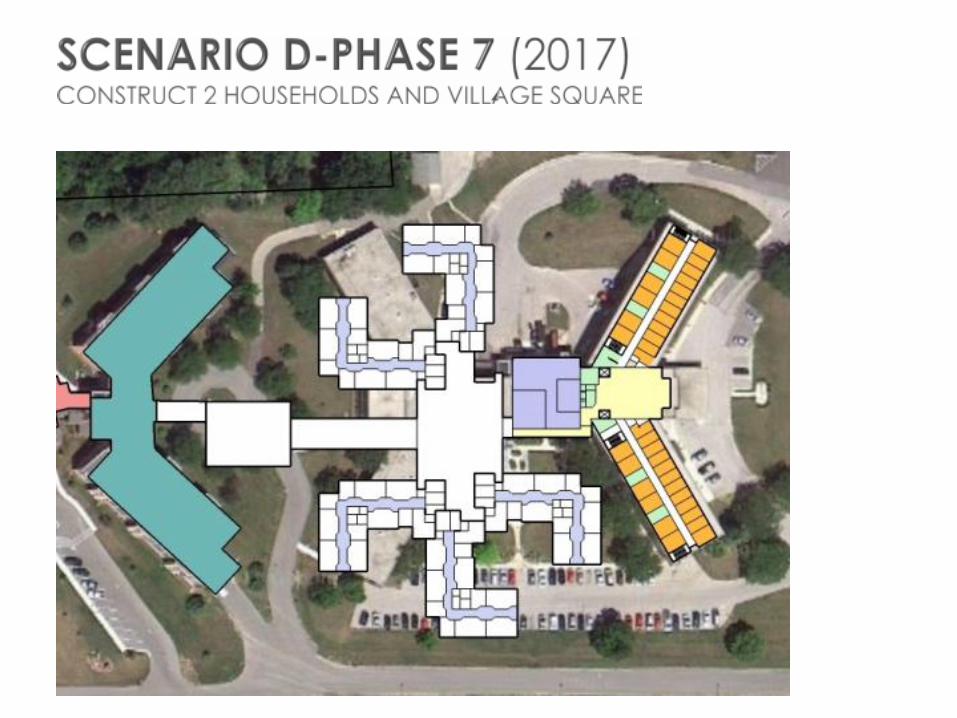


SCENARIO D FINANCIAL RESULTS
Includes a wing of CBRF
Includes the household design model and the staffing
efficiencies it would bring
Scenario slightly improves over scenario C due to lower
project costs
Estimated Project Cost: $29,260,778
2015 2016 2017 2018 2019 2020 2021
Scenario D $202,367 ($261,602) ($418,593) $35,248 $80,625 $224,547 $278,826

LASATA SENIOR LIVING CAMPUSS IDE -BY- S IDE COMPAR ISON

REVIEW OF OPTIONS
OPTION A:
Retain current SNF with no additions & reduced census
OPTION B:
Retain current SNF with CBRF addition
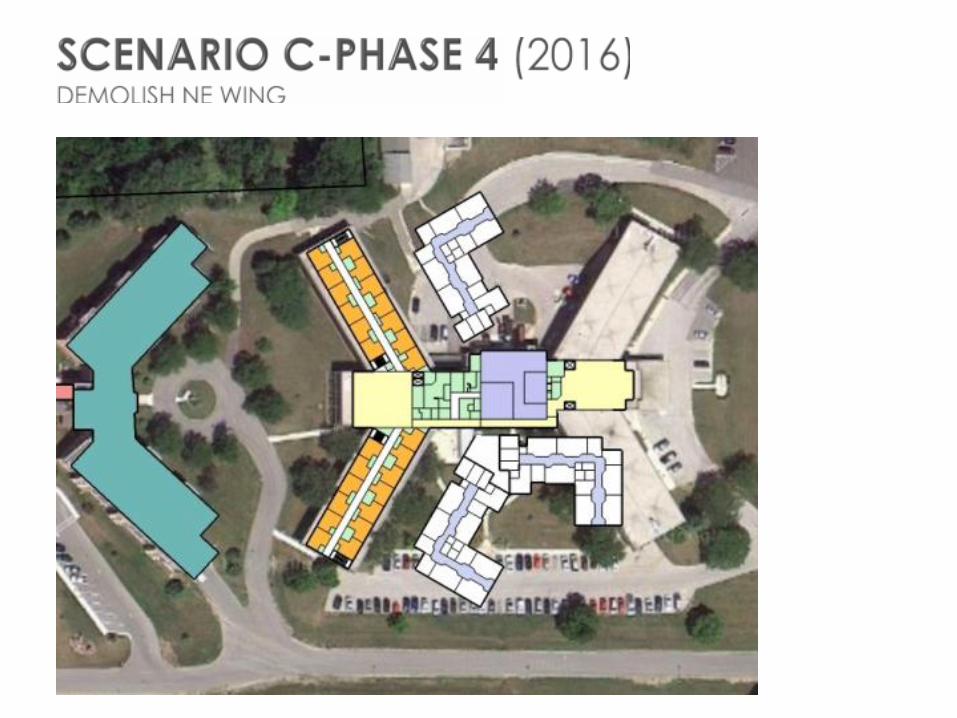
OPTION C:
Retain partial SNF with new village square and CBRF
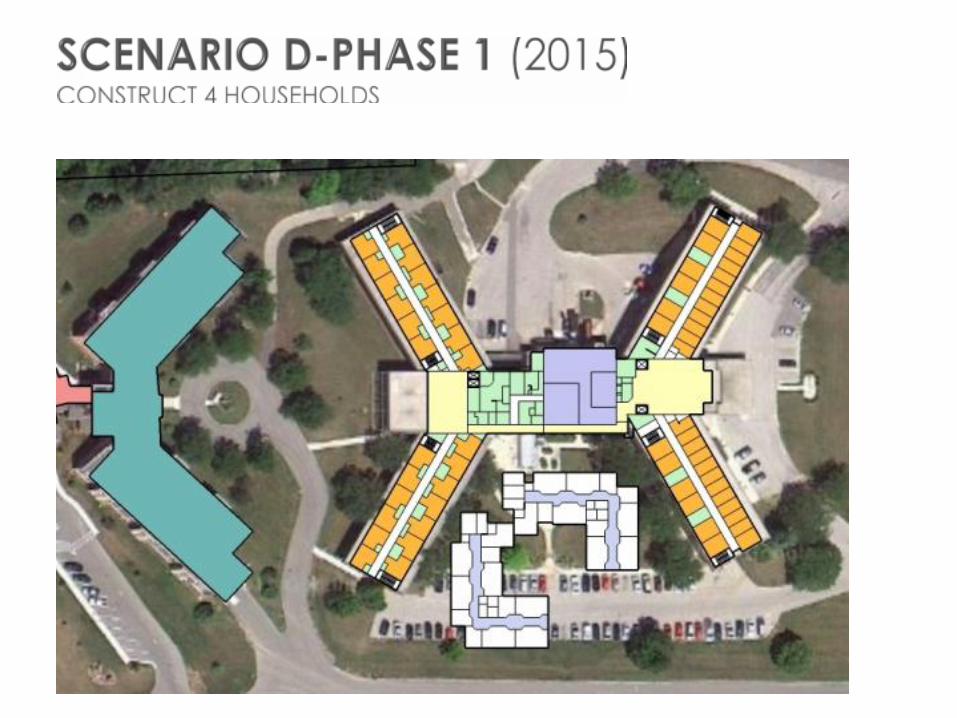
OPTION D:
Full replacement

FINANCIAL SUMMARY
Scenario A Project Cost: $23,192,228
2015 2016 2017 2018 2019 2020 2021
($958,094) ($1,326,577) ($1,752,433) ($1,454,980) $105,266 $21,312 $39,874
Scenario B Project Cost: $34,521,713
2015 2016 2017 2018 2019 2020 2021
$202,367 ($291,306) ($561,062) ($750,337) ($831,891) ($685,830) ($629,883)
Scenario C Project Cost: $29,149,570
2015 2016 2017 2018 2019 2020 2021
$202,367 ($273,363) ($438,688) $30,821 $63,167 $192,980 $232,093
Scenario D Project Cost: $29,260,778
2015 2016 2017 2018 2019 2020 2021
$202,367 ($261,602) ($418,593) $35,248 $80,625 $224,547 $278,826

FINANCIAL MODEL CONCLUSION
Scenario D appears to be the most feasible option:Allows Lasata to serve nearly the same number of people as they
are today
Having a new building ensures viability into the foreseeable future
Smaller nursing home and addition of the CBRF fits with trends in
the industry
Additional expected reimbursement and projected cost savings
due to design efficiencies help make the project feasible