las vegas stadium faa airport site problem study
TRANSCRIPT
8/17/2019 Las Vegas Stadium FAA Airport Site Problem Study
http://slidepdf.com/reader/full/las-vegas-stadium-faa-airport-site-problem-study 1/27
April 13, 2016
Capitol Airspace GroupCapitol Airspace Group
8/17/2019 Las Vegas Stadium FAA Airport Site Problem Study
http://slidepdf.com/reader/full/las-vegas-stadium-faa-airport-site-problem-study 2/27
Capitol Airspace Group Intent of Airspace Stu
Intent of an airspace study is to determine
development heights and components that arefeasible and do not significantly impact McCarran
Airport and airline operations.
Process includes working directly and collaboratively
with the FAA, McCarran Airport, Clark County, airlinesand others. UNLV and their team are having these
direct and collaborative discussions.
8/17/2019 Las Vegas Stadium FAA Airport Site Problem Study
http://slidepdf.com/reader/full/las-vegas-stadium-faa-airport-site-problem-study 3/27
Capitol Airspace Group About Capitol Airspace Gro
Providing analytical, strategic, and advocacy services
to airports, communities, and commercial
developers around the world.
• Supporting aviation industry for over 16 years
• Supporting Las Vegas building projects since early 2000s
• Mitigated over 750 projects
•
Handled over 10,000 FAA cases
Notable Projects Include:
• Resorts World, Las Vegas
• Mardis Gras Hotel and Casino
• Silverton Casino
8/17/2019 Las Vegas Stadium FAA Airport Site Problem Study
http://slidepdf.com/reader/full/las-vegas-stadium-faa-airport-site-problem-study 4/27
Capitol Airspace Group Obstruction Evaluation Proc
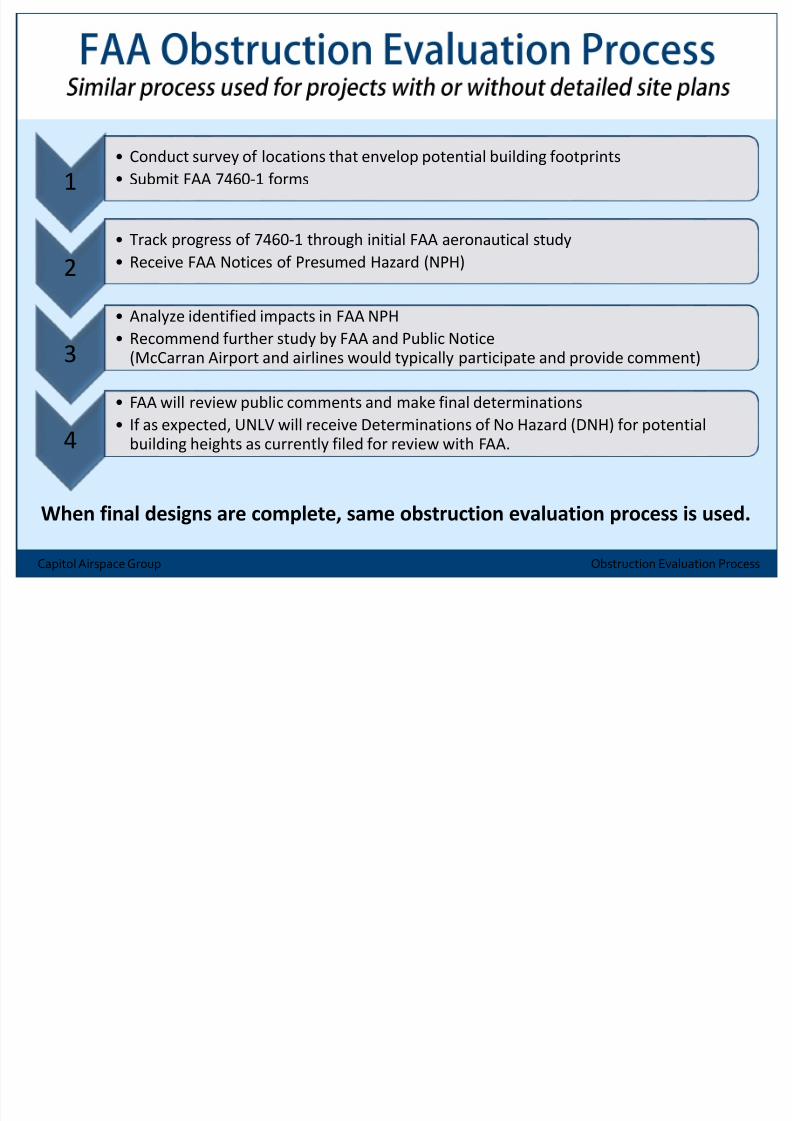
1• Conduct survey of locations that envelop potential building footprints
• Submit FAA 7460-1 forms
2
• Track progress of 7460-1 through initial FAA aeronautical study
• Receive FAA Notices of Presumed Hazard (NPH)
3
• Analyze identified impacts in FAA NPH
• Recommend further study by FAA and Public Notice(McCarran Airport and airlines would typically participate and provide comment)
4
• FAA will review public comments and make final determinations
• If as expected, UNLV will receive Determinations of No Hazard (DNH) for potentialbuilding heights as currently filed for review with FAA.
When final designs are complete, same obstruction evaluation process is used

8/17/2019 Las Vegas Stadium FAA Airport Site Problem Study
http://slidepdf.com/reader/full/las-vegas-stadium-faa-airport-site-problem-study 5/27
Capitol Airspace Group Obstruction Evaluation & Airspace Model
Predictive obstruction evaluation analysis includes all items
necessary to make informed decisions about potential airspace
impacts:
• 14 CFR Part 77 Obstacle Identification Surfaces
• Planned Airport Modifications
• Planned Instrument Procedures
• Visual Flight Rules (VFR) Traffic Pattern Airspace
• Instrument Departure and Approach Procedures• Low Altitude Enroute Airways
• Military Training Routes and Airspace
8/17/2019 Las Vegas Stadium FAA Airport Site Problem Study
http://slidepdf.com/reader/full/las-vegas-stadium-faa-airport-site-problem-study 6/27
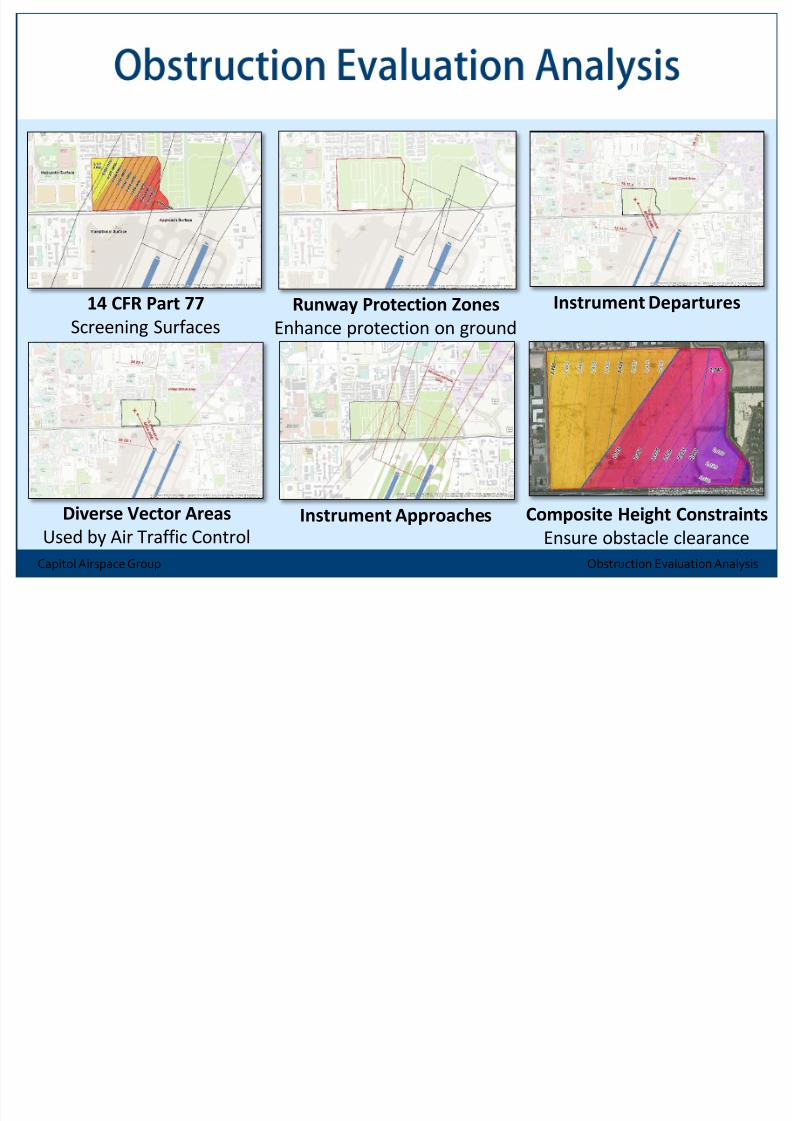
Capitol Airspace Group Obstruction Evaluation Analy
14 CFR Part 77
Screening Surfaces
Runway Protection Zones
Enhance protection on ground
Instrument Departures
Diverse Vector Areas
Used by Air Traffic ControlInstrument Approaches Composite Height Constrai
Ensure obstacle clearanc
8/17/2019 Las Vegas Stadium FAA Airport Site Problem Study
http://slidepdf.com/reader/full/las-vegas-stadium-faa-airport-site-problem-study 7/27
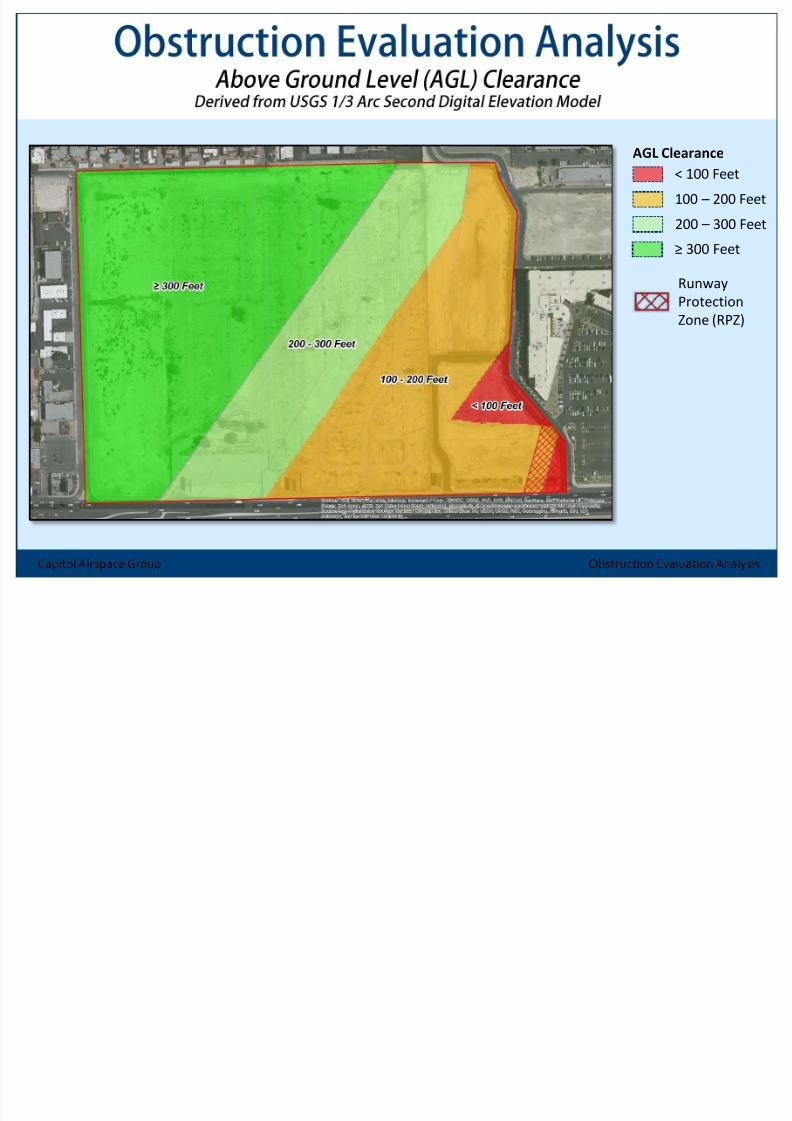
Capitol Airspace Group Obstruction Evaluation Analy
< 100 Feet
AGL Clearance
Runway
Protection
Zone (RPZ
100 – 200
200 – 300
≥ 300 Feet
8/17/2019 Las Vegas Stadium FAA Airport Site Problem Study
http://slidepdf.com/reader/full/las-vegas-stadium-faa-airport-site-problem-study 8/27
Capitol Airspace Group Clark Cou
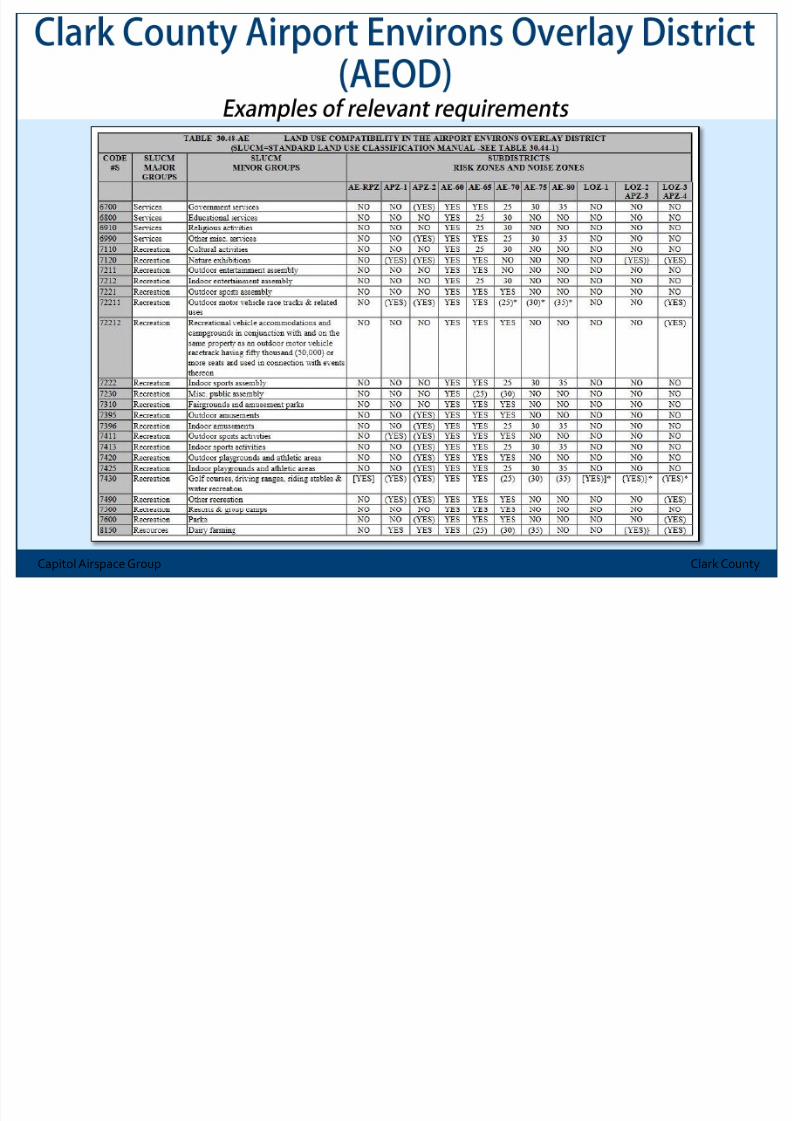
Clark County has development guidelines and requirements for site
mpacted by their Airport Environs Overlay District (AEOD)
In addition to the FAA Obstruction Evaluation process:Clark County Planning and McCarran Airport review development plans fo
projects in AEOD, for specific AEOD requirements and impacts.
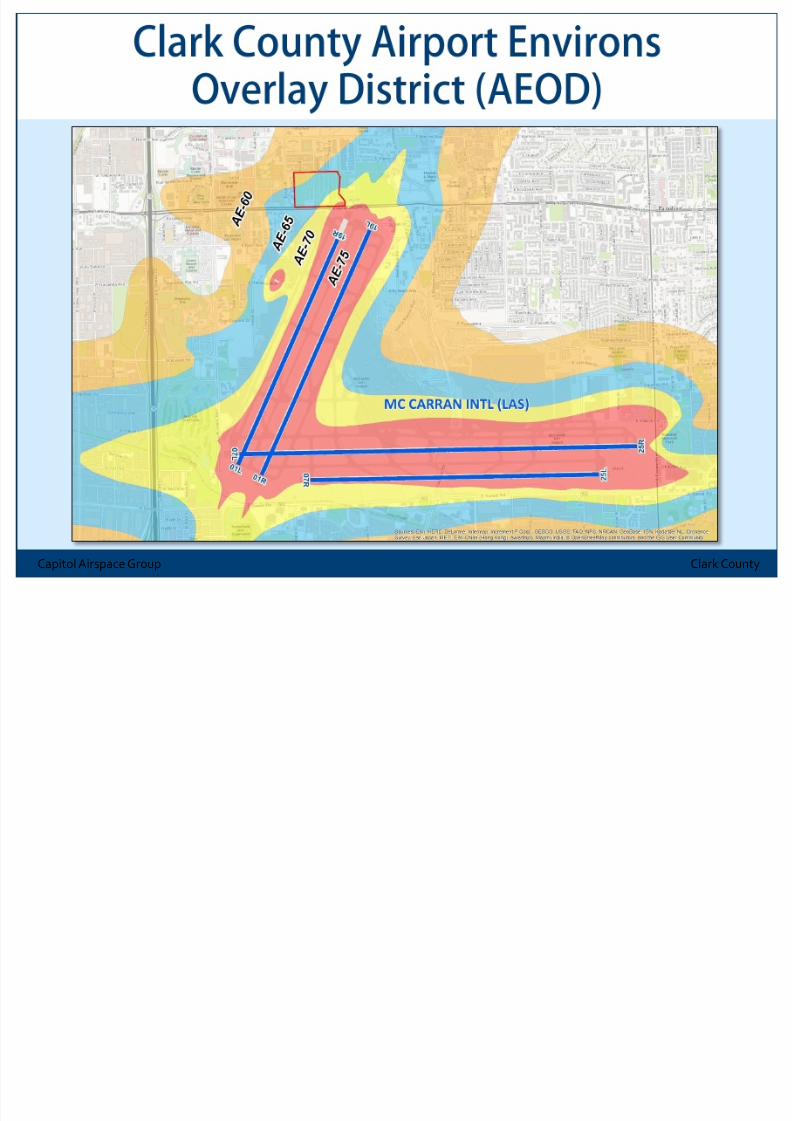
Majority of UNLV 42 acre site is located within AE-60 and AE-65 noise
subzones. Small southeastern section of the UNLV 42 acre site locatedwithin AE-70 and AE-75 noise subzones.
For context, Bluegreen Resorts site to the east largely resides in the AE-65
and AE-70 noise subzones.
8/17/2019 Las Vegas Stadium FAA Airport Site Problem Study
http://slidepdf.com/reader/full/las-vegas-stadium-faa-airport-site-problem-study 9/27
Capitol Airspace Group Clark Cou

8/17/2019 Las Vegas Stadium FAA Airport Site Problem Study
http://slidepdf.com/reader/full/las-vegas-stadium-faa-airport-site-problem-study 10/27
Capitol Airspace Group Clark Cou
UNLV is contemplating uses in master plan, including:
• Sports Assembly Facilities
• Education services
• Food/Retail
• Residential
These uses are generally permitted within the AE-60 and AE-65
subdistricts with instances of noise reduction requirements for
construction – most notably for residential uses. The portions withi
AE-70 and AE-75 subdistricts have similar permitted uses with some
additional noise reduction requirements for construction.
8/17/2019 Las Vegas Stadium FAA Airport Site Problem Study
http://slidepdf.com/reader/full/las-vegas-stadium-faa-airport-site-problem-study 11/27
Capitol Airspace Group Clark Cou
8/17/2019 Las Vegas Stadium FAA Airport Site Problem Study
http://slidepdf.com/reader/full/las-vegas-stadium-faa-airport-site-problem-study 12/27
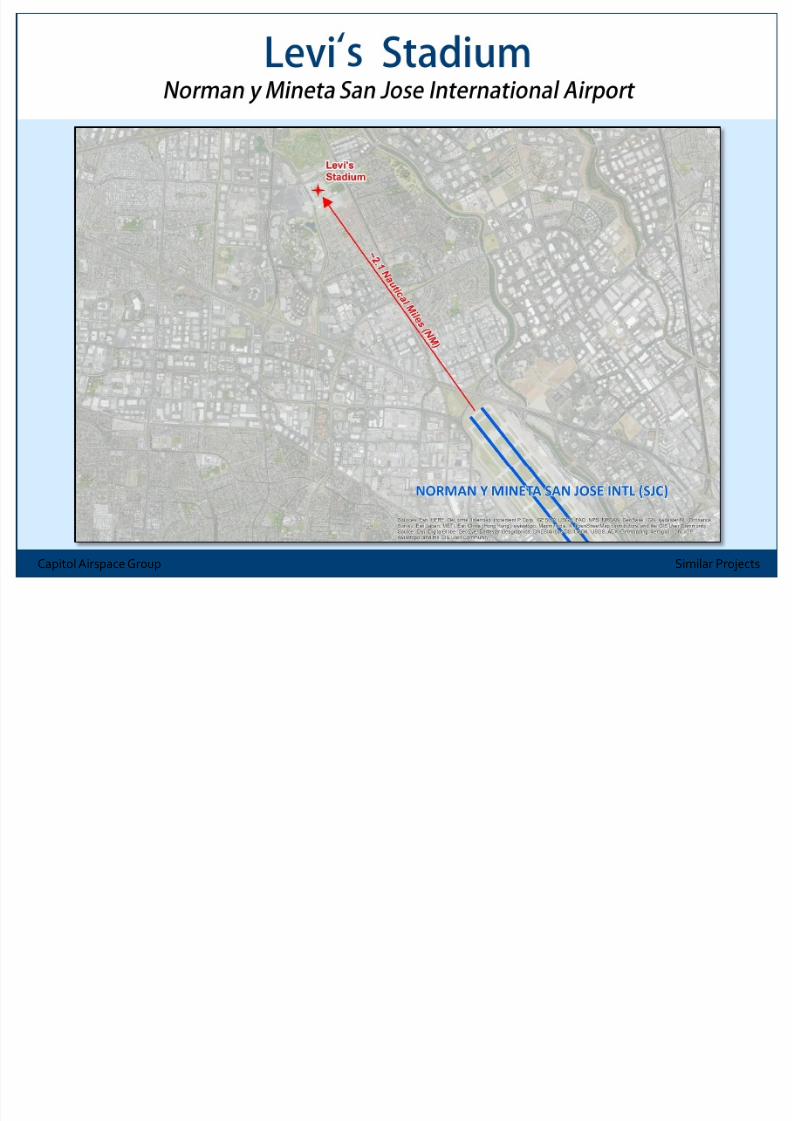
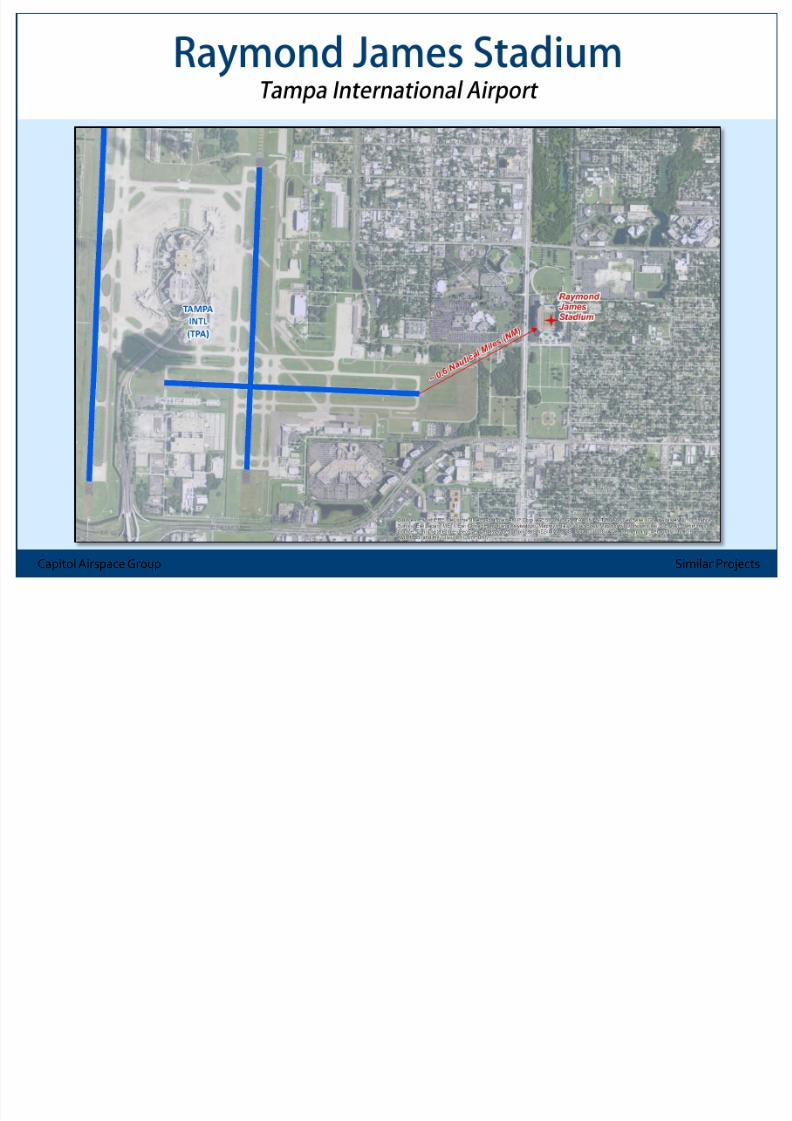
Capitol Airspace Group Similar Proje
8/17/2019 Las Vegas Stadium FAA Airport Site Problem Study
http://slidepdf.com/reader/full/las-vegas-stadium-faa-airport-site-problem-study 13/27
Capitol Airspace Group Similar Proje

8/17/2019 Las Vegas Stadium FAA Airport Site Problem Study
http://slidepdf.com/reader/full/las-vegas-stadium-faa-airport-site-problem-study 14/27
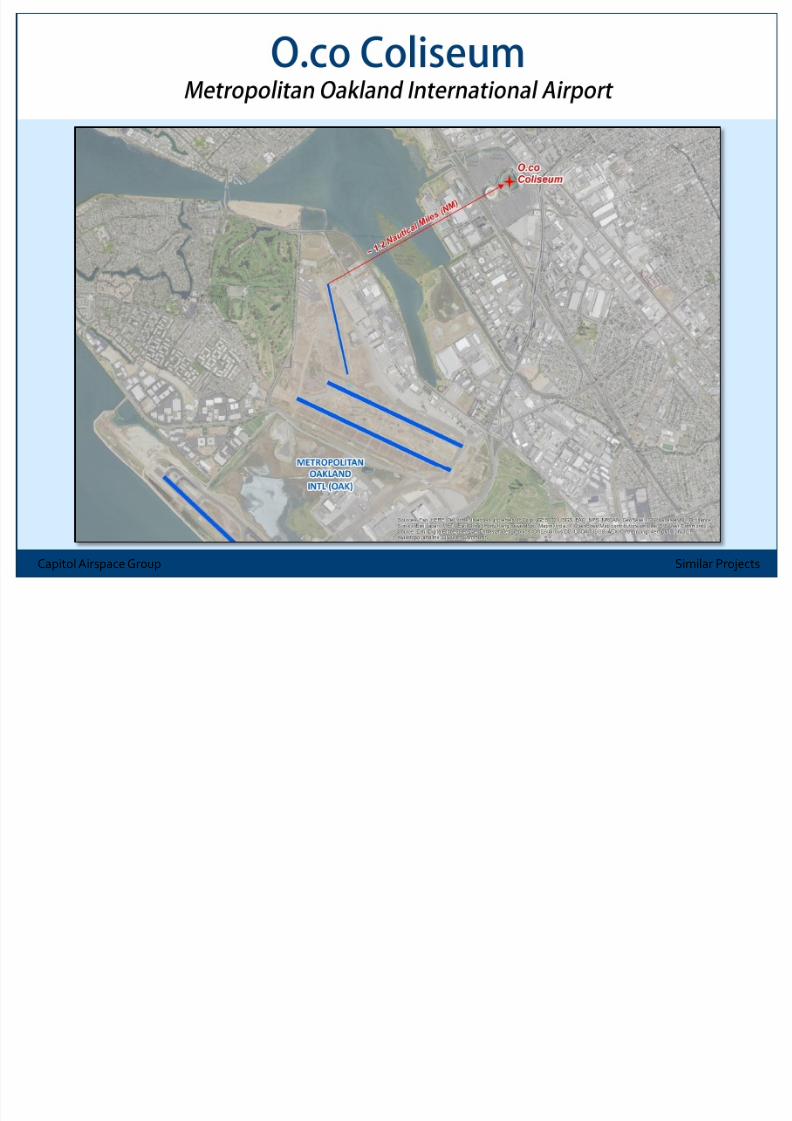
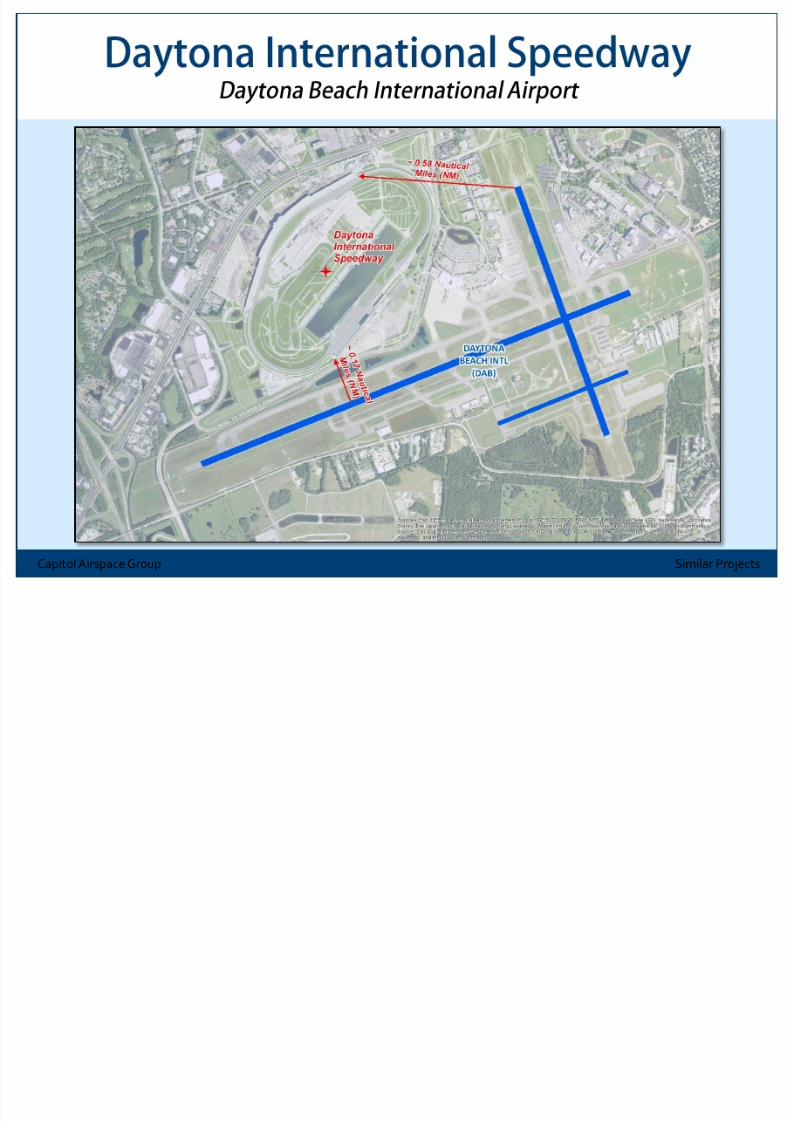
Capitol Airspace Group Similar Proje
8/17/2019 Las Vegas Stadium FAA Airport Site Problem Study
http://slidepdf.com/reader/full/las-vegas-stadium-faa-airport-site-problem-study 15/27
Capitol Airspace Group Similar Proje
8/17/2019 Las Vegas Stadium FAA Airport Site Problem Study
http://slidepdf.com/reader/full/las-vegas-stadium-faa-airport-site-problem-study 16/27
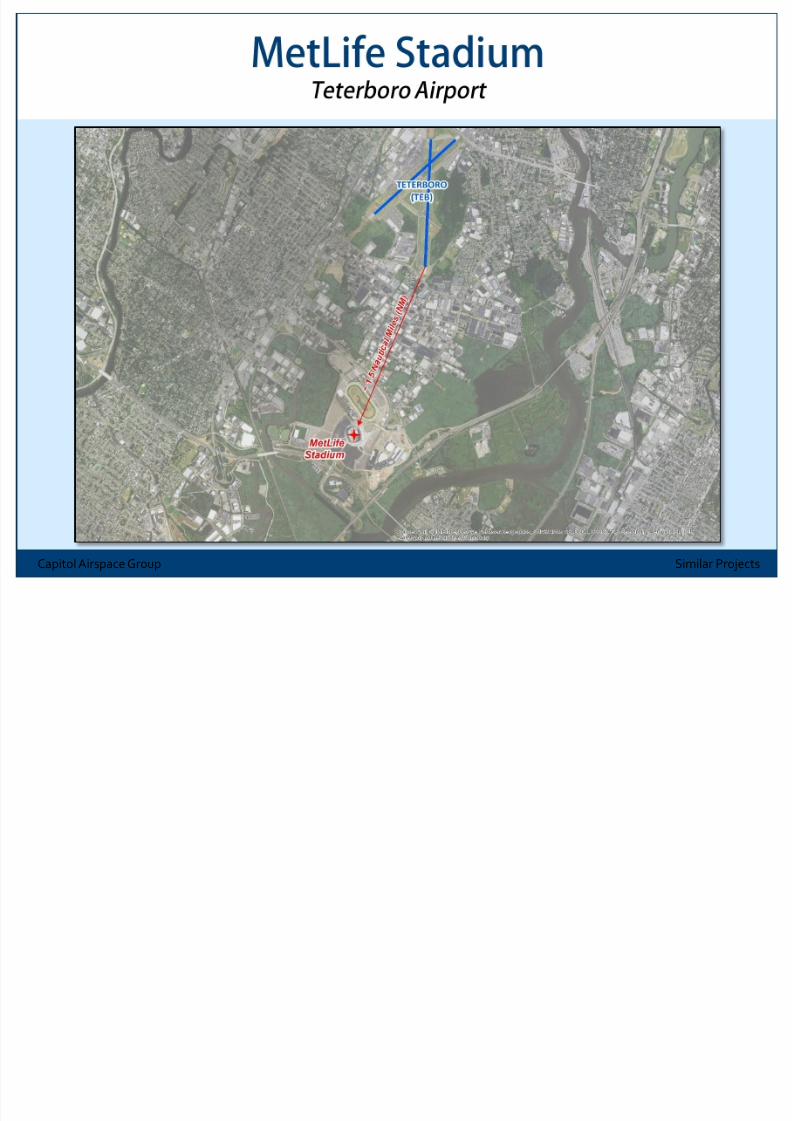
Capitol Airspace Group Similar Proje
8/17/2019 Las Vegas Stadium FAA Airport Site Problem Study
http://slidepdf.com/reader/full/las-vegas-stadium-faa-airport-site-problem-study 17/27
Capitol Airspace Group Similar Proje
8/17/2019 Las Vegas Stadium FAA Airport Site Problem Study
http://slidepdf.com/reader/full/las-vegas-stadium-faa-airport-site-problem-study 18/27
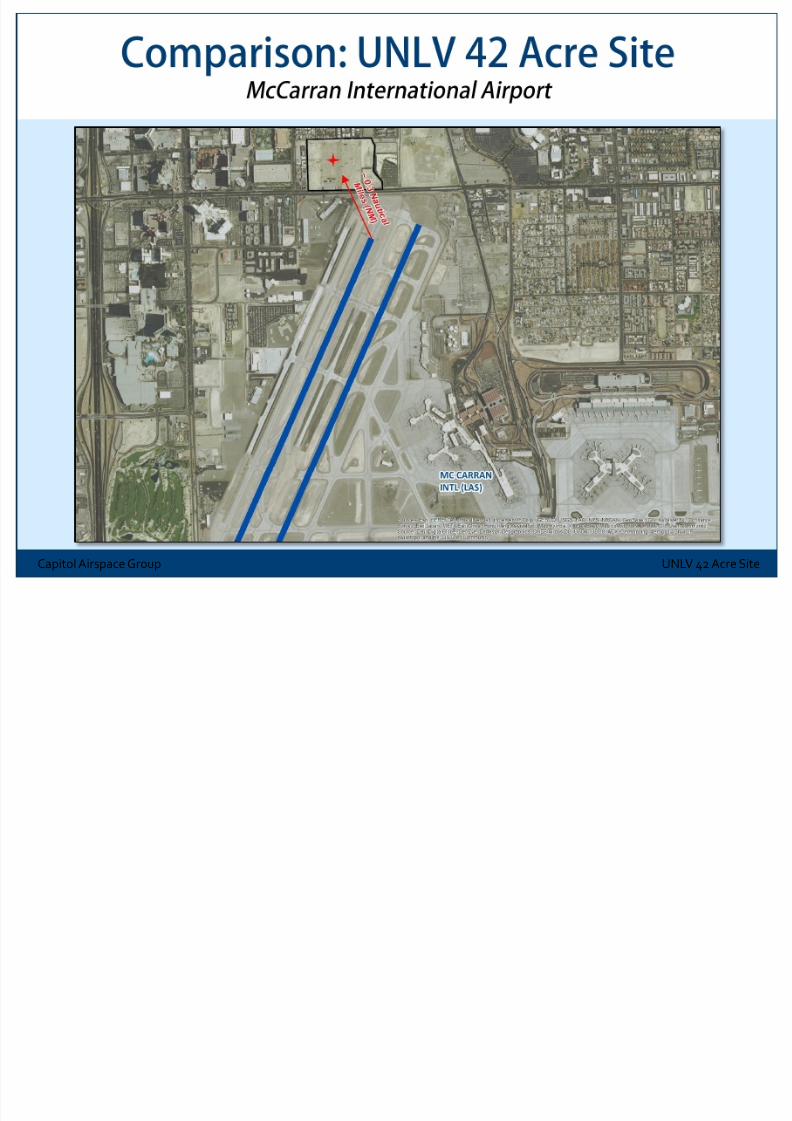
Capitol Airspace Group UNLV 42 Acre S
8/17/2019 Las Vegas Stadium FAA Airport Site Problem Study
http://slidepdf.com/reader/full/las-vegas-stadium-faa-airport-site-problem-study 19/27
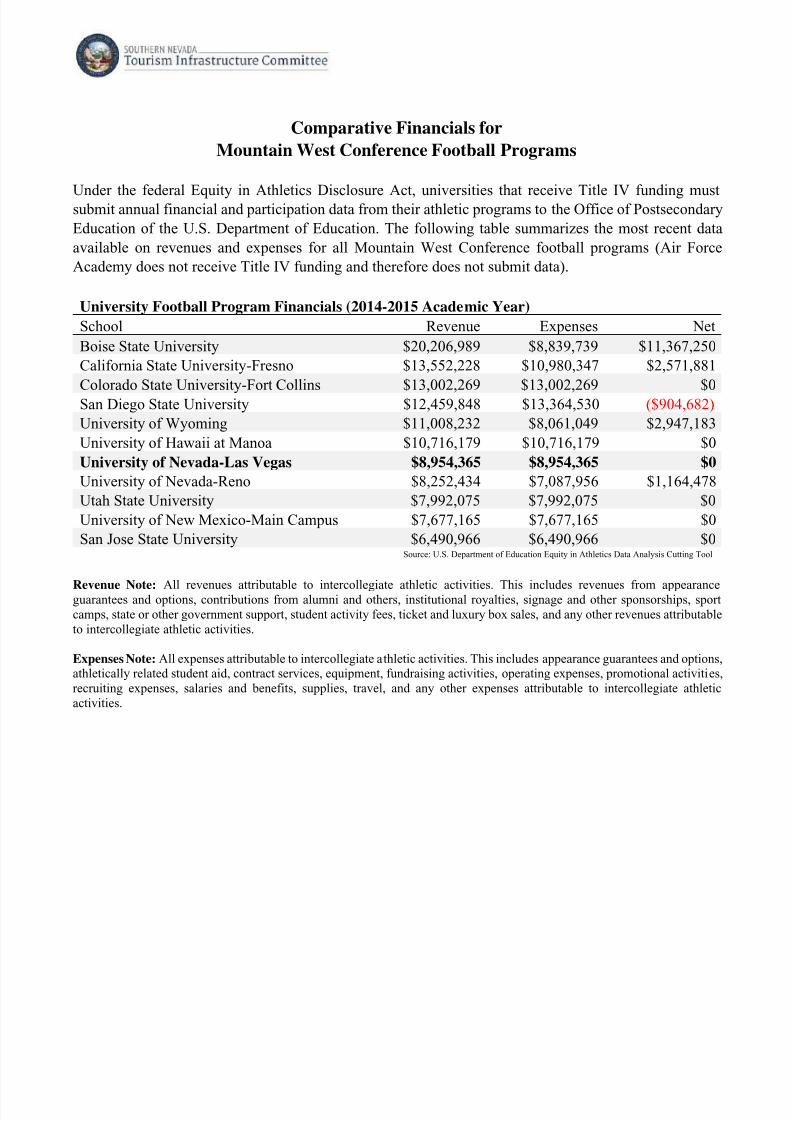
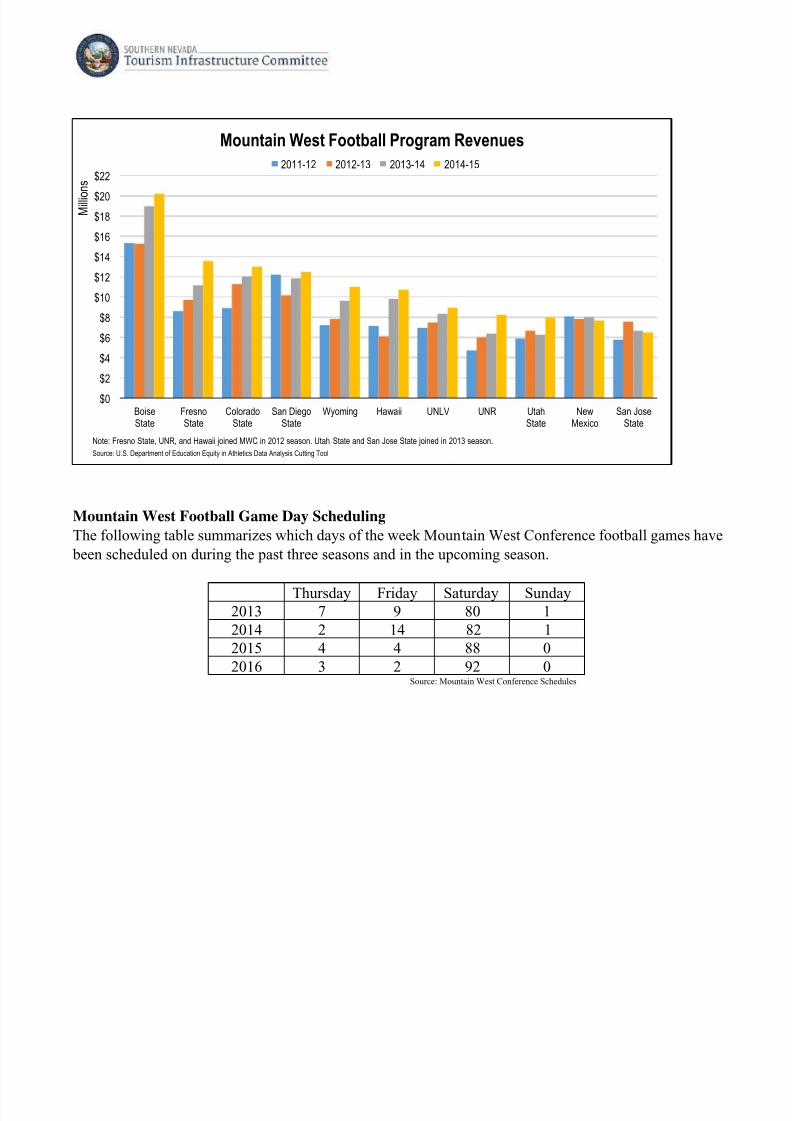
Comparative Financials for
Mountain West Conference Football Programs
Under the federal Equity in Athletics Disclosure Act, universities that receive Title IV funding mustsubmit annual financial and participation data from their athletic programs to the Office of Postsecondary
Education of the U.S. Department of Education. The following table summarizes the most recent data
available on revenues and expenses for all Mountain West Conference football programs (Air Force
Academy does not receive Title IV funding and therefore does not submit data).
University Football Program Financials (2014-2015 Academic Year)
School Revenue Expenses Net
Boise State University $20,206,989 $8,839,739 $11,367,250
California State University-Fresno $13,552,228 $10,980,347 $2,571,881
Colorado State University-Fort Collins $13,002,269 $13,002,269 $0San Diego State University $12,459,848 $13,364,530 ($904,682)
University of Wyoming $11,008,232 $8,061,049 $2,947,183
University of Hawaii at Manoa $10,716,179 $10,716,179 $0
University of Nevada-Las Vegas $8,954,365 $8,954,365 $0
University of Nevada-Reno $8,252,434 $7,087,956 $1,164,478
Utah State University $7,992,075 $7,992,075 $0
University of New Mexico-Main Campus $7,677,165 $7,677,165 $0
San Jose State University $6,490,966 $6,490,966 $0Source: U.S. Department of Education Equity in Athletics Data Analysis Cutting Tool
Revenue Note: All revenues attributable to intercollegiate athletic activities. This includes revenues from appearanceguarantees and options, contributions from alumni and others, institutional royalties, signage and other sponsorships, sportcamps, state or other government support, student activity fees, ticket and luxury box sales, and any other revenues attributableto intercollegiate athletic activities.
Expenses Note: All expenses attributable to intercollegiate athletic activities. This includes appearance guarantees and options,athletically related student aid, contract services, equipment, fundraising activities, operating expenses, promotional activities,recruiting expenses, salaries and benefits, supplies, travel, and any other expenses attributable to intercollegiate athleticactivities.
8/17/2019 Las Vegas Stadium FAA Airport Site Problem Study
http://slidepdf.com/reader/full/las-vegas-stadium-faa-airport-site-problem-study 20/27
Mountain West Football Game Day Scheduling
The following table summarizes which days of the week Mountain West Conference football games have
been scheduled on during the past three seasons and in the upcoming season.
Thursday Friday Saturday Sunday2013 7 9 80 1
2014 2 14 82 1
2015 4 4 88 0
2016 3 2 92 0Source: Mountain West Conference Schedules
$0
$2
$4
$6
$8
$10
$12
$14
$16
$18
$20
$22
BoiseState
FresnoState
ColoradoState
San DiegoState
Wyoming Hawaii UNLV UNR UtahState
NewMexico
San JoseState
M i l l i o
n s
Mountain West Football Program Revenues
2011-12 2012-13 2013-14 2014-15
Note: Fresno State, UNR, and Hawaii joined MWC in 2012 season. Utah State and San Jose State joined in 2013 season.
Source: U.S. Department of Education Equity in Athletics Data Analysis Cutting Tool
8/17/2019 Las Vegas Stadium FAA Airport Site Problem Study
http://slidepdf.com/reader/full/las-vegas-stadium-faa-airport-site-problem-study 21/27
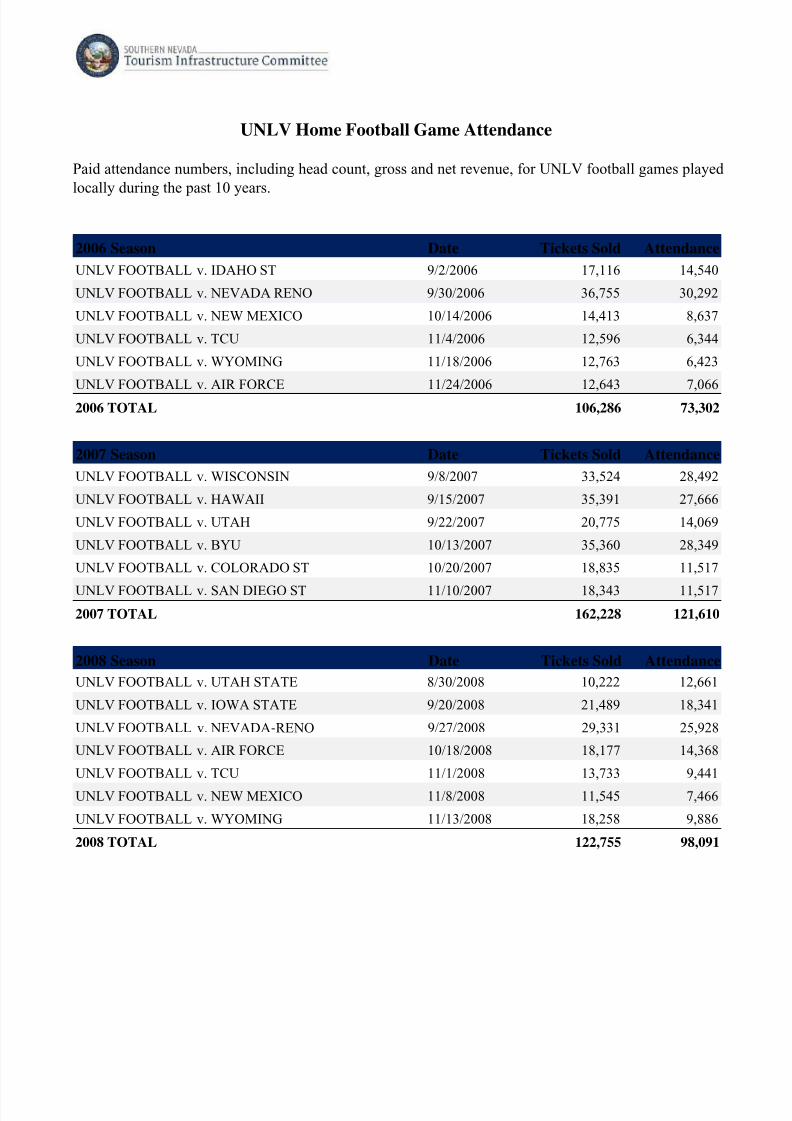
UNLV Home Football Game Attendance
Paid attendance numbers, including head count, gross and net revenue, for UNLV football games played
locally during the past 10 years.
2006 Season Date Tickets Sold Attendance
UNLV FOOTBALL v. IDAHO ST 9/2/2006 17,116 14,540
UNLV FOOTBALL v. NEVADA RENO 9/30/2006 36,755 30,292
UNLV FOOTBALL v. NEW MEXICO 10/14/2006 14,413 8,637
UNLV FOOTBALL v. TCU 11/4/2006 12,596 6,344
UNLV FOOTBALL v. WYOMING 11/18/2006 12,763 6,423
UNLV FOOTBALL v. AIR FORCE 11/24/2006 12,643 7,066
2006 TOTAL 106,286 73,302
2007 Season Date Tickets Sold Attendance
UNLV FOOTBALL v. WISCONSIN 9/8/2007 33,524 28,492
UNLV FOOTBALL v. HAWAII 9/15/2007 35,391 27,666
UNLV FOOTBALL v. UTAH 9/22/2007 20,775 14,069
UNLV FOOTBALL v. BYU 10/13/2007 35,360 28,349
UNLV FOOTBALL v. COLORADO ST 10/20/2007 18,835 11,517
UNLV FOOTBALL v. SAN DIEGO ST 11/10/2007 18,343 11,517
2007 TOTAL 162,228 121,610
2008 Season Date Tickets Sold Attendance
UNLV FOOTBALL v. UTAH STATE 8/30/2008 10,222 12,661
UNLV FOOTBALL v. IOWA STATE 9/20/2008 21,489 18,341
UNLV FOOTBALL v. NEVADA‐RENO 9/27/2008 29,331 25,928
UNLV FOOTBALL v. AIR FORCE 10/18/2008 18,177 14,368
UNLV FOOTBALL v. TCU 11/1/2008 13,733 9,441
UNLV FOOTBALL v. NEW MEXICO 11/8/2008 11,545 7,466
UNLV FOOTBALL v. WYOMING 11/13/2008 18,258 9,886
2008 TOTAL 122,755 98,091
8/17/2019 Las Vegas Stadium FAA Airport Site Problem Study
http://slidepdf.com/reader/full/las-vegas-stadium-faa-airport-site-problem-study 22/27
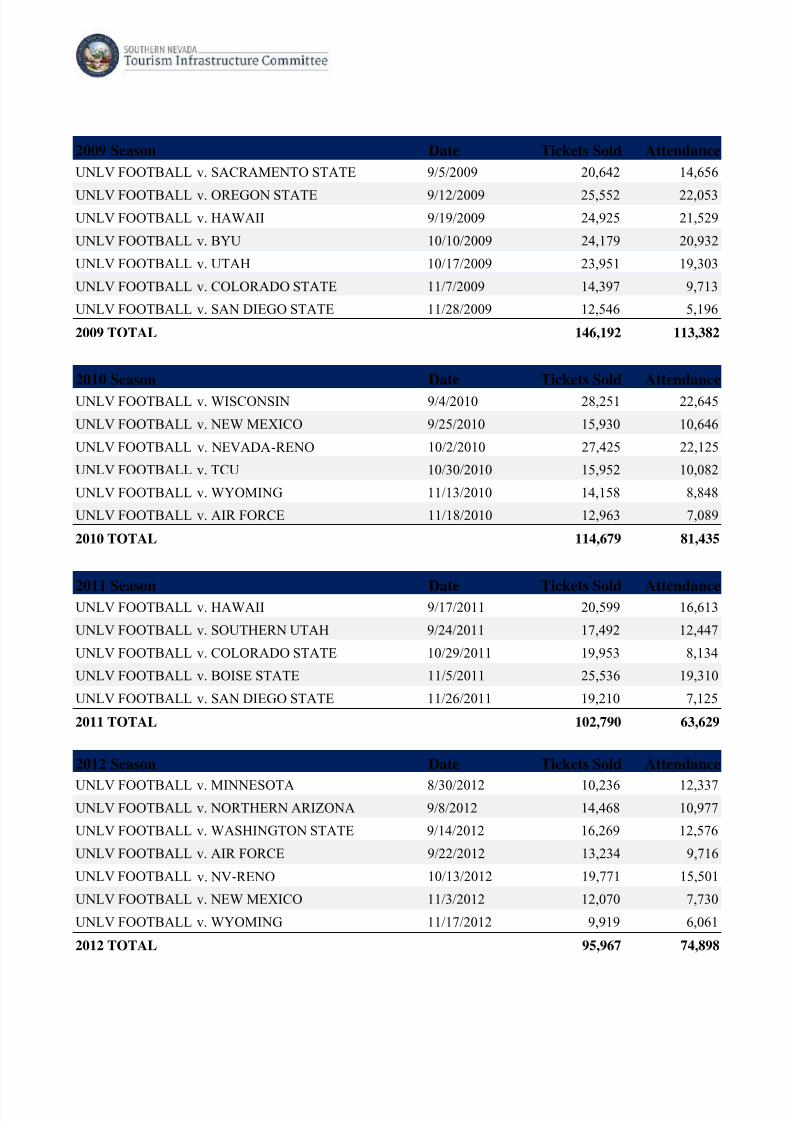
2009 Season Date Tickets Sold Attendance
UNLV FOOTBALL v. SACRAMENTO STATE 9/5/2009 20,642 14,656
UNLV FOOTBALL v. OREGON STATE 9/12/2009 25,552 22,053UNLV FOOTBALL v. HAWAII 9/19/2009 24,925 21,529
UNLV FOOTBALL v. BYU 10/10/2009 24,179 20,932
UNLV FOOTBALL v. UTAH 10/17/2009 23,951 19,303
UNLV FOOTBALL v. COLORADO STATE 11/7/2009 14,397 9,713
UNLV FOOTBALL v. SAN DIEGO STATE 11/28/2009 12,546 5,196
2009 TOTAL 146,192 113,382
2010 Season Date Tickets Sold Attendance
UNLV FOOTBALL v. WISCONSIN 9/4/2010 28,251 22,645
UNLV FOOTBALL v. NEW MEXICO 9/25/2010 15,930 10,646
UNLV FOOTBALL v. NEVADA‐RENO 10/2/2010 27,425 22,125
UNLV FOOTBALL v. TCU 10/30/2010 15,952 10,082
UNLV FOOTBALL v. WYOMING 11/13/2010 14,158 8,848
UNLV FOOTBALL v. AIR FORCE 11/18/2010 12,963 7,089
2010 TOTAL 114,679 81,435
2011 Season Date Tickets Sold AttendanceUNLV FOOTBALL v. HAWAII 9/17/2011 20,599 16,613
UNLV FOOTBALL v. SOUTHERN UTAH 9/24/2011 17,492 12,447
UNLV FOOTBALL v. COLORADO STATE 10/29/2011 19,953 8,134
UNLV FOOTBALL v. BOISE STATE 11/5/2011 25,536 19,310
UNLV FOOTBALL v. SAN DIEGO STATE 11/26/2011 19,210 7,125
2011 TOTAL 102,790 63,629
2012 Season Date Tickets Sold Attendance
UNLV FOOTBALL v. MINNESOTA 8/30/2012 10,236 12,337
UNLV FOOTBALL v. NORTHERN ARIZONA 9/8/2012 14,468 10,977
UNLV FOOTBALL v. WASHINGTON STATE 9/14/2012 16,269 12,576
UNLV FOOTBALL v. AIR FORCE 9/22/2012 13,234 9,716
UNLV FOOTBALL v. NV‐RENO 10/13/2012 19,771 15,501
UNLV FOOTBALL v. NEW MEXICO 11/3/2012 12,070 7,730
UNLV FOOTBALL v. WYOMING 11/17/2012 9,919 6,061
2012 TOTAL 95,967 74,898

8/17/2019 Las Vegas Stadium FAA Airport Site Problem Study
http://slidepdf.com/reader/full/las-vegas-stadium-faa-airport-site-problem-study 23/27
2013 Season Date Tickets Sold Attendance
UNLV FOOTBALL v. ARIZONA 9/7/2013 26,737 17,940
UNLV FOOTBALL v. CENTRAL MICHIGAN 9/14/2013 10,866 6,617
UNLV FOOTBALL v. WESTERN ILLINOIS 9/21/2013 12,262 7,624
UNLV FOOTBALL v. HAWAII 10/12/2013 21,866 16,225
UNLV FOOTBALL v. SAN JOSE ST 11/2/2013 15,038 10,417
UNLV FOOTBALL v. UTAH ST 11/9/2013 14,250 9,465
UNLV FOOTBALL v. SAN DIEGO ST 11/30/2013 15,122 10,725
2013 TOTAL 116,141 79,013
2014 Season Date Tickets Sold Attendance
UNLV FOOTBALL v. Northern Colorado 9/6/2014 15,943 11,639
UNLV FOOTBALL v. Northern Illinois 9/13/2014 13,407 9,075
UNLV FOOTBALL v. Fresno State 10/10/2014 14,449 9,786
UNLV FOOTBALL v. New Mexico 11/1/2014 12,451 7,566
UNLV FOOTBALL v. Air Force 11/8/2014 12,156 7,523
UNLV FOOTBALL v. Nevada‐Reno 11/29/2014 19,679 14,750
2014 TOTAL 88,085 60,339
2015 Season Date Tickets Sold Attendance
UNLV FOOTBALL v. UCLA 9/12/2015 31,191 26,305UNLV FOOTBALL v. Idaho State 9/26/2015 15,852 10,899
UNLV FOOTBALL v. San Jose St 10/10/2015 18,294 13,366
UNLV FOOTBALL v. Boise St 10/31/2015 13,425 9,352
UNLV FOOTBALL v. Hawaii 11/7/2015 19,113 13,090
UNLV FOOTBALL v. San Diego St 11/21/2015 13,895 8,962
2015 TOTAL 111,770 81,974
8/17/2019 Las Vegas Stadium FAA Airport Site Problem Study
http://slidepdf.com/reader/full/las-vegas-stadium-faa-airport-site-problem-study 24/27
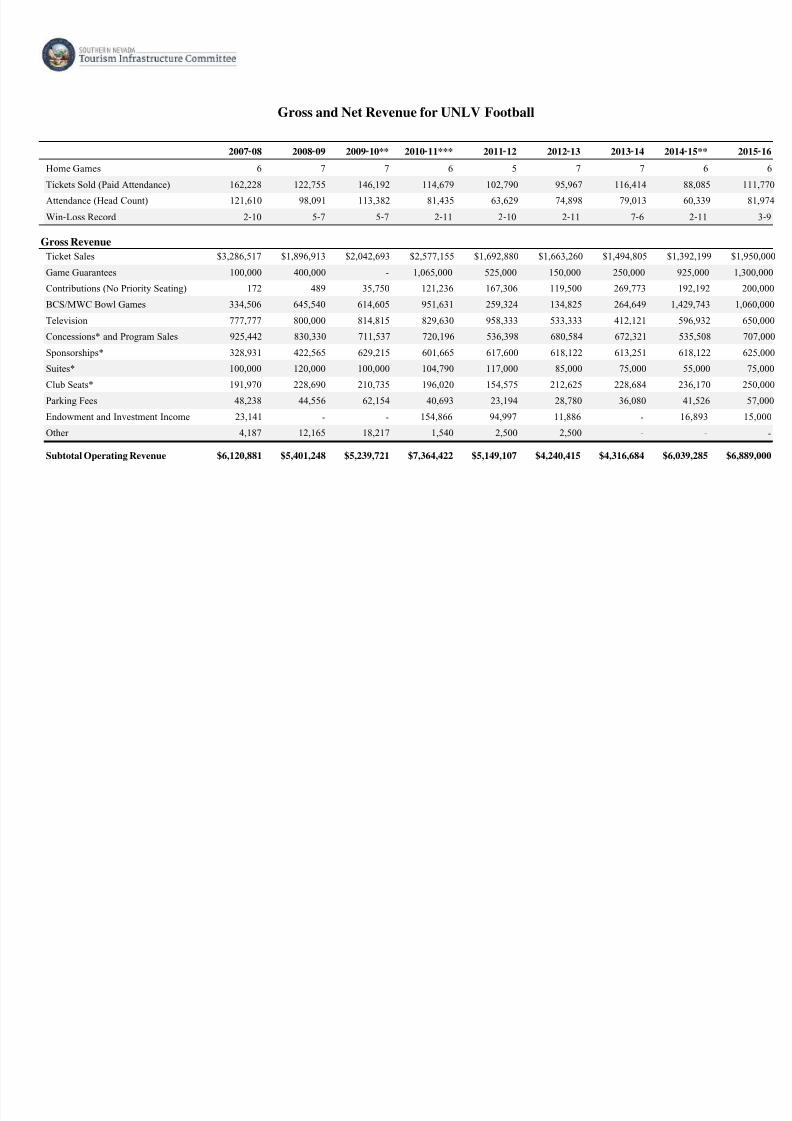
Gross and Net Revenue for UNLV Football
2007 08 2008 09 2009 10** 2010 11*** 2011 12 2012 13 2013 14 2014 15** 2
Home Games 6 7 7 6 5 7 7 6
Tickets Sold (Paid Attendance) 162,228 122,755 146,192 114,679 102,790 95,967 116,414 88,085 1
Attendance (Head Count) 121,610 98,091 113,382 81,435 63,629 74,898 79,013 60,339
Win‐Loss Record 2‐10 5‐7 5‐7 2‐11 2‐10 2‐11 7‐6 2‐11
Gross Revenue
Ticket Sales $3,286,517 $1,896,913 $2,042,693 $2,577,155 $1,692,880 $1,663,260 $1,494,805 $1,392,199 $1,9
Game Guarantees 100,000 400,000 ‐ 1,065,000 525,000 150,000 250,000 925,000 1,3
Contributions (No Priority Seating) 172 489 35,750 121,236 167,306 119,500 269,773 192,192 2
BCS/MWC Bowl Games 334,506 645,540 614,605 951,631 259,324 134,825 264,649 1,429,743 1,0
Television 777,777 800,000 814,815 829,630 958,333 533,333 412,121 596,932 6
Concessions* and Program Sales 925,442 830,330 711,537 720,196 536,398 680,584 672,321 535,508 7
Sponsorships* 328,931 422,565 629,215 601,665 617,600 618,122 613,251 618,122 6
Suites* 100,000 120,000 100,000 104,790 117,000 85,000 75,000 55,000
Club Seats* 191,970 228,690 210,735 196,020 154,575 212,625 228,684 236,170 2
Parking Fees 48,238 44,556 62,154 40,693 23,194 28,780 36,080 41,526
Endowment and Investment Income 23,141 ‐ ‐ 154,866 94,997 11,886 ‐ 16,893
Other 4,187 12,165 18,217 1,540 2,500 2,500 ‐ ‐
Subtotal Operating Revenue $6,120,881 $5,401,248 $5,239,721 $7,364,422 $5,149,107 $4,240,415 $4,316,684 $6,039,285 $6,8
8/17/2019 Las Vegas Stadium FAA Airport Site Problem Study
http://slidepdf.com/reader/full/las-vegas-stadium-faa-airport-site-problem-study 25/27
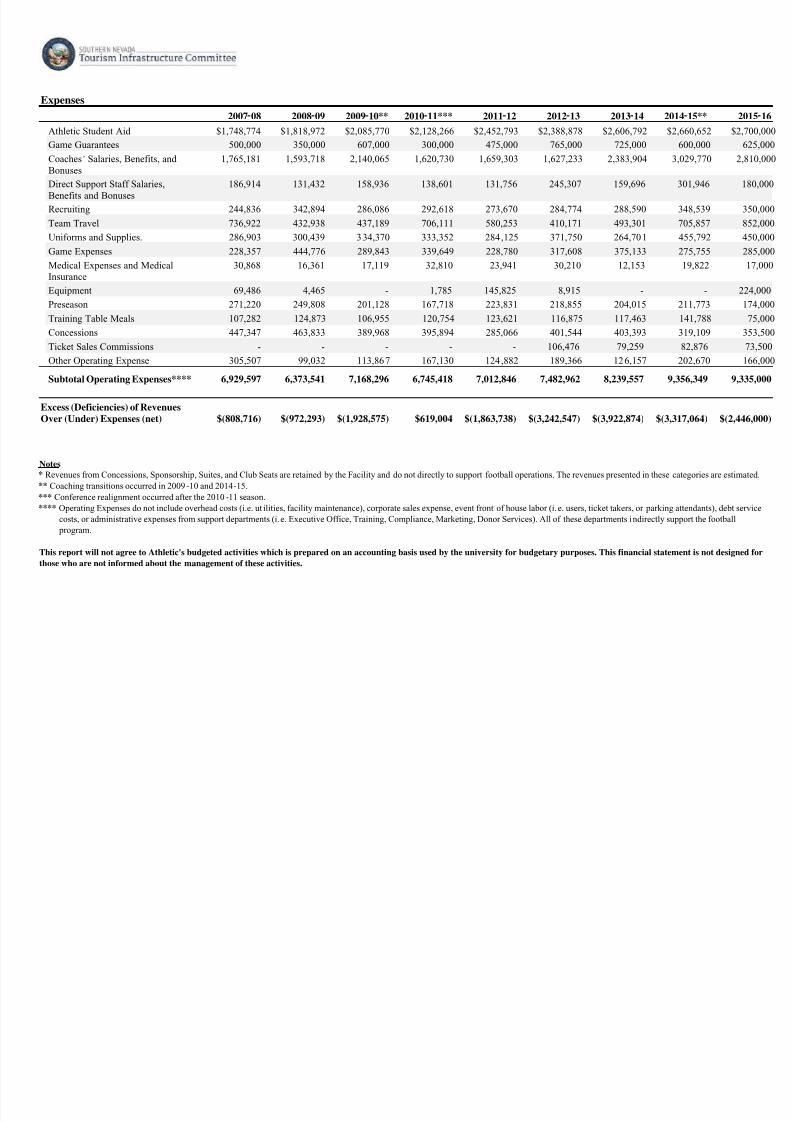
Notes * Revenues from Concessions, Sponsorship, Suites, and Club Seats are retained by the Facility and do not directly to support football operations. The revenues presented in these categories are estim
** Coaching transitions occurred in 2009‐10 and 2014‐15. *** Conference realignment occurred after the 2010‐11 season. **** Operating Expenses do not include overhead costs (i.e. ut ilities, facility maintenance), corporate sales expense, event front of house labor (i. e. users, ticket takers, or parking attendants), debt
costs, or administrative expenses from support departments (i. e. Executive Office, Training, Compliance, Marketing, Donor Services). All of these departments indirectly support the football
program.
This report will not agree to Athletic's budgeted activities which is prepared on an accounting basis used by the university for budgetary purposes. This financial statement is not design
those who are not informed about the management of these activities.
Expenses
2007 08 2008 09 2009 10** 2010 11*** 2011 12 2012 13 2013 14 2014 15** 2
Athletic Student Aid $1,748,774 $1,818,972 $2,085,770 $2,128,266 $2,452,793 $2,388,878 $2,606,792 $2,660,652 $2,7
Game Guarantees 500,000 350,000 607,000 300,000 475,000 765,000 725,000 600,000 6
Coaches’ Salaries, Benefits, andBonuses
1,765,181 1,593,718 2,140,065 1,620,730 1,659,303 1,627,233 2,383,904 3,029,770 2,8
Direct Support Staff Salaries,
Benefits and Bonuses
186,914 131,432 158,936 138,601 131,756 245,307 159,696 301,946 1
Recruiting 244,836 342,894 286,086 292,618 273,670 284,774 288,590 348,539 3
Team Travel 736,922 432,938 437,189 706,111 580,253 410,171 493,301 705,857 8
Uniforms and Supplies. 286,903 300,439 334,370 333,352 284,125 371,750 264,701 455,792 4
Game Expenses 228,357 444,776 289,843 339,649 228,780 317,608 375,133 275,755 2
Medical Expenses and MedicalInsurance
30,868 16,361 17,119 32,810 23,941 30,210 12,153 19,822
Equipment 69,486 4,465 ‐ 1,785 145,825 8,915 ‐ ‐ 2
Preseason 271,220 249,808 201,128 167,718 223,831 218,855 204,015 211,773 1
Training Table Meals 107,282 124,873 106,955 120,754 123,621 116,875 117,463 141,788
Concessions 447,347 463,833 389,968 395,894 285,066 401,544 403,393 319,109 3
Ticket Sales Commissions ‐ ‐ ‐ ‐ ‐ 106,476 79,259 82,876
Other Operating Expense 305,507 99,032 113,867 167,130 124,882 189,366 126,157 202,670 1
Subtotal Operating Expenses**** 6,929,597 6,373,541 7,168,296 6,745,418 7,012,846 7,482,962 8,239,557 9,356,349 9,3
Excess (Deficiencies) of RevenuesOver (Under) Expenses (net) $(808,716) $(972,293) $(1,928,575) $619,004 $(1,863,738) $(3,242,547) $(3,922,874) $(3,317,064) $(2,4
8/17/2019 Las Vegas Stadium FAA Airport Site Problem Study
http://slidepdf.com/reader/full/las-vegas-stadium-faa-airport-site-problem-study 26/27
NEW YORK WASHINGTON,DC HARTFORD LOS ANGELES GLOBALSTRATEGYGROUP
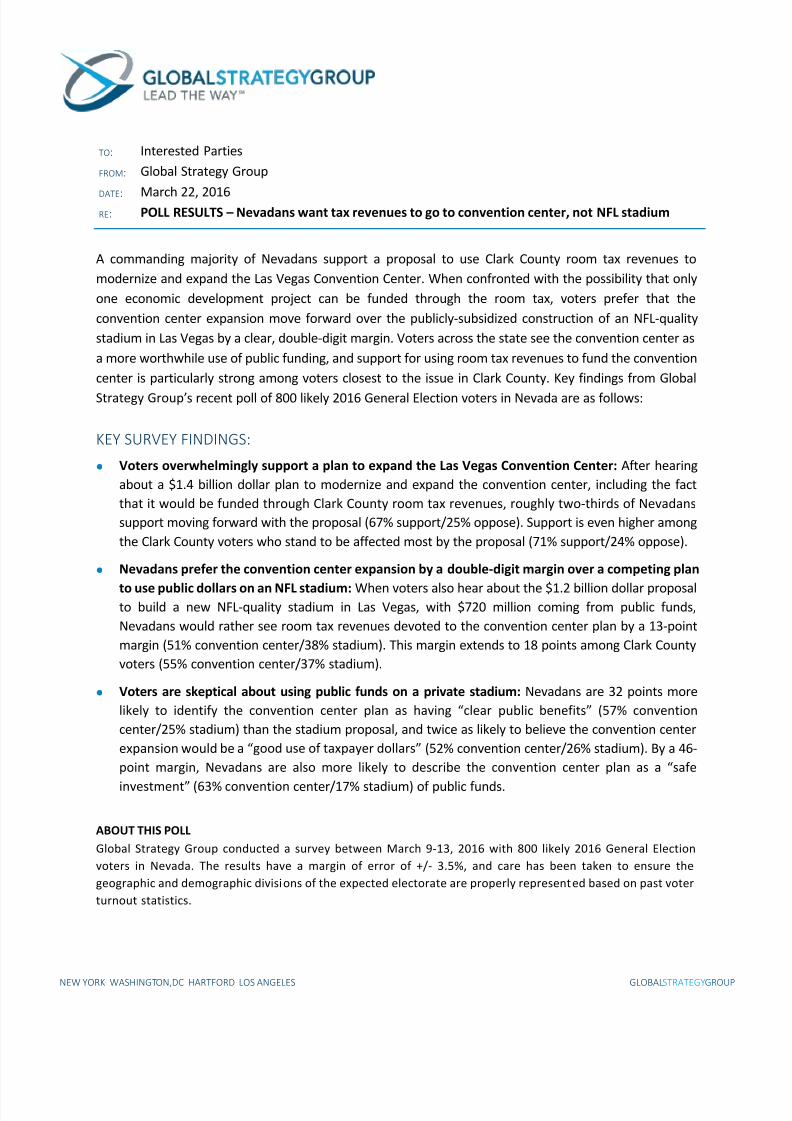
A commanding majority of Nevadans support a proposal to use Clark County room tax revenues to
modernize and expand the Las Vegas Convention Center. When confronted with the possibility that only
one economic development project can be funded through the room tax, voters prefer that the
convention center expansion move forward over the publicly-subsidized construction of an NFL-quality
stadium in Las Vegas by a clear, double-digit margin. Voters across the state see the convention center as
a more worthwhile use of public funding, and support for using room tax revenues to fund the convention
center is particularly strong among voters closest to the issue in Clark County. Key findings from Global
Strategy Group’s recent poll of 800 likely 2016 General Election voters in Nevada are as follows:
KEY SURVEY FINDINGS:
Voters overwhelmingly support a plan to expand the Las Vegas Convention Center: After hearing
about a $1.4 billion dollar plan to modernize and expand the convention center, including the fact
that it would be funded through Clark County room tax revenues, roughly two-thirds of Nevadans
support moving forward with the proposal (67% support/25% oppose). Support is even higher among
the Clark County voters who stand to be affected most by the proposal (71% support/24% oppose).
Nevadans prefer the convention center expansion by a double-digit margin over a competing plan
to use public dollars on an NFL stadium: When voters also hear about the $1.2 billion dollar proposalto build a new NFL-quality stadium in Las Vegas, with $720 million coming from public funds,
Nevadans would rather see room tax revenues devoted to the convention center plan by a 13-point
margin (51% convention center/38% stadium). This margin extends to 18 points among Clark County
voters (55% convention center/37% stadium).
Voters are skeptical about using public funds on a private stadium: Nevadans are 32 points more
likely to identify the convention center plan as having “clear public benefits” (57% convention
center/25% stadium) than the stadium proposal, and twice as likely to believe the convention center
expansion would be a “good use of taxpayer dollars” (52% convention center/26% stadium). By a 46-
point margin, Nevadans are also more likely to describe the convention center plan as a “safe
investment” (63% convention center/17% stadium) of public funds.
ABOUT THIS POLL
Global Strategy Group conducted a survey between March 9-13, 2016 with 800 likely 2016 General Election
voters in Nevada. The results have a margin of error of +/- 3.5%, and care has been taken to ensure the
geographic and demographic divisions of the expected electorate are properly represented based on past voter
turnout statistics.
TO: Interested Parties
FROM: Global Strategy Group
DATE: March 22, 2016RE: POLL RESULTS – Nevadans want tax revenues to go to convention center, not NFL stadium

8/17/2019 Las Vegas Stadium FAA Airport Site Problem Study
http://slidepdf.com/reader/full/las-vegas-stadium-faa-airport-site-problem-study 27/27
Future Las Vegas Hotel Room Inventory
The following table summarizes currently planned, proposed or under construction hotel projects in the LasVegas area as listed in the April 2016 edition of the Las Vegas Convention and Visitors Authority
Construction Bulletin. This list does not include the 3,875 rooms at the partially constructed Fontainebleau
Las Vegas, which has been listed for sale since November 2015.
Las Vegas Hotel Room Inventory
2015 End of Year Total 149,213
2016
Residence Inn (South) #2 124Thunderbird Hotel (formerly Aruba Hotel & Spa) 110
Total 149,447
2017 All Net Resort and Arena 500
Lucky Dragon Hotel & Casino 206
Starwood Hotels & Resorts 125
Former Tod Hostel Motel 42
Total 150,320
2018 Residence Inn Marriott (Henderson) 100
SpringHill Suites Marriott 252
Alon Las Vegas 1,100
Mardi Gras Hotel and Casino 386Resorts World Las Vegas (Phase 1) 3,500
Total 155,658
2019 and Beyond Fairfield Inn (NW) 87
Wynn Paradise Park 1,000
Total 156,745