larsson - 2007 - hr - human iris characteristics as biomarkers for personality
TRANSCRIPT

Human Iris Characteristics as Biomarkers for Personality
Mats Larsson
Human Iris Characteristics as Biomarkers for Personality
Mats Larsson
27864 Avhandling_inlaga.indd 1 1/28/08 9:19:42 AM
Cover Art Nature Genetics July 2007 39 No 7s made by Erin Boyle http://www.callme-eb.com
MA
TS L
AR
SSON
Hum
an Iris Characteristics as B
iomarkers for Personality
ISSN 1651-1382ISBN 978-91-7668-562-4
MATS LARSSON works as a researcher and lecturer at the Center for Developmental Research and the Department of Behavioral, Social and Legal Sciences at Örebro University, Sweden. His re-search interests lie within the fi eld of Behavioral Genetics, with an emphasis on genes that infl uence personality and the extent to which such
genes also infl uence other behaviors. His dissertation investigates whether it is possible to increase power to detect genes that infl uence personality by using iris characteristics and a person-oriented approach. The following questions are addressed:
- What is the extent to which genes contribute to tissue differences in the human iris?
- Are the genetic effects that infl uence the appearance of different iris characteristics independent of each other?
- Is it possible to take advantage of the self-organized mechanisms that govern the development of the nervous system by using iris data and a person-oriented app-roach?
- Does the power to detect genetic effects for personality increase when iris data and a person-oriented approach are used?
- Are the confi gurations of iris characteristics that typically occur in a population systematically related to how the tissue grows in the frontal lobe?
- Why has it been so hard to replicate candidate gene fi ndings for personality over the last 10 years?
- Will it be easier to replicate candidate gene fi ndings for personality if iris data are used?
- Can iris data and DNA collected from twins be used to pinpoint the personality traits that are most strongly inherited for an individual?

27864 Avhandling_inlaga.indd 1 1/28/08 9:19:42 AM
Doctorial Dissertation
Human Iris Characteristics asBiomarkers for Personality
Mats Larsson
Psychology
Publications in series Örebro Studies in Psychology
1.
Hum
an Iris Characteristics as B
iomarkers for Personality
ISSN 1651-1382ISBN 978-91-7668-562-4
Örebro Studies in Psychology 12
ÖREBRO 2007

Human Iris Characteristics as Biomarkers for Personality
27864 Avhandling_inlaga.indd 1 1/28/08 9:19:42 AM


3
Örebro Studies in Psychology 12
MATS LARSSON
Human Iris Characteristics as
Biomarkers for Personality
2
This dissertation is dedicated to my beloved Anna.
The kindest, smartest and most caring person I know. You are simply the best…!
y
27864 Avhandling_inlaga.indd 2 1/28/08 9:19:42 AM

3
Örebro Studies in Psychology 12
MATS LARSSON
Human Iris Characteristics as
Biomarkers for Personality
2
This dissertation is dedicated to my beloved Anna.
The kindest, smartest and most caring person I know. You are simply the best…!
y
27864 Avhandling_inlaga.indd 3 1/28/08 9:19:42 AM

5
ABSTRACT
This dissertation explains why behavioral genetic research can be better informed by using characteristics in the human iris as biomarkers for personality, and is divided into five parts. Part I gives an introduction to the classical twin method and an overview of the findings that have led most developmental researchers to recognize that the normal variation of personality depends on a complex interplay between genetic and environmental factors. Part II highlights empirical findings that, during the last twenty years, have gradually moved genetic and environmental theory and research to evolve toward one another, and also presents the theory of genetics and experience that currently is used to explain how the interplay between genes and the environment works. Part III explains why, from a developmental perspective, it is of interest to identify candidate genes for personality, and gives a brief overview of genes that have been associated with personality. Problems associated with genetic research on the molecular level and how these apply to personality are also highlighted. Part IV examines molecular research on the iris and the brain, which suggests that genes expressed in the iris may be associated with personality, and explains how the use of iris characteristics and a person-oriented methodology can increase power to test candidate genes for personality by taking advantage of the self-organizing properties of the nervous system. The empirical foundation for the questions posed in this dissertation and also the empirical results are presented here. Part V discusses the associations found between iris characteristics and personality, and exemplifies how iris characteristics can be used within the theoretical frameworks presented in parts I, II, III and IV. In other words, Part V explains how iris characteristics and a person-oriented methodology – as well as identifying, and increasing power to test candidate genes for personality - can be used to investigate how people’s experiences in themselves are influenced by genetic factors.
Key Words: Personality; iris characteristics/crypts/pigment dots/contraction furrows; person-oriented approach; candidate genes MITF/PAX6/SIX3/LMX1B/FOXC1/ FOXC2/PITX2/BMP4/OLFM3/ MSX1/MSX2; anterior cingulate; genetic correlations; heritability; hemispheric asymmetries; approach-related behaviors.
4
© Mats Larsson, 2007
Title: Human Iris Characteristics as Biomarkers for Personality Publisher: Örebro University, 2007
www.oru.se/ub/ Editor: Heinz Merten
Printer: Prinfo Welins Tryckeri, Örebro 12/2007
ISSN 1651-1382 ISBN 978-91-7668-562-4
27864 Avhandling_inlaga.indd 4 1/28/08 9:19:42 AM

5
ABSTRACT
This dissertation explains why behavioral genetic research can be better informed by using characteristics in the human iris as biomarkers for personality, and is divided into five parts. Part I gives an introduction to the classical twin method and an overview of the findings that have led most developmental researchers to recognize that the normal variation of personality depends on a complex interplay between genetic and environmental factors. Part II highlights empirical findings that, during the last twenty years, have gradually moved genetic and environmental theory and research to evolve toward one another, and also presents the theory of genetics and experience that currently is used to explain how the interplay between genes and the environment works. Part III explains why, from a developmental perspective, it is of interest to identify candidate genes for personality, and gives a brief overview of genes that have been associated with personality. Problems associated with genetic research on the molecular level and how these apply to personality are also highlighted. Part IV examines molecular research on the iris and the brain, which suggests that genes expressed in the iris may be associated with personality, and explains how the use of iris characteristics and a person-oriented methodology can increase power to test candidate genes for personality by taking advantage of the self-organizing properties of the nervous system. The empirical foundation for the questions posed in this dissertation and also the empirical results are presented here. Part V discusses the associations found between iris characteristics and personality, and exemplifies how iris characteristics can be used within the theoretical frameworks presented in parts I, II, III and IV. In other words, Part V explains how iris characteristics and a person-oriented methodology – as well as identifying, and increasing power to test candidate genes for personality - can be used to investigate how people’s experiences in themselves are influenced by genetic factors.
Key Words: Personality; iris characteristics/crypts/pigment dots/contraction furrows; person-oriented approach; candidate genes MITF/PAX6/SIX3/LMX1B/FOXC1/ FOXC2/PITX2/BMP4/OLFM3/ MSX1/MSX2; anterior cingulate; genetic correlations; heritability; hemispheric asymmetries; approach-related behaviors.
4
© Mats Larsson, 2007
Title: Human Iris Characteristics as Biomarkers for Personality Publisher: Örebro University, 2007
www.oru.se/ub/ Editor: Heinz Merten
Printer: Prinfo Welins Tryckeri, Örebro 12/2007
ISSN 1651-1382 ISBN 978-91-7668-562-4
27864 Avhandling_inlaga.indd 5 1/28/08 9:19:43 AM

7
The work presented in this dissertation was conducted at the Center for Developmental Research at Örebro University, Sweden. It has been supported by Örebro University and grants from the Adolf Lindgren Foundation, the Helge Ax:son Johonson Foundation and the Swedish Foundation for International Cooperation and Higher Education (STINT). Quite a few people have been involved in making this dissertation possible. I remember with gratitude Doctor Angelica Burkhardt, who – at a very stressful time – helped me to digitalize the iris images in her German twin sample. They have been used in the two first studies in this dissertation. I am most grateful to my advisor, Professor Håkan Stattin, who decided to provide the funds to purchase the digitalized iris images. I remember with gratitude when Professor Nancy Pedersen, after I presented my Bachelor Degree paper at the Behavioral Genetics Annual Meeting in Stockholm, agreed to become my other supervisor. She helped me to convince Dr. Burkhardt that it would be worthwhile to estimate the heritability of characteristics in the human iris, and she agreed that it would be possible to present a dissertation on the basis of the idea that the iris potentially can be used to identify candidate findings for personality. The encouragement I received from Professor Nick Marin and Professor Matt McGue, after my presentation at the Behavioral Genetic Association’s Meeting in Stockholm, to pursue this line of research is another great memory, which has inspired me, and which has helped me to stick to my ideas. Their encouragement cannot be overestimated. I am also most grateful for the interest and help that I have received from Professor Michael Stallings and Professor Gregory Carey during my studies at the Institute for Behavioral Genetics in Boulder, Colorado. Our discussions gave birth to the idea that the use of iris characteristics can be used to decrease the genetic heterogeneity present in large populations. This idea fits extremely well with the person-oriented approach, which Professor Håkan Stattin has written extensively about, and which has inspired my work. The idea was applied in the third study in my dissertation, and it shows that it is possible to increase power to detect genes that influence personality by using iris data and a person-oriented approach that takes advantage of the self-organizing mechan-isms governing the development of the nervous system. The thoughtful comments on previous versions of this dissertation by my principal supervisor, Professor Nancy Pedersen, have of course also been invaluable. I am unsure if it was her intent but, in any event, they convinced me that the candidate gene findings for personality that will derive from whole genome scan studies in the future need to be replicated in studies that use other designs, and that these designs ideally should be able to pinpoint for whom a particular gene is most important. According to the results in this dissertation, this is something that can be achieved by collecting both iris data and DNA in the future (see parts IV and V). I am also most grateful to all the friends who have supported me during the completion of this dissertation. All my love to: Anna, Chris - thanks for Tea and magical insight into Ken Wilber’s Integral Model, my family, Kari & colleges at Örebro University, Hansson, Jelle, Anders, Helena, Jennifer, Catherine, Kim-Annette, Per and Susanna.
27864 Avhandling_inlaga.indd 6 1/28/08 9:19:43 AM
The work presented in this dissertation was conducted at the Center for Developmental Research at Örebro University, Sweden. It has been supported by Örebro University and grants from the Adolf Lindgren Foundation, the Helge Ax:son Johonson Foundation and the Swedish Foundation for International Cooperation and Higher Education (STINT). Quite a few people have been involved in making this dissertation possible. I remember with gratitude Doctor Angelica Burkhardt, who – at a very stressful time – helped me to digitalize the iris images in her German twin sample. They have been used in the two first studies in this dissertation. I am most grateful to my advisor, Professor Håkan Stattin, who decided to provide the funds to purchase the digitalized iris images. I remember with gratitude when Professor Nancy Pedersen, after I presented my Bachelor Degree paper at the Behavioral Genetics Annual Meeting in Stockholm, agreed to become my other supervisor. She helped me to convince Dr. Burkhardt that it would be worthwhile to estimate the heritability of characteristics in the human iris, and she agreed that it would be possible to present a dissertation on the basis of the idea that the iris potentially can be used to identify candidate findings for personality. The encouragement I received from Professor Nick Marin and Professor Matt McGue, after my presentation at the Behavioral Genetic Association’s Meeting in Stockholm, to pursue this line of research is another great memory, which has inspired me, and which has helped me to stick to my ideas. Their encouragement cannot be overestimated. I am also most grateful for the interest and help that I have received from Professor Michael Stallings and Professor Gregory Carey during my studies at the Institute for Behavioral Genetics in Boulder, Colorado. Our discussions gave birth to the idea that the use of iris characteristics can be used to decrease the genetic heterogeneity present in large populations. This idea fits extremely well with the person-oriented approach, which Professor Håkan Stattin has written extensively about, and which has inspired my work. The idea was applied in the third study in my dissertation, and it shows that it is possible to increase power to detect genes that influence personality by using iris data and a person-oriented approach that takes advantage of the self-organizing mechan-isms governing the development of the nervous system. The thoughtful comments on previous versions of this dissertation by my principal supervisor, Professor Nancy Pedersen, have of course also been invaluable. I am unsure if it was her intent but, in any event, they convinced me that the candidate gene findings for personality that will derive from whole genome scan studies in the future need to be replicated in studies that use other designs, and that these designs ideally should be able to pinpoint for whom a particular gene is most important. According to the results in this dissertation, this is something that can be achieved by collecting both iris data and DNA in the future (see parts IV and V). I am also most grateful to all the friends who have supported me during the completion of this dissertation. All my love to: Anna, Chris - thanks for Tea and magical insight into Ken Wilber’s Integral Model, my family, Kari & colleges at Örebro University, Hansson, Jelle, Anders, Helena, Jennifer, Catherine, Kim-Annette, Per and Susanna.
6
ACKNOWLEDGEMENTS
27864 Avhandling_inlaga.indd 7 1/28/08 9:19:43 AM
ACKNOWLEDGEMENTS

9
List of studies
The present thesis is based on the following studies, which will be referred to in the text by their Roman numerals. Study I Larsson, M., Pedersen, N.L., Stattin, H. (2003). Importance of genetic
effects for characteristics of the human iris. Twin Research 6:192-200. Study II Larsson, M., & Pedersen, N.L. (2004). Genetic correlations among texture
characteristics in the human iris. Molecular Vision 10:821-831. Study III Larsson, M., Pedersen, N.L., & Stattin, H. (2007). Associations between
iris characteristics and personality in adulthood. Biological Psychology 75:165-175.
All studies have been reprinted by permission.
8
An eye of flesh, an eye of reason, and an eye of contemplation…
…let us assume that all men and women possess an eye of flesh, an eye of reason, and an eye of contemplation; that each eye has its own objects of knowledge
(sensory, mental and transcendental); that a higher eye cannot be reduced to nor explain solely in terms of a lower eye; that
each eye is valid and useful in its own field, but commits a fallacy when it attempts, by
itself, to fully grasp higher or lower realms
- Ken Wilber -
…personality is a pattern of defense mechanisms that we mistakenly tend to identify
as solid and ourselves - Irini Rockwell -
…you’re just a prisoner of your dreams - Bruce Springsteen -
…there is much more to evolution t han a little piece of DNA
- Stuart Davis -
27864 Avhandling_inlaga.indd 8 1/28/08 9:49:11 AM

9
List of studies
The present thesis is based on the following studies, which will be referred to in the text by their Roman numerals. Study I Larsson, M., Pedersen, N.L., Stattin, H. (2003). Importance of genetic
effects for characteristics of the human iris. Twin Research 6:192-200. Study II Larsson, M., & Pedersen, N.L. (2004). Genetic correlations among texture
characteristics in the human iris. Molecular Vision 10:821-831. Study III Larsson, M., Pedersen, N.L., & Stattin, H. (2007). Associations between
iris characteristics and personality in adulthood. Biological Psychology 75:165-175.
All studies have been reprinted by permission.
An eye of flesh, an eye of reason, and an eye of contemplation…
…let us assume that all men and women possess an eye of flesh, an eye of reason, and an eye of contemplation; that each eye has its own objects of knowledge
(sensory, mental and transcendental); that a higher eye cannot be reduced to nor explain solely in terms of a lower eye; that
each eye is valid and useful in its own field, but commits a fallacy when it attempts, by
itself, to fully grasp higher or lower realms
- Ken Wilber -
…personality is a pattern of defense mechanisms that we mistakenly tend to identify
as solid and ourselves - Irini Rockwell -
…you just a prisoner of your dreams - Bruce Springsteen -
- Stuart Davis -
than a little piece of DNA …there is much more to evolution
27864 Avhandling_inlaga.indd 9 1/28/08 9:19:44 AM

11
Table of contents
Part I…………………………………………………………………………..................... 19 1.1 Basic reasoning………………...………………………………………....…………… 19 1.2 Constructs used………………………………...……………………........………….. 19 1.3 Estimates of heritability (h2) and environmentability (e2) using twins……….…... 20 1.4 Heritability – different sources……………...…………….…………………………. 21 1.5 Heritability – a population dependent measure……………….…………….……… 22 1.6 Environmentability – different sources……….……………………………...……… 22 1.7 Twin studies focus on anonymous variance components………...…..…………… 23 1.8 Developmental psychology and the nurture assumption………..…….…………… 23 1.9.1 How much do genes contribute to personality?…………….....………………… 24 1.9.2 Potential effects of non-additive genetic influences……......….…………….…… 25 1.9.3 Potential effects of assortative mating……………………...……………...……… 25 1.9.4 Potential effects of a violation of the equal environment assumption…..……… 26 1.9.5 Potential effects of many environmental influences each with a small effect..… 27 1.10 Which type of environmental influence is of greatest importance for personality? ……...…………………………………………………………………...29 1.11.1 To what extent does heritability for personality change over time...............… 32 1.11.2 Empirical answers……………….………………………………………………… 32 1.12 Is the stability of personality in adulthood due to genetic or environmental effects?............................................................................................................... 33 Part II………………………………………………...…………………………………..… 35 2.1 Are people’s adaptations to different situations influenced by genes?…..........…..35 2.2 Are the most commonly used environmental measures pure measures of the environment?....................................................................................................... 36 2.3.1 The Theory of Genetics and Experience………………...……...…………….… 38 2.3.2 Genotype-Environment correlations…………………............………………...… 38 2.3.3 Genotype-Environmental interactions…………………...……………………...…39 2.4 Do the same genes that influence personality also influence other behaviors?...... 42 Part III………………………………….…………………………………………………… 45 3.1 Why do we need to identify candidate genes for personality?…………………..… 45 3.2 Functional Genomics………….…………………………...…………………….…… 46 3.3.1 Neurotransmission and genetic pathways associated with personality…........... 48 3.3.2 Dopamine pathways………………………………………………………………... 48 3.3.3 Serotonin pathways…………………………………………………....…………… 49 3.3.4 Noradrenergic pathways…………………………………………..................…… 50 3.4.1 Monoamine metabolisms pathways ………………...…………………..……...… 51 3.4.2 Catechol-O-methyltransferase (COMT)…………………………………..……… 51 3.4.3 Monoamine oxidase A and B………….……………………....………...………… 52 3.4.4 MAO-A……………………...………………...……………………………..……… 52 3.4.5 MAO-B……………………………...…………...…………………………..……… 52 3.5 Neurotransmission and personality - what has been established?……………...… 53
10
27864 Avhandling_inlaga.indd 10 1/28/08 9:19:44 AM

11
Table of contents
Part I…………………………………………………………………………..................... 19 1.1 Basic reasoning………………...………………………………………....…………… 19 1.2 Constructs used………………………………...……………………........………….. 19 1.3 Estimates of heritability (h2) and environmentability (e2) using twins……….…... 20 1.4 Heritability – different sources……………...…………….…………………………. 21 1.5 Heritability – a population dependent measure……………….…………….……… 22 1.6 Environmentability – different sources……….……………………………...……… 22 1.7 Twin studies focus on anonymous variance components………...…..…………… 23 1.8 Developmental psychology and the nurture assumption………..…….…………… 23 1.9.1 How much do genes contribute to personality?…………….....………………… 24 1.9.2 Potential effects of non-additive genetic influences……......….…………….…… 25 1.9.3 Potential effects of assortative mating……………………...……………...……… 25 1.9.4 Potential effects of a violation of the equal environment assumption…..……… 26 1.9.5 Potential effects of many environmental influences each with a small effect..… 27 1.10 Which type of environmental influence is of greatest importance for personality? ……...…………………………………………………………………...29 1.11.1 To what extent does heritability for personality change over time...............… 32 1.11.2 Empirical answers……………….………………………………………………… 32 1.12 Is the stability of personality in adulthood due to genetic or environmental effects?............................................................................................................... 33 Part II………………………………………………...…………………………………..… 35 2.1 Are people’s adaptations to different situations influenced by genes?…..........…..35 2.2 Are the most commonly used environmental measures pure measures of the environment?....................................................................................................... 36 2.3.1 The Theory of Genetics and Experience………………...……...…………….… 38 2.3.2 Genotype-Environment correlations…………………............………………...… 38 2.3.3 Genotype-Environmental interactions…………………...……………………...…39 2.4 Do the same genes that influence personality also influence other behaviors?...... 42 Part III………………………………….…………………………………………………… 45 3.1 Why do we need to identify candidate genes for personality?…………………..… 45 3.2 Functional Genomics………….…………………………...…………………….…… 46 3.3.1 Neurotransmission and genetic pathways associated with personality…........... 48 3.3.2 Dopamine pathways………………………………………………………………... 48 3.3.3 Serotonin pathways…………………………………………………....…………… 49 3.3.4 Noradrenergic pathways…………………………………………..................…… 50 3.4.1 Monoamine metabolisms pathways ………………...…………………..……...… 51 3.4.2 Catechol-O-methyltransferase (COMT)…………………………………..……… 51 3.4.3 Monoamine oxidase A and B………….……………………....………...………… 52 3.4.4 MAO-A……………………...………………...……………………………..……… 52 3.4.5 MAO-B……………………………...…………...…………………………..……… 52 3.5 Neurotransmission and personality - what has been established?……………...… 53
10
27864 Avhandling_inlaga.indd 11 1/28/08 9:19:44 AM

13
5.1.2 Correspondences with other findings in the personality field: the Conscientiousness and Impulsiveness findings………………….………………... 93 5.2.1 Novel findings and how iris data potentially can be useful for genetic association studies.…………………….………….…………………………...…… 94 5.2.2 Other future studies…………….…………………….…………..………………… 99 References………………………………...………………………………...……………. 103
12
3.6.1 Is it really possible to establish “firm” associations between genes and personality………………………………………………………………………….. 56 3.6.2 “Firm” associations between genes and personality: under which circumstances?..............................................................................................… 60 3.7.1 New methods: will they be able to elucidate the genetic complexity of personality........................................................................................................ 61 3.7.2 Problems in whole genome association studies…………............…………..…… 62 Part IV………………………………………………………….……………………...…… 66 4.1.1 Why use iris characteristics?.............................................................................. 66 4.1.2 Iris data characteristics that may be helpful………………………………….…... 67 4.2.1 Study I.…………………………………...……....………………………………..… 68 4.2.2 Comparative scale construction……………………………….……………...…… 69 4.2.3 The rating catalogue and rating procedure ………………………………….…… 69 4.2.4 Analysis and result ……………………………….……...…….…………………… 69 4.3.1 Study II……………………………………………...………………………..……… 70 4.3.2 Method………………………...……………………………………….........……… 71 4.3.3.1 The morphology of the human iris ………………………..……….…...……… 71 4.3.3.2 Anterior border layer………………………………...……………...…………… 72 4.3.3.3 Stroma…………….……………….……………...………………….....………… 72 4.3.3.4 The sphincter and dilator muscles…………...…….………….....………...…… 73 4.3.3.5 Anterior and posterior pigmented epithelium…………………..…………....… 74 4.3.4 The genetic correlation between crypt and contraction furrows…….……….… 75 4.3.5 The results in Study II...…………...……...…………...…………………………… 76 4.3.6 The embryological origin of the human iris……………………………....……… 77 4.3.7 The embryological development of the human iris…………………….……...… 78 4.3.8 The most plausible candidate genes for crypt and contraction furrows……..… 80 4.4.1 Study III ………………………….........……………………………………….…… 83 4.4.2 Hypotheses concerning PAX6 expression in the brain, related to personality and iris characteristics, assuming linear effects…………………………………... 83 4.4.3 Hypotheses derived from PAX6 expression in the brain assuming self-organized effects………………………………………………...……………… 85 4.4.4.1 Data collection, participants and measures………………………..….…...…… 86 4.4.4.2 Analysis…………………………...……………………………………..………… 86 4.4.5.1 The results of the variable- and person-oriented analyses: hypothesis testing………………………………………………………………..…………..… 87 4.4.5.2 The results of the variable-oriented analysis - conceptualizations…….……… 90 4.4.5.3 The results of the person-oriented analysis – conceptualizations…….........… 91 Part V………………………………...…………………………………………...……...… 92 5.1.1 Correspondences with other findings in the personality field: approach-related behaviors…………………………………………………..…………...…………....92
27864 Avhandling_inlaga.indd 12 1/28/08 9:19:44 AM

13
5.1.2 Correspondences with other findings in the personality field: the Conscientiousness and Impulsiveness findings………………….………………... 93 5.2.1 Novel findings and how iris data potentially can be useful for genetic association studies.…………………….………….…………………………...…… 94 5.2.2 Other future studies…………….…………………….…………..………………… 99 References………………………………...………………………………...……………. 103
12
3.6.1 Is it really possible to establish “firm” associations between genes and personality………………………………………………………………………….. 56 3.6.2 “Firm” associations between genes and personality: under which circumstances?..............................................................................................… 60 3.7.1 New methods: will they be able to elucidate the genetic complexity of personality........................................................................................................ 61 3.7.2 Problems in whole genome association studies…………............…………..…… 62 Part IV………………………………………………………….……………………...…… 66 4.1.1 Why use iris characteristics?.............................................................................. 66 4.1.2 Iris data characteristics that may be helpful………………………………….…... 67 4.2.1 Study I.…………………………………...……....………………………………..… 68 4.2.2 Comparative scale construction……………………………….……………...…… 69 4.2.3 The rating catalogue and rating procedure ………………………………….…… 69 4.2.4 Analysis and result ……………………………….……...…….…………………… 69 4.3.1 Study II……………………………………………...………………………..……… 70 4.3.2 Method………………………...……………………………………….........……… 71 4.3.3.1 The morphology of the human iris ………………………..……….…...……… 71 4.3.3.2 Anterior border layer………………………………...……………...…………… 72 4.3.3.3 Stroma…………….……………….……………...………………….....………… 72 4.3.3.4 The sphincter and dilator muscles…………...…….………….....………...…… 73 4.3.3.5 Anterior and posterior pigmented epithelium…………………..…………....… 74 4.3.4 The genetic correlation between crypt and contraction furrows…….……….… 75 4.3.5 The results in Study II...…………...……...…………...…………………………… 76 4.3.6 The embryological origin of the human iris……………………………....……… 77 4.3.7 The embryological development of the human iris…………………….……...… 78 4.3.8 The most plausible candidate genes for crypt and contraction furrows……..… 80 4.4.1 Study III ………………………….........……………………………………….…… 83 4.4.2 Hypotheses concerning PAX6 expression in the brain, related to personality and iris characteristics, assuming linear effects…………………………………... 83 4.4.3 Hypotheses derived from PAX6 expression in the brain assuming self-organized effects………………………………………………...……………… 85 4.4.4.1 Data collection, participants and measures………………………..….…...…… 86 4.4.4.2 Analysis…………………………...……………………………………..………… 86 4.4.5.1 The results of the variable- and person-oriented analyses: hypothesis testing………………………………………………………………..…………..… 87 4.4.5.2 The results of the variable-oriented analysis - conceptualizations…….……… 90 4.4.5.3 The results of the person-oriented analysis – conceptualizations…….........… 91 Part V………………………………...…………………………………………...……...… 92 5.1.1 Correspondences with other findings in the personality field: approach-related behaviors…………………………………………………..…………...…………....92
27864 Avhandling_inlaga.indd 13 1/28/08 9:19:44 AM

15
List of tables Table 1 Studies of Extraversion and Neuroticism in Twins Raised Together and Twin Raised Apart………………………………….. 28 Table 2 Correlation Between Life stressors at Age 6 to 15, and MZ Twin Within-Pair Differences in Self-Reported Big Five Personality Factors at Age 29 (n = 52)……………………….…...….. 33 Table 3 Twin Correlation for adolescent Twin Ratings of Their Parents’ Child Rearing……………………………….…….…...……. 36 Table 4 Maximum-Likelihood Parameter Estimates in the full Cholesky Model (adapted from STUDY II)…………………....… 77 Table 5 Distribution of iris characteristics (adapted from STUDY III)……..….… 86 Table 6 The configurations of iris characteristic that typically exists in early adults (adapted from STUDY III)……………………….…. 87 Table 7 Pearson correlation between iris characteristics and the personality measures (adapted from STUDY III)……………….…..... 88 Table 8 Means of the personality measures with standard deviations within parentheses in each of the four subgroups, with test for mean differences between the subgroups (one-way ANOVA, posthoc = Tukey HSD) (adapted from STUDY III)…………….......….… 89 Table 9 The effect size for all associations that was significant in the variable- and person-oriented analysis (adapted from STUDY III)………………....89
14
27864 Avhandling_inlaga.indd 14 1/28/08 9:19:45 AM

15
List of tables Table 1 Studies of Extraversion and Neuroticism in Twins Raised Together and Twin Raised Apart………………………………….. 28 Table 2 Correlation Between Life stressors at Age 6 to 15, and MZ Twin Within-Pair Differences in Self-Reported Big Five Personality Factors at Age 29 (n = 52)……………………….…...….. 33 Table 3 Twin Correlation for adolescent Twin Ratings of Their Parents’ Child Rearing……………………………….…….…...……. 36 Table 4 Maximum-Likelihood Parameter Estimates in the full Cholesky Model (adapted from STUDY II)…………………....… 77 Table 5 Distribution of iris characteristics (adapted from STUDY III)……..….… 86 Table 6 The configurations of iris characteristic that typically exists in early adults (adapted from STUDY III)……………………….…. 87 Table 7 Pearson correlation between iris characteristics and the personality measures (adapted from STUDY III)……………….…..... 88 Table 8 Means of the personality measures with standard deviations within parentheses in each of the four subgroups, with test for mean differences between the subgroups (one-way ANOVA, posthoc = Tukey HSD) (adapted from STUDY III)…………….......….… 89 Table 9 The effect size for all associations that was significant in the variable- and person-oriented analysis (adapted from STUDY III)………………....89
14
27864 Avhandling_inlaga.indd 15 1/28/08 9:19:45 AM

17
List of figures Figure 1 Genetic and environmental effects for basic domains of personality........ 30 Figure 2 Genotype-environment interactions according to Bergman et al., 1988 adopting Csikszentmihalyi’s model for well-being…………………......… 41 Figure 3 Sub-disciplines with the field of Functional Genomics………………....… 46 Figure 4 Four different types of iris patterns in the human iris……….........…...… 67 Figure 5 The five cell layers in the human iris………………………………….....… 72 Figure 6 Crypt of Fuchs: cell loss in the two top cell layers in the human iris……. 73 Figure 7 The organization of muscle fibers in the human iris………………..…..... 74 Figure 8 The two bottom cell layers in the iris: the anterior and posterior
epithelium……………………………………………………………….....… 75 Figure 9 A cross section of the iris illustrating a contraction furrows…................ 76 Figure 10 The pupillary membrane in the firth and seventh month of gestation….. 78 Figure 11 The migration of the iris from the rim of the optic cup starts after 12 weeks of gestation…………………………….............………..…. 79 Figure 12 Mild iris hypoplasia caused by a missense mutation in PAX6...………....81 Figure 13 Tissue loss in the iris associated with mutations in FOXC1, FOXC2
and PITX2.....................................................................................…..... 82 Figure 14 The anatomy for the anterior cinglulate cortex in the frontal lobe……... 84 Figure 15 Meta-analysis results of cognitive and emotional studies in anterior
cingulate cortex……………………………………………………………… 94
16
27864 Avhandling_inlaga.indd 16 1/28/08 9:19:45 AM
17
List of figures Figure 1 Genetic and environmental effects for basic domains of personality........ 30 Figure 2 Genotype-environment interactions according to Bergman et al., 1988 adopting Csikszentmihalyi’s model for well-being…………………......… 41 Figure 3 Sub-disciplines with the field of Functional Genomics………………....… 46 Figure 4 Four different types of iris patterns in the human iris……….........…...… 67 Figure 5 The five cell layers in the human iris………………………………….....… 72 Figure 6 Crypt of Fuchs: cell loss in the two top cell layers in the human iris……. 73 Figure 7 The organization of muscle fibers in the human iris………………..…..... 74 Figure 8 The two bottom cell layers in the iris: the anterior and posterior
epithelium……………………………………………………………….....… 75 Figure 9 A cross section of the iris illustrating a contraction furrows…................ 76 Figure 10 The pupillary membrane in the firth and seventh month of gestation….. 78 Figure 11 The migration of the iris from the rim of the optic cup starts after 12 weeks of gestation…………………………….............………..…. 79 Figure 12 Mild iris hypoplasia caused by a missense mutation in PAX6...………....81 Figure 13 Tissue loss in the iris associated with mutations in FOXC1, FOXC2
and PITX2.....................................................................................…..... 82 Figure 14 The anatomy for the anterior cinglulate cortex in the frontal lobe……... 84 Figure 15 Meta-analysis results of cognitive and emotional studies in anterior
cingulate cortex……………………………………………………………… 94
16
27864 Avhandling_inlaga.indd 17 1/28/08 9:19:45 AM

19
Part I
Nowadays, most developmental researchers recognize that most types of behavior, including not only disorders such as schizophrenia and bipolar disorder, but also normal variation in cognitive abilities and personality depend on a complex interplay between environmental factors and multiple genes. The models and constructs used, which are necessary to understand the evidence that has led to this view in regard to personality, are presented below. Then, there is a summary of the findings from behavioral genetic research that has virtually revolutionized understanding of how people’s personalities are influenced by the environment and how personality differences develop over time. The literature attempts to answer the following four questions:
How much do genes contribute to individual differences in personality? Which types of environmental effects are of greatest importance for personality? To what extent does heritability for personality change over time? Is the stability for personality in adulthood due to genetic or environmental
effects?
1.1 Basic reasoning The question whether genetic effects for personality are important can be investigated by comparing how similar identical twin pairs are to fraternal twin pairs on scales that measure the traits considered by most researchers to be most basic for personality (Costa & McCrae, 1995). If genetic factors are important for individual differences in how people score on personality traits, then in large populations, identical twins, which have all their segregating genes in common, must be more similar than fraternal twins, who on average have 50% of their segregating genes in common. Similarly, if adopted children’s personality resembles their biological parents’ personality more than their adopted parents, this must reflect the genes they have in common with their biological parents. Other combinations of relatives where kinship varies, e.g. pairs of full siblings, half-siblings and randomly paired subjects, and the extent to which they are similar on personality measures in large populations, can also be used to find out whether genetic influences are important for personality. 1.2 Constructs used The rationale for estimates of genetic and environmental effects rests on a model that states that the phenotypic differences observed in a population are made up of genetic and environmental contributions. The total variation in a population of a complex phenotype (Vp), such as personality, is thus a function of the genetic variance (Vg) and environmental variance (Ve) that contribute to personality in the population under study:
Vp=Vg + Ve
Equation 1
18
27864 Avhandling_inlaga.indd 18 1/28/08 9:19:45 AM

19
Part I
Nowadays, most developmental researchers recognize that most types of behavior, including not only disorders such as schizophrenia and bipolar disorder, but also normal variation in cognitive abilities and personality depend on a complex interplay between environmental factors and multiple genes. The models and constructs used, which are necessary to understand the evidence that has led to this view in regard to personality, are presented below. Then, there is a summary of the findings from behavioral genetic research that has virtually revolutionized understanding of how people’s personalities are influenced by the environment and how personality differences develop over time. The literature attempts to answer the following four questions:
How much do genes contribute to individual differences in personality? Which types of environmental effects are of greatest importance for personality? To what extent does heritability for personality change over time? Is the stability for personality in adulthood due to genetic or environmental
effects?
1.1 Basic reasoning The question whether genetic effects for personality are important can be investigated by comparing how similar identical twin pairs are to fraternal twin pairs on scales that measure the traits considered by most researchers to be most basic for personality (Costa & McCrae, 1995). If genetic factors are important for individual differences in how people score on personality traits, then in large populations, identical twins, which have all their segregating genes in common, must be more similar than fraternal twins, who on average have 50% of their segregating genes in common. Similarly, if adopted children’s personality resembles their biological parents’ personality more than their adopted parents, this must reflect the genes they have in common with their biological parents. Other combinations of relatives where kinship varies, e.g. pairs of full siblings, half-siblings and randomly paired subjects, and the extent to which they are similar on personality measures in large populations, can also be used to find out whether genetic influences are important for personality. 1.2 Constructs used The rationale for estimates of genetic and environmental effects rests on a model that states that the phenotypic differences observed in a population are made up of genetic and environmental contributions. The total variation in a population of a complex phenotype (Vp), such as personality, is thus a function of the genetic variance (Vg) and environmental variance (Ve) that contribute to personality in the population under study:
Vp=Vg + Ve
Equation 1
18
27864 Avhandling_inlaga.indd 19 1/28/08 9:19:46 AM

21
environmental sources of variance. Thus, the MZ-pair correlation (rMZ) equals the average effect that genes have on the phenotype in the population (since MZ twins share 100% of their segregating genes), plus the experiences in the environment that in addition to genes have made both twins more similar on the trait under study:
rMZ = h2 + e2
Shared
Under the assumption that the “equal environment assumption” holds for twins who have grown up in the same family, which will be shown in a moment, the same is true for the DZ twins, except that the average genetic effect for DZ twins is half as big as it is for MZ twins (since DZ twins on average share 50% of their segregating genes):
rDZ = ½ h2 + e2
Shared
Thus, when the correlation for MZ (rMZ) and DZ twins (rDZ) for a trait is known, high-school algebra can be used to calculate the heritability. Consequently, the shared environment and non-shared environment can be estimated from the difference in similarity between MZ and DZ twins:
e2
Shared = 2rDZ – rMZ
e2
Non-shared = 1 – h2 – e2
Shared
However, it is also possible to estimate the heritability directly from a more simple algebraic formula proposed by Falconer (1965):
h2=2(rMZ – rDZ)
This formula means that a doubling of the difference in correlation between MZ and DZ twin’s estimates heritability in a broad sense, i.e. the proportion of phenotypic variation that can be attributed to all genetic influences in the population. 1.4 Heritability – different sources The genetic effects contributing to the total heritability estimate (h2) can come from different sources. That is, loci can add up to a specific phenotypic level in an additive, or in a non-additive fashion. Additive genetic effects relate to the average effect of an allele (or a number of alleles) in a population, and represent the extent to which genotypes “breed true” from parent to offspring. For example, if a parent has one copy of a certain allele say A1, then each offspring has a 50% chance of receiving an A1 allele. If an offspring receives an A1 allele, then its additive effect will contribute to the phenotype to the exactly the same extent as it did to the parents’ phenotype. That is, it will lead to increased parent-offspring resemblance on the phenotype, irrespective of potential interactions with other alleles at the same locus or at other loci.
Equation 9
Equation 5
Equation 6
Equation 7
Equation 8
20
This model makes it possible to create the constructs of heritability (h2) and environmentability (e2), which are estimates of how much of the total variation of a trait in a population can be attributed to genetic and environmental sources of variance. Heritability is an estimate of the proportion of the total phenotypic variance (Vp) that can be attributed to the total genetic contribution (Vg) to a trait:
h2=Vg / Vp
Environmentability is an estimate of the proportion of the total phenotypic variance (Vp) that can be attributed to the total environmental contribution (Ve) to a trait:
e2=Ve / Vp
Hence, for the same trait, h2 and e2 always add up to one. Heritability depends on the range of environments, and environmentability depends on the range of genotypes:
h2 + e2=1
It is important to note the interdependency of h2 and e2 because it influences the role of the home environment in a way that may be counterintuitive for personality (Carey, 2003). For example, if most parents in a large population provide the same home environment in terms of encouraging their children to be “honest”, which arguably is something that most parents consider to be a laudable social goal, and if other environmental factors that influence this trait are about the same for most individuals in the population, then this would increase the heritability, not increase the environmentability. The fact that the encouragements to be “honest” or “dishonest” come from the environment does not matter. What matters is the extent to which differences in the environment as a whole contribute to increase the personality differences found in the entire population under study. If the differences in parents’ ability and in other environmental factors that influence people’s “honesty level” are small, then the range of different environments in the population will be smaller, which means that the contribution to phenotypic differences form the environment as a whole will be smaller than would be the case otherwise. Thus, the magnitudes of h2 and e2 are dependent on each other. However, this does not automatically mean that genetic factors will always be found to contribute to phenotypic personality differences. If genes contribute less to how much a trait varies, then a greater proportion of the phenotypic differences (as we will see in a moment) will turn out to be environmental in origin. 1.3 Estimates of heritability (h2) and environmentability (e2) using twins When the difference in similarity between monozygotic (MZ) and dizygotic (DZ) twins on personality traits is used to estimate the proportion of variance attributed to genetic and environmental factors the rationale is the same as in equations 1-4. Just as was the case for the total amount of phenotypic differences observed in a population, the similarity between MZ and DZ twins must also, by necessity, be due to genetic and
Equation 4
Equation 2
Equation 3
27864 Avhandling_inlaga.indd 20 1/28/08 9:19:46 AM

21
environmental sources of variance. Thus, the MZ-pair correlation (rMZ) equals the average effect that genes have on the phenotype in the population (since MZ twins share 100% of their segregating genes), plus the experiences in the environment that in addition to genes have made both twins more similar on the trait under study:
rMZ = h2 + e2
Shared
Under the assumption that the “equal environment assumption” holds for twins who have grown up in the same family, which will be shown in a moment, the same is true for the DZ twins, except that the average genetic effect for DZ twins is half as big as it is for MZ twins (since DZ twins on average share 50% of their segregating genes):
rDZ = ½ h2 + e2
Shared
Thus, when the correlation for MZ (rMZ) and DZ twins (rDZ) for a trait is known, high-school algebra can be used to calculate the heritability. Consequently, the shared environment and non-shared environment can be estimated from the difference in similarity between MZ and DZ twins:
e2
Shared = 2rDZ – rMZ
e2
Non-shared = 1 – h2 – e2
Shared
However, it is also possible to estimate the heritability directly from a more simple algebraic formula proposed by Falconer (1965):
h2=2(rMZ – rDZ)
This formula means that a doubling of the difference in correlation between MZ and DZ twin’s estimates heritability in a broad sense, i.e. the proportion of phenotypic variation that can be attributed to all genetic influences in the population. 1.4 Heritability – different sources The genetic effects contributing to the total heritability estimate (h2) can come from different sources. That is, loci can add up to a specific phenotypic level in an additive, or in a non-additive fashion. Additive genetic effects relate to the average effect of an allele (or a number of alleles) in a population, and represent the extent to which genotypes “breed true” from parent to offspring. For example, if a parent has one copy of a certain allele say A1, then each offspring has a 50% chance of receiving an A1 allele. If an offspring receives an A1 allele, then its additive effect will contribute to the phenotype to the exactly the same extent as it did to the parents’ phenotype. That is, it will lead to increased parent-offspring resemblance on the phenotype, irrespective of potential interactions with other alleles at the same locus or at other loci.
Equation 9
Equation 5
Equation 6
Equation 7
Equation 8
20
This model makes it possible to create the constructs of heritability (h2) and environmentability (e2), which are estimates of how much of the total variation of a trait in a population can be attributed to genetic and environmental sources of variance. Heritability is an estimate of the proportion of the total phenotypic variance (Vp) that can be attributed to the total genetic contribution (Vg) to a trait:
h2=Vg / Vp
Environmentability is an estimate of the proportion of the total phenotypic variance (Vp) that can be attributed to the total environmental contribution (Ve) to a trait:
e2=Ve / Vp
Hence, for the same trait, h2 and e2 always add up to one. Heritability depends on the range of environments, and environmentability depends on the range of genotypes:
h2 + e2=1
It is important to note the interdependency of h2 and e2 because it influences the role of the home environment in a way that may be counterintuitive for personality (Carey, 2003). For example, if most parents in a large population provide the same home environment in terms of encouraging their children to be “honest”, which arguably is something that most parents consider to be a laudable social goal, and if other environmental factors that influence this trait are about the same for most individuals in the population, then this would increase the heritability, not increase the environmentability. The fact that the encouragements to be “honest” or “dishonest” come from the environment does not matter. What matters is the extent to which differences in the environment as a whole contribute to increase the personality differences found in the entire population under study. If the differences in parents’ ability and in other environmental factors that influence people’s “honesty level” are small, then the range of different environments in the population will be smaller, which means that the contribution to phenotypic differences form the environment as a whole will be smaller than would be the case otherwise. Thus, the magnitudes of h2 and e2 are dependent on each other. However, this does not automatically mean that genetic factors will always be found to contribute to phenotypic personality differences. If genes contribute less to how much a trait varies, then a greater proportion of the phenotypic differences (as we will see in a moment) will turn out to be environmental in origin. 1.3 Estimates of heritability (h2) and environmentability (e2) using twins When the difference in similarity between monozygotic (MZ) and dizygotic (DZ) twins on personality traits is used to estimate the proportion of variance attributed to genetic and environmental factors the rationale is the same as in equations 1-4. Just as was the case for the total amount of phenotypic differences observed in a population, the similarity between MZ and DZ twins must also, by necessity, be due to genetic and
Equation 4
Equation 2
Equation 3
27864 Avhandling_inlaga.indd 21 1/28/08 9:19:46 AM
23
variance can only be partitioned into two relatively broad categories: shared and non-shared environmental effects. Shared environmental effects are defined as “environmental factors responsible for resemblance between family members not explained by genetics” (Plomin et al., 2001b). This influence is generally assumed to come from the family environment, since this part of the environment historically has been assumed to contribute to siblings’ resemblance on personality more than is the case for other types of environmental influences, but it is important to note that the definition does not necessarily imply that influences contributing to shared environmental effects must come from the family environment. According to the definition, environmental influences outside the home can also potentially contribute to similarities between relatives. Further, since two MZ twins perfectly well can have different responses to stress factors that are shared, a divorce for example (Hetherington & Clingempeel, 1992), it is not necessarily the case that environmental influences that are shared by both siblings in a family, which in turn influence personality, end up in the shared environmental category (Torgersen & Janson, 2002). Thus, the point to keep in mind here is that shared environmental effects only relate to the chunk of the variance that relates to the proportion of family resemblance that is not explained by genetics. Non-shared environmental effects relate to all factors in the environment that make family members less similar on the trait under study. Different reactions to a divorce or different treatment from parents, and other environmental influences at large, that result in personality differences between twins are examples of such influences (Dunn & Plomin, 1990). So are random embryological events that make MZ twins resemble each other less, which potentially also can include DNA events, such as chromosomal anomalies and somatic mutations, that are not directly inherited. Since measurement errors are uncorrelated in large samples, they are also included in the non-shared environmental category. Approximately 20% of the variance in self-report personality questionnaires has been estimated to be due to measurement errors (Plomin et al., 2001b). 1.7 Twin studies focus on anonymous variance components Most twin studies focus on anonymous variance components rather than on measured genes and environments. In other words, the specific genes and environmental conditions that influence the trait under study are not known. Nevertheless, the knowledge that can be gained from twin and family studies (i.e., the relative importance of additive genetic, non-additive genetic, shared environmental and non-shared environmental effects) is of outmost importance. It has virtually revolutionized researchers’ understanding of how people’s personalities are influenced by the environment and how personality differences develop over time. 1.8 Developmental psychology and the nurture assumption The main reason why twin studies has been so crucial for developmental psychology is that the field historically has assumed that the home environment is the factor that is
22
Non-additive genetic effects do not breed true from parent to offspring and relate to interaction between alleles at a particular locus (dominance) or at different loci (epistasis) that influences the phenotype in a manner that departs from the average effect. For example, in some instances, the combined effect of the genes that offspring receive from each parent is larger (or smaller) than the additive genetic effect; this effect is referred to as the non-additive genetic effect. Thus, in its broadest sense, non-additivity implies that the effect of a particular genotype on the phenotype depends on genetic background (the unique combination of genes within an individual). In other words, it describes a situation in which the phenotype of a given genotype cannot be predicted by the sum of its single-locus effects, because the behavioral meaning of the genotype is dependent on the interaction between genes from both parents, which depart from the average effect, hence the genetic background. The proportion of the total phenotypic variance, which includes both the additive and non-additive genetic effects on a trait, is referred to as the broad definition of h2. If the genetic contribution to a trait is purely additive, then the broad-sense and narrow-sense h2 will necessarily be the same. It is generally assumed that non-additive genetic findings in twin studies indicate the possibility that traits could have been under selective pressure to increase reproductive fitness during human evolution (Lykken, 2006). 1.5 Heritability – a population dependent measure It is of crucial importance to know that a heritability estimate only applies weakly to how much genes contribute to a trait for a single individual. All that a heritability estimate of .37 for impulsiveness tells us is that, averaged over an entire population, 37% of the observed individual differences are due to genetic differences in that population. The individual level of impulsiveness for a specific person in that population could be determined almost completely by genes or almost completely by environment, and yet be totally consistent with a heritability of .37. This means that heritability estimates between samples can vary; especially if the sample size is small. Heritability estimates from large populations, however, are often very similar. Many twin studies also give upper and lower 95% confidence intervals for the heritability estimates, which indicate how much the estimates in that population can vary, and still be consistent with there being a less than 5% chance that the pattern of correlation among the relatives in that sample would be due to random rather than genetic effects. These are reasons why heritability cannot be estimated to the second digit and that estimates for personality differ some between populations. The magnitude of heritability is therefore commonly placed into categories of low (0 to .30), moderate (.30 to .60) and high (.60 to 1.0). 1.6 Environmentability – different sources Environmentability can also, just as heritability, be divided into different sources. However, since the basic model used only includes information on how similar MZ and DZ twin pairs are on a specific phenotype (i.e. the correlation between all MZ and DZ twin pairs in the sample under study), the environmental component of the
27864 Avhandling_inlaga.indd 22 1/28/08 9:19:47 AM

23
variance can only be partitioned into two relatively broad categories: shared and non-shared environmental effects. Shared environmental effects are defined as “environmental factors responsible for resemblance between family members not explained by genetics” (Plomin et al., 2001b). This influence is generally assumed to come from the family environment, since this part of the environment historically has been assumed to contribute to siblings’ resemblance on personality more than is the case for other types of environmental influences, but it is important to note that the definition does not necessarily imply that influences contributing to shared environmental effects must come from the family environment. According to the definition, environmental influences outside the home can also potentially contribute to similarities between relatives. Further, since two MZ twins perfectly well can have different responses to stress factors that are shared, a divorce for example (Hetherington & Clingempeel, 1992), it is not necessarily the case that environmental influences that are shared by both siblings in a family, which in turn influence personality, end up in the shared environmental category (Torgersen & Janson, 2002). Thus, the point to keep in mind here is that shared environmental effects only relate to the chunk of the variance that relates to the proportion of family resemblance that is not explained by genetics. Non-shared environmental effects relate to all factors in the environment that make family members less similar on the trait under study. Different reactions to a divorce or different treatment from parents, and other environmental influences at large, that result in personality differences between twins are examples of such influences (Dunn & Plomin, 1990). So are random embryological events that make MZ twins resemble each other less, which potentially also can include DNA events, such as chromosomal anomalies and somatic mutations, that are not directly inherited. Since measurement errors are uncorrelated in large samples, they are also included in the non-shared environmental category. Approximately 20% of the variance in self-report personality questionnaires has been estimated to be due to measurement errors (Plomin et al., 2001b). 1.7 Twin studies focus on anonymous variance components Most twin studies focus on anonymous variance components rather than on measured genes and environments. In other words, the specific genes and environmental conditions that influence the trait under study are not known. Nevertheless, the knowledge that can be gained from twin and family studies (i.e., the relative importance of additive genetic, non-additive genetic, shared environmental and non-shared environmental effects) is of outmost importance. It has virtually revolutionized researchers’ understanding of how people’s personalities are influenced by the environment and how personality differences develop over time. 1.8 Developmental psychology and the nurture assumption The main reason why twin studies has been so crucial for developmental psychology is that the field historically has assumed that the home environment is the factor that is
22
Non-additive genetic effects do not breed true from parent to offspring and relate to interaction between alleles at a particular locus (dominance) or at different loci (epistasis) that influences the phenotype in a manner that departs from the average effect. For example, in some instances, the combined effect of the genes that offspring receive from each parent is larger (or smaller) than the additive genetic effect; this effect is referred to as the non-additive genetic effect. Thus, in its broadest sense, non-additivity implies that the effect of a particular genotype on the phenotype depends on genetic background (the unique combination of genes within an individual). In other words, it describes a situation in which the phenotype of a given genotype cannot be predicted by the sum of its single-locus effects, because the behavioral meaning of the genotype is dependent on the interaction between genes from both parents, which depart from the average effect, hence the genetic background. The proportion of the total phenotypic variance, which includes both the additive and non-additive genetic effects on a trait, is referred to as the broad definition of h2. If the genetic contribution to a trait is purely additive, then the broad-sense and narrow-sense h2 will necessarily be the same. It is generally assumed that non-additive genetic findings in twin studies indicate the possibility that traits could have been under selective pressure to increase reproductive fitness during human evolution (Lykken, 2006). 1.5 Heritability – a population dependent measure It is of crucial importance to know that a heritability estimate only applies weakly to how much genes contribute to a trait for a single individual. All that a heritability estimate of .37 for impulsiveness tells us is that, averaged over an entire population, 37% of the observed individual differences are due to genetic differences in that population. The individual level of impulsiveness for a specific person in that population could be determined almost completely by genes or almost completely by environment, and yet be totally consistent with a heritability of .37. This means that heritability estimates between samples can vary; especially if the sample size is small. Heritability estimates from large populations, however, are often very similar. Many twin studies also give upper and lower 95% confidence intervals for the heritability estimates, which indicate how much the estimates in that population can vary, and still be consistent with there being a less than 5% chance that the pattern of correlation among the relatives in that sample would be due to random rather than genetic effects. These are reasons why heritability cannot be estimated to the second digit and that estimates for personality differ some between populations. The magnitude of heritability is therefore commonly placed into categories of low (0 to .30), moderate (.30 to .60) and high (.60 to 1.0). 1.6 Environmentability – different sources Environmentability can also, just as heritability, be divided into different sources. However, since the basic model used only includes information on how similar MZ and DZ twin pairs are on a specific phenotype (i.e. the correlation between all MZ and DZ twin pairs in the sample under study), the environmental component of the
27864 Avhandling_inlaga.indd 23 1/28/08 9:19:47 AM

25
suggests that the relative importance of genes, at least for these basic domains of personality, should in fact be closer to 50% than 40% (Loehlin, 1989). Another complication is that the results from adoption studies, which are generally recognized as the most appropriate technique for providing accurate heritability estimates (Pedersen, 1994), suggest that heritability for personality in fact is less than that generally found in twin studies (Loehlin et al., 1988). For example, the correlation between parents and their offspring, as well as the correlation between adopted siblings growing up in different homes, is typically about .15 for personality, whereas the correlation between parents and their adopted children is about .05. These findings suggest heritabilities in the order of 20% instead of the 40% for personality (Ahern, 1982; Loehlin et al., 1985; Loehlin et al., 1987; Scarr et al., 1981). Thus, one of the questions that the behavioral genetic literature has tried to resolve is why the MZ:DZ ratio for some personality traits are reported to be greater than 2, and why heritability estimates from twin studies are generally greater than estimates from adoption studies? Three explanations for these inconsistent findings have been offered.
1.9.2 Potential effects of non-additive genetic influences As mentioned earlier, “additivity” implies that the effects from the alleles that are inherited from each parent do not influence each other (dominance), and that the effects of genes placed at different locations on the chromosomes do not influence each other either (epistasis) – at least not more or less than the average effect for all genes contributing to the total genetic effect. The tendency for MZ twins to be more than twice as similar as DZ twins for Extraversion and Neuroticism may be because this assumption is not necessarily true. The reason for this is that MZ twins are identical in terms of potential non-additive genetic effects, whereas DZ twins resemble each other 25% on average. From this, it follows that if non-additive genetic effects are important for some personality traits, then the MZ:DZ ratio will be inflated and exceed 2. This higher-order interaction has, by Lykken (1982), been called “emergenesis”. Consequently, since there are no non-additive genetic effects in adoption studies, it is not surprising that, if non-additive effects are important, the heritability estimates for personality in adoption studies should be lower than those generally found in twin studies. Thus, non-additive genetic effects could account for the inconsistencies found in heritability estimates for personality in twin and adoption studies. 1.9.3 Potential effects of assortative mating Assortative mating could potentially also influence the heritability estimates in twin and adoption studies. The twin method underestimates genetic influence if assortative mating is at play, and could therefore mask potential non-additive genetic effects for personality. Assortative mating increases the genetic resemblance between DZ twins and parents and their offspring, but does not effect the MZ twin correlation, since MZ twins are already identical genetically. When spouse similarity has been investigated for different variables, it is clear that the degree of spouse similarity for age, ethnicity, alcohol consumption and certain social
24
most important for the development of personality and adjustment in general (Maccoby, 1992). Parents have been assumed to be the most influential part of the child’s environment and, to a large extent, determine how the child turns out. Indeed, the link between parents’ and children’s personality and adult adjustment is still assumed, by some developmental researchers, to be caused by environmental factors, such as differences in parental styles, even though the data referred to quite clearly indicate that genetic factors could also contribute to the shaping of people’s personality. For example, the following conclusion was drawn by Belsky and Barends in their Handbook of Parenting (2002), which was based on Elder, Caspi and Downey findings from 1996: “…Elder, Caspi and Downey (1986) were able to link personality to parenting and then to child development in a cycle that spanned several generations. They discovered, more specifically, that growing up in a home in which parents’ personalities could be described as unstable (i.e. high negative affectivity/neuroticism) and in which parental care could be depicted as controlling, hostile, and lacking in affection led to the development of unstable personalities in the children as adults” (p. 430). Thus, the idea that what shapes children’s personalities as adults is the way they were treated by their parents is very much alive among developmental researchers (Elder et al., 1986; Plomin & Daniels, 1987; Vandell, 2000). However, in order to test this assumption rather than just believe in it, and thereby assume that correlations between parenting and children’s outcomes are due to environmental factors, studies using genetically sensitive designs, such as twin, adoption, or stepfamilies, are needed (Reiss et al., 2000). As we will see, when these designs tease apart the genetic and environmental contribution to personality and other outcome variables, they produce evidence that gradually has persuaded most developmental researchers also to signify the importance of genetic effects on a wide range of behaviors, including personality (Bronfenbrenner & Ceci, 1994; Kagan et al., 1994; Kerr & Stattin, 2003; Magnusson, 1990; Rutter et al., 1997). Four literatures, which challenge “the nature assumption” by asking four different questions, are summarized below. 1.9.1 How much do genes contribute to personality? Loehlin and Nichols (1976) performed a landmark twin study thirty years ago that reached two major conclusions. The first of these holds that nearly all personality traits are moderately inherited; that is, on average across diverse personality dimensions, the MZ correlations are about .50, and the DZ correlations are about .30. Doubling the difference between the correlations, according to the Falconer formula in Equation 9 on page 21 shows that the proportion of phenotypic variance explained by genetic variance (h2) is 40%. However, large twin studies performed more recently indicate that this simple way of calculating heritability may not hold. According to the Falconer formula, the MZ:DZ ratio should not be larger than 2. Nevertheless, the MZ:DZ ratio substantially exceeds 2 for some personality traits, most notably Extraversion and Neuroticism, which
27864 Avhandling_inlaga.indd 24 1/28/08 9:19:47 AM

25
suggests that the relative importance of genes, at least for these basic domains of personality, should in fact be closer to 50% than 40% (Loehlin, 1989). Another complication is that the results from adoption studies, which are generally recognized as the most appropriate technique for providing accurate heritability estimates (Pedersen, 1994), suggest that heritability for personality in fact is less than that generally found in twin studies (Loehlin et al., 1988). For example, the correlation between parents and their offspring, as well as the correlation between adopted siblings growing up in different homes, is typically about .15 for personality, whereas the correlation between parents and their adopted children is about .05. These findings suggest heritabilities in the order of 20% instead of the 40% for personality (Ahern, 1982; Loehlin et al., 1985; Loehlin et al., 1987; Scarr et al., 1981). Thus, one of the questions that the behavioral genetic literature has tried to resolve is why the MZ:DZ ratio for some personality traits are reported to be greater than 2, and why heritability estimates from twin studies are generally greater than estimates from adoption studies? Three explanations for these inconsistent findings have been offered.
1.9.2 Potential effects of non-additive genetic influences As mentioned earlier, “additivity” implies that the effects from the alleles that are inherited from each parent do not influence each other (dominance), and that the effects of genes placed at different locations on the chromosomes do not influence each other either (epistasis) – at least not more or less than the average effect for all genes contributing to the total genetic effect. The tendency for MZ twins to be more than twice as similar as DZ twins for Extraversion and Neuroticism may be because this assumption is not necessarily true. The reason for this is that MZ twins are identical in terms of potential non-additive genetic effects, whereas DZ twins resemble each other 25% on average. From this, it follows that if non-additive genetic effects are important for some personality traits, then the MZ:DZ ratio will be inflated and exceed 2. This higher-order interaction has, by Lykken (1982), been called “emergenesis”. Consequently, since there are no non-additive genetic effects in adoption studies, it is not surprising that, if non-additive effects are important, the heritability estimates for personality in adoption studies should be lower than those generally found in twin studies. Thus, non-additive genetic effects could account for the inconsistencies found in heritability estimates for personality in twin and adoption studies. 1.9.3 Potential effects of assortative mating Assortative mating could potentially also influence the heritability estimates in twin and adoption studies. The twin method underestimates genetic influence if assortative mating is at play, and could therefore mask potential non-additive genetic effects for personality. Assortative mating increases the genetic resemblance between DZ twins and parents and their offspring, but does not effect the MZ twin correlation, since MZ twins are already identical genetically. When spouse similarity has been investigated for different variables, it is clear that the degree of spouse similarity for age, ethnicity, alcohol consumption and certain social
24
most important for the development of personality and adjustment in general (Maccoby, 1992). Parents have been assumed to be the most influential part of the child’s environment and, to a large extent, determine how the child turns out. Indeed, the link between parents’ and children’s personality and adult adjustment is still assumed, by some developmental researchers, to be caused by environmental factors, such as differences in parental styles, even though the data referred to quite clearly indicate that genetic factors could also contribute to the shaping of people’s personality. For example, the following conclusion was drawn by Belsky and Barends in their Handbook of Parenting (2002), which was based on Elder, Caspi and Downey findings from 1996: “…Elder, Caspi and Downey (1986) were able to link personality to parenting and then to child development in a cycle that spanned several generations. They discovered, more specifically, that growing up in a home in which parents’ personalities could be described as unstable (i.e. high negative affectivity/neuroticism) and in which parental care could be depicted as controlling, hostile, and lacking in affection led to the development of unstable personalities in the children as adults” (p. 430). Thus, the idea that what shapes children’s personalities as adults is the way they were treated by their parents is very much alive among developmental researchers (Elder et al., 1986; Plomin & Daniels, 1987; Vandell, 2000). However, in order to test this assumption rather than just believe in it, and thereby assume that correlations between parenting and children’s outcomes are due to environmental factors, studies using genetically sensitive designs, such as twin, adoption, or stepfamilies, are needed (Reiss et al., 2000). As we will see, when these designs tease apart the genetic and environmental contribution to personality and other outcome variables, they produce evidence that gradually has persuaded most developmental researchers also to signify the importance of genetic effects on a wide range of behaviors, including personality (Bronfenbrenner & Ceci, 1994; Kagan et al., 1994; Kerr & Stattin, 2003; Magnusson, 1990; Rutter et al., 1997). Four literatures, which challenge “the nature assumption” by asking four different questions, are summarized below. 1.9.1 How much do genes contribute to personality? Loehlin and Nichols (1976) performed a landmark twin study thirty years ago that reached two major conclusions. The first of these holds that nearly all personality traits are moderately inherited; that is, on average across diverse personality dimensions, the MZ correlations are about .50, and the DZ correlations are about .30. Doubling the difference between the correlations, according to the Falconer formula in Equation 9 on page 21 shows that the proportion of phenotypic variance explained by genetic variance (h2) is 40%. However, large twin studies performed more recently indicate that this simple way of calculating heritability may not hold. According to the Falconer formula, the MZ:DZ ratio should not be larger than 2. Nevertheless, the MZ:DZ ratio substantially exceeds 2 for some personality traits, most notably Extraversion and Neuroticism, which
27864 Avhandling_inlaga.indd 25 1/28/08 9:19:48 AM

27
common that parents were mistaken about their twin’s zygosity. Consequently, some parents raised their MZ twins believing them to be DZ twins, and vice-versa. Nevertheless, misclassified MZ twins have been found to be just as similar as correctly classified MZ twins on measures of parental treatment, drug dependence, major depression, post-traumatic stress, self-esteem, as well as a variety of basic personality traits (Kendler et al., 1994; Scarr, 1968; Scarr & Carter Saltzman, 1979; Xian et al., 2000). Furthermore, MZ twins treated as a unit were no more similar in their adolescence and on behaviors in adulthood than those who were deliberately individualized (Loehlin & Nichols, 1976). In addition, more similar parental treatment and more similar interests, behaviors, as well as “twin closeness” (for another view please see, Rose and Kaprio, 1987)(Rose & Kaprio, 1988), do not appear to matter for how similarly MZ twins score on Neuroticism, Depression and Anxiety (Morris-Yates et al., 1990 64; Tambs et al., 1995). Thus, despite considerable effort to pinpoint specific environmental effects that potentially could inflate the MZ correlation for personality in twin studies, and thereby explain why the MZ:DZ ratio tends to gravitate to around 2 for most personality traits, as well as to exceed 2 for others, no single measure of the social environment has consistently been found to have the power to do so (Plomin & Daniels, 1987). Thus, the most likely explanation, considering these findings, is that non-additive genetic effects account for most of the difference in heritability estimates found in twin and adoption studies (Plomin et al., 1990). 1.9.5 Potential effects of many environmental influences each with a small
effect Despite the findings described above, environment-oriented researchers have remained skeptical of the idea that social factors do not inflate the MZ twin correlation for personality to any great extent (Mischel, 1981). They have argued that, even though it appears unlikely that any single environmental factor will have the power to increase the personality resemblance between MZ twins, it is still possible that many environmental factors in concert, each with a small effect, will have the power to do so. Indeed, Michel (1981) has confronted this issue directly by arguing: “Genes and glands are obviously important, but social learning also has a dramatic role. Imagine the enormous differences that would be found in the personalities of twins with identical genetic endowments if they were raised apart in two different families” (p. 311). However, when the correlations between MZ and DZ twins raised together and apart are compared, it is obvious that the correlations do not change much, as can be seen in Table 1, which summarizes the results for Extraversion and Neuroticism in four different studies. Thus, not even when the joint effect of all the environmental influences that typically come into play in different household are taken into consideration, the MZ correlation for Extraversion and Neuroticism is inflated. This means that there is in fact little evidence for the idea that social factors have the power to inflate the MZ twin
26
attitudes – such as sexual permissiveness, militarism, conservatism and views on religious fundamentalism – has tended to be high (r = .83 – .41), while spouse correlations for behavioral and physical traits have tended to be in the low to moderate range (Eaves et al., 1999; Price & Vandenberg, 1980). For example, cognitive abilities, general intelligence and physical attractiveness fall into this lower range (r = .07 – .30) (Johnson & et al., 1976; Price & Vandenberg, 1979). However, assortative mating for personality tends to be lower (r = .02 – .19) and is generally considered to be too low to inflate the DZ twin correlation for most personality traits (Eaves et al., 1999; Plomin et al., 1998). Assortative mating is thereby not generally expected to influence the heritability for personality estimated in twin and adoption studies. Nevertheless, there are data available that suggest the opposite. Spouse similarity for personality has been found to range from r = -.41 to +.80 (mean r = .32), which indicates that the potential effect of assortative mating on heritability estimates for personality may vary between samples (Caspi & Herbener, 1990) 1.9.4 Potential effects of a violation of the equal environment assumption As mentioned earlier, a central assumption in the twin method is that environmental factors do not make MZ twins more similar than they make DZ twins similar. Indeed, if this assumption is violated, environmental factors instead of genetic factors could be responsible for why the MZ:DZ ratio gravitates to around 2 for most personality traits, but exceeds 2 for others. However, to violate the equal environment assumption, two phenomena must both occur: (a) the environment must treat MZ twins more similarly than it does DZ twins, and (b) similarity in treatment must make a difference in the phenotype under study (Carey, 2003). When the first criterion (a) has been investigated, it is clear that MZ twins have more shared experiences during development than DZ twins. MZ twins are more often confused for each other by parents, teachers, friends and strangers, and since the similarity of appearance of MZ twins are so striking, they are more likely to be treated more alike by significant others (Cederlof et al., 1961; Cohen et al., 1973; Nichols & Bilbro, 1966). Parents also hold more similar expectations for their MZ than DZ twins in regard to social responsibility and independence (Scarr, 1968), and MZ twins themselves report that they are more similar in many aspects of their life style. They more often share the same friends, spend more time together and make more similar choices in dress, foods, sports, and study habits, etc. (Jones, 1955; Rose & Kaprio, 1987; Scarr, 1968; Smith, 1965). Some environment-oriented researchers believe that this automatically means that the second criterion (b) for violating the twin method is also met, and they argue that violation of the first criterion by necessity must violate the twin method altogether (Joseph, 2002; Pam et al., 1996). However, when the second criterion has been carefully examined, it is clear that more similar treatment from the social environment generally is not sufficient to increase the correlation between the MZ twin pairs in a population, and thereby in turn, not sufficient to change the twin heritability estimates received for different personality phenotypes. For example, in the past it was quite
27864 Avhandling_inlaga.indd 26 1/28/08 9:19:48 AM

27
common that parents were mistaken about their twin’s zygosity. Consequently, some parents raised their MZ twins believing them to be DZ twins, and vice-versa. Nevertheless, misclassified MZ twins have been found to be just as similar as correctly classified MZ twins on measures of parental treatment, drug dependence, major depression, post-traumatic stress, self-esteem, as well as a variety of basic personality traits (Kendler et al., 1994; Scarr, 1968; Scarr & Carter Saltzman, 1979; Xian et al., 2000). Furthermore, MZ twins treated as a unit were no more similar in their adolescence and on behaviors in adulthood than those who were deliberately individualized (Loehlin & Nichols, 1976). In addition, more similar parental treatment and more similar interests, behaviors, as well as “twin closeness” (for another view please see, Rose and Kaprio, 1987)(Rose & Kaprio, 1988), do not appear to matter for how similarly MZ twins score on Neuroticism, Depression and Anxiety (Morris-Yates et al., 1990 64; Tambs et al., 1995). Thus, despite considerable effort to pinpoint specific environmental effects that potentially could inflate the MZ correlation for personality in twin studies, and thereby explain why the MZ:DZ ratio tends to gravitate to around 2 for most personality traits, as well as to exceed 2 for others, no single measure of the social environment has consistently been found to have the power to do so (Plomin & Daniels, 1987). Thus, the most likely explanation, considering these findings, is that non-additive genetic effects account for most of the difference in heritability estimates found in twin and adoption studies (Plomin et al., 1990). 1.9.5 Potential effects of many environmental influences each with a small
effect Despite the findings described above, environment-oriented researchers have remained skeptical of the idea that social factors do not inflate the MZ twin correlation for personality to any great extent (Mischel, 1981). They have argued that, even though it appears unlikely that any single environmental factor will have the power to increase the personality resemblance between MZ twins, it is still possible that many environmental factors in concert, each with a small effect, will have the power to do so. Indeed, Michel (1981) has confronted this issue directly by arguing: “Genes and glands are obviously important, but social learning also has a dramatic role. Imagine the enormous differences that would be found in the personalities of twins with identical genetic endowments if they were raised apart in two different families” (p. 311). However, when the correlations between MZ and DZ twins raised together and apart are compared, it is obvious that the correlations do not change much, as can be seen in Table 1, which summarizes the results for Extraversion and Neuroticism in four different studies. Thus, not even when the joint effect of all the environmental influences that typically come into play in different household are taken into consideration, the MZ correlation for Extraversion and Neuroticism is inflated. This means that there is in fact little evidence for the idea that social factors have the power to inflate the MZ twin
26
attitudes – such as sexual permissiveness, militarism, conservatism and views on religious fundamentalism – has tended to be high (r = .83 – .41), while spouse correlations for behavioral and physical traits have tended to be in the low to moderate range (Eaves et al., 1999; Price & Vandenberg, 1980). For example, cognitive abilities, general intelligence and physical attractiveness fall into this lower range (r = .07 – .30) (Johnson & et al., 1976; Price & Vandenberg, 1979). However, assortative mating for personality tends to be lower (r = .02 – .19) and is generally considered to be too low to inflate the DZ twin correlation for most personality traits (Eaves et al., 1999; Plomin et al., 1998). Assortative mating is thereby not generally expected to influence the heritability for personality estimated in twin and adoption studies. Nevertheless, there are data available that suggest the opposite. Spouse similarity for personality has been found to range from r = -.41 to +.80 (mean r = .32), which indicates that the potential effect of assortative mating on heritability estimates for personality may vary between samples (Caspi & Herbener, 1990) 1.9.4 Potential effects of a violation of the equal environment assumption As mentioned earlier, a central assumption in the twin method is that environmental factors do not make MZ twins more similar than they make DZ twins similar. Indeed, if this assumption is violated, environmental factors instead of genetic factors could be responsible for why the MZ:DZ ratio gravitates to around 2 for most personality traits, but exceeds 2 for others. However, to violate the equal environment assumption, two phenomena must both occur: (a) the environment must treat MZ twins more similarly than it does DZ twins, and (b) similarity in treatment must make a difference in the phenotype under study (Carey, 2003). When the first criterion (a) has been investigated, it is clear that MZ twins have more shared experiences during development than DZ twins. MZ twins are more often confused for each other by parents, teachers, friends and strangers, and since the similarity of appearance of MZ twins are so striking, they are more likely to be treated more alike by significant others (Cederlof et al., 1961; Cohen et al., 1973; Nichols & Bilbro, 1966). Parents also hold more similar expectations for their MZ than DZ twins in regard to social responsibility and independence (Scarr, 1968), and MZ twins themselves report that they are more similar in many aspects of their life style. They more often share the same friends, spend more time together and make more similar choices in dress, foods, sports, and study habits, etc. (Jones, 1955; Rose & Kaprio, 1987; Scarr, 1968; Smith, 1965). Some environment-oriented researchers believe that this automatically means that the second criterion (b) for violating the twin method is also met, and they argue that violation of the first criterion by necessity must violate the twin method altogether (Joseph, 2002; Pam et al., 1996). However, when the second criterion has been carefully examined, it is clear that more similar treatment from the social environment generally is not sufficient to increase the correlation between the MZ twin pairs in a population, and thereby in turn, not sufficient to change the twin heritability estimates received for different personality phenotypes. For example, in the past it was quite
27864 Avhandling_inlaga.indd 27 1/28/08 9:19:48 AM

29
1.10 Which type of environmental influence is of greatest importance for personality?
As mentioned earlier, one of the most central ideas in the field of developmental psychology is “the nature assumption”, which holds that the home environment is the most important factor for the development of personality and adjustment in general (Harris, 2000). Theories about how the environment works in development has, from Freud and onwards, implicitly assumed that siblings resemble each other in personality, because they share the same family environment (Bronfenbrenner & Ceci, 1994). However, there is very little evidence for the idea that the same home environment influences people’s personality in approximately the same way. This was also recognized in the twin study performed by Loehlin and Nichols (1976) thirty years ago. The twin method’s ability to distinguish between shared and non-shared environmental effects revealed that most of the environmental factors that influence personality make members of the same family different, not similar. Thus, Loehlin and Nichols concluded that when resemblance due to genetic effects was accounted for, there was little evidence for large shared familial environmental effects. This conclusion has subsequently been replicated in hundreds of twin studies (Plomin et al., 2001a; Plomin & Daniels, 1987). This means that non-shared environmental effects – i.e. the experiences that are unique to the individual and that contribute to differences among relatives – are typically more than twice as important as shared environmental effects … at least in the personality domain, which is exactly the opposite of what would be expected if the ideas advocated by the “the nature assumption” were correct. Figure 1 on page 30 presents the highest and lowest heritabilities as well as the distribution between shared and non-shared environmental effects typically found for the most basic personality traits. However, is crucial that the lack of shared environmental effects found for most personality traits is interpreted correctly. The lack of shared environmental effects does not imply that childhood environments, or family experiences that are shared by siblings, are unimportant for mean levels in personality later in life. Childhood environments, and shared family experiences in childhood, may be very important; it is just that the net effect of those influences is to create personality differences, not personality similarities, among family members (Pedersen, 1994). This interpretation of the twin study literature has however, not often and persistently enough been articulated. Typically, when environmentally oriented researchers read the behavioral genetic literature, they arrive at the conclusion that just because there is no evidence for large shared environmental effects (on variance) in personality or psychopathology, that shared experiences per se – such as divorce, family conflict and other family risk factors – play negligible roles for people’s personality development. There are textbook statements such as (Plomin et al., 2001b): “This remarkable finding [that shared family environment does not cause family members to resemble each other] means that environmental influences that effect
28
correlation for personality. Instead, the most likely explanation for why the MZ:DZ ratio gravitates to around 2 for most personality traits, and why for some others it exceeds 2, seems to be genetic in origin. Table 1 Studies of Extraversion and Neuroticism in Twins Raised Together and Twin Raised Apart
Extraversion Neuroticism
MZ DZ MZ DZ
Study Together Apart Together Apart Together Apart Together Apart
1 .33 .38 .13 .12 .32 .25 .10 .11
2 .54 .30 .06 .04 .41 .25 .24 .28
3 .63 .34 .18 .07 .54 .61 .41 .29
4 .42 .61 .38 .53
Mean: .48 .41 .37 .23 .41 .41 .25 .23
This table is adapted from Loehlin (1992).
Thus, these findings also supports the notion that non-additive genetic influences are most likely responsible for most of the difference in heritability estimates found for personality in twin and adoption studies (Plomin et al., 1998). This means that the first conclusion drawn by Loehlin and Nichols thirty years ago still holds: Most personality traits are moderately inherited. Approximately 40% of the personality differences that are typically found in a population are due to genetic effects. However, since there are no non-additive genetic effects in adoption studies, and heritability estimates from such studies typically are about 20% instead of 40%, it is likely that as much as half of the genetic variation for personality may be non-additive by nature (Plomin et al., 1998). This has also been demonstrated in twin studies that include data from twin siblings which – in contrast to studies which only include data from MZ and DZ twins – have sufficient power to differentiate between additive and non-additive genetic effects (Posthuma & Boomsma, 2000; Price et al., 1982). Three large studies using extended twin-family designs have investigated the genetic and environmental structure of Eysenck’s personality dimensions (Eaves et al., 1999; Eaves et al., 1998; Lake et al., 2000), and unlike studies which use the classical twin design, non-additive genetic effects were found to be detectable and pervasive. The fact that these results have recently been replicated by Keller (2005) in a large study of Australian twins (n = 9672) and twin siblings (n = 3241), which extended these findings to also include the traits in the Temperament and Character Inventory, suggest that non-additive genetic effects are of importance for personality. Indeed, Keller’s results show that the broad-sense heritability estimates for Harm Avoidance, Novelty Seeking, Reward Dependence, Persistence, Extraversion and Neuroticism were two to three times greater than the narrow-sense heritability estimates. These results are of importance for studies that attempt to identify the genes that contribute to personality differences. As will be explained in part III, if many of the genes that underlie personality have non-additive effects, it will be harder to detect genes for personality (Frankel & Schork, 1996; Plomin et al., 1998; Purcell & Sham, 2004).
27864 Avhandling_inlaga.indd 28 1/28/08 9:19:49 AM

29
1.10 Which type of environmental influence is of greatest importance for personality?
As mentioned earlier, one of the most central ideas in the field of developmental psychology is “the nature assumption”, which holds that the home environment is the most important factor for the development of personality and adjustment in general (Harris, 2000). Theories about how the environment works in development has, from Freud and onwards, implicitly assumed that siblings resemble each other in personality, because they share the same family environment (Bronfenbrenner & Ceci, 1994). However, there is very little evidence for the idea that the same home environment influences people’s personality in approximately the same way. This was also recognized in the twin study performed by Loehlin and Nichols (1976) thirty years ago. The twin method’s ability to distinguish between shared and non-shared environmental effects revealed that most of the environmental factors that influence personality make members of the same family different, not similar. Thus, Loehlin and Nichols concluded that when resemblance due to genetic effects was accounted for, there was little evidence for large shared familial environmental effects. This conclusion has subsequently been replicated in hundreds of twin studies (Plomin et al., 2001a; Plomin & Daniels, 1987). This means that non-shared environmental effects – i.e. the experiences that are unique to the individual and that contribute to differences among relatives – are typically more than twice as important as shared environmental effects … at least in the personality domain, which is exactly the opposite of what would be expected if the ideas advocated by the “the nature assumption” were correct. Figure 1 on page 30 presents the highest and lowest heritabilities as well as the distribution between shared and non-shared environmental effects typically found for the most basic personality traits. However, is crucial that the lack of shared environmental effects found for most personality traits is interpreted correctly. The lack of shared environmental effects does not imply that childhood environments, or family experiences that are shared by siblings, are unimportant for mean levels in personality later in life. Childhood environments, and shared family experiences in childhood, may be very important; it is just that the net effect of those influences is to create personality differences, not personality similarities, among family members (Pedersen, 1994). This interpretation of the twin study literature has however, not often and persistently enough been articulated. Typically, when environmentally oriented researchers read the behavioral genetic literature, they arrive at the conclusion that just because there is no evidence for large shared environmental effects (on variance) in personality or psychopathology, that shared experiences per se – such as divorce, family conflict and other family risk factors – play negligible roles for people’s personality development. There are textbook statements such as (Plomin et al., 2001b): “This remarkable finding [that shared family environment does not cause family members to resemble each other] means that environmental influences that effect
28
correlation for personality. Instead, the most likely explanation for why the MZ:DZ ratio gravitates to around 2 for most personality traits, and why for some others it exceeds 2, seems to be genetic in origin. Table 1 Studies of Extraversion and Neuroticism in Twins Raised Together and Twin Raised Apart
Extraversion Neuroticism
MZ DZ MZ DZ
Study Together Apart Together Apart Together Apart Together Apart
1 .33 .38 .13 .12 .32 .25 .10 .11
2 .54 .30 .06 .04 .41 .25 .24 .28
3 .63 .34 .18 .07 .54 .61 .41 .29
4 .42 .61 .38 .53
Mean: .48 .41 .37 .23 .41 .41 .25 .23
This table is adapted from Loehlin (1992).
Thus, these findings also supports the notion that non-additive genetic influences are most likely responsible for most of the difference in heritability estimates found for personality in twin and adoption studies (Plomin et al., 1998). This means that the first conclusion drawn by Loehlin and Nichols thirty years ago still holds: Most personality traits are moderately inherited. Approximately 40% of the personality differences that are typically found in a population are due to genetic effects. However, since there are no non-additive genetic effects in adoption studies, and heritability estimates from such studies typically are about 20% instead of 40%, it is likely that as much as half of the genetic variation for personality may be non-additive by nature (Plomin et al., 1998). This has also been demonstrated in twin studies that include data from twin siblings which – in contrast to studies which only include data from MZ and DZ twins – have sufficient power to differentiate between additive and non-additive genetic effects (Posthuma & Boomsma, 2000; Price et al., 1982). Three large studies using extended twin-family designs have investigated the genetic and environmental structure of Eysenck’s personality dimensions (Eaves et al., 1999; Eaves et al., 1998; Lake et al., 2000), and unlike studies which use the classical twin design, non-additive genetic effects were found to be detectable and pervasive. The fact that these results have recently been replicated by Keller (2005) in a large study of Australian twins (n = 9672) and twin siblings (n = 3241), which extended these findings to also include the traits in the Temperament and Character Inventory, suggest that non-additive genetic effects are of importance for personality. Indeed, Keller’s results show that the broad-sense heritability estimates for Harm Avoidance, Novelty Seeking, Reward Dependence, Persistence, Extraversion and Neuroticism were two to three times greater than the narrow-sense heritability estimates. These results are of importance for studies that attempt to identify the genes that contribute to personality differences. As will be explained in part III, if many of the genes that underlie personality have non-additive effects, it will be harder to detect genes for personality (Frankel & Schork, 1996; Plomin et al., 1998; Purcell & Sham, 2004).
27864 Avhandling_inlaga.indd 29 1/28/08 9:19:49 AM

31
Daniels, 1987; Rowe, 1994; Scarr, 1992) – which is a question the data generally referred to cannot evaluate. This mistake springs from two unfortunate habits. First, the habit of thinking and talking about shared and non-shared environmental effects as if these constructs denote similar or different actual events or experiences inside or outside the home, and secondly, that shared and non-shared environmental effects indicates which type of environment that is most important in causing mean differences in outcome variables. However, what these concepts really do is to differentiate between to which extent environmental influences make people different or similar on different outcome variables – i.e. they refer to variance differences (not mean differences), when the similarities due to genetic influences have already been taken into account. Thus, it is not correct to rule out family experiences that are shared by siblings as potential contributors to personality differences, just because shared environmental effects are absent, as in the following example: “This analysis [suggesting no shared environmental effects] tells us that the major environmental influences on adolescents’ proneness to anxiety must be different for sibs in the same family. This rules out a number of influences, such as the family social class or the level of parents’ anxiety, all of which are shared by siblings in the same family” (Reiss et al., 2000); p. 68). The fact that it is a mistake to rule out family experiences in this way has recently been demonstrated in a study that investigated the extent to which shared family stress factors, in the age interval 6 to 15 years, were associated with adult personality at age 29 (Torgersen & Janson, 2002). Thirteen objectively shared family stress factors in the home were coded: nervous problems in parent; nervous problems in sibling (other than twin); family conflict; divorce or separation of parents; only one caregiver; new stepmother or stepfather; new siblings; illness of siblings (other than twins); illness of parents; loss of close person; multiple moves; change of school and other stressors. Personality data, as measured by the Five Factor model were collected. As can be seen in Table 2 on page 33, the correlation between how much twin A and B in each twin pair differed in their personality profile at age 29 was positively correlated with the number of shared family stress factors each pair experienced in their home between ages 6 and 15 (r = .49; p < .01). The fact that all participants in this study were MZ twins suggests that shared family experiences per se, regardless of potential genetic mediation, have the power to influence personality. Thus, in summarizing the findings for personality with regard to additive and non-additive genetic, shared and non-shared environmental effects, the following conclusion can be drawn. For self-report personality questionnaires, genetics typically account for about 40% of the variance, and at least half of it is probably non-additive by nature. Shared environment effects accounts for 0% for most personality traits, and non-
30
development operate to make children growing up in the same family no more similar than children growing up in different families” (p. 298).
Figure 1
…which has mistakenly been interpreted as if the family environment per se is unimportant – i.e. that whether a person grows up in a family with few or many risk factors, does not matter for how their personality develops (Harris, 1998; Plomin &
Lower Order Traits
Basic Domains of Personality
The Temperament
& Character Inventory
“The Five Factor
Model”
0% 20% 40% 60% 80% 100%
Neuroticism
Extraversion
Openness to Experience
Agreeableness
Conscientiousness
Novelty Seeking
Harm Avoidance
Reward Dependence
Persistence
Self-Directedness
Cooperativeness
Self-Transcendence
Social Closeness
Alienation
Positive Emotionality
Hostility
Lack of Assertiveness
Luck in Locus of Control
Source: Data for basic domains of personality are from Jang et al. 1998 and Gillespie et al. 2003. Data for lower order traits are from Tellgren et al. 1988 and Pedersen (2002; 1994).
The Five Factor
Model
Genetic Non-shared Shared
27864 Avhandling_inlaga.indd 30 1/28/08 9:19:49 AM

31
Daniels, 1987; Rowe, 1994; Scarr, 1992) – which is a question the data generally referred to cannot evaluate. This mistake springs from two unfortunate habits. First, the habit of thinking and talking about shared and non-shared environmental effects as if these constructs denote similar or different actual events or experiences inside or outside the home, and secondly, that shared and non-shared environmental effects indicates which type of environment that is most important in causing mean differences in outcome variables. However, what these concepts really do is to differentiate between to which extent environmental influences make people different or similar on different outcome variables – i.e. they refer to variance differences (not mean differences), when the similarities due to genetic influences have already been taken into account. Thus, it is not correct to rule out family experiences that are shared by siblings as potential contributors to personality differences, just because shared environmental effects are absent, as in the following example: “This analysis [suggesting no shared environmental effects] tells us that the major environmental influences on adolescents’ proneness to anxiety must be different for sibs in the same family. This rules out a number of influences, such as the family social class or the level of parents’ anxiety, all of which are shared by siblings in the same family” (Reiss et al., 2000); p. 68). The fact that it is a mistake to rule out family experiences in this way has recently been demonstrated in a study that investigated the extent to which shared family stress factors, in the age interval 6 to 15 years, were associated with adult personality at age 29 (Torgersen & Janson, 2002). Thirteen objectively shared family stress factors in the home were coded: nervous problems in parent; nervous problems in sibling (other than twin); family conflict; divorce or separation of parents; only one caregiver; new stepmother or stepfather; new siblings; illness of siblings (other than twins); illness of parents; loss of close person; multiple moves; change of school and other stressors. Personality data, as measured by the Five Factor model were collected. As can be seen in Table 2 on page 33, the correlation between how much twin A and B in each twin pair differed in their personality profile at age 29 was positively correlated with the number of shared family stress factors each pair experienced in their home between ages 6 and 15 (r = .49; p < .01). The fact that all participants in this study were MZ twins suggests that shared family experiences per se, regardless of potential genetic mediation, have the power to influence personality. Thus, in summarizing the findings for personality with regard to additive and non-additive genetic, shared and non-shared environmental effects, the following conclusion can be drawn. For self-report personality questionnaires, genetics typically account for about 40% of the variance, and at least half of it is probably non-additive by nature. Shared environment effects accounts for 0% for most personality traits, and non-
30
development operate to make children growing up in the same family no more similar than children growing up in different families” (p. 298).
Figure 1
…which has mistakenly been interpreted as if the family environment per se is unimportant – i.e. that whether a person grows up in a family with few or many risk factors, does not matter for how their personality develops (Harris, 1998; Plomin &
Lower Order Traits
Basic Domains of Personality
The Temperament
& Character Inventory
“The Five Factor
Model”
0% 20% 40% 60% 80% 100%
Neuroticism
Extraversion
Openness to Experience
Agreeableness
Conscientiousness
Novelty Seeking
Harm Avoidance
Reward Dependence
Persistence
Self-Directedness
Cooperativeness
Self-Transcendence
Social Closeness
Alienation
Positive Emotionality
Hostility
Lack of Assertiveness
Luck in Locus of Control
Source: Data for basic domains of personality are from Jang et al. 1998 and Gillespie et al. 2003. Data for lower order traits are from Tellgren et al. 1988 and Pedersen (2002; 1994).
The Five Factor
Model
Genetic Non-shared Shared
27864 Avhandling_inlaga.indd 31 1/28/08 9:19:50 AM

33
Reynolds, 1998). Some evidence, however suggest that when the heritability for personality throughout adulthood does change, it tends to increase, even though the magnitude of the change is relatively small (Eaves & Eysenck, 1976; Plomin & Nesselroade, 1990). Table 2 Correlation Between Life stressors at Age 6 to 15, and MZ Twin Within-Pair Differences in Self-Reported Big Five Personality Factors at Age 29 (n = 52)
Intrapair difference score, NEO-PI-R dimension Correlation with life stressors
Neuroticism .16
Extraversion -.04
Openness .37*
Agreeableness .53**
Conscientiousness .37*
5-factor profile .49**
This table is adapted from Torgersen (2002).
However, longitudinal studies suggest that people do tend to have more diverse environmental experiences during the lifespan (Pedersen & Reynolds, 1998; Viken et al., 1994). After age 30, there were no time-specific genetic influences found, whereas new non-shared environmental effects were present at each age and time point after age 30. In other words, almost all the genetic influences before age 30 were acting at subsequent time points after age 30, whereas environmental influences were in themselves less stable, and new environmental influences came into play across time. As a result, the relative importance of genetic influences decreases about 10% after age 30 at some time points (Pedersen & Reynolds, 2002; Viken et al., 1994).
1.12 Is the stability of personality in adulthood due to genetic or environmental effects?
Another related question is why people’s personality, once they have passed early adulthood, tends to be so remarkably stable over time. Indeed, adults about age 30 and older do not generally change much in their personality, in the sense that the phenotypic correlations between time points, varying from 5 to 10 years, is often .60 or higher for self-reported personality (McCrae & Costa, 2003). Stability from the late teens to early adulthood may be somewhat lower (McGue et al., 1993), but for most adult people about 60% of their personality scores maintain their position relative to other people’s personality scores over time. Consequently, one of the main questions in the personality field has been to investigate if it is our unique interpretations and experiences of the environment – i.e. what the social environment has “taught” us – that tends to stick with us throughout life, which is what is presumed in the “nature assumption”, or if the major source of stability for personality is genetic in origin? To answer this question, and determine whether genetic or environmental influences are the major source of longitudinal phenotypic stability, both heritabilities and environmentalbilities and the transfer of these influences from one time point to
32
shared environment for 60% of the variance. Since about 20% of the variance in self-report measures is due to error of measurement, non-shared environmental influences appear to be about as important as genetic influences in the personality domain. Thus, the net effect of the environment at large is to create personality differences, not personality similarities, as historically has been assumed by environmentally oriented researchers (Harris, 2000; Maccoby, 1992; Plomin et al., 2001a; Plomin & Daniels, 1987). In other words, the personality differences that exist between people are mainly due to each person’s unique genetic propensities as well as each person’s unique experiences of the environment – in, as well as outside, the home. 1.11.1 To what extent does heritability for personality change over time? Another important question is the extent to which heritability for personality changes over time. According to the “nature assumption” it would be logical if environmental factors at the expense of genetic factors increased during development. As children move out of their parents’ home they experience more and more diverse environmental influences; they meet new friends, start new occupations, get married and have children, and about 40% of them later divorce (Buss & Larsen, 2005). Furthermore, just because the heritability for personality in adolescence and early adulthood is substantial, this does not mean that heritability for personality throughout the lifespan must be the same. Genes are “turned on” and “turned off” at different time points during development, at puberty and menopause, for example. Changes in the environment can also influence the extent genes are expressed, and people’s readiness to be influenced by environmental factors differs at different developmental stages (Cook-Greuter, 2000). Thus, because people tend to experience more and more diverse environmental influences throughout the lifespan, whereas the effect of genes may not change as much, many environmental oriented researchers tend to assume that the relative importance of genetic effects should decrease over time. 1.11.2 Empirical answers When this question – whether the relative importance of genetic effects decrease over time – has been investigated, the findings for neonates indicate that the heritability for personality starts at zero during the first days of life (Plomin, 1987; Riese, 1990). The heritability for temperamental differences, i.e. irritability, resistance to soothing, activity level and reactivity, as well as individual differences in smiling in newborns, is not significantly different from zero. However, once the environment becomes more familiar to the infant, MZ twins start to act more and more similarly compared with DZ twins. The heritability for personality, thus, steadily increases during infancy, to eventually stabilize in the late teens or early adulthood. Furthermore, cross-sectional data indicate that twins become less similar throughout the rest of the lifespan, but that decrease in similarity occurs to the same extent for both MZ and DZ twins for most personality traits, which suggests that heritability remains approximately at the same level (about .40) throughout adulthood (McCartney et al., 1990). Indeed, the heritability for personality at retirement age is not much different from what has been observed at younger ages (Pedersen &
27864 Avhandling_inlaga.indd 32 1/28/08 9:19:50 AM
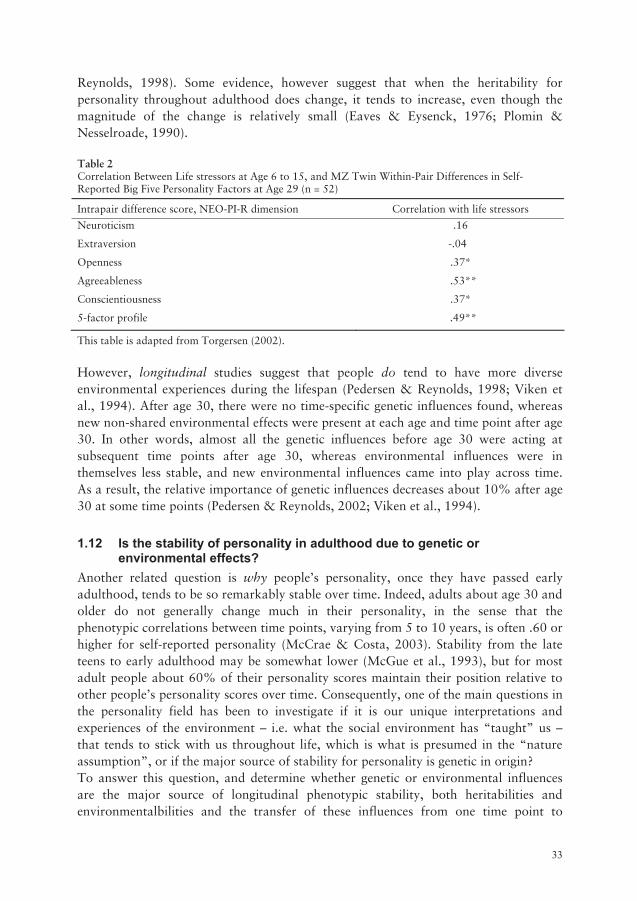
33
Reynolds, 1998). Some evidence, however suggest that when the heritability for personality throughout adulthood does change, it tends to increase, even though the magnitude of the change is relatively small (Eaves & Eysenck, 1976; Plomin & Nesselroade, 1990). Table 2 Correlation Between Life stressors at Age 6 to 15, and MZ Twin Within-Pair Differences in Self-Reported Big Five Personality Factors at Age 29 (n = 52)
Intrapair difference score, NEO-PI-R dimension Correlation with life stressors
Neuroticism .16
Extraversion -.04
Openness .37*
Agreeableness .53**
Conscientiousness .37*
5-factor profile .49**
This table is adapted from Torgersen (2002).
However, longitudinal studies suggest that people do tend to have more diverse environmental experiences during the lifespan (Pedersen & Reynolds, 1998; Viken et al., 1994). After age 30, there were no time-specific genetic influences found, whereas new non-shared environmental effects were present at each age and time point after age 30. In other words, almost all the genetic influences before age 30 were acting at subsequent time points after age 30, whereas environmental influences were in themselves less stable, and new environmental influences came into play across time. As a result, the relative importance of genetic influences decreases about 10% after age 30 at some time points (Pedersen & Reynolds, 2002; Viken et al., 1994).
1.12 Is the stability of personality in adulthood due to genetic or environmental effects?
Another related question is why people’s personality, once they have passed early adulthood, tends to be so remarkably stable over time. Indeed, adults about age 30 and older do not generally change much in their personality, in the sense that the phenotypic correlations between time points, varying from 5 to 10 years, is often .60 or higher for self-reported personality (McCrae & Costa, 2003). Stability from the late teens to early adulthood may be somewhat lower (McGue et al., 1993), but for most adult people about 60% of their personality scores maintain their position relative to other people’s personality scores over time. Consequently, one of the main questions in the personality field has been to investigate if it is our unique interpretations and experiences of the environment – i.e. what the social environment has “taught” us – that tends to stick with us throughout life, which is what is presumed in the “nature assumption”, or if the major source of stability for personality is genetic in origin? To answer this question, and determine whether genetic or environmental influences are the major source of longitudinal phenotypic stability, both heritabilities and environmentalbilities and the transfer of these influences from one time point to
32
shared environment for 60% of the variance. Since about 20% of the variance in self-report measures is due to error of measurement, non-shared environmental influences appear to be about as important as genetic influences in the personality domain. Thus, the net effect of the environment at large is to create personality differences, not personality similarities, as historically has been assumed by environmentally oriented researchers (Harris, 2000; Maccoby, 1992; Plomin et al., 2001a; Plomin & Daniels, 1987). In other words, the personality differences that exist between people are mainly due to each person’s unique genetic propensities as well as each person’s unique experiences of the environment – in, as well as outside, the home. 1.11.1 To what extent does heritability for personality change over time? Another important question is the extent to which heritability for personality changes over time. According to the “nature assumption” it would be logical if environmental factors at the expense of genetic factors increased during development. As children move out of their parents’ home they experience more and more diverse environmental influences; they meet new friends, start new occupations, get married and have children, and about 40% of them later divorce (Buss & Larsen, 2005). Furthermore, just because the heritability for personality in adolescence and early adulthood is substantial, this does not mean that heritability for personality throughout the lifespan must be the same. Genes are “turned on” and “turned off” at different time points during development, at puberty and menopause, for example. Changes in the environment can also influence the extent genes are expressed, and people’s readiness to be influenced by environmental factors differs at different developmental stages (Cook-Greuter, 2000). Thus, because people tend to experience more and more diverse environmental influences throughout the lifespan, whereas the effect of genes may not change as much, many environmental oriented researchers tend to assume that the relative importance of genetic effects should decrease over time. 1.11.2 Empirical answers When this question – whether the relative importance of genetic effects decrease over time – has been investigated, the findings for neonates indicate that the heritability for personality starts at zero during the first days of life (Plomin, 1987; Riese, 1990). The heritability for temperamental differences, i.e. irritability, resistance to soothing, activity level and reactivity, as well as individual differences in smiling in newborns, is not significantly different from zero. However, once the environment becomes more familiar to the infant, MZ twins start to act more and more similarly compared with DZ twins. The heritability for personality, thus, steadily increases during infancy, to eventually stabilize in the late teens or early adulthood. Furthermore, cross-sectional data indicate that twins become less similar throughout the rest of the lifespan, but that decrease in similarity occurs to the same extent for both MZ and DZ twins for most personality traits, which suggests that heritability remains approximately at the same level (about .40) throughout adulthood (McCartney et al., 1990). Indeed, the heritability for personality at retirement age is not much different from what has been observed at younger ages (Pedersen &
27864 Avhandling_inlaga.indd 33 1/28/08 9:19:50 AM

35
Part II
This part highlights empirical findings that gradually, during the last twenty years, have prompted genetic and environmental theory and research to evolve towards one another, and presents the theory of genetics and experience that currently is used to explain how the interplay between genes and the environment works. Two domains where the influence from the environment has been taken for granted by developmentally oriented researchers – i.e. situation specific effects and the home environment – will be discussed by asking three questions:
Are people’s adaptations to different situations influenced by genes? Do the most commonly used environmental measures only measure
“environmental” effects? Do the same genes that influence personality also influence other behaviors?
2.1 Are people’s adaptations to different situations influenced by genes? Maybe the strongest belief that historically has been held within the “nature assumptions” is that situation-specific effects are environmental in origin (Mischel, 1968; Paterson, 1968). In other words, it is environmental factors, such as other people’s expectations and social norms about what is appropriate in a specific situation that pretty much determine which behavioral changes a person makes in different situations. However, in genetically sensitive designs that have tested this assumption it is apparent that MZ twins change their behavior in different situations in more similar ways than DZ twins. For example, situational change in different stressful situations where conflict may occur, and the extent to which people seek co-operation versus conflict at work, at home, or together with their friends, is in adulthood mediated to a relatively large extent by genetic factors (Lensvelt Mulders & Hettema, 2001). Indeed, 26-69% of the various ways people typically behave in those situations are explained by genetic factors. Furthermore, the way children adapt to different situations at 9, 12, 18, 24 and 30 months of age – in a room where free play was allowed versus a situation where developmental test scores were collected – has also been found to be more similar among MZ than DZ twins (Matheny & Dolan, 1975; Phillips & Matheny, 1997). This is also true of the stress coping styles that school-aged children, young adults, middle-aged adults and older adults tend to use. Typically, heritability ranges from .21 to .68 for stress coping styles such as “problem solving”, “seeking support” and “avoidance”, which assess the strategies people are most likely to use in stressful situations (Busjahn et al., 1999; Kato & Pedersen, 2005; Kendler et al., 1991; Mellins et al., 1996). Thus, even though the unique ways different individuals interpret the environment, hence non-shared environmental effects, generally is of greater importance than the genetic variation for stress coping styles, situational change and situation-specific effects appear to be influenced by genetic factors to approximately the same extent as personality.
34
another need to be determined. If genetic influences are the major source of phenotypic stability, then both the heritability and the transfer of the genetic influences from one time point to another need to be higher than the corresponding transfer of environmental influences. Accordingly, when data from MZ and DZ twins have been used to investigate this, it is clear that that the long-term stability of personality is due mostly to genes. As we have seen, the heritability does not change much throughout adulthood; it stays approximately at 40%. Furthermore, about 85-100% of the genetic influences that contribute to personality at one time point, also influence the personality at subsequent time points, whereas the corresponding “transfer” of non-shared environment is less, about 50% (McGue et al., 1993; Pedersen, 1994; Pedersen & Reynolds, 1998; Viken et al., 1994). Thus, most of the genetic influences that are active in early adulthood continue to influence personality throughout life, whereas new non-shared environmental influences are found at each age. However, these results should not be interpreted to mean that people’s personality tends to be fixed by genes after age 30. Rather, because gene-environment correlations and interactions in most cases ends up in the genetic category, in twin studies (see Part II) it is more correct to say that the stability of personality is mainly due to genes, in that approximately 60% of the personality does not change much over time. People’s unique experiences and how they interpret the environment at large, which in part are influenced by their genes, are thereby approximately as important as genetic influences in contributing to how people’s personalities develop over time (Pedersen, 1994). Environmental influences may thus in most instances produce short term changes in personality phenotypes, whereas genetic influences contribute to individual set points to which most individuals eventually will regress (Carey, 2003). In summary, these cross-sectional and longitudinal findings in regard to personality suggest that the ideas advocated by some of the most influential environmentally oriented theorists, who historically seem to have influenced the thinking of many developmental researchers, have been quite misleading (at least in some respects). Watson’s (1920), Pavlov’s (1927), and Skinner’s (1971) ideas that internal forces influenced by genetic dispositions, such as people’s needs, motives, and phenomenological experiences, are unnecessary in order to explain people’s behavior, do not seem to hold up. Instead, any comprehensive personality theory that attempts to understand how people’s personality works, must take into account both people’s genetic propensities to experience and interpret the environment in a specific way, as well as the influences from the milieu at large. This will become even more obvious when the two bodies of literature in Part II are discussed.
27864 Avhandling_inlaga.indd 34 1/28/08 9:19:51 AM

35
Part II
This part highlights empirical findings that gradually, during the last twenty years, have prompted genetic and environmental theory and research to evolve towards one another, and presents the theory of genetics and experience that currently is used to explain how the interplay between genes and the environment works. Two domains where the influence from the environment has been taken for granted by developmentally oriented researchers – i.e. situation specific effects and the home environment – will be discussed by asking three questions:
Are people’s adaptations to different situations influenced by genes? Do the most commonly used environmental measures only measure
“environmental” effects? Do the same genes that influence personality also influence other behaviors?
2.1 Are people’s adaptations to different situations influenced by genes? Maybe the strongest belief that historically has been held within the “nature assumptions” is that situation-specific effects are environmental in origin (Mischel, 1968; Paterson, 1968). In other words, it is environmental factors, such as other people’s expectations and social norms about what is appropriate in a specific situation that pretty much determine which behavioral changes a person makes in different situations. However, in genetically sensitive designs that have tested this assumption it is apparent that MZ twins change their behavior in different situations in more similar ways than DZ twins. For example, situational change in different stressful situations where conflict may occur, and the extent to which people seek co-operation versus conflict at work, at home, or together with their friends, is in adulthood mediated to a relatively large extent by genetic factors (Lensvelt Mulders & Hettema, 2001). Indeed, 26-69% of the various ways people typically behave in those situations are explained by genetic factors. Furthermore, the way children adapt to different situations at 9, 12, 18, 24 and 30 months of age – in a room where free play was allowed versus a situation where developmental test scores were collected – has also been found to be more similar among MZ than DZ twins (Matheny & Dolan, 1975; Phillips & Matheny, 1997). This is also true of the stress coping styles that school-aged children, young adults, middle-aged adults and older adults tend to use. Typically, heritability ranges from .21 to .68 for stress coping styles such as “problem solving”, “seeking support” and “avoidance”, which assess the strategies people are most likely to use in stressful situations (Busjahn et al., 1999; Kato & Pedersen, 2005; Kendler et al., 1991; Mellins et al., 1996). Thus, even though the unique ways different individuals interpret the environment, hence non-shared environmental effects, generally is of greater importance than the genetic variation for stress coping styles, situational change and situation-specific effects appear to be influenced by genetic factors to approximately the same extent as personality.
34
another need to be determined. If genetic influences are the major source of phenotypic stability, then both the heritability and the transfer of the genetic influences from one time point to another need to be higher than the corresponding transfer of environmental influences. Accordingly, when data from MZ and DZ twins have been used to investigate this, it is clear that that the long-term stability of personality is due mostly to genes. As we have seen, the heritability does not change much throughout adulthood; it stays approximately at 40%. Furthermore, about 85-100% of the genetic influences that contribute to personality at one time point, also influence the personality at subsequent time points, whereas the corresponding “transfer” of non-shared environment is less, about 50% (McGue et al., 1993; Pedersen, 1994; Pedersen & Reynolds, 1998; Viken et al., 1994). Thus, most of the genetic influences that are active in early adulthood continue to influence personality throughout life, whereas new non-shared environmental influences are found at each age. However, these results should not be interpreted to mean that people’s personality tends to be fixed by genes after age 30. Rather, because gene-environment correlations and interactions in most cases ends up in the genetic category, in twin studies (see Part II) it is more correct to say that the stability of personality is mainly due to genes, in that approximately 60% of the personality does not change much over time. People’s unique experiences and how they interpret the environment at large, which in part are influenced by their genes, are thereby approximately as important as genetic influences in contributing to how people’s personalities develop over time (Pedersen, 1994). Environmental influences may thus in most instances produce short term changes in personality phenotypes, whereas genetic influences contribute to individual set points to which most individuals eventually will regress (Carey, 2003). In summary, these cross-sectional and longitudinal findings in regard to personality suggest that the ideas advocated by some of the most influential environmentally oriented theorists, who historically seem to have influenced the thinking of many developmental researchers, have been quite misleading (at least in some respects). Watson’s (1920), Pavlov’s (1927), and Skinner’s (1971) ideas that internal forces influenced by genetic dispositions, such as people’s needs, motives, and phenomenological experiences, are unnecessary in order to explain people’s behavior, do not seem to hold up. Instead, any comprehensive personality theory that attempts to understand how people’s personality works, must take into account both people’s genetic propensities to experience and interpret the environment in a specific way, as well as the influences from the milieu at large. This will become even more obvious when the two bodies of literature in Part II are discussed.
27864 Avhandling_inlaga.indd 35 1/28/08 9:19:51 AM

37
family environment in addition to warmth and control – i.e. the extent to which the family environment was achievement oriented, engaged in different activities outside the home, including cultural activities and interests – were assessed. The results revealed that the MZ twin correlations were significant, which was not expected considering the fact that the co-twins were reporting on the environment in different families. The correlations for adopted-apart MZ twins, which estimate heritability directly, ranged from .22 to .44. Thus, these findings are very important because they indicate that people create their own environments partly for genetic reasons, and that the heritability for most family environments is in the same range as many adoption study estimates for personality. The second study is the Nonshared Environment in Adolescent Development project (NEAD), which thus far is the most ambitious project systematically to focus on the family environment in a large genetically informed sample. The study assessed 72 measures of the family environment and the average heritability was .26 (Plomin et al., 1994). The result in NEAD confirms the overall finding that most aspects of the family environment are influenced by genetic factors, as well as warmth and control in Rowe’s initial studies. Significant genetic effects on 15 of 18 of the composite measures were found, and the heritability for the scale of maternal closeness, which taps the same environmental domain as Rowe’s warmth measure, was .51, whereas the most direct measure of parental control yielded the lowest estimate of heritability – .10 for maternal and .18 for paternal control. Not surprisingly, these findings have inspired genetically oriented researchers to investigate whether measures of the environment outside the home are genetically influenced. Measures of children’s relationships to peers, best friends and teachers (Manke et al., 1995), accident liability in early childhood (Matheny, 1988), life events (Kendler et al., 1993), perceived work environment in adulthood (Hershberger et al., 1994), etc. have been investigated, and the general finding is that genetic factors contribute substantially to how people score on these measures (Plomin, 1994). MZ twins generally experience the environment at large in more similar ways than DZ twins, and the heritability for these extra familial environmental measures ranges typically from .14 to .50. However, heritabilities as high as .50 to .85 have been observed for some types of peer group relationships, such as friends school performances and delinquent behavior as perceived by the adolescent’s parents (Manke et al., 1995). To sum up, when the ideas advocated by the “nature assumption” have been carefully investigated by genetically informed designs, they do not hold. As we have seen, people’s personality differences are partly genetic in origin, and stability of personality is more dependent on the continuous effect of genes than the corresponding transfer of environmental effects from one time point to another (Pedersen & Reynolds, 1998; Pedersen & Reynolds, 2002; Viken et al., 1994). In other words, it is reasonable to conclude that the stability of personality is mainly attributable to genetic factors (Carey, 2003; Caspi et al., 2005). Furthermore, the net effect of the environment is to
36
2.2 Are the most commonly used environmental measures pure measures of the environment?
The empirical phenomenon that more than anything else has prompted genetic and environmental theory and research to evolve towards one other is that the most widely used measures of the home environment are influenced by genetic factors (Plomin, 1994). This was first recognized in 1981 and 1983, when two landmark twin studies, performed by David Rowe (Rowe, 1981; Rowe, 1983), demonstrated that children’s reports of parental behaviors, as well as the overall atmosphere in their family, as perceived by children, were influenced by genes. The results of these studies are summarized in Table 3, and show that parental practices and the overall atmosphere in the home are not independent of their children’s genetic propensities. Table 3 Twin Correlation for adolescent Twin Ratings of Their Parents’ Child Rearing
Measure Twin Correlation
MZ DZ
Children’s Report of Parental Behavior (1981) Perception of Mother: Acceptance - Rejection .54 .17* Control – Autonomy .44 .47 Firm – lax Control .55 .46 Perception of Father: Acceptance - Rejection .74 .21* Control – Autonomy .43 .46 Firm – lax Control .43 .45 Family Environment Scales (1983) Acceptance - Rejection .63 .21* Restrictiveness - Permissiveness .44 .54
Source: Adapted from Rowe (1981, 1983). *MZ correlation significantly (p < .05) greater than DZ correlation.
Typically, MZ twins perceived the extent to which their parent accepted or rejected them in more similar ways than DZ twins, whereas there was no such difference in the way the twins felt they were controlled by their mothers’ and fathers’ parental practices. The same was also true for the overall atmosphere in the home. Genetic propensities influenced the extent to which relationships in the families were experienced as being warm, loving and caring, but not the extent to which the overall atmosphere in the home was experienced as being restricted or permissive. The sample sizes in these initial studies were relatively small (n = 180), but more recent studies have replicated the finding with larger samples, and also have been able to extend the finding to other measures of the family environment. Two studies are particularly noteworthy. The first study included MZ and DZ twins who were raised in different homes (Plomin et al., 1988). Older twins (mean age: 58.6) retrospectively rated their family environment. Several characteristics of the overall
27864 Avhandling_inlaga.indd 36 1/28/08 9:19:52 AM

37
family environment in addition to warmth and control – i.e. the extent to which the family environment was achievement oriented, engaged in different activities outside the home, including cultural activities and interests – were assessed. The results revealed that the MZ twin correlations were significant, which was not expected considering the fact that the co-twins were reporting on the environment in different families. The correlations for adopted-apart MZ twins, which estimate heritability directly, ranged from .22 to .44. Thus, these findings are very important because they indicate that people create their own environments partly for genetic reasons, and that the heritability for most family environments is in the same range as many adoption study estimates for personality. The second study is the Nonshared Environment in Adolescent Development project (NEAD), which thus far is the most ambitious project systematically to focus on the family environment in a large genetically informed sample. The study assessed 72 measures of the family environment and the average heritability was .26 (Plomin et al., 1994). The result in NEAD confirms the overall finding that most aspects of the family environment are influenced by genetic factors, as well as warmth and control in Rowe’s initial studies. Significant genetic effects on 15 of 18 of the composite measures were found, and the heritability for the scale of maternal closeness, which taps the same environmental domain as Rowe’s warmth measure, was .51, whereas the most direct measure of parental control yielded the lowest estimate of heritability – .10 for maternal and .18 for paternal control. Not surprisingly, these findings have inspired genetically oriented researchers to investigate whether measures of the environment outside the home are genetically influenced. Measures of children’s relationships to peers, best friends and teachers (Manke et al., 1995), accident liability in early childhood (Matheny, 1988), life events (Kendler et al., 1993), perceived work environment in adulthood (Hershberger et al., 1994), etc. have been investigated, and the general finding is that genetic factors contribute substantially to how people score on these measures (Plomin, 1994). MZ twins generally experience the environment at large in more similar ways than DZ twins, and the heritability for these extra familial environmental measures ranges typically from .14 to .50. However, heritabilities as high as .50 to .85 have been observed for some types of peer group relationships, such as friends school performances and delinquent behavior as perceived by the adolescent’s parents (Manke et al., 1995). To sum up, when the ideas advocated by the “nature assumption” have been carefully investigated by genetically informed designs, they do not hold. As we have seen, people’s personality differences are partly genetic in origin, and stability of personality is more dependent on the continuous effect of genes than the corresponding transfer of environmental effects from one time point to another (Pedersen & Reynolds, 1998; Pedersen & Reynolds, 2002; Viken et al., 1994). In other words, it is reasonable to conclude that the stability of personality is mainly attributable to genetic factors (Carey, 2003; Caspi et al., 2005). Furthermore, the net effect of the environment is to
36
2.2 Are the most commonly used environmental measures pure measures of the environment?
The empirical phenomenon that more than anything else has prompted genetic and environmental theory and research to evolve towards one other is that the most widely used measures of the home environment are influenced by genetic factors (Plomin, 1994). This was first recognized in 1981 and 1983, when two landmark twin studies, performed by David Rowe (Rowe, 1981; Rowe, 1983), demonstrated that children’s reports of parental behaviors, as well as the overall atmosphere in their family, as perceived by children, were influenced by genes. The results of these studies are summarized in Table 3, and show that parental practices and the overall atmosphere in the home are not independent of their children’s genetic propensities. Table 3 Twin Correlation for adolescent Twin Ratings of Their Parents’ Child Rearing
Measure Twin Correlation
MZ DZ
Children’s Report of Parental Behavior (1981) Perception of Mother: Acceptance - Rejection .54 .17* Control – Autonomy .44 .47 Firm – lax Control .55 .46 Perception of Father: Acceptance - Rejection .74 .21* Control – Autonomy .43 .46 Firm – lax Control .43 .45 Family Environment Scales (1983) Acceptance - Rejection .63 .21* Restrictiveness - Permissiveness .44 .54
Source: Adapted from Rowe (1981, 1983). *MZ correlation significantly (p < .05) greater than DZ correlation.
Typically, MZ twins perceived the extent to which their parent accepted or rejected them in more similar ways than DZ twins, whereas there was no such difference in the way the twins felt they were controlled by their mothers’ and fathers’ parental practices. The same was also true for the overall atmosphere in the home. Genetic propensities influenced the extent to which relationships in the families were experienced as being warm, loving and caring, but not the extent to which the overall atmosphere in the home was experienced as being restricted or permissive. The sample sizes in these initial studies were relatively small (n = 180), but more recent studies have replicated the finding with larger samples, and also have been able to extend the finding to other measures of the family environment. Two studies are particularly noteworthy. The first study included MZ and DZ twins who were raised in different homes (Plomin et al., 1988). Older twins (mean age: 58.6) retrospectively rated their family environment. Several characteristics of the overall
27864 Avhandling_inlaga.indd 37 1/28/08 9:19:52 AM

39
child’s genetic propensity is expressed then this is a positive reactive genotype-environment correlation. If people’s reaction hinders children from expressing their genetic propensities, then we talk about a negative reactive genotype-environment correlation. Thus, the reactive type of genotype-environment correlation occurs when people’s reactions to children’s genetic propensities make them experience an environment that may, or may not, “nature” their genetic propensities. The active type of genotype-environment correlation occurs when the individual actively selects or creates environments that are correlated with his/her genetic propensities. That is, children who are agreeable because of their genetic propensities may gravitate towards environments where there is less conflict and where their agreeable way of being is respected and not misused. It is also likely that more agreeable children could create a more co-operative environment for themselves and others. This selection and creation of environments has been called “niche picking” and “niche building” by Scarr and McCartney (1983). Examples of “evocative and or the active genotype-environmental effects” are that adolescents who have parents who score high on antisocial behaviors and drug abuse receive more harsh and inconsistent disciplinary practices from both their adoptive parents, compared with controls (Ge et al., 1996). That is, the antisocial propensities possessed by biological parents are in part genetic in origin, and these genetic propensities are inherited by their children. These propensities in turn influence their children’s behaviors and the disciplinary practices they evoke from their adoptive parents. In addition, more advanced genetically informed studies, which have been able to estimate the genetic contributions of both adolescents and their mothers simultaneously, suggest that mothers’ tendency to interact with her adolescent in a warm and caring way is influenced by both her own and her children’s genetic propensities. However, negative parenting is not influenced by the mother’s own genotype. Only evocative and/or active genotype-environmental correlations have been found for negative parenting, which indicates that the mother’s negative parenting is primarily influenced by her adolescent’s genetic propensities (Neiderhiser et al., 2004; O'Connor et al., 1998; Reiss, 2003). Another intriguing finding is that the heritable characteristics in children that elicit maternal warmth are entirely different from the heritable characteristics that elicit paternal warmth (Neiderhiser et al., 2004). 2.3.3 Genotype-Environmental interactions The other way genetic mediation between behavioral and environmental measures occurs is through genotype-environment interaction. Genotype-environment interactions relate to the fact that people with different genotypes differ in their susceptibility or sensitivity to different environments. Rather than focusing on the role of genetics in exposure to environments and searching for environmental influences that equally affect most individuals in a population, which is done in family studies demonstrating genotype-environmental correlations, genotype-environment interactions consider environmental influences that may powerfully affect only a small group of individuals with a certain genetic predisposition.
38
create personality differences, not personality similarities, which is what the “nature assumption” has assumed (Plomin & Daniels, 1987). In addition, a wide range of measures that have been regarded as “pure” measures of the environment are also influenced by genes to a substantial degree. These findings call for a theory of genetics and experiences that can replace the thinking generated by the “nature assumption”, and that can explain how the interplay between genes and the environment works.
2.3.1 The Theory of Genetics and Experience The basic idea of the “theory of genetics and experience” currently used is that there are genetically influenced aspects of the individual’s psychological functioning, which in turn influence specific aspects of the environment. In other words, genetically influenced psychological traits are assumed to act as mediators of the genetic contribution to measures of the environment. For example, since there is a genetic contribution to the personality trait agreeableness, as well as to parental warmth, this raises the possibility that the genetic contribution to parental warmth might be mediated by genes that influence agreeableness. How this genetic mediation between behavioral and environmental measures occurs is currently understood within the theoretical framework of genotype-environment correlations and genotype-environmental interactions. 2.3.2 Genotype-Environment correlations Three types of Genotype-Environment correlations have been described (Plomin et al., 1977). The passive type occurs when there is a match (or mismatch) between the environment that the parents provide for the child and the child’s own genetic propensities (received from the parents). For example, since the heritability for agreeableness is about .40, agreeable children are likely to have agreeable parents who provide them, with both genes, and an environment conducive to the development of agreeableness. This would be a positive passive genotype-environment correlation. The child passively inherits a home environment that matches with its genetic propensities. One example of this “passive genotype-environmental effect” is that adjustment problems, such as low self-esteem, low self-acceptance, low perceived attractiveness and low social competence, which are often experienced by children in divorced families, appear to be boosted by their parent’s genetic propensities. That is, the adjustment problems that the parents have in coping with their marriage are in part genetic in origin, and these genetic propensities are inherited by their children. These genetic propensities contribute in turn – because they are reinforced by the home environment their parents provide – to the adjustment problems children from divorced families typically experience, over and above what appears to be a direct consequence of conflict and divorce (O'Connor et al., 2000). A reactive or evocative type of genotype-environment correlation occurs when people react to a child’s genetic propensities. Children who are agreeable because of their genetic propensities may induce reactions from other people that give them specific environmental experiences. If people’s reactions are increasing the probability that the
27864 Avhandling_inlaga.indd 38 1/28/08 9:19:52 AM

39
child’s genetic propensity is expressed then this is a positive reactive genotype-environment correlation. If people’s reaction hinders children from expressing their genetic propensities, then we talk about a negative reactive genotype-environment correlation. Thus, the reactive type of genotype-environment correlation occurs when people’s reactions to children’s genetic propensities make them experience an environment that may, or may not, “nature” their genetic propensities. The active type of genotype-environment correlation occurs when the individual actively selects or creates environments that are correlated with his/her genetic propensities. That is, children who are agreeable because of their genetic propensities may gravitate towards environments where there is less conflict and where their agreeable way of being is respected and not misused. It is also likely that more agreeable children could create a more co-operative environment for themselves and others. This selection and creation of environments has been called “niche picking” and “niche building” by Scarr and McCartney (1983). Examples of “evocative and or the active genotype-environmental effects” are that adolescents who have parents who score high on antisocial behaviors and drug abuse receive more harsh and inconsistent disciplinary practices from both their adoptive parents, compared with controls (Ge et al., 1996). That is, the antisocial propensities possessed by biological parents are in part genetic in origin, and these genetic propensities are inherited by their children. These propensities in turn influence their children’s behaviors and the disciplinary practices they evoke from their adoptive parents. In addition, more advanced genetically informed studies, which have been able to estimate the genetic contributions of both adolescents and their mothers simultaneously, suggest that mothers’ tendency to interact with her adolescent in a warm and caring way is influenced by both her own and her children’s genetic propensities. However, negative parenting is not influenced by the mother’s own genotype. Only evocative and/or active genotype-environmental correlations have been found for negative parenting, which indicates that the mother’s negative parenting is primarily influenced by her adolescent’s genetic propensities (Neiderhiser et al., 2004; O'Connor et al., 1998; Reiss, 2003). Another intriguing finding is that the heritable characteristics in children that elicit maternal warmth are entirely different from the heritable characteristics that elicit paternal warmth (Neiderhiser et al., 2004). 2.3.3 Genotype-Environmental interactions The other way genetic mediation between behavioral and environmental measures occurs is through genotype-environment interaction. Genotype-environment interactions relate to the fact that people with different genotypes differ in their susceptibility or sensitivity to different environments. Rather than focusing on the role of genetics in exposure to environments and searching for environmental influences that equally affect most individuals in a population, which is done in family studies demonstrating genotype-environmental correlations, genotype-environment interactions consider environmental influences that may powerfully affect only a small group of individuals with a certain genetic predisposition.
38
create personality differences, not personality similarities, which is what the “nature assumption” has assumed (Plomin & Daniels, 1987). In addition, a wide range of measures that have been regarded as “pure” measures of the environment are also influenced by genes to a substantial degree. These findings call for a theory of genetics and experiences that can replace the thinking generated by the “nature assumption”, and that can explain how the interplay between genes and the environment works.
2.3.1 The Theory of Genetics and Experience The basic idea of the “theory of genetics and experience” currently used is that there are genetically influenced aspects of the individual’s psychological functioning, which in turn influence specific aspects of the environment. In other words, genetically influenced psychological traits are assumed to act as mediators of the genetic contribution to measures of the environment. For example, since there is a genetic contribution to the personality trait agreeableness, as well as to parental warmth, this raises the possibility that the genetic contribution to parental warmth might be mediated by genes that influence agreeableness. How this genetic mediation between behavioral and environmental measures occurs is currently understood within the theoretical framework of genotype-environment correlations and genotype-environmental interactions. 2.3.2 Genotype-Environment correlations Three types of Genotype-Environment correlations have been described (Plomin et al., 1977). The passive type occurs when there is a match (or mismatch) between the environment that the parents provide for the child and the child’s own genetic propensities (received from the parents). For example, since the heritability for agreeableness is about .40, agreeable children are likely to have agreeable parents who provide them, with both genes, and an environment conducive to the development of agreeableness. This would be a positive passive genotype-environment correlation. The child passively inherits a home environment that matches with its genetic propensities. One example of this “passive genotype-environmental effect” is that adjustment problems, such as low self-esteem, low self-acceptance, low perceived attractiveness and low social competence, which are often experienced by children in divorced families, appear to be boosted by their parent’s genetic propensities. That is, the adjustment problems that the parents have in coping with their marriage are in part genetic in origin, and these genetic propensities are inherited by their children. These genetic propensities contribute in turn – because they are reinforced by the home environment their parents provide – to the adjustment problems children from divorced families typically experience, over and above what appears to be a direct consequence of conflict and divorce (O'Connor et al., 2000). A reactive or evocative type of genotype-environment correlation occurs when people react to a child’s genetic propensities. Children who are agreeable because of their genetic propensities may induce reactions from other people that give them specific environmental experiences. If people’s reactions are increasing the probability that the
27864 Avhandling_inlaga.indd 39 1/28/08 9:19:53 AM

41
weight (Wichers et al., 2002), and the heritability for verbal intelligence is much higher among highly educated families (74%) than in less well-educated families (26%) (Rowe et al., 1999).
Furthermore, stressful life events may trigger a genetic liability for depression, resulting in an increase in the heritability for depression (by about 10%), which is not expressed in those cases where there is an “absence” of stressful life events (Silberg et al., 2001). But social factors on a societal level can also influence the extent to which genetic factors influence behavioral differences. For example, the heritability for the variance in the age of first intercourse differs between eras when the social controls in favor of delaying sexual debut varies. The heritability for women and men born between 1922 and 1952, who reached adolescence during an era when social controls inhibiting sexual intercourse were relatively strong, is much lower (32% for women and 0% for men) than in those born between 1952 and 1965 (49% for women and 72% for men), who reached adolescence in an era of greater sexual tolerance (Dunne et al., 1997). Accordingly, two competing models have been put forward to explain how the environment influences the expression of genetic factors. Bronfenbrenner and Cici’s
(high) 0 (low)
(low) 0
Well-being zone
A1
A3 A4
A2
Anxiety zone
Perceived skill
Perceived challenge
The position in the diagram for people with a genotype for high and low neuroticism may differ. Among people with a genotype for low neuroticism, their average level of subjective well-being is likely to gravitate around A1, whereas those with a genotype for high neuroticism are more likely to gravitate around A3. Thus, when the push for achievement and performance from parents is out of balance with how the children and youth perceive their skills, and the anxiety level as a consequence increases, people with a genotype for high versus low neuroticism may get pushed into different zones. Those with a genotype for high neuroticism are more likely to score lower on neuroticism, because by doing so the relative payoff of increasing their skill will increase. They can “escape” from their average level of anxiety (i.e., move from A3 and directly into A4) by increasing their skills. In contrast, the relative payoff for people with a genotype for low neuroticism is less immediate. Every time they are pushed by their parents outside their comfort zone (A1), their relative level of anxiety increases, i.e., they move into the zone of anxiety (A3). Thus, if they too often are pushed out of their comfort zone by their parents, they will experiences an increased level of anxiety, which, according to Bergeman et al. (1988) findings, will result over time in higher scores on neuroticism. Adapted from Csikszentmihalyi (1990).
(high)
Boredom zone
Figure 2
40
For example, Bergeman et al. (1988) demonstrated that the overall atmosphere in the home in some instances only influences personality when the individual has a certain personality genotype. Personality scores were not affected by how controlling or restrictive the environment in their homes was for people with a genotype for high extraversion and impulsiveness. Only those with a genotype for low extraversion scored significantly lower on extraversion in a controlling home environment. Furthermore, individuals with a genotype for high versus low impulsivity tended to react differently to a home environment with many conflicts. Impulsiveness tended to be exacerbated in an environment with many conflicts for individuals with a genotype for high impulsivity, whereas those with a genotype for low impulsivity were unaffected. However, maybe the most intriguing finding emerged for neuroticism. The extent to which the home was activity-oriented and encouraged personal growth affected individuals with a genotype for low and high neuroticism in opposite directions. Individuals with a genotype for high neuroticism scored lower on neuroticism in homes that were activity oriented and encouraged personal growth, whereas those with a genotype for low neuroticism increased their scores on neuroticism in homes that were characterized by such environmental conditions, see figure 2 on page 41 (Bergeman et al., 1988). Exactly how important genotype-environment interaction such as these are, compared with main effects of genes and environments, depends on the strength and prevalence of the genetic propensities and the environmental conditions observed in a population. That is, in a general sense Bergeman’s findings show that people have both genetic and environmental thresholds for how much they are affected by environmental factors. Thus, the extent people over time increase their neuroticism, may depend on the balance between perceived “challenges” posed by a task and one’s perceived “skill” in mastering the task (Csikszentmihalyi, 1990; Csikszentmihalyi, 1993). A home environment that encourages personal growth, in terms of challenging children’s ability to achieve, to try harder than others, and perform may not necessarily promote well-being, or low neuroticism (Moneta & Csikszentmihalyi, 1999). Such efforts will, if the challenges do not match how individuals perceive their skills, promote anxiety. Thus, to be able to understand how people’s genetic propensities for well-being and neuroticism interact with environmental conditions in the home, people’s genetic propensities and how these influence their phenomenological experiences need to be taken into account (Lykken & Csikszentmihalyi, 2001). How interactions between an individual's genetic propensities for neurotic behavior and the home environment that their parents provide generally influence the individual’s level of neurotic behaviors is illustrated in Figure 2. It is also important to recognize that powerful environmental risk factors can change the average effect genetic factors may have on behavior. The heritability for problem behaviors is, for example, significantly lower in children with a birth weight that is very low in relation to gestational age than in those with a normal birth (or above)
27864 Avhandling_inlaga.indd 40 1/28/08 9:19:53 AM

41
weight (Wichers et al., 2002), and the heritability for verbal intelligence is much higher among highly educated families (74%) than in less well-educated families (26%) (Rowe et al., 1999).
Furthermore, stressful life events may trigger a genetic liability for depression, resulting in an increase in the heritability for depression (by about 10%), which is not expressed in those cases where there is an “absence” of stressful life events (Silberg et al., 2001). But social factors on a societal level can also influence the extent to which genetic factors influence behavioral differences. For example, the heritability for the variance in the age of first intercourse differs between eras when the social controls in favor of delaying sexual debut varies. The heritability for women and men born between 1922 and 1952, who reached adolescence during an era when social controls inhibiting sexual intercourse were relatively strong, is much lower (32% for women and 0% for men) than in those born between 1952 and 1965 (49% for women and 72% for men), who reached adolescence in an era of greater sexual tolerance (Dunne et al., 1997). Accordingly, two competing models have been put forward to explain how the environment influences the expression of genetic factors. Bronfenbrenner and Cici’s
(high) 0 (low)
(low) 0
Well-being zone
A1
A3 A4
A2
Anxiety zone
Perceived skill
Perceived challenge
The position in the diagram for people with a genotype for high and low neuroticism may differ. Among people with a genotype for low neuroticism, their average level of subjective well-being is likely to gravitate around A1, whereas those with a genotype for high neuroticism are more likely to gravitate around A3. Thus, when the push for achievement and performance from parents is out of balance with how the children and youth perceive their skills, and the anxiety level as a consequence increases, people with a genotype for high versus low neuroticism may get pushed into different zones. Those with a genotype for high neuroticism are more likely to score lower on neuroticism, because by doing so the relative payoff of increasing their skill will increase. They can “escape” from their average level of anxiety (i.e., move from A3 and directly into A4) by increasing their skills. In contrast, the relative payoff for people with a genotype for low neuroticism is less immediate. Every time they are pushed by their parents outside their comfort zone (A1), their relative level of anxiety increases, i.e., they move into the zone of anxiety (A3). Thus, if they too often are pushed out of their comfort zone by their parents, they will experiences an increased level of anxiety, which, according to Bergeman et al. (1988) findings, will result over time in higher scores on neuroticism. Adapted from Csikszentmihalyi (1990).
(high)
Boredom zone
Figure 2
40
For example, Bergeman et al. (1988) demonstrated that the overall atmosphere in the home in some instances only influences personality when the individual has a certain personality genotype. Personality scores were not affected by how controlling or restrictive the environment in their homes was for people with a genotype for high extraversion and impulsiveness. Only those with a genotype for low extraversion scored significantly lower on extraversion in a controlling home environment. Furthermore, individuals with a genotype for high versus low impulsivity tended to react differently to a home environment with many conflicts. Impulsiveness tended to be exacerbated in an environment with many conflicts for individuals with a genotype for high impulsivity, whereas those with a genotype for low impulsivity were unaffected. However, maybe the most intriguing finding emerged for neuroticism. The extent to which the home was activity-oriented and encouraged personal growth affected individuals with a genotype for low and high neuroticism in opposite directions. Individuals with a genotype for high neuroticism scored lower on neuroticism in homes that were activity oriented and encouraged personal growth, whereas those with a genotype for low neuroticism increased their scores on neuroticism in homes that were characterized by such environmental conditions, see figure 2 on page 41 (Bergeman et al., 1988). Exactly how important genotype-environment interaction such as these are, compared with main effects of genes and environments, depends on the strength and prevalence of the genetic propensities and the environmental conditions observed in a population. That is, in a general sense Bergeman’s findings show that people have both genetic and environmental thresholds for how much they are affected by environmental factors. Thus, the extent people over time increase their neuroticism, may depend on the balance between perceived “challenges” posed by a task and one’s perceived “skill” in mastering the task (Csikszentmihalyi, 1990; Csikszentmihalyi, 1993). A home environment that encourages personal growth, in terms of challenging children’s ability to achieve, to try harder than others, and perform may not necessarily promote well-being, or low neuroticism (Moneta & Csikszentmihalyi, 1999). Such efforts will, if the challenges do not match how individuals perceive their skills, promote anxiety. Thus, to be able to understand how people’s genetic propensities for well-being and neuroticism interact with environmental conditions in the home, people’s genetic propensities and how these influence their phenomenological experiences need to be taken into account (Lykken & Csikszentmihalyi, 2001). How interactions between an individual's genetic propensities for neurotic behavior and the home environment that their parents provide generally influence the individual’s level of neurotic behaviors is illustrated in Figure 2. It is also important to recognize that powerful environmental risk factors can change the average effect genetic factors may have on behavior. The heritability for problem behaviors is, for example, significantly lower in children with a birth weight that is very low in relation to gestational age than in those with a normal birth (or above)
27864 Avhandling_inlaga.indd 41 1/28/08 9:19:53 AM

43
is, the extent to which the same set of genes influences both the psychological trait and the environmental measure can be estimated by using multivariate genetic analysis (Crawford & DeFries, 1978). For example, in the area of parenting it has been shown that the phenotypic correlation that emerges between people’s perceptions of the atmosphere in the home and personality for the most part is due to the same set of genes. Indeed, the association between people’s perception of their family as being warm, loving, caring and facilitating personal growth and scores on Extraversion and Neuroticism were to 64-95% due to overlapping genetic effects (Chipuer et al., 1993). However, when more extensive measure of personality were used (MPQ; Tellgren 2000), the mediation between personality and the recalled family environment appeared to be stronger. Kruger et al. (2003) found that all the genetic contribution to a measure of recalled family environment was attributed to the genetic contribution to personality. Furthermore, the genes that contribute to Neuroticism, Extraversion and Openness to Experience, as measured by the Five Factor Model, could explain all the genetic influence on controllable, desirable and undesirable life events for older women. Whereas, there was no significant genetic influence for uncontrollable life events (Saudino et al., 1997). Other examples are that genes contributing to personality also contribute to marital satisfaction and divorce. Impulsiveness of the husband and neuroticism of both husband and wife is associated with later negative marital outcomes (Kelly & Conley, 1987), and much of the genetic influences on divorce are accounted for by the personality traits of positive emotionality, negative emotionality and low behavioral constraints (Jockin et al., 1996). In women and men, respectively, 30% and 42% of the heritability of divorce risk consists of genetic factors that influence personality. Likewise, about half of the genetic variance for marital satisfaction is shared with the genetic variance for the personality traits optimism and aggression. Interestingly, wives’ genetically influenced personality characteristics contribute to the wives’ own marital satisfaction, their husbands’ marital satisfaction, and the agreement between the spouses on the quality of their marriage. By contrast, husbands’ personality in this Swedish sample, contrary to expectation, did not contribute to their wives’ marital satisfaction over and above that which could be explained by wives’ personality (Spotts et al., 2005). Moreover, the genetic effects on job satisfaction (h2 = .29) and personality are overlapping. As much as 68 – 80% of the genetic effects on job satisfaction also contribute to personality (Ilies & Judge, 2003) . Overall, these findings demonstrate that children’s experiences of parenting, life events, adults marital satisfaction, divorce, job satisfaction and personality, which traditionally have been considered to belong to different behavioral domains, are inherited “together” via different types of gene-environment correlations and interactions. Intriguingly, thus far, multivariate genetic research has shown that the genes that contribute to normal personality also contribute to many other “environmental measures”, such as monitoring, situation-specific conflicts, traumatic life events, and
42
bioecological model (1994) suggests that the environment tends to actualize genetic potentials to a greater extent in advantaged stable environments than in disadvantaged, disorganized ones. By contrast, the stress-diathesis model suggests that environmental risks are likely to trigger genetic susceptibilities, which result in greater heritability in disadvantaged and disorganized environments. There is evidence supporting both models (Rutter et al., 2006), and which one applies varies with circumstances. Ultimately, it depends on the strength and prevalence of the genetic propensities and the environmental conditions observed in a population. However, in relation to genotype-environmental interactions in the personality domain it is important to note that they are less common and less important than generally has been assumed by developmental oriented researchers (Gottlieb, 2003; McCall, 1991; Wahlsten, 1990). Bergman et al. (1988) could find 11 significant interactions out of 48 (23%), and the strongest interaction explained 7% of the total variance, which is less than generally has been expected by environmentally oriented researchers (Plomin & Daniels, 1987; Rutter et al., 2006). This means that the genetic differences that exist among people seem to be of importance regardless of environmental effects, which is consistent with what we saw earlier. MZ twins are generally more similar than DZ twins on most personality traits, regardless of whether they have been raised in the same or different families (Loehlin, 1992; Plomin et al., 2001a), and MZ twins who score high on a trait tend to have a co-twin that also scores high on the same trait, regardless of the environment in which they were reared. Thus, for most personality traits, a genetic “main effect” is present, partly because the driving force in gene-environment correlations is genetic. Nevertheless, it is important to note that when the genetic main effects have played out their influence on the personality phenotypes as developed in most normal environments, there may still be interactions of importance between genetic and environmental factors for some traits, which can explain a smaller part of the phenotypic variation for the trait (about 7 %). The shared rearing environmental effects that have been identified for some personality traits (Pedersen, 1994; Pedersen, 2002; Tellegen et al., 1988), explaining about 7% of the variation, as well as Bergman’s results (discussed above), are clear examples of this. Likewise, it is also important to note that the influences from extreme environmental conditions can override the influence of the main genetic effects on personality, as they generally are played out in “normal” environments (Gabel et al., 1995; Galvin et al., 1995; Reiss et al., 2000). 2.4 Do the same genes that influence personality also influence other
behaviors? As mentioned earlier, the basic idea for the “theory of genetics and experience” is that there are genetically influenced aspects of the individual’s psychological functioning that influence specific aspects of the environment (Plomin, 1994). Now, multivariate genetic twin studies can disentangle the genetic and environmental contribution to the correlation between two traits and estimate the extent to which genetic effects on the psychological trait overlap with the genetic effects on the environmental measure. That
27864 Avhandling_inlaga.indd 42 1/28/08 9:19:54 AM

43
is, the extent to which the same set of genes influences both the psychological trait and the environmental measure can be estimated by using multivariate genetic analysis (Crawford & DeFries, 1978). For example, in the area of parenting it has been shown that the phenotypic correlation that emerges between people’s perceptions of the atmosphere in the home and personality for the most part is due to the same set of genes. Indeed, the association between people’s perception of their family as being warm, loving, caring and facilitating personal growth and scores on Extraversion and Neuroticism were to 64-95% due to overlapping genetic effects (Chipuer et al., 1993). However, when more extensive measure of personality were used (MPQ; Tellgren 2000), the mediation between personality and the recalled family environment appeared to be stronger. Kruger et al. (2003) found that all the genetic contribution to a measure of recalled family environment was attributed to the genetic contribution to personality. Furthermore, the genes that contribute to Neuroticism, Extraversion and Openness to Experience, as measured by the Five Factor Model, could explain all the genetic influence on controllable, desirable and undesirable life events for older women. Whereas, there was no significant genetic influence for uncontrollable life events (Saudino et al., 1997). Other examples are that genes contributing to personality also contribute to marital satisfaction and divorce. Impulsiveness of the husband and neuroticism of both husband and wife is associated with later negative marital outcomes (Kelly & Conley, 1987), and much of the genetic influences on divorce are accounted for by the personality traits of positive emotionality, negative emotionality and low behavioral constraints (Jockin et al., 1996). In women and men, respectively, 30% and 42% of the heritability of divorce risk consists of genetic factors that influence personality. Likewise, about half of the genetic variance for marital satisfaction is shared with the genetic variance for the personality traits optimism and aggression. Interestingly, wives’ genetically influenced personality characteristics contribute to the wives’ own marital satisfaction, their husbands’ marital satisfaction, and the agreement between the spouses on the quality of their marriage. By contrast, husbands’ personality in this Swedish sample, contrary to expectation, did not contribute to their wives’ marital satisfaction over and above that which could be explained by wives’ personality (Spotts et al., 2005). Moreover, the genetic effects on job satisfaction (h2 = .29) and personality are overlapping. As much as 68 – 80% of the genetic effects on job satisfaction also contribute to personality (Ilies & Judge, 2003) . Overall, these findings demonstrate that children’s experiences of parenting, life events, adults marital satisfaction, divorce, job satisfaction and personality, which traditionally have been considered to belong to different behavioral domains, are inherited “together” via different types of gene-environment correlations and interactions. Intriguingly, thus far, multivariate genetic research has shown that the genes that contribute to normal personality also contribute to many other “environmental measures”, such as monitoring, situation-specific conflicts, traumatic life events, and
42
bioecological model (1994) suggests that the environment tends to actualize genetic potentials to a greater extent in advantaged stable environments than in disadvantaged, disorganized ones. By contrast, the stress-diathesis model suggests that environmental risks are likely to trigger genetic susceptibilities, which result in greater heritability in disadvantaged and disorganized environments. There is evidence supporting both models (Rutter et al., 2006), and which one applies varies with circumstances. Ultimately, it depends on the strength and prevalence of the genetic propensities and the environmental conditions observed in a population. However, in relation to genotype-environmental interactions in the personality domain it is important to note that they are less common and less important than generally has been assumed by developmental oriented researchers (Gottlieb, 2003; McCall, 1991; Wahlsten, 1990). Bergman et al. (1988) could find 11 significant interactions out of 48 (23%), and the strongest interaction explained 7% of the total variance, which is less than generally has been expected by environmentally oriented researchers (Plomin & Daniels, 1987; Rutter et al., 2006). This means that the genetic differences that exist among people seem to be of importance regardless of environmental effects, which is consistent with what we saw earlier. MZ twins are generally more similar than DZ twins on most personality traits, regardless of whether they have been raised in the same or different families (Loehlin, 1992; Plomin et al., 2001a), and MZ twins who score high on a trait tend to have a co-twin that also scores high on the same trait, regardless of the environment in which they were reared. Thus, for most personality traits, a genetic “main effect” is present, partly because the driving force in gene-environment correlations is genetic. Nevertheless, it is important to note that when the genetic main effects have played out their influence on the personality phenotypes as developed in most normal environments, there may still be interactions of importance between genetic and environmental factors for some traits, which can explain a smaller part of the phenotypic variation for the trait (about 7 %). The shared rearing environmental effects that have been identified for some personality traits (Pedersen, 1994; Pedersen, 2002; Tellegen et al., 1988), explaining about 7% of the variation, as well as Bergman’s results (discussed above), are clear examples of this. Likewise, it is also important to note that the influences from extreme environmental conditions can override the influence of the main genetic effects on personality, as they generally are played out in “normal” environments (Gabel et al., 1995; Galvin et al., 1995; Reiss et al., 2000). 2.4 Do the same genes that influence personality also influence other
behaviors? As mentioned earlier, the basic idea for the “theory of genetics and experience” is that there are genetically influenced aspects of the individual’s psychological functioning that influence specific aspects of the environment (Plomin, 1994). Now, multivariate genetic twin studies can disentangle the genetic and environmental contribution to the correlation between two traits and estimate the extent to which genetic effects on the psychological trait overlap with the genetic effects on the environmental measure. That
27864 Avhandling_inlaga.indd 43 1/28/08 9:19:54 AM

45
Part III
This part summarizes why it is of interest to identify candidate genes for behavior from a developmental perspective, and gives a brief overview of biological pathways that have been associated with personality. The main problems associated with genetic research on personality and the methodological advantages that becomes available when using iris characteristics will also be highlighted.
3.1 Why do we need to identify candidate genes for personality? As discussed earlier, the most obvious reason for identifying genes that contribute to personality is that our tendency to score high or low on a personality trait is substantially influenced by our genetic propensities. Approximately 40% of the variance for personality is genetic in origin. Furthermore, almost all genetic influences on personality at one point in time are also active at another, and the same genes that influence personality also influence how we create and experience the environment. For example, the genes that influence normal personality also influence the following behaviors: children’s experiences of parenting, life events, adults’ marital satisfaction, job satisfaction, monitoring, situation-specific conflicts, traumatic life events, deficits in executive functioning, leadership styles, anxiety disorders, divorce risk, abnormal personality, coping skills, health promoting behaviors, sleep disturbances, and drug use (Agrawal et al., 2004; Boomsma et al., 2000; Coolidge et al., 2004; Heath et al., 1998; Hettema et al., 2004; Jang & Livesley, 1999; Jang et al., 2003; Jockin et al., 1996; Johnson et al., 2004; Kato & Pedersen, 2005; Krueger et al., 2003; Lensvelt Mulders & Hettema, 2001; Loehlin et al., 2005; Spotts et al., 2005; van Os et al., 2001); (Ilies & Judge, 2003); (Saudino et al., 1997). Thus, by identifying candidate genes for personality a fuller understanding of our psychological functioning at large may emerge. From a developmental perspective, this understanding is especially important. Once gene-behavior associations are “firmly” established (Plomin and Crabbe, 2000, p. 822) one of the most important developmental benefits of DNA is that genetic vulnerabilities as well as genetic strengths can be assessed early in life, which creates an opportunity for early prevention. Currently, targeted interventions tend to wait until depression, and aggressive and antisocial behaviors, are diagnosed in school. By then, such behaviors are often hard to change and often lead to other life-course problems (Plomin & Crabbe, 2000; Tremblay et al., 2004). Thus, when people can choose to become conscious of their genetic risks and strengths, the opportunity to intervene early will open up new possibilities for both parents and children. In the words of Lykken (Lykken & Csikszentmihalyi, 2001): “Imagine a five-year-old boy whose score on the genetic bell curve of fearfulness is at the very low end. Because he does not respond well to punishment, the average parent will not be able to socialize that boy; but, in the streets, his fearlessness will make him a leader and, later, a criminal if he survives. With a clever parent who works with pride instead of punishment that boy may grow to be a brave policeman, an astronaut, a
44
also deficits in executive functioning (Coolidge et al., 2004; Jang et al., 2003; Kato & Pedersen, 2005; Krueger et al., 2003; Lensvelt Mulders & Hettema, 2001; Loehlin et al., 2005; Spotts et al., 2005). The associations with leadership styles, anxiety disorders, divorce risk, abnormal personality, coping skills, health promoting behaviors, sleep disturbances and drug use have also, in part, been found to be influenced by the same set of genes that influences normal personality (Agrawal et al., 2004; Boomsma et al., 2000; Heath et al., 1998; Hettema et al., 2004; Jang & Livesley, 1999; Jockin et al., 1996; Johnson et al., 2004; Kato & Pedersen, 2005; van Os et al., 2001). Research identifying genes that contribute to personality is therefore in an excellent position to stimulate the use of a “holistic approach to personality”, which thus far has been mainly performed in designs that are not genetically informed. A holistic approach to personality emphasizes the importance of studying more comprehensive wholes of the person-environment system as a unit, and is therefore bound to benefit from the identification of genes or other biomarkers that can link together different domains in the person-environment system (Bergman, 2000; Bronfenbrenner & Ceci, 1994; Kendler et al., 2006; Kerr & Stattin, 2003; Magnusson, 1999; Plomin & Asbury, 2005; Rutter et al., 2006; Stattin & Magnusson, 1996).
27864 Avhandling_inlaga.indd 44 1/28/08 9:19:55 AM

45
Part III
This part summarizes why it is of interest to identify candidate genes for behavior from a developmental perspective, and gives a brief overview of biological pathways that have been associated with personality. The main problems associated with genetic research on personality and the methodological advantages that becomes available when using iris characteristics will also be highlighted.
3.1 Why do we need to identify candidate genes for personality? As discussed earlier, the most obvious reason for identifying genes that contribute to personality is that our tendency to score high or low on a personality trait is substantially influenced by our genetic propensities. Approximately 40% of the variance for personality is genetic in origin. Furthermore, almost all genetic influences on personality at one point in time are also active at another, and the same genes that influence personality also influence how we create and experience the environment. For example, the genes that influence normal personality also influence the following behaviors: children’s experiences of parenting, life events, adults’ marital satisfaction, job satisfaction, monitoring, situation-specific conflicts, traumatic life events, deficits in executive functioning, leadership styles, anxiety disorders, divorce risk, abnormal personality, coping skills, health promoting behaviors, sleep disturbances, and drug use (Agrawal et al., 2004; Boomsma et al., 2000; Coolidge et al., 2004; Heath et al., 1998; Hettema et al., 2004; Jang & Livesley, 1999; Jang et al., 2003; Jockin et al., 1996; Johnson et al., 2004; Kato & Pedersen, 2005; Krueger et al., 2003; Lensvelt Mulders & Hettema, 2001; Loehlin et al., 2005; Spotts et al., 2005; van Os et al., 2001); (Ilies & Judge, 2003); (Saudino et al., 1997). Thus, by identifying candidate genes for personality a fuller understanding of our psychological functioning at large may emerge. From a developmental perspective, this understanding is especially important. Once gene-behavior associations are “firmly” established (Plomin and Crabbe, 2000, p. 822) one of the most important developmental benefits of DNA is that genetic vulnerabilities as well as genetic strengths can be assessed early in life, which creates an opportunity for early prevention. Currently, targeted interventions tend to wait until depression, and aggressive and antisocial behaviors, are diagnosed in school. By then, such behaviors are often hard to change and often lead to other life-course problems (Plomin & Crabbe, 2000; Tremblay et al., 2004). Thus, when people can choose to become conscious of their genetic risks and strengths, the opportunity to intervene early will open up new possibilities for both parents and children. In the words of Lykken (Lykken & Csikszentmihalyi, 2001): “Imagine a five-year-old boy whose score on the genetic bell curve of fearfulness is at the very low end. Because he does not respond well to punishment, the average parent will not be able to socialize that boy; but, in the streets, his fearlessness will make him a leader and, later, a criminal if he survives. With a clever parent who works with pride instead of punishment that boy may grow to be a brave policeman, an astronaut, a
44
also deficits in executive functioning (Coolidge et al., 2004; Jang et al., 2003; Kato & Pedersen, 2005; Krueger et al., 2003; Lensvelt Mulders & Hettema, 2001; Loehlin et al., 2005; Spotts et al., 2005). The associations with leadership styles, anxiety disorders, divorce risk, abnormal personality, coping skills, health promoting behaviors, sleep disturbances and drug use have also, in part, been found to be influenced by the same set of genes that influences normal personality (Agrawal et al., 2004; Boomsma et al., 2000; Heath et al., 1998; Hettema et al., 2004; Jang & Livesley, 1999; Jockin et al., 1996; Johnson et al., 2004; Kato & Pedersen, 2005; van Os et al., 2001). Research identifying genes that contribute to personality is therefore in an excellent position to stimulate the use of a “holistic approach to personality”, which thus far has been mainly performed in designs that are not genetically informed. A holistic approach to personality emphasizes the importance of studying more comprehensive wholes of the person-environment system as a unit, and is therefore bound to benefit from the identification of genes or other biomarkers that can link together different domains in the person-environment system (Bergman, 2000; Bronfenbrenner & Ceci, 1994; Kendler et al., 2006; Kerr & Stattin, 2003; Magnusson, 1999; Plomin & Asbury, 2005; Rutter et al., 2006; Stattin & Magnusson, 1996).
27864 Avhandling_inlaga.indd 45 1/28/08 9:19:55 AM

47
for creating receptors that receive those signals, for channels that allow ions to pass in and/out of a cell, and for many other functions (Hood & Galas, 2003). Increased knowledge about the function of these mechanisms will, according to the bottom-up strategies used, bring new understanding to how different brain mechanisms develop and ultimately close the circle of causation, by pinpointing exactly which molecular mechanisms influence the phenotype under study. Understanding the functional nature of allelic differences in genes is, for example, very important when tailoring psychochemical drugs for the individual, because it is difficult to know how to promote health if you do not know exactly which mechanisms are involved. For this reason, bottom-up perspectives emphasize that top-down approaches – which map specific genes to a behavioral phenotype directly – are only the first step. Finer-scale analysis at the molecular level needs to be performed to reveal the multiple changes that in many cases underlie what may appear to be a single genetic factor (Fisher, 2006; Phillips, 1999; Sali & Kuriyan, 1999). At a slightly higher level, molecular changes in the synapses and the transmission of neurotransmitters between nerve cells have been the focus of much personality research. However, genetic influences on personality involve much more than neurotransmission at the synaptic level. Higher levels of analysis are also needed, such as understanding the firing pattern across different neurons and across different brain regions (Davidson, 1992; Edelman, 1993; Lutz et al., 2004). But functional genomic analyses of the behavior of the whole organism are also needed. For example, top-down strategies performed by behavioral genomics can use theories of personality to pinpoint where specific genes or other biomarkers have their effects in terms of psychological processes, without reference to the mechanisms at the cellular level of analysis (Plomin & Crabbe, 2000). Indeed, historically the main goal of the most influential personality models has been to attribute specific brain circuits to their behavioral dimensions. For example, Eysenck’s postulates that a structure in the brain steam – the ascending reticular activating system (ARAS) – controls the overall cortical arousal, and that the difference in sensitivity to stimuli between introverts and extroverts depends on this hypothesized gateway (Eysenck, 1967; Eysenck & Eysenck, 1985). Likewise, Gray postulates that the brain holds behavioral activation and inhibition systems that are specialized in recognizing cues for reward and punishment, and which in turn influence individual differences in withdrawal- and approach-related behaviors (Gray, 1972; Gray, 1975; Gray, 1990). A considerable amount of work has gone into identifying the brain structures that underpin withdrawal- and approach-related behaviors, and hemispheric asymmetries in the functioning of the anterior cingulate gyrus appear to play a major role (as will be discussed in parts VI and V). Thus, given the historical emphasis on attributing structural brain differences to personality differences, it would not be surprising if the focus for genetic personality research soon would be to attribute genes with a tissue-specific effect on the brain hemisphere to personality; to find the relevant genes and regulatory regions that are responsible for those differences. However, about one third of our 20-25,000 genes or so (Stein, 2004) are expressed in the brain; how these genes work together to create tissue-specific effects are largely unknown. For this reason most genetic personality
46
reform politician. The hero and the psychopath are twigs on the same genetic branch” (p. 471).
Thus, representatives of behavioral genetics predict that DNA research in the future will be used as an early warning system that will facilitate the development of primary interventions that prevent or at least improve disorders before they occur (Rutter & Plomin, 1997). They believe that, with the development of genetically informed behavior-based interventions that start in childhood, psychotherapists will be able to educate parents to prevent the consequence of gene expression by using gene-based treatments tailored for the individual (Plomin & Rutter, 1998). Furthermore, because humans are biologically wired to live in groups and our well-being is dependent on how we work as social beings, such early preventions are expected to be behavioral and environmental rather than biological by nature (Plomin, 2005). However, to materialize these possibilities, the specific genes which are responsible for the genetic contribution to personality need to be identified. The different strategies that aim to identify the genetic pathways that influence personality are described within the theoretical framework of functional genomics. 3.2 Functional Genomics The goal of the field of functional genomics is to identify the mechanisms by which genes, at different levels of analysis, influence characteristics such as behavior. Both bottom-up and top-down strategies are used (Figure 3).
Bottom-up strategies begin with molecules, asking how genes work at the cellular level, and hope eventually to trace pathways from the gene through the brain and finally on to behavior. This is a long road to travel, which links nucleotide variation at multiple alleles to the three-dimensional structures of amino acids: a key to understanding how amino acids are strung together into polypeptides with a vast range of differing functions. For example, polypeptides are necessary for catalyzing biochemical reactions, for the structure of movement of cells, for sending out signals to other cells,
Functional genomics includes all levels of analysis – from genetics and molecular biology to neuroscience, psychology, and behavior. The higher levels of analysis are referred to as behavioral genomics in order to emphasize the importance of top-down analyses of pathways between genes and behavior. Adapted from Plomin et al. (2000).
Behavior
Functional Genomics
Genetics Molecular biology
Neuroscience Psychology
Behavioral Genomics
Figure 3
27864 Avhandling_inlaga.indd 46 1/28/08 9:19:55 AM

47
for creating receptors that receive those signals, for channels that allow ions to pass in and/out of a cell, and for many other functions (Hood & Galas, 2003). Increased knowledge about the function of these mechanisms will, according to the bottom-up strategies used, bring new understanding to how different brain mechanisms develop and ultimately close the circle of causation, by pinpointing exactly which molecular mechanisms influence the phenotype under study. Understanding the functional nature of allelic differences in genes is, for example, very important when tailoring psychochemical drugs for the individual, because it is difficult to know how to promote health if you do not know exactly which mechanisms are involved. For this reason, bottom-up perspectives emphasize that top-down approaches – which map specific genes to a behavioral phenotype directly – are only the first step. Finer-scale analysis at the molecular level needs to be performed to reveal the multiple changes that in many cases underlie what may appear to be a single genetic factor (Fisher, 2006; Phillips, 1999; Sali & Kuriyan, 1999). At a slightly higher level, molecular changes in the synapses and the transmission of neurotransmitters between nerve cells have been the focus of much personality research. However, genetic influences on personality involve much more than neurotransmission at the synaptic level. Higher levels of analysis are also needed, such as understanding the firing pattern across different neurons and across different brain regions (Davidson, 1992; Edelman, 1993; Lutz et al., 2004). But functional genomic analyses of the behavior of the whole organism are also needed. For example, top-down strategies performed by behavioral genomics can use theories of personality to pinpoint where specific genes or other biomarkers have their effects in terms of psychological processes, without reference to the mechanisms at the cellular level of analysis (Plomin & Crabbe, 2000). Indeed, historically the main goal of the most influential personality models has been to attribute specific brain circuits to their behavioral dimensions. For example, Eysenck’s postulates that a structure in the brain steam – the ascending reticular activating system (ARAS) – controls the overall cortical arousal, and that the difference in sensitivity to stimuli between introverts and extroverts depends on this hypothesized gateway (Eysenck, 1967; Eysenck & Eysenck, 1985). Likewise, Gray postulates that the brain holds behavioral activation and inhibition systems that are specialized in recognizing cues for reward and punishment, and which in turn influence individual differences in withdrawal- and approach-related behaviors (Gray, 1972; Gray, 1975; Gray, 1990). A considerable amount of work has gone into identifying the brain structures that underpin withdrawal- and approach-related behaviors, and hemispheric asymmetries in the functioning of the anterior cingulate gyrus appear to play a major role (as will be discussed in parts VI and V). Thus, given the historical emphasis on attributing structural brain differences to personality differences, it would not be surprising if the focus for genetic personality research soon would be to attribute genes with a tissue-specific effect on the brain hemisphere to personality; to find the relevant genes and regulatory regions that are responsible for those differences. However, about one third of our 20-25,000 genes or so (Stein, 2004) are expressed in the brain; how these genes work together to create tissue-specific effects are largely unknown. For this reason most genetic personality
46
reform politician. The hero and the psychopath are twigs on the same genetic branch” (p. 471).
Thus, representatives of behavioral genetics predict that DNA research in the future will be used as an early warning system that will facilitate the development of primary interventions that prevent or at least improve disorders before they occur (Rutter & Plomin, 1997). They believe that, with the development of genetically informed behavior-based interventions that start in childhood, psychotherapists will be able to educate parents to prevent the consequence of gene expression by using gene-based treatments tailored for the individual (Plomin & Rutter, 1998). Furthermore, because humans are biologically wired to live in groups and our well-being is dependent on how we work as social beings, such early preventions are expected to be behavioral and environmental rather than biological by nature (Plomin, 2005). However, to materialize these possibilities, the specific genes which are responsible for the genetic contribution to personality need to be identified. The different strategies that aim to identify the genetic pathways that influence personality are described within the theoretical framework of functional genomics. 3.2 Functional Genomics The goal of the field of functional genomics is to identify the mechanisms by which genes, at different levels of analysis, influence characteristics such as behavior. Both bottom-up and top-down strategies are used (Figure 3).
Bottom-up strategies begin with molecules, asking how genes work at the cellular level, and hope eventually to trace pathways from the gene through the brain and finally on to behavior. This is a long road to travel, which links nucleotide variation at multiple alleles to the three-dimensional structures of amino acids: a key to understanding how amino acids are strung together into polypeptides with a vast range of differing functions. For example, polypeptides are necessary for catalyzing biochemical reactions, for the structure of movement of cells, for sending out signals to other cells,
Functional genomics includes all levels of analysis – from genetics and molecular biology to neuroscience, psychology, and behavior. The higher levels of analysis are referred to as behavioral genomics in order to emphasize the importance of top-down analyses of pathways between genes and behavior. Adapted from Plomin et al. (2000).
Behavior
Functional Genomics
Genetics Molecular biology
Neuroscience Psychology
Behavioral Genomics
Figure 3
27864 Avhandling_inlaga.indd 47 1/28/08 9:19:56 AM

49
initial studies and affected the scores in these domains by about 10%, or 0.4 standard deviation (d=.40) (Cohen, 1988), which is considered a moderate effect. Enthusiasm in the field flourished when these initial studies were published. More than 50 studies investigating DRD4’s association with Novelty Seeking were published between 1996 and 1998, when it was believed that – by the turn of the century - personality researchers would routinely use reliable DNA markers as tools in their research (Plomin & Caspi, 1998). However, the association between DRD4 and Novelty Seeking has not been consistently replicated. A meta-analytic review of 20 studies (n=3,907) revealed that there was no general association between DRD4 polymorphism and Novelty Seeking (average d=0.06 with 96% CI of +/- 0.09). Thirteen reports suggest that the presence of longer alleles is associated with higher Novelty Seeking scores and seven reports suggest the opposite (i.e. that shorter not longer alleles are associated with higher Novelty Seeking scores). This means that there is true heterogeneity among studies, and that unknown moderator exists. Furthermore, the search for genetic moderators has not yielded any reasonable explanations for the inconsistent results (Kluger et al., 2002). Nevertheless, new data suggest that DRD4 may still be relevant to personality. As many as 9 of 11 studies suggest that the C-521T polymorphism in the regulatory region of DRD4 is associated with Novelty Seeking, and – if this finding is replicated in additional studies – it may turn out to explain about 3% of the variance (Munafo et al., 2007). 3.3.3 Serotonin pathways The second personality trait identified in Cloninger’s model is Harm Avoidance, which is hypothesized to be associated with abnormalities in serotonin metabolism (Cloninger, 1987). The neurotransmitter serotonin is expressed heavily in cortical and limbic areas of the brain, and is thought to function as an inhibition system, which produces feelings of non-reward and anxiety. For examples, male monkeys with low social status have lower levels of serotonin in their nervous system than monkeys with high social status (Raleigh et al., 1991). Administration of serotonin uptake inhibitors such as Prozac, which increases the levels of serotonin in the nervous system, typically increases anxiety initially, but gradually, when the nervous system has adjusted to the higher serotonin level, decreases anxiety in stressful situations (Murphy et al., 1998). Thus, in both humans and primates altered serotonin levels seem to be related to negative emotional states such as depression, anxiety and hostility, and to social behaviors such as dominance, aggression and affiliation of peers (Graeff et al., 1996; Knutson et al., 1998). Consistent with these findings, anxiety-related traits such as Harm Avoidance and Neuroticism in the personality questionnaire NEO-PI-R (Costa & McCrea, 1992) have been associated with different tandem repeats (multiple copies of the same DNA sequence) in the regulatory region of the serotonin transporter gene (Hamer et al., 1999; Lesch et al., 1996; Sen et al., 2004). Indeed, a recent meta-analysis (n=5,629) confirmed that the serotonin transporter gene was associated with anxiety-related traits, at least as measured by Neuroticism in NEO-PI-R (Costa & McCrea, 1992; Sen et al., 2004; Willis-Owen et al., 2005).
48
research has not yet tried to find genes and promoter regions that influence the structural level of analysis. Instead, mainly because drugs that influence neurotransmission are effective in treating different psychopathological states, the focus has been on genes that influence neurotransmission. 3.3.1 Neurotransmission and genetic pathways associated with personality One of the most thoroughly genetically researched personality models is Cloninger’s psychobiological model of temperament and character. Here, it will serve the purpose of exemplifying what typically has been found when genes and enzymes that influence neurotransmission have been associated with personality. Cloninger’s model proposes that personality is composed of four temperament domains and three character domains. The temperament domains manifest themselves early in life and function as unconscious biases in perceptual learning and habit formation. Each of these is hypothesized by Cloninger to be influenced by a unique genetically controlled neurotransmitter system. Specifically, Novelty Seeking is hypothesized to be controlled by the dopaminergic system, Harm Avoidance by the serotonergic system, and Reward Dependence by the noradrenergic system. A fourth temperamental domain called Persistence has also been suggested, but no neurotransmitter system has yet been hypothesized (Cloninger & Svrakic, 1997). 3.3.2 Dopamine pathways The neurotransmitter dopamine is associated with feelings of reward. For example, animals will work to obtain doses of dopamine in a similar way as they would work to obtain food (Hamer, 1997). Drugs such as cocaine and amphetamine which mimic dopamine in the nervous system account for the pleasure of taking them (Di Chiara et al., 2004). Consequently, people who score high on Novelty Seeking are assumed to compensate for a low dopamine dosage by behaviorally engaging in risky and unfamiliar situations which make them experience extra strong rewards when they succeed and thereby increase production of dopamine in the nervous system. Individuals with normal levels of dopamine, on the other hand, are expected to shy away from risks and the unfamiliar because such activities tend to boost their dopamine level to uncomfortable levels (Cloninger et al., 1993). In 1996 the first gene associated with Novelty Seeking was identified. Forty-eight base pairs in the third exon in the dopamine receptor gene DRD4 repeat from 2 to 8 times, and since the longer DRD4 repeats (6-8 repeats) are less efficient at binding dopamine, individuals with the long repeat were found to scored higher on Novelty Seeking (Ebstein et al., 1996). This finding was simultaneously replicated in another sample containing sib-pairs (n=350) completing another personality instrument (NEO-PIR, Costa & McCrea., 1992) where the direction of the association between DRD4 and the scales Extraversion and Conscientiousness were in accordance with the expectation in Ebstein’s (1996) study. That is, long exon III alleles showed a positive association with Extraversion and a negative association with Conscientiousness (Benjamin et al., 1996). Repeat variations in DRD4 explained about 4% of the total variance in these
27864 Avhandling_inlaga.indd 48 1/28/08 9:19:56 AM

49
initial studies and affected the scores in these domains by about 10%, or 0.4 standard deviation (d=.40) (Cohen, 1988), which is considered a moderate effect. Enthusiasm in the field flourished when these initial studies were published. More than 50 studies investigating DRD4’s association with Novelty Seeking were published between 1996 and 1998, when it was believed that – by the turn of the century - personality researchers would routinely use reliable DNA markers as tools in their research (Plomin & Caspi, 1998). However, the association between DRD4 and Novelty Seeking has not been consistently replicated. A meta-analytic review of 20 studies (n=3,907) revealed that there was no general association between DRD4 polymorphism and Novelty Seeking (average d=0.06 with 96% CI of +/- 0.09). Thirteen reports suggest that the presence of longer alleles is associated with higher Novelty Seeking scores and seven reports suggest the opposite (i.e. that shorter not longer alleles are associated with higher Novelty Seeking scores). This means that there is true heterogeneity among studies, and that unknown moderator exists. Furthermore, the search for genetic moderators has not yielded any reasonable explanations for the inconsistent results (Kluger et al., 2002). Nevertheless, new data suggest that DRD4 may still be relevant to personality. As many as 9 of 11 studies suggest that the C-521T polymorphism in the regulatory region of DRD4 is associated with Novelty Seeking, and – if this finding is replicated in additional studies – it may turn out to explain about 3% of the variance (Munafo et al., 2007). 3.3.3 Serotonin pathways The second personality trait identified in Cloninger’s model is Harm Avoidance, which is hypothesized to be associated with abnormalities in serotonin metabolism (Cloninger, 1987). The neurotransmitter serotonin is expressed heavily in cortical and limbic areas of the brain, and is thought to function as an inhibition system, which produces feelings of non-reward and anxiety. For examples, male monkeys with low social status have lower levels of serotonin in their nervous system than monkeys with high social status (Raleigh et al., 1991). Administration of serotonin uptake inhibitors such as Prozac, which increases the levels of serotonin in the nervous system, typically increases anxiety initially, but gradually, when the nervous system has adjusted to the higher serotonin level, decreases anxiety in stressful situations (Murphy et al., 1998). Thus, in both humans and primates altered serotonin levels seem to be related to negative emotional states such as depression, anxiety and hostility, and to social behaviors such as dominance, aggression and affiliation of peers (Graeff et al., 1996; Knutson et al., 1998). Consistent with these findings, anxiety-related traits such as Harm Avoidance and Neuroticism in the personality questionnaire NEO-PI-R (Costa & McCrea, 1992) have been associated with different tandem repeats (multiple copies of the same DNA sequence) in the regulatory region of the serotonin transporter gene (Hamer et al., 1999; Lesch et al., 1996; Sen et al., 2004). Indeed, a recent meta-analysis (n=5,629) confirmed that the serotonin transporter gene was associated with anxiety-related traits, at least as measured by Neuroticism in NEO-PI-R (Costa & McCrea, 1992; Sen et al., 2004; Willis-Owen et al., 2005).
48
research has not yet tried to find genes and promoter regions that influence the structural level of analysis. Instead, mainly because drugs that influence neurotransmission are effective in treating different psychopathological states, the focus has been on genes that influence neurotransmission. 3.3.1 Neurotransmission and genetic pathways associated with personality One of the most thoroughly genetically researched personality models is Cloninger’s psychobiological model of temperament and character. Here, it will serve the purpose of exemplifying what typically has been found when genes and enzymes that influence neurotransmission have been associated with personality. Cloninger’s model proposes that personality is composed of four temperament domains and three character domains. The temperament domains manifest themselves early in life and function as unconscious biases in perceptual learning and habit formation. Each of these is hypothesized by Cloninger to be influenced by a unique genetically controlled neurotransmitter system. Specifically, Novelty Seeking is hypothesized to be controlled by the dopaminergic system, Harm Avoidance by the serotonergic system, and Reward Dependence by the noradrenergic system. A fourth temperamental domain called Persistence has also been suggested, but no neurotransmitter system has yet been hypothesized (Cloninger & Svrakic, 1997). 3.3.2 Dopamine pathways The neurotransmitter dopamine is associated with feelings of reward. For example, animals will work to obtain doses of dopamine in a similar way as they would work to obtain food (Hamer, 1997). Drugs such as cocaine and amphetamine which mimic dopamine in the nervous system account for the pleasure of taking them (Di Chiara et al., 2004). Consequently, people who score high on Novelty Seeking are assumed to compensate for a low dopamine dosage by behaviorally engaging in risky and unfamiliar situations which make them experience extra strong rewards when they succeed and thereby increase production of dopamine in the nervous system. Individuals with normal levels of dopamine, on the other hand, are expected to shy away from risks and the unfamiliar because such activities tend to boost their dopamine level to uncomfortable levels (Cloninger et al., 1993). In 1996 the first gene associated with Novelty Seeking was identified. Forty-eight base pairs in the third exon in the dopamine receptor gene DRD4 repeat from 2 to 8 times, and since the longer DRD4 repeats (6-8 repeats) are less efficient at binding dopamine, individuals with the long repeat were found to scored higher on Novelty Seeking (Ebstein et al., 1996). This finding was simultaneously replicated in another sample containing sib-pairs (n=350) completing another personality instrument (NEO-PIR, Costa & McCrea., 1992) where the direction of the association between DRD4 and the scales Extraversion and Conscientiousness were in accordance with the expectation in Ebstein’s (1996) study. That is, long exon III alleles showed a positive association with Extraversion and a negative association with Conscientiousness (Benjamin et al., 1996). Repeat variations in DRD4 explained about 4% of the total variance in these
27864 Avhandling_inlaga.indd 49 1/28/08 9:19:56 AM

51
beta-hydroxylase, which is stable after age 6, may be a generationally transmitted biological consequence of maltreatment early in life, associated with conduct disorders, aggressive behavior, and behavioral disorders in boys. Thus, more extreme environmental conditions in childhood, which on a daily basis alert the fight-and-flight system, may prime the development of the sympathetic nervous system in other ways than would be the case in more normal environments (Hart et al., 2007). As mentioned earlier, both genetic and environmental thresholds for how much the individual is affected by more extreme environmental conditions are likely to play a role for the functioning of our neurotransmission systems; the functioning of the noradrenergic system is evidently sensitive to such environmental influences. Attention has also been directed toward identifying adrenergic receptor genes, and some of them seem to be associated with personality (Bobb et al., 2005; Comings et al., 1999). One study showed an association between the adrenergic2A receptor gene (ADRA2A) and vigilance, irritability, hostility, verbal aggression and impulsivity, lending support to Cloninger’s hypothesis that Reward dependence is associated with the noradrenergic system. However, these findings have not yet been replicated. The behavioral effect of adrenergic polymorphism is about the same as for genes that are associated with the dopamine and serotonin systems. Variation in ADRA2A accounts for about 1.8-8.3% of the variance for these personality traits (Comings et al., 1999). 3.4.1 Monoamine metabolisms pathways Enzymes that influence the neurotransmission systems also play a role in genetic regulation of personality. Here follows a brief overview of the findings for two of the most thoroughly researched, namely the enzymes, catechol-o-methyltransferase (COMT) and monoamine oxidase (MAO), which converts serotonin, dopamine, noradrenalin and epinephrine into inactive chemicals. 3.4.2 Catechol-O-methyltransferase (COMT) COMT is an enzyme that breaks down dopamine and noradrenalin. A three-to-four-fold variation of its activity is due to a G A single nucleotide polymorphism (SNP) transition at codon 158 of the COMT gene (val158met). The homozygous G allele (G/G) breaks down more dopamine and noradrenalin from the synaptic cleft than heterozygotes (G/A) or homozygotes (A/A) for the A allele (Lachman et al., 1996; Syvanen et al., 1997). Accordingly, this allele has been associated with aggressive behavior and emotional regulation. For example, male schizophrenics with the low activity 158A allele have a higher risk of aggressive behaviors, and variation in this allele can differentiate between outwardly and inwardly expressed anger among suicide attempters (Kotler et al., 1999; Lachman et al., 1998; Strous et al., 1997) (Rujescu et al., 2003). Furthermore, COMT knockout female mice display impairment in their emotional reactivity compared to males, which are more aggressive. Associations with Novelty Seeking have been confined to females, suggesting a gender specific effect for the COMT gene (Enoch et al., 2003; Gogos et al., 1998). However, when COMT has been associated with severe affective disorders (Kirov et al., 1998; Li et al., 1997; Mynett-Johnson et al., 1998; Ohara et al., 1998; Papolos et al., 1998), as well as
50
However, the direction of the effect is the opposite from what may be expected when the molecular mechanism for serotonin reuptake blockers such as Prozac is considered. That is, since the long homozygous allele (l/l) removes twice as much serotonin from the synaptic cleft as heterozygotes (s/l), or homozygotes (s/s) for the short allele, individuals with the long allele should score higher on Neuroticism (Lesch et al., 1996). Nevertheless, it is individuals with the short alleles who score higher on Neuroticism in most studies, despite the fact that short alleles are associated with more abundant transmission of serotonin (Sen et al., 2004). This means that a genetic moderator also exists for the serotonin pathway, and just as for DRD4 in the dopaminergic system, the search for genetic moderators has not been successful. The behavioral effect of the serotonin transporter gene is about the same as was found for DRD4 in the two initial studies. At most 5% of the variance in Neuroticism is expected to be explained by allele differences in the serotonin transporter gene (Sen et al., 2004). 3.3.4 Noradrenergic pathways Reward dependence in Cloninger’s personality model is hypothesized to be associated with the noradrenergic system, which influences people’s arousal level and is thought to play a role in “fight or flight” responses (Cloninger, 1987). Noradrenalin is synthesized from dopamine by dopamine-beta-hydroxylase and is the major neurotransmitter of the sympathetic nervous system. Noradrenalin is also catalyzed into epinephrine, another contributor to sympathetic “flight or fight” responses. Lower levels of dopamine-beta-hydroxylase lead to elevated levels of dopamine and noradrenalin, which may explain why a lower level of dopamine-beta-hydroxylase in blood is associated with an increased vulnerability to psychotic symptoms (Cubells & Zabetian, 2004). However, in the normal range of personality low dopamine-beta-hydroxylase levels are hypothesized to be associated with low scores on Reward dependence, which measure the extent the individual is engaged in tough-minded, cold and socially insensitive behaviors. Alcoholics with a low dopamine-beta hydroxylase dosage in their blood and in cerebrospinal fluids have, for example, been found to be more suspicious and avoidant of emotional involvement with others, lending some support to Cloninger’s hypothesis (Major et al., 1980). Two excellent candidate genes for dopamine-beta-hydroxylase activity have been identified, but thus far no dopamine-beta-hydroxylase polymorphisms have been associated with personality (Cubells & Zabetian, 2004). Despite the fact that dopamine-beta hydroxylase dosage in the blood varies widely across unrelated individuals (Weinmaster, 1997) and a single locus is estimated to account for 46-75% of its variation in the adult population (Wilson et al., 1990), it appears as if early environmental experiences also can influence the dopamine beta-hydroxylase level. Low dopamine-beta-hydroxylase dosages in blood among children at age 12 are linked to maltreatment before age 6, as well as conduct disorder and aggressive behavior in school at age 12 (Galvin et al., 1995). Furthermore, youths with behavioral disorders and antisocial, substance-abusing fathers have shown significantly lower dopamine-beta-hydroxylase levels than control subjects with substance-abusing, non-antisocial fathers (Gabel et al., 1995). This means that low dosage of dopamine-
27864 Avhandling_inlaga.indd 50 1/28/08 9:19:57 AM

51
beta-hydroxylase, which is stable after age 6, may be a generationally transmitted biological consequence of maltreatment early in life, associated with conduct disorders, aggressive behavior, and behavioral disorders in boys. Thus, more extreme environmental conditions in childhood, which on a daily basis alert the fight-and-flight system, may prime the development of the sympathetic nervous system in other ways than would be the case in more normal environments (Hart et al., 2007). As mentioned earlier, both genetic and environmental thresholds for how much the individual is affected by more extreme environmental conditions are likely to play a role for the functioning of our neurotransmission systems; the functioning of the noradrenergic system is evidently sensitive to such environmental influences. Attention has also been directed toward identifying adrenergic receptor genes, and some of them seem to be associated with personality (Bobb et al., 2005; Comings et al., 1999). One study showed an association between the adrenergic2A receptor gene (ADRA2A) and vigilance, irritability, hostility, verbal aggression and impulsivity, lending support to Cloninger’s hypothesis that Reward dependence is associated with the noradrenergic system. However, these findings have not yet been replicated. The behavioral effect of adrenergic polymorphism is about the same as for genes that are associated with the dopamine and serotonin systems. Variation in ADRA2A accounts for about 1.8-8.3% of the variance for these personality traits (Comings et al., 1999). 3.4.1 Monoamine metabolisms pathways Enzymes that influence the neurotransmission systems also play a role in genetic regulation of personality. Here follows a brief overview of the findings for two of the most thoroughly researched, namely the enzymes, catechol-o-methyltransferase (COMT) and monoamine oxidase (MAO), which converts serotonin, dopamine, noradrenalin and epinephrine into inactive chemicals. 3.4.2 Catechol-O-methyltransferase (COMT) COMT is an enzyme that breaks down dopamine and noradrenalin. A three-to-four-fold variation of its activity is due to a G A single nucleotide polymorphism (SNP) transition at codon 158 of the COMT gene (val158met). The homozygous G allele (G/G) breaks down more dopamine and noradrenalin from the synaptic cleft than heterozygotes (G/A) or homozygotes (A/A) for the A allele (Lachman et al., 1996; Syvanen et al., 1997). Accordingly, this allele has been associated with aggressive behavior and emotional regulation. For example, male schizophrenics with the low activity 158A allele have a higher risk of aggressive behaviors, and variation in this allele can differentiate between outwardly and inwardly expressed anger among suicide attempters (Kotler et al., 1999; Lachman et al., 1998; Strous et al., 1997) (Rujescu et al., 2003). Furthermore, COMT knockout female mice display impairment in their emotional reactivity compared to males, which are more aggressive. Associations with Novelty Seeking have been confined to females, suggesting a gender specific effect for the COMT gene (Enoch et al., 2003; Gogos et al., 1998). However, when COMT has been associated with severe affective disorders (Kirov et al., 1998; Li et al., 1997; Mynett-Johnson et al., 1998; Ohara et al., 1998; Papolos et al., 1998), as well as
50
However, the direction of the effect is the opposite from what may be expected when the molecular mechanism for serotonin reuptake blockers such as Prozac is considered. That is, since the long homozygous allele (l/l) removes twice as much serotonin from the synaptic cleft as heterozygotes (s/l), or homozygotes (s/s) for the short allele, individuals with the long allele should score higher on Neuroticism (Lesch et al., 1996). Nevertheless, it is individuals with the short alleles who score higher on Neuroticism in most studies, despite the fact that short alleles are associated with more abundant transmission of serotonin (Sen et al., 2004). This means that a genetic moderator also exists for the serotonin pathway, and just as for DRD4 in the dopaminergic system, the search for genetic moderators has not been successful. The behavioral effect of the serotonin transporter gene is about the same as was found for DRD4 in the two initial studies. At most 5% of the variance in Neuroticism is expected to be explained by allele differences in the serotonin transporter gene (Sen et al., 2004). 3.3.4 Noradrenergic pathways Reward dependence in Cloninger’s personality model is hypothesized to be associated with the noradrenergic system, which influences people’s arousal level and is thought to play a role in “fight or flight” responses (Cloninger, 1987). Noradrenalin is synthesized from dopamine by dopamine-beta-hydroxylase and is the major neurotransmitter of the sympathetic nervous system. Noradrenalin is also catalyzed into epinephrine, another contributor to sympathetic “flight or fight” responses. Lower levels of dopamine-beta-hydroxylase lead to elevated levels of dopamine and noradrenalin, which may explain why a lower level of dopamine-beta-hydroxylase in blood is associated with an increased vulnerability to psychotic symptoms (Cubells & Zabetian, 2004). However, in the normal range of personality low dopamine-beta-hydroxylase levels are hypothesized to be associated with low scores on Reward dependence, which measure the extent the individual is engaged in tough-minded, cold and socially insensitive behaviors. Alcoholics with a low dopamine-beta hydroxylase dosage in their blood and in cerebrospinal fluids have, for example, been found to be more suspicious and avoidant of emotional involvement with others, lending some support to Cloninger’s hypothesis (Major et al., 1980). Two excellent candidate genes for dopamine-beta-hydroxylase activity have been identified, but thus far no dopamine-beta-hydroxylase polymorphisms have been associated with personality (Cubells & Zabetian, 2004). Despite the fact that dopamine-beta hydroxylase dosage in the blood varies widely across unrelated individuals (Weinmaster, 1997) and a single locus is estimated to account for 46-75% of its variation in the adult population (Wilson et al., 1990), it appears as if early environmental experiences also can influence the dopamine beta-hydroxylase level. Low dopamine-beta-hydroxylase dosages in blood among children at age 12 are linked to maltreatment before age 6, as well as conduct disorder and aggressive behavior in school at age 12 (Galvin et al., 1995). Furthermore, youths with behavioral disorders and antisocial, substance-abusing fathers have shown significantly lower dopamine-beta-hydroxylase levels than control subjects with substance-abusing, non-antisocial fathers (Gabel et al., 1995). This means that low dosage of dopamine-
27864 Avhandling_inlaga.indd 51 1/28/08 9:19:57 AM

53
Such individuals are also at higher risk of externalizing antisocial behaviors and early onset substance abuse (Cloninger, 1994). One large study (n=1,551) indicated that the magnitude of the effect on personality associated with platelet MAO-B activity was about the same as for genes in the dopamine, serotonin and noradrenalin systems. Approximately 8% of the genetic variance for Neuroticism (as measured by EPQ, Eysenck and Eysenck, 1975), was due to the same genetic effects that contribute to variation in platelet MAO-B activity (Kirk et al., 2001). However, the association between platelet MAO-B activity and personality has been difficult to explain, because a direct association between platelet MAO-B activities in the blood and brain is lacking. No polymorphisms of the MAO-B gene have so far been associated with personality (Pivac et al., 2006), and MAO-B knockout mice do not behave much differently from controls. Furthermore, with age platelet MAO-B activity increases quite substantially in the brain without any obvious changes in personality (Winblad et al., 1979), and when MAO-B inhibitors are prescribed to Parkinson’s patients, which almost completely inhibit the platelet MAO-B activity in the brain, no obvious changes in personality have been observed. Accordingly, a great deal of effort has been invested to elucidate exactly how platelet MAO-B activity is linked to personality at the molecular level. For example, since the middle of the 1970s Oreland et al. have been searching for the mechanisms, and even though the transcription factor AP-2 (activator protein-2) may be involved in mediating the association, most of the biological mechanisms that are responsible for the association are still unknown (Damberg, 2005; Oreland & Hallman, 1995; Oreland et al., 2004; Oreland & Shaskan, 1983; Ruchkin et al., 2005; Wiberg et al., 1977). Thus, despite about 30 years of bottom-up research at the molecular level, to date there is no satisfactory explanation for the relationship between platelet MAO-B activity and personality (Damberg, 2005; Oreland & Hallman, 1995; Oreland et al., 2004; Oreland & Shaskan, 1983; Ruchkin et al., 2005; Wiberg et al., 1977).
3.5 Neurotransmission and personality – what has been established? The findings reviewed above indicate that there has been a considerable increase in research in the field since the first association between genes and personality were found 10 years ago. Much research has been performed that indicates that the genes and enzymes that influence the functioning of neurotransmitter systems also influence personality. However, the size of the literature does not indicate the amount of progress in the field, and there is still considerable confusion about what has been established (Ebstein, 2006; Munafo et al., 2005). First, it is questionable how useful the findings are, because the directions of the relationships tend to change in different samples. There are virtually no consistently replicated findings in large samples between a specific allelic variant for neurotransmission and a tendency for a person to score in a particular direction on a personality trait that is explicable in a satisfactory manner from a biological standpoint. Typically, when a new association between a allele that influences neurotransmission and personality is found, it does not hold in larger and/or replicating samples. Furthermore, in the case of the only consistently replicated finding – the association between short tandem repeats of the serotonin
52
anxiety disorders (Ohara et al., 1998), the findings are mixed. Several studies have failed to replicate the association (Gutierrez et al., 1997; Kunugi et al., 1997; Lachman et al., 1997), and typically large studies find no relationship (n=2327), not even when environmental risk factors that increase the possibility that individuals with a risk allele develop such behaviors is taken into account (Henderson et al., 2000; Kunugi et al., 1997). 3.4.3 Monoamine oxidase A and B Monoamine oxidase primarily breaks down serotonin and noradrenalin and comes in two variants, A and B, which are located on the outer mitochondrial membrane. These enzymes differ in their neurotransmitter metabolism and are present in all types of cells in varying proportions and concentration (Denney & Denney, 1985). However, MAO-B is the only form that is expressed in human blood cells. MAO-A is primarily expressed in the catecholaminegic neurons in the human brain. 3.4.4 MAO-A In humans, the MAO-A gene has a variable number of tandem repeats, producing high and low activity variants of the MAO-A enzyme. Alleles with 3.5 or 4 copies of a 30 base pair repeat sequence are transcribed 2-10 times more efficiently than alleles with 3 or 5 copies, suggesting an optimal length for the regulatory region (Sabol et al., 1998). Consequently, since the high activity 3.5 and 4 alleles neutralize more serotonin at the synaptic clefts in the brain, individuals with these polymorphisms tend to score higher on aggression, impulsivity and negative emotionality (Gade et al., 1998; Manor et al., 2002; Manuck et al., 2000). However, just as for the serotonin transporter gene, conflicting evidence has been reported as to whether the low or the high activity form of MAO-A tandem repeats are associated with increased risk behaviors. Maltreated children and monkeys that have grown up without their mothers demonstrated a significant association between the low-activity allelic forms and violent and aggressive behavior, despite the fact that the low-activity allelic form leaves more abundant levels of serotonin in the nervous system (Caspi et al., 2002; Foley et al., 2004; Newman et al., 2005). Thus, it appears as if the behavioral outcomes associated with high versus low MAO-A activity, just as dopamine-beta-hydroxylase dosage in the noradrenalin system, are sensitive to social experiences, and that the functional outcome depends on whether or not the individual has experienced maltreatment early in life. 3.4.5 MAO-B The association between personality and platelet MAO-B has been extensively studied using platelets easily obtainable from blood. Low platelet MAO-B activity is associated with individuals who can be described as impulsive, exploratory, curious, excitable, disorderly, distractible and having a high level of behavior activation (af Klinteberg et al., 1987; Howard et al., 1996).
27864 Avhandling_inlaga.indd 52 1/28/08 9:19:58 AM

53
Such individuals are also at higher risk of externalizing antisocial behaviors and early onset substance abuse (Cloninger, 1994). One large study (n=1,551) indicated that the magnitude of the effect on personality associated with platelet MAO-B activity was about the same as for genes in the dopamine, serotonin and noradrenalin systems. Approximately 8% of the genetic variance for Neuroticism (as measured by EPQ, Eysenck and Eysenck, 1975), was due to the same genetic effects that contribute to variation in platelet MAO-B activity (Kirk et al., 2001). However, the association between platelet MAO-B activity and personality has been difficult to explain, because a direct association between platelet MAO-B activities in the blood and brain is lacking. No polymorphisms of the MAO-B gene have so far been associated with personality (Pivac et al., 2006), and MAO-B knockout mice do not behave much differently from controls. Furthermore, with age platelet MAO-B activity increases quite substantially in the brain without any obvious changes in personality (Winblad et al., 1979), and when MAO-B inhibitors are prescribed to Parkinson’s patients, which almost completely inhibit the platelet MAO-B activity in the brain, no obvious changes in personality have been observed. Accordingly, a great deal of effort has been invested to elucidate exactly how platelet MAO-B activity is linked to personality at the molecular level. For example, since the middle of the 1970s Oreland et al. have been searching for the mechanisms, and even though the transcription factor AP-2 (activator protein-2) may be involved in mediating the association, most of the biological mechanisms that are responsible for the association are still unknown (Damberg, 2005; Oreland & Hallman, 1995; Oreland et al., 2004; Oreland & Shaskan, 1983; Ruchkin et al., 2005; Wiberg et al., 1977). Thus, despite about 30 years of bottom-up research at the molecular level, to date there is no satisfactory explanation for the relationship between platelet MAO-B activity and personality (Damberg, 2005; Oreland & Hallman, 1995; Oreland et al., 2004; Oreland & Shaskan, 1983; Ruchkin et al., 2005; Wiberg et al., 1977).
3.5 Neurotransmission and personality – what has been established? The findings reviewed above indicate that there has been a considerable increase in research in the field since the first association between genes and personality were found 10 years ago. Much research has been performed that indicates that the genes and enzymes that influence the functioning of neurotransmitter systems also influence personality. However, the size of the literature does not indicate the amount of progress in the field, and there is still considerable confusion about what has been established (Ebstein, 2006; Munafo et al., 2005). First, it is questionable how useful the findings are, because the directions of the relationships tend to change in different samples. There are virtually no consistently replicated findings in large samples between a specific allelic variant for neurotransmission and a tendency for a person to score in a particular direction on a personality trait that is explicable in a satisfactory manner from a biological standpoint. Typically, when a new association between a allele that influences neurotransmission and personality is found, it does not hold in larger and/or replicating samples. Furthermore, in the case of the only consistently replicated finding – the association between short tandem repeats of the serotonin
52
anxiety disorders (Ohara et al., 1998), the findings are mixed. Several studies have failed to replicate the association (Gutierrez et al., 1997; Kunugi et al., 1997; Lachman et al., 1997), and typically large studies find no relationship (n=2327), not even when environmental risk factors that increase the possibility that individuals with a risk allele develop such behaviors is taken into account (Henderson et al., 2000; Kunugi et al., 1997). 3.4.3 Monoamine oxidase A and B Monoamine oxidase primarily breaks down serotonin and noradrenalin and comes in two variants, A and B, which are located on the outer mitochondrial membrane. These enzymes differ in their neurotransmitter metabolism and are present in all types of cells in varying proportions and concentration (Denney & Denney, 1985). However, MAO-B is the only form that is expressed in human blood cells. MAO-A is primarily expressed in the catecholaminegic neurons in the human brain. 3.4.4 MAO-A In humans, the MAO-A gene has a variable number of tandem repeats, producing high and low activity variants of the MAO-A enzyme. Alleles with 3.5 or 4 copies of a 30 base pair repeat sequence are transcribed 2-10 times more efficiently than alleles with 3 or 5 copies, suggesting an optimal length for the regulatory region (Sabol et al., 1998). Consequently, since the high activity 3.5 and 4 alleles neutralize more serotonin at the synaptic clefts in the brain, individuals with these polymorphisms tend to score higher on aggression, impulsivity and negative emotionality (Gade et al., 1998; Manor et al., 2002; Manuck et al., 2000). However, just as for the serotonin transporter gene, conflicting evidence has been reported as to whether the low or the high activity form of MAO-A tandem repeats are associated with increased risk behaviors. Maltreated children and monkeys that have grown up without their mothers demonstrated a significant association between the low-activity allelic forms and violent and aggressive behavior, despite the fact that the low-activity allelic form leaves more abundant levels of serotonin in the nervous system (Caspi et al., 2002; Foley et al., 2004; Newman et al., 2005). Thus, it appears as if the behavioral outcomes associated with high versus low MAO-A activity, just as dopamine-beta-hydroxylase dosage in the noradrenalin system, are sensitive to social experiences, and that the functional outcome depends on whether or not the individual has experienced maltreatment early in life. 3.4.5 MAO-B The association between personality and platelet MAO-B has been extensively studied using platelets easily obtainable from blood. Low platelet MAO-B activity is associated with individuals who can be described as impulsive, exploratory, curious, excitable, disorderly, distractible and having a high level of behavior activation (af Klinteberg et al., 1987; Howard et al., 1996).
27864 Avhandling_inlaga.indd 53 1/28/08 9:19:58 AM
55
through a highly reliable life history calendar (Belli et al., 2001). The findings confirmed the hypothesis; individuals with one or two copies of the short allele exhibited more depressive symptoms, diagnosable depression and suicidality in relation to stressful life events than individuals with two copies of the long allele of the serotonin transporter gene. No main effect of having the short allele on depression was found. The specificity of the genetic effect was also checked. No interaction with the heritable component of life events or interaction between the MAO-A gene and childhood maltreatment, which also has been found in this sample (Caspi et al., 2002), applied longitudinally to the onset of depression. Thus, this epidemiological study provides evidence of a gene-environment interaction that can explain why some people are more likely than others to develop symptoms of depression when they experience stressful life events. The fact that these findings also have been replicated in most large studies (Rutter et al., 2006) suggests two things that have previously not been recognized (Caspi et al., 2003). First, personality traits that are related to psychopathology, instead of being influenced by many genes with small effects, may be influenced by fewer genes whose effect on a phenotype depends on whether they have been exposed to environmental risks. Second, gene-environment interactions such as these may have clinical implications. Although only 10% of the short allele carriers experienced more than four or more stressful life events (between age 21 and 26), they accounted for almost one-quarter (23%) of the 133 cases of diagnosed depression that were identified in this representative birth cohort. Furthermore, the results in the same sample with respect to high levels of MAO-A expression, early maltreatment and the development of antisocial problems followed the same pattern (Caspi et al., 2002). MAO-A was found to moderate the effect of maltreatment. Maltreated children with a high level of MAO-A enzyme expression were less likely to develop antisocial problems, whereas individuals with both a low-activity genotype and previous maltreatment were by far the most likely to have committed a violent crime or to be diagnosed with conduct disorders. Over 85% of the males who had both “bad genes” and “bad environment” developed some form of antisocial behavior by the time they were 26. In contrast, the environmental effect of maltreatment (in samples where the subjects’ genotype is not considered) typically increases the risk of later criminality by about 50%, which is not enough to make most maltreated children turn into delinquents or adult criminals (Widom, 1997). However, attempts to replicate these findings have been inconclusive. Foley et al. (2004) found essentially the same MAO-A-maltreatment interaction but three other studies have failed to do so, which suggests that Caspi’s findings cannot easily be generalized to other populations (Foley et al., 2004; Haberstick et al., 2005; Huizinga et al., 2006; Young et al., 2006). Accordingly, these results have prompted some reviewers to suggest that the real culprit in genetic personality research has been the underlying model upon which most current studies in behavioral genetics rely (Caspi et al., 2005; Hamer, 2002; Rutter et al., 2006; Rutter & Silberg, 2002). In the words of Dean Hamer, in an article published in Science (2002):
54
transporter gene and higher scores on anxiety-related traits – the direction of the effect runs opposite from what is expected considering how low serotonin levels normally influence anxiety-related traits (Sen et al., 2004). Moreover, so far there has been hardly any success in finding the genes that mediate the directions of these effects, and the attempts to map out the genetic complexities at molecular level that have been made by Oreland et al., regarding platelet MAO-B activity in association with personality, over the last 30 years, indicate that the prospect of making rapid progress is quite remote. However, it is important to recognize that most genetic personality research thus far has focused on functional variants, and very little on regulatory regions. Reasons for this are that less than 1% of the over 27,000 mutations associated with mendalian human diseases have been found in regulatory regions (Botstein & Risch, 2003), and that polymorphisms in regulatory regions are expected to have a more subtle effect on the phenotype than functional variants. So, there is a rich supply of markers available that remain to be tested. Indeed, the diversity in the human genome is enormous; 4.6 million of the 15 million SNPs that are estimated to be available in the human genome have thus far been genotyped (Barnes, 2006; Botstein & Risch, 2003). Oreland’s research group is one of a few that have made a serious attempt to test some of the markers that are now available in regulatory regions (Damberg et al., 2001). Nevertheless, despite this complexity, many researchers believe that more efforts to test non-conserved/non-coding DNA (more than 98% of the human genome consist of non-coding DNA), which also have been found to have a regulatory function (Mattick, 2004), can potentially improve the field’s track record (Plomin, 2005). New findings concerning the C-521T variant in the dopamine receptor gene, which – if genuine – may account for up to 3% of the phenotypic variance in Impulsiveness and Novelty Seeking, provide an encouraging example of this (Munafo et al., 2007). Second, environmental factors may influence the extent to which genetic variation can be associated with specific behaviors. Both the serotonin and noradrenergic neurotransmission systems’ function may be affected by more severe environmental conditions. For example, Caspi’s Science finding (2003, 2002) suggests that the difficulties in some samples in replicating the association between the serotonin transporter gene and anxiety-related traits (Lesch et al., 1996) derive from the fact that the susceptibility effect of this allelic variant is dependent on a gene-environment interaction. In other words, it is individuals who experience stressful life events and who have one or two copies of the short allele of the serotonin transporter gene who are most likely to exhibit more depressive symptom. Individuals who experience stressful life events with two copies of the long allele would be less likely to do so. This hypothesis was tested in the Dunedin Longitudinal Study, a representative birth cohort of 1038 children (52% male) that has been assessed at ages 3, 5, 7, 9, 11, 13, 15, 18 and 21 and was almost intact (96%) at the age of 26 years. Depression at age 26 was assessed using self-reports, clinical interviews and information from a person nominated by each study member as “someone who knows you well”. Fourteen stressful life events were recorded between the ages 21 and 26 years, including employment, financial, housing, health and relationship stressors, which were assessed
27864 Avhandling_inlaga.indd 54 1/28/08 9:19:58 AM

55
through a highly reliable life history calendar (Belli et al., 2001). The findings confirmed the hypothesis; individuals with one or two copies of the short allele exhibited more depressive symptoms, diagnosable depression and suicidality in relation to stressful life events than individuals with two copies of the long allele of the serotonin transporter gene. No main effect of having the short allele on depression was found. The specificity of the genetic effect was also checked. No interaction with the heritable component of life events or interaction between the MAO-A gene and childhood maltreatment, which also has been found in this sample (Caspi et al., 2002), applied longitudinally to the onset of depression. Thus, this epidemiological study provides evidence of a gene-environment interaction that can explain why some people are more likely than others to develop symptoms of depression when they experience stressful life events. The fact that these findings also have been replicated in most large studies (Rutter et al., 2006) suggests two things that have previously not been recognized (Caspi et al., 2003). First, personality traits that are related to psychopathology, instead of being influenced by many genes with small effects, may be influenced by fewer genes whose effect on a phenotype depends on whether they have been exposed to environmental risks. Second, gene-environment interactions such as these may have clinical implications. Although only 10% of the short allele carriers experienced more than four or more stressful life events (between age 21 and 26), they accounted for almost one-quarter (23%) of the 133 cases of diagnosed depression that were identified in this representative birth cohort. Furthermore, the results in the same sample with respect to high levels of MAO-A expression, early maltreatment and the development of antisocial problems followed the same pattern (Caspi et al., 2002). MAO-A was found to moderate the effect of maltreatment. Maltreated children with a high level of MAO-A enzyme expression were less likely to develop antisocial problems, whereas individuals with both a low-activity genotype and previous maltreatment were by far the most likely to have committed a violent crime or to be diagnosed with conduct disorders. Over 85% of the males who had both “bad genes” and “bad environment” developed some form of antisocial behavior by the time they were 26. In contrast, the environmental effect of maltreatment (in samples where the subjects’ genotype is not considered) typically increases the risk of later criminality by about 50%, which is not enough to make most maltreated children turn into delinquents or adult criminals (Widom, 1997). However, attempts to replicate these findings have been inconclusive. Foley et al. (2004) found essentially the same MAO-A-maltreatment interaction but three other studies have failed to do so, which suggests that Caspi’s findings cannot easily be generalized to other populations (Foley et al., 2004; Haberstick et al., 2005; Huizinga et al., 2006; Young et al., 2006). Accordingly, these results have prompted some reviewers to suggest that the real culprit in genetic personality research has been the underlying model upon which most current studies in behavioral genetics rely (Caspi et al., 2005; Hamer, 2002; Rutter et al., 2006; Rutter & Silberg, 2002). In the words of Dean Hamer, in an article published in Science (2002):
54
transporter gene and higher scores on anxiety-related traits – the direction of the effect runs opposite from what is expected considering how low serotonin levels normally influence anxiety-related traits (Sen et al., 2004). Moreover, so far there has been hardly any success in finding the genes that mediate the directions of these effects, and the attempts to map out the genetic complexities at molecular level that have been made by Oreland et al., regarding platelet MAO-B activity in association with personality, over the last 30 years, indicate that the prospect of making rapid progress is quite remote. However, it is important to recognize that most genetic personality research thus far has focused on functional variants, and very little on regulatory regions. Reasons for this are that less than 1% of the over 27,000 mutations associated with mendalian human diseases have been found in regulatory regions (Botstein & Risch, 2003), and that polymorphisms in regulatory regions are expected to have a more subtle effect on the phenotype than functional variants. So, there is a rich supply of markers available that remain to be tested. Indeed, the diversity in the human genome is enormous; 4.6 million of the 15 million SNPs that are estimated to be available in the human genome have thus far been genotyped (Barnes, 2006; Botstein & Risch, 2003). Oreland’s research group is one of a few that have made a serious attempt to test some of the markers that are now available in regulatory regions (Damberg et al., 2001). Nevertheless, despite this complexity, many researchers believe that more efforts to test non-conserved/non-coding DNA (more than 98% of the human genome consist of non-coding DNA), which also have been found to have a regulatory function (Mattick, 2004), can potentially improve the field’s track record (Plomin, 2005). New findings concerning the C-521T variant in the dopamine receptor gene, which – if genuine – may account for up to 3% of the phenotypic variance in Impulsiveness and Novelty Seeking, provide an encouraging example of this (Munafo et al., 2007). Second, environmental factors may influence the extent to which genetic variation can be associated with specific behaviors. Both the serotonin and noradrenergic neurotransmission systems’ function may be affected by more severe environmental conditions. For example, Caspi’s Science finding (2003, 2002) suggests that the difficulties in some samples in replicating the association between the serotonin transporter gene and anxiety-related traits (Lesch et al., 1996) derive from the fact that the susceptibility effect of this allelic variant is dependent on a gene-environment interaction. In other words, it is individuals who experience stressful life events and who have one or two copies of the short allele of the serotonin transporter gene who are most likely to exhibit more depressive symptom. Individuals who experience stressful life events with two copies of the long allele would be less likely to do so. This hypothesis was tested in the Dunedin Longitudinal Study, a representative birth cohort of 1038 children (52% male) that has been assessed at ages 3, 5, 7, 9, 11, 13, 15, 18 and 21 and was almost intact (96%) at the age of 26 years. Depression at age 26 was assessed using self-reports, clinical interviews and information from a person nominated by each study member as “someone who knows you well”. Fourteen stressful life events were recorded between the ages 21 and 26 years, including employment, financial, housing, health and relationship stressors, which were assessed
27864 Avhandling_inlaga.indd 55 1/28/08 9:19:59 AM

57
between us, which gives each of us (who are not a MZ twin) a unique genome. As mentioned earlier, the most recent estimates suggest that as many as 15 million SNPs differentiate between people in large samples (Botstein & Risch, 2003). Four basic problems, which reflect this complexity, contribute to explaining why it has been so hard to establish “firm” associations between genes and personality (Lander & Schork, 1994): 1. Incomplete penetrance. An individual who inherits a specific personality trait may not always manifest the trait. Environmental influences may override genetic influences (Gabel et al., 1995; Galvin et al., 1995), and genes that contribute to psychopathology may only influence people if they have been exposed to environmental risks (Caspi et al., 2002; Caspi et al., 2003). Furthermore, personality traits are influenced by many genes that work together in self-organizing networks (Bornholdt, 2001; Turbes, 1993), and a genetic trait can only manifest itself if some proportion of the genes in the network have the right predisposing alleles (Comings, 1998a). A single predisposing allele can therefore only increase the probability that the trait will be manifested. Moreover, some genetic traits are reinforced to get manifested by the environment whereas others are not. For example, as mentioned earlier when discussing genetic-environment correlations and interactions, genes that contribute to agreeableness may get more strongly reinforced by the environment than genes for stubbornness (Caspi et al., 2005). A person may be a little stubborn for genetic reasons, but if this behavior is not reinforced by the environment, the relatively few predisposing alleles that “push” the individual to be more stubborn may fail to penetrate. Environmental influences, such as those and others (including sex-roles and age differences), also contribute to the extent to which an inherited trait manifests itself. The personality trait self-transcendence, which has a heritability of .44, may, for example, only develop into a stable personality characteristic later in life (Cloninger et al., 1997; Comings et al., 2000b; Cook-Greuter, 2000). The difficulty in establishing “firm” associations between genotypes and personality is, therefore, in part due to incomplete penetrance. Personality traits are influenced by many genes that work together in self-organizing networks, and genetic trait can only manifest themselves if some proportions of the genes in the network have the right predisposing alleles. This means that a single predisposing allele can be present in individuals who score both high and low on a trait, which naturally makes it harder to establish “firm” associations between genes and personality. This is especially true if only one gene at a time is tested in a study, which has generally been the case (Comings, 1998b; Comings et al., 2000a). 2. High frequency of predisposing alleles. Methodological difficulties in establishing “firm” associations between genotypes and personality also arise if the predisposing alleles are very common in the populations under study. This is especially likely to be the case if the predisposing alleles are influencing biological systems that are of importance for the individuals’ survival. For example, whole genome association studies compare differences in SNP frequencies between two extreme groups, or cases and controls, and if some SNPs are very common and the frequency differences in the groups that are studied are relatively small, which is more likely to be the case if the
56
“What’s the problem? [the fact that not a single candidate gene for psychopathology has been consistently replicated] It’s not the basic premise of linkage and candidate gene analysis; these approaches have identified dozens of genes involved in inherited diseases. Nor is it the lack of DNA sequence information; virtually the entire code of the human genome in now known. The real culprit is the assumption that the rich complexity of human thought and emotion can be reduced to a simple, linear relation between individual genes and behaviors. This oversimplified model, which underlies most current research in behavior genetics, ignores the critical importance of the brain, the environment, and gene expression networks.” (p. 71-72). In other words, the prime difficulty may be lack of methodology. That is, there is no methodology that is able to take advantage of the self-organizing mechanisms that govern the development of the nervous system, and as such makes it possible to unite the study of the brain, the environment, and the expression of gene networks. And, as we will see in part IV and V, this is one of the reasons why this dissertation has investigated to what extent iris data can be used to develop such a methodology. To sum up, the last 10 years of research into associations between genes and personality suggest that a direct path from candidate genes to personality accounts for little variation in the phenotype and typically fails to replicate in independent samples (Munafo et al., 2003). Furthermore, genotype-environmental correlations and interactions may be more important than previously thought (Rutter et al., 2006). The heritability coefficient indexes not only the direct effect of genes, but also the effects of correlation and interactions between genes and environments (Rutter & Silberg, 2002), and therefore consistent replications of associations between genes and behavior may be dependent on assessment of environmental risks and other environmental factors (Caspi et al., 2005). Thus, since representatives of behavioral genetic research rightfully recognize that there has been embarrassingly slower-than-expected progress towards identifying reliable associations between genes and personality over the last ten years (Plomin, 2005; Plomin & Rutter, 1998), it may be appropriate to ask if it really is possible to establish “firm” associations between genes and personality, i.e. direct paths between genetic effects and behaviors that from DNA alone can predict which individuals are most likely to score high, in the middle, and low, on a trait. 3.6.1 Is it really possible to establish “firm” associations between genes and
personality? Many investigators take the view that the main problems that have plagued the field at the molecular level are inescapable, and are simply due to the fact that there potentially can be thousands of genes that contribute to personality. About one third of our 20,000–25,000 genes or so (Stein, 2004) are expressed in the brain, and can therefore be considered as candidate genes for personality (Plomin & Crabbe, 2000). Furthermore, our genome is 3 billion base-pairs long, and even though 99.9% of this sequence is the same for all people, about one polymorphism in every thousand differs
27864 Avhandling_inlaga.indd 56 1/28/08 9:19:59 AM
57
between us, which gives each of us (who are not a MZ twin) a unique genome. As mentioned earlier, the most recent estimates suggest that as many as 15 million SNPs differentiate between people in large samples (Botstein & Risch, 2003). Four basic problems, which reflect this complexity, contribute to explaining why it has been so hard to establish “firm” associations between genes and personality (Lander & Schork, 1994): 1. Incomplete penetrance. An individual who inherits a specific personality trait may not always manifest the trait. Environmental influences may override genetic influences (Gabel et al., 1995; Galvin et al., 1995), and genes that contribute to psychopathology may only influence people if they have been exposed to environmental risks (Caspi et al., 2002; Caspi et al., 2003). Furthermore, personality traits are influenced by many genes that work together in self-organizing networks (Bornholdt, 2001; Turbes, 1993), and a genetic trait can only manifest itself if some proportion of the genes in the network have the right predisposing alleles (Comings, 1998a). A single predisposing allele can therefore only increase the probability that the trait will be manifested. Moreover, some genetic traits are reinforced to get manifested by the environment whereas others are not. For example, as mentioned earlier when discussing genetic-environment correlations and interactions, genes that contribute to agreeableness may get more strongly reinforced by the environment than genes for stubbornness (Caspi et al., 2005). A person may be a little stubborn for genetic reasons, but if this behavior is not reinforced by the environment, the relatively few predisposing alleles that “push” the individual to be more stubborn may fail to penetrate. Environmental influences, such as those and others (including sex-roles and age differences), also contribute to the extent to which an inherited trait manifests itself. The personality trait self-transcendence, which has a heritability of .44, may, for example, only develop into a stable personality characteristic later in life (Cloninger et al., 1997; Comings et al., 2000b; Cook-Greuter, 2000). The difficulty in establishing “firm” associations between genotypes and personality is, therefore, in part due to incomplete penetrance. Personality traits are influenced by many genes that work together in self-organizing networks, and genetic trait can only manifest themselves if some proportions of the genes in the network have the right predisposing alleles. This means that a single predisposing allele can be present in individuals who score both high and low on a trait, which naturally makes it harder to establish “firm” associations between genes and personality. This is especially true if only one gene at a time is tested in a study, which has generally been the case (Comings, 1998b; Comings et al., 2000a). 2. High frequency of predisposing alleles. Methodological difficulties in establishing “firm” associations between genotypes and personality also arise if the predisposing alleles are very common in the populations under study. This is especially likely to be the case if the predisposing alleles are influencing biological systems that are of importance for the individuals’ survival. For example, whole genome association studies compare differences in SNP frequencies between two extreme groups, or cases and controls, and if some SNPs are very common and the frequency differences in the groups that are studied are relatively small, which is more likely to be the case if the
56
“What’s the problem? [the fact that not a single candidate gene for psychopathology has been consistently replicated] It’s not the basic premise of linkage and candidate gene analysis; these approaches have identified dozens of genes involved in inherited diseases. Nor is it the lack of DNA sequence information; virtually the entire code of the human genome in now known. The real culprit is the assumption that the rich complexity of human thought and emotion can be reduced to a simple, linear relation between individual genes and behaviors. This oversimplified model, which underlies most current research in behavior genetics, ignores the critical importance of the brain, the environment, and gene expression networks.” (p. 71-72). In other words, the prime difficulty may be lack of methodology. That is, there is no methodology that is able to take advantage of the self-organizing mechanisms that govern the development of the nervous system, and as such makes it possible to unite the study of the brain, the environment, and the expression of gene networks. And, as we will see in part IV and V, this is one of the reasons why this dissertation has investigated to what extent iris data can be used to develop such a methodology. To sum up, the last 10 years of research into associations between genes and personality suggest that a direct path from candidate genes to personality accounts for little variation in the phenotype and typically fails to replicate in independent samples (Munafo et al., 2003). Furthermore, genotype-environmental correlations and interactions may be more important than previously thought (Rutter et al., 2006). The heritability coefficient indexes not only the direct effect of genes, but also the effects of correlation and interactions between genes and environments (Rutter & Silberg, 2002), and therefore consistent replications of associations between genes and behavior may be dependent on assessment of environmental risks and other environmental factors (Caspi et al., 2005). Thus, since representatives of behavioral genetic research rightfully recognize that there has been embarrassingly slower-than-expected progress towards identifying reliable associations between genes and personality over the last ten years (Plomin, 2005; Plomin & Rutter, 1998), it may be appropriate to ask if it really is possible to establish “firm” associations between genes and personality, i.e. direct paths between genetic effects and behaviors that from DNA alone can predict which individuals are most likely to score high, in the middle, and low, on a trait. 3.6.1 Is it really possible to establish “firm” associations between genes and
personality? Many investigators take the view that the main problems that have plagued the field at the molecular level are inescapable, and are simply due to the fact that there potentially can be thousands of genes that contribute to personality. About one third of our 20,000–25,000 genes or so (Stein, 2004) are expressed in the brain, and can therefore be considered as candidate genes for personality (Plomin & Crabbe, 2000). Furthermore, our genome is 3 billion base-pairs long, and even though 99.9% of this sequence is the same for all people, about one polymorphism in every thousand differs
27864 Avhandling_inlaga.indd 57 1/28/08 9:20:00 AM

59
allele is irrelevant to personality; it can still be highly relevant in some family trees, which have the proper “genetic background”. Thus, genetic heterogeneity is arguably the main reason why it has been so hard to establish “firm” associations between genes and personality, which calls for a methodology that is able to decrease the genetic heterogeneity present in large samples. 4. Polygenetic inheritance. As mentioned earlier, personality traits are influenced by many genes, each with a small effect, that work together in self-organizing networks, and a genetic trait can only manifest itself if some proportion of the genes in the network have the right predisposing alleles (Bornholdt, 2001; Comings, 1998a). This fact contributes to incomplete penetrance, but it also reflects polygenetic inheritance. That is, polygenetic inheritance refers to the fact that: 1) the manifestation of a trait requires simultaneous mutation in multiple genes in order to manifest, but also 2) that the behavioral expression of these genes may differ in different genetic backgrounds. The difficulties under point 2) are sometimes referred to as constituting an aspect of genetic heterogeneity, as indicated above; regardless, the point here is that both polygenetic inheritance and genetic heterogeneity increase the difficulty in identifying “firm” associations between genes and personality. However, which of them creates the largest obstacle depends on the relative importance of additive and non-additive genetic effects for the trait under study. If non-additive genetic effects for the trait are small and most of the genetic effects are additive, then the problem of identifying the right sets of genes is greater than the genetic background problem. If non-additive effects are of importance then the genetic background problem will be of greater importance. Thus, since about half of the genetic variance is non-additive in large heterogeneous samples (Eaves et al., 1999; Eaves et al., 1998; Keller et al., 2005; Lake et al., 2000; Plomin et al., 1998), and non-additive genes always mask some proportion of the effect of additive genes (Cordell, 2002; Frankel & Schork, 1996), it may be very hard conclusively to replicate candidate genes for personality unless interaction between alleles, hence non-additive genetic effects are considered. For example, a gene’s true main effect might be too small to detect with any reasonable statistical power and sample size, and yet it might still enter into a critical non-additive effect with a second gene. Or even worse, the main effect of a locus might be virtually undetectable, because its partner may have an opposite or “reciprocal” effect (Frankel & Schork, 1996; van Wezel et al., 1996). It is therefore, unreasonable to think about gene expression as being independent of the genetic background, or that the genetic background problem may be of lesser importance than finding the right set of genes (at least for a phenotype such as personality where about half of the genetic effects are non-additive). Obviously, these two problems are intertwined, and for this reasons the influence of the genetic background must be considered.
58
SNPs are of importance for survival, then it will be harder to recognize the extent to which these SNPs are associated with the phenotype. The “noise” in the design will increase under such circumstances, and this will also make it harder to identify other predisposing alleles of small effect, which are involved in the same biological pathway. These problems escalate when they occur together with genetic heterogeneity (Comings, 1998a). 3. Genetic (or locus) heterogeneity – refers to the fact that it is not always the same genes that contribute to a trait. Several different sets of alleles can contribute to a high phenotypic score on a personality trait. Further, different sets of alleles are involved in different pedigrees, and the behavioral expression of predisposing alleles may change in different pedigrees. The predisposing genes or set of genes that is required for the trait to manifest may thus operate along quite different routes. This means that when the sample size in association studies is increased, and the genetic diversity is increased as a result, it is not necessarily so that the actual power to detect an association with a genetic marker improves. The power may increase mathematically and statistically, but nevertheless, if the genetic heterogeneity increases more than sample size improves the power to detect small effects, then the effort to collect data in large samples to improve power may be wasted (Fanous & Kendler, 2005). That is, the increase in genetic diversity that occurs when the sample size increases, and the fact that the genetic marker is only likely to be a predisposing allele in some family trees in large samples, may mask the effect so it can not be generalized to the whole sample. Genetic heterogeneity contributes to explain why single genes generally are found to explain less than 1.5% of the variance for a personality trait (Comings & Blum, 2000). This also implies, that if an association between a functional allele and a personality trait fails to replicate in independent samples, this may be due to genetic heterogeneity and/or incomplete penetrance, rather than the functional allele being irrelevant to the personality trait under study (Comings, 1998b). Meta-analytical studies that use the methods that are praxis today, may therefore come to the wrong conclusions when they discard allelic variants that fail to be replicated in most studies (Fanous & Kendler, 2005; Munafo et al., 2005; Munafo et al., 2003). For example, the effect size for the original association between the long-repeat allele of DRD4 and novelty seeking was 6% (Ebstein et al., 1996). This effect decreased to 4% in the replication study that followed (Benjamin et al., 1996), and the association between the long-repeat allele of DRD4 and novelty seeking fails to replicate in most studies (Kluger et al., 2002; Munafo et al., 2007). The true additive effect size for DRD4 may thus be much smaller than 1% in large samples (Munafo et al., 2007; Plomin & Caspi, 1998). Indeed, even though the distribution of QTL effect sizes for any complex trait or disorder is not known, most QTL effects may be much smaller than 1.5 %. Effect sizes as small as .5 – .2 % are now believed to be the norm (at least for intelligence) in large samples with elevated genetic heterogeneity (Plomin et al., 2006), and there is no reason to believe that the genetic heterogeneity for personality would be less complex (Scarr, 1997; Schinka et al., 2002). In other words, just because a predisposing allele fails to penetrate in large samples and/or in most studies, this does not mean that the
27864 Avhandling_inlaga.indd 58 1/28/08 9:20:00 AM
59
allele is irrelevant to personality; it can still be highly relevant in some family trees, which have the proper “genetic background”. Thus, genetic heterogeneity is arguably the main reason why it has been so hard to establish “firm” associations between genes and personality, which calls for a methodology that is able to decrease the genetic heterogeneity present in large samples. 4. Polygenetic inheritance. As mentioned earlier, personality traits are influenced by many genes, each with a small effect, that work together in self-organizing networks, and a genetic trait can only manifest itself if some proportion of the genes in the network have the right predisposing alleles (Bornholdt, 2001; Comings, 1998a). This fact contributes to incomplete penetrance, but it also reflects polygenetic inheritance. That is, polygenetic inheritance refers to the fact that: 1) the manifestation of a trait requires simultaneous mutation in multiple genes in order to manifest, but also 2) that the behavioral expression of these genes may differ in different genetic backgrounds. The difficulties under point 2) are sometimes referred to as constituting an aspect of genetic heterogeneity, as indicated above; regardless, the point here is that both polygenetic inheritance and genetic heterogeneity increase the difficulty in identifying “firm” associations between genes and personality. However, which of them creates the largest obstacle depends on the relative importance of additive and non-additive genetic effects for the trait under study. If non-additive genetic effects for the trait are small and most of the genetic effects are additive, then the problem of identifying the right sets of genes is greater than the genetic background problem. If non-additive effects are of importance then the genetic background problem will be of greater importance. Thus, since about half of the genetic variance is non-additive in large heterogeneous samples (Eaves et al., 1999; Eaves et al., 1998; Keller et al., 2005; Lake et al., 2000; Plomin et al., 1998), and non-additive genes always mask some proportion of the effect of additive genes (Cordell, 2002; Frankel & Schork, 1996), it may be very hard conclusively to replicate candidate genes for personality unless interaction between alleles, hence non-additive genetic effects are considered. For example, a gene’s true main effect might be too small to detect with any reasonable statistical power and sample size, and yet it might still enter into a critical non-additive effect with a second gene. Or even worse, the main effect of a locus might be virtually undetectable, because its partner may have an opposite or “reciprocal” effect (Frankel & Schork, 1996; van Wezel et al., 1996). It is therefore, unreasonable to think about gene expression as being independent of the genetic background, or that the genetic background problem may be of lesser importance than finding the right set of genes (at least for a phenotype such as personality where about half of the genetic effects are non-additive). Obviously, these two problems are intertwined, and for this reasons the influence of the genetic background must be considered.
58
SNPs are of importance for survival, then it will be harder to recognize the extent to which these SNPs are associated with the phenotype. The “noise” in the design will increase under such circumstances, and this will also make it harder to identify other predisposing alleles of small effect, which are involved in the same biological pathway. These problems escalate when they occur together with genetic heterogeneity (Comings, 1998a). 3. Genetic (or locus) heterogeneity – refers to the fact that it is not always the same genes that contribute to a trait. Several different sets of alleles can contribute to a high phenotypic score on a personality trait. Further, different sets of alleles are involved in different pedigrees, and the behavioral expression of predisposing alleles may change in different pedigrees. The predisposing genes or set of genes that is required for the trait to manifest may thus operate along quite different routes. This means that when the sample size in association studies is increased, and the genetic diversity is increased as a result, it is not necessarily so that the actual power to detect an association with a genetic marker improves. The power may increase mathematically and statistically, but nevertheless, if the genetic heterogeneity increases more than sample size improves the power to detect small effects, then the effort to collect data in large samples to improve power may be wasted (Fanous & Kendler, 2005). That is, the increase in genetic diversity that occurs when the sample size increases, and the fact that the genetic marker is only likely to be a predisposing allele in some family trees in large samples, may mask the effect so it can not be generalized to the whole sample. Genetic heterogeneity contributes to explain why single genes generally are found to explain less than 1.5% of the variance for a personality trait (Comings & Blum, 2000). This also implies, that if an association between a functional allele and a personality trait fails to replicate in independent samples, this may be due to genetic heterogeneity and/or incomplete penetrance, rather than the functional allele being irrelevant to the personality trait under study (Comings, 1998b). Meta-analytical studies that use the methods that are praxis today, may therefore come to the wrong conclusions when they discard allelic variants that fail to be replicated in most studies (Fanous & Kendler, 2005; Munafo et al., 2005; Munafo et al., 2003). For example, the effect size for the original association between the long-repeat allele of DRD4 and novelty seeking was 6% (Ebstein et al., 1996). This effect decreased to 4% in the replication study that followed (Benjamin et al., 1996), and the association between the long-repeat allele of DRD4 and novelty seeking fails to replicate in most studies (Kluger et al., 2002; Munafo et al., 2007). The true additive effect size for DRD4 may thus be much smaller than 1% in large samples (Munafo et al., 2007; Plomin & Caspi, 1998). Indeed, even though the distribution of QTL effect sizes for any complex trait or disorder is not known, most QTL effects may be much smaller than 1.5 %. Effect sizes as small as .5 – .2 % are now believed to be the norm (at least for intelligence) in large samples with elevated genetic heterogeneity (Plomin et al., 2006), and there is no reason to believe that the genetic heterogeneity for personality would be less complex (Scarr, 1997; Schinka et al., 2002). In other words, just because a predisposing allele fails to penetrate in large samples and/or in most studies, this does not mean that the
27864 Avhandling_inlaga.indd 59 1/28/08 9:20:00 AM

61
up in their effect to create a high phenotypic score are in the right direction for an individual, then the probability for the trait to be manifested for that individual can exceed the average probability reflected in the MZ twin correlation. One good example of a phenotype where this is true is breast cancer. The MZ twin correlation for breast cancer is .14 (Lichtenstein et al., 2000), and for women with a BRCA1 mutation the probabilities of getting breast cancer at ages 40, 55 and 80 are 37%, 66% and 85% respectively, compared with 0.4%, 3% and 8% for women without mutations at BRCA1 (Easton et al., 1993; Ford et al., 1994). One needs of course, to identify many more susceptibility alleles for a extremely polygenetic trait such as personality, than for a less polygenetic trait such as breast cancer, and most importantly, map out how they add up in their effect at the individual level to arrive at a higher penetration rate than about 40%. But, provided one can find out how networks of genes work together, and in which genetic backgrounds they are of importance, the same reasoning can be applied to most personality traits. Indeed, among inbred strains of mice, where the genetic background is exactly the same for all loci, except the one that segregates between different lines, just 6 loci account for almost all the phenotypic variance for open field activity, a recognized measure of emotionality in mice (Flint, 2003). This suggests that only a few QTLs of relatively large effect sizes, even for a very complex polygenetic trait such as emotionality, can account for most of the genetic variance in populations where the genetic background is similar (Flint et al., 2005). As we will see in Part IV, this is probably why the effect sizes in Study 3 in this dissertation increased when iris matching – which decreases complexity in the genetic background – was employed. This means that if the heterogeneity in the genetic background in a population is decreased to a substantial degree, it will be much easier to identify the genes that influence personality in that population. Both the genetic effect sizes (which will be larger) and the sample sizes that are needed to identify the relevant genes (which most likely need to be smaller) are much more favorable under these circumstances. With this in mind, one may wonder about the new genetic methods that are about to be used, and that have been welcomed with so much enthusiasm (Craig & Plomin, 2006; Plomin, 2005; Plomin & Crabbe, 2000; Plomin & Rutter, 1998), are they really likely to succeed in their attempts to elucidate the genetic complexity of personality and to establish “firm” associations between genetic effects and personality? 3.7.1 New methods: will they be able to elucidate the genetic complexity of
personality? The difficulty in establishing reliable associations between genes and complex traits, such as personality has led to the development of new genetic methodologies. Whole genome association studies, which use microarrays and direct and indirect association strategies, are being used to seek to identify genes that influence complex traits (Plomin, 2005). The goal of these approaches is to apply a strategy that is able to simultaneously identify all quantitative trait loci (QTL) – i.e. all polymorphisms that influence a trait – and in order to achieve this, a dense set of single nucleotide
60
Indeed, there is a lot of data available that supports this notion. For example, even though the additive effect of the apolipoprotein E (APOE) gene accounts for 15% of the liability for Alzheimer’s disease, which has been replicated in populations of European descent, this risk genotype has an inconsistent and sometimes even a negative association with Alzheimer’s disease in African Americans, where the genetic background is different (Farrer et al., 1997; Tang et al., 1996; Tang et al., 1998). Moreover, the importance of the genetic background is easily demonstrated in inbred strains where the behavioral effect of a predisposing allele in one strain often completely vanish in another (Holmes & Hariri, 2003; Holmes et al., 2003; Willis-Owen & Flint, 2006). Similarly, the phenotype of “knockout mice” generally changes dramatically when assessed in different strains (Cryan & Mombereau, 2004). The importance of genetic background is harder to demonstrate directly for personality, but nevertheless it is expected to be just as common for personality, and maybe is most clearly demonstrated when the similarity in between MZ twins, parent-child dyads and unrelated paired subjects are compared. The well known drop in intra-pair similarity on personality between MZ twins, parent-child dyads and unrelated paired subjects, where the correlation drops from being approximately .40, to .15 to zero. This is mainly due to the fact that the average proportion of genes that is not similar, and which influences the trait in these dyads, increases from zero, to fifty, to one hundred percent in large samples. In other words, it is the genes that are not similar in the genetic background in these dyads that are responsible for the drop in phenotypic similarity. This implies that, if it were possible to get a handle on the genetic heterogeneity problem, it would most likely be much easier to establish “firm” associations between genes and personality in the future. However, given that the correlation for MZ twins (who are identical on every single loci), is no more than about .40 for personality, it may be appropriate further to investigate the circumstances under which it is reasonable to assume that one can establish “firm” associations between genes and personality, i.e. direct paths between genetic effects and behaviors that, from DNA alone, can predict which individuals are most likely to score high, in the middle, and low, on a particular trait. 3.6.2 “Firm” associations between genes and personality: under which
circumstances? It is important to acknowledge that, in a strict sense, there is no such thing as a “firm” association between genes and personality. A specific genotype can only increase the probability that a trait will be manifested. However, that genetically identical people, on average, correlate .40 on most personality traits, does not necessarily mean that the chance of obtaining a particular score cannot exceed 40%. In some families, some personality traits are more strongly inherited, and in such families the MZ twins’ correlation for those traits will be higher than .40. MZ twins from different families have a genetic tendency to score high and low on different traits, and this is why the average intra-pair MZ correlations for personality in most large twin samples tends to be approximately .40. Thus, if most of the genes that add
27864 Avhandling_inlaga.indd 60 1/28/08 9:20:01 AM

61
up in their effect to create a high phenotypic score are in the right direction for an individual, then the probability for the trait to be manifested for that individual can exceed the average probability reflected in the MZ twin correlation. One good example of a phenotype where this is true is breast cancer. The MZ twin correlation for breast cancer is .14 (Lichtenstein et al., 2000), and for women with a BRCA1 mutation the probabilities of getting breast cancer at ages 40, 55 and 80 are 37%, 66% and 85% respectively, compared with 0.4%, 3% and 8% for women without mutations at BRCA1 (Easton et al., 1993; Ford et al., 1994). One needs of course, to identify many more susceptibility alleles for a extremely polygenetic trait such as personality, than for a less polygenetic trait such as breast cancer, and most importantly, map out how they add up in their effect at the individual level to arrive at a higher penetration rate than about 40%. But, provided one can find out how networks of genes work together, and in which genetic backgrounds they are of importance, the same reasoning can be applied to most personality traits. Indeed, among inbred strains of mice, where the genetic background is exactly the same for all loci, except the one that segregates between different lines, just 6 loci account for almost all the phenotypic variance for open field activity, a recognized measure of emotionality in mice (Flint, 2003). This suggests that only a few QTLs of relatively large effect sizes, even for a very complex polygenetic trait such as emotionality, can account for most of the genetic variance in populations where the genetic background is similar (Flint et al., 2005). As we will see in Part IV, this is probably why the effect sizes in Study 3 in this dissertation increased when iris matching – which decreases complexity in the genetic background – was employed. This means that if the heterogeneity in the genetic background in a population is decreased to a substantial degree, it will be much easier to identify the genes that influence personality in that population. Both the genetic effect sizes (which will be larger) and the sample sizes that are needed to identify the relevant genes (which most likely need to be smaller) are much more favorable under these circumstances. With this in mind, one may wonder about the new genetic methods that are about to be used, and that have been welcomed with so much enthusiasm (Craig & Plomin, 2006; Plomin, 2005; Plomin & Crabbe, 2000; Plomin & Rutter, 1998), are they really likely to succeed in their attempts to elucidate the genetic complexity of personality and to establish “firm” associations between genetic effects and personality? 3.7.1 New methods: will they be able to elucidate the genetic complexity of
personality? The difficulty in establishing reliable associations between genes and complex traits, such as personality has led to the development of new genetic methodologies. Whole genome association studies, which use microarrays and direct and indirect association strategies, are being used to seek to identify genes that influence complex traits (Plomin, 2005). The goal of these approaches is to apply a strategy that is able to simultaneously identify all quantitative trait loci (QTL) – i.e. all polymorphisms that influence a trait – and in order to achieve this, a dense set of single nucleotide
60
Indeed, there is a lot of data available that supports this notion. For example, even though the additive effect of the apolipoprotein E (APOE) gene accounts for 15% of the liability for Alzheimer’s disease, which has been replicated in populations of European descent, this risk genotype has an inconsistent and sometimes even a negative association with Alzheimer’s disease in African Americans, where the genetic background is different (Farrer et al., 1997; Tang et al., 1996; Tang et al., 1998). Moreover, the importance of the genetic background is easily demonstrated in inbred strains where the behavioral effect of a predisposing allele in one strain often completely vanish in another (Holmes & Hariri, 2003; Holmes et al., 2003; Willis-Owen & Flint, 2006). Similarly, the phenotype of “knockout mice” generally changes dramatically when assessed in different strains (Cryan & Mombereau, 2004). The importance of genetic background is harder to demonstrate directly for personality, but nevertheless it is expected to be just as common for personality, and maybe is most clearly demonstrated when the similarity in between MZ twins, parent-child dyads and unrelated paired subjects are compared. The well known drop in intra-pair similarity on personality between MZ twins, parent-child dyads and unrelated paired subjects, where the correlation drops from being approximately .40, to .15 to zero. This is mainly due to the fact that the average proportion of genes that is not similar, and which influences the trait in these dyads, increases from zero, to fifty, to one hundred percent in large samples. In other words, it is the genes that are not similar in the genetic background in these dyads that are responsible for the drop in phenotypic similarity. This implies that, if it were possible to get a handle on the genetic heterogeneity problem, it would most likely be much easier to establish “firm” associations between genes and personality in the future. However, given that the correlation for MZ twins (who are identical on every single loci), is no more than about .40 for personality, it may be appropriate further to investigate the circumstances under which it is reasonable to assume that one can establish “firm” associations between genes and personality, i.e. direct paths between genetic effects and behaviors that, from DNA alone, can predict which individuals are most likely to score high, in the middle, and low, on a particular trait. 3.6.2 “Firm” associations between genes and personality: under which
circumstances? It is important to acknowledge that, in a strict sense, there is no such thing as a “firm” association between genes and personality. A specific genotype can only increase the probability that a trait will be manifested. However, that genetically identical people, on average, correlate .40 on most personality traits, does not necessarily mean that the chance of obtaining a particular score cannot exceed 40%. In some families, some personality traits are more strongly inherited, and in such families the MZ twins’ correlation for those traits will be higher than .40. MZ twins from different families have a genetic tendency to score high and low on different traits, and this is why the average intra-pair MZ correlations for personality in most large twin samples tends to be approximately .40. Thus, if most of the genes that add
27864 Avhandling_inlaga.indd 61 1/28/08 9:20:01 AM
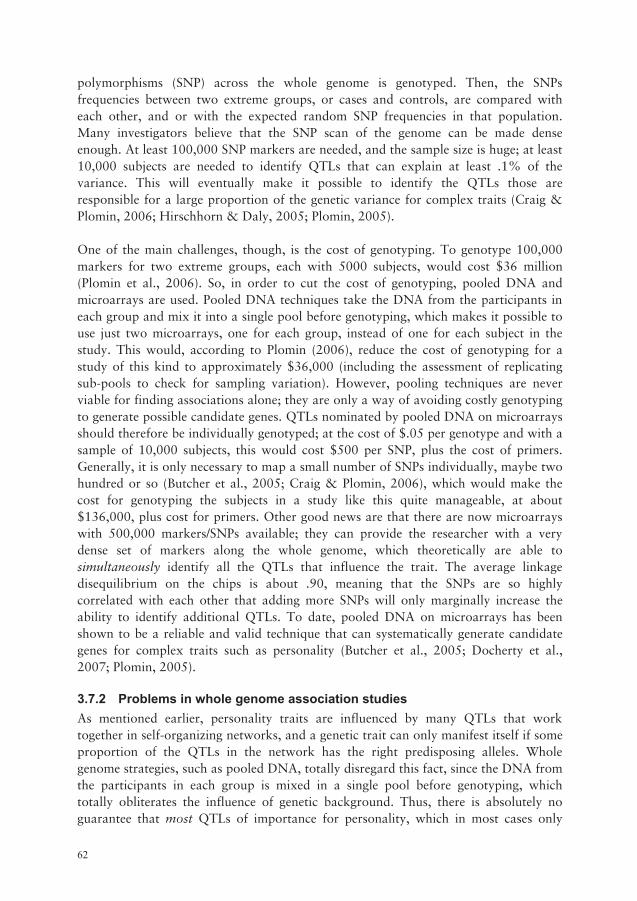
63
have a specific behavioral effect against a specific genetic background, can be identified in this way (Hirschhorn & Daly, 2005; Weiss & Terwilliger, 2000). The association between the apolipoprotein E (APOE) gene and Alzheimer’s disease, mentioned earlier, is an illustrative example of this. Even though the additive effect of the apolipoprotein E (APOE) gene accounts for 15% of the liability for Alzheimer’s disease in populations of European descent, this gene shows inconsistent findings and sometimes negative associations in African Americans, where the genetic background is different (Farrer et al., 1997; Tang et al., 1996; Tang et al., 1998). Furthermore, since the DNA from the participants in each group is mixed in a single pool before genotyping, pooled DNA techniques are best equipped to identify QTLs that account for some proportion of the additive genetic variance (Sham et al., 2002). However, as mentioned above, non-additive genetic effects are likely to account for at least half of the genetic variance for personality, and non-additive genetic effects always mask some proportion of additive genetic effects in large samples (Cordell, 2002; Frankel & Schork, 1996). Thus, using pooled DNA on micro arrays may not work well for a phenotype such as personality. Moreover, even if several QTLs that add up to detectable effects in a “QTL set” and huge samples are used, the effect size for some QTL that influences a complex trait will simply be too small to be identified (Plomin & Caspi, 1998; Plomin et al., 2006). This appears to be the case for a phenotype such as general intelligence, where as much as 50% of the variance is assumed to be due to additive genetic effects. Butcher et al. (2005) used a chip with 10,000 SNPs in a sample of 6000 children, and expected to find one tenth of the hundred significantly associated QTLs that are needed to account for the additive genetic effects, if the average effect size for a QTL is .5%. They found that a QTL set with 4 QTLs could explain only .76% of the variance for general intelligence, which is considerably less than the 5% expected. Thus, the average effect size for a QTL that influences intelligence may be .2% instead of .5%. Accordingly, the genetic heterogeneity problem that is present in huge samples may be much larger than generally recognized (Meaburn et al., 2007) – even for a phenotype such as intelligence, where as much as 50% of the variance is assumed to be due to additive genetic effects. Consequently, there are no reasons to believe that the genetic heterogeneity problems for a phenotype such as personality, where about half of the genetic effects are non-additive, are smaller. This means that when the sample size in whole genome studies is increased to gain power, and the genetic heterogeneity is increased as a result, it is not necessarily the case that the actual power to detect an association with a genetic marker improves (Fanous & Kendler, 2005). The effort to increase power by increasing the sample size may instead create a “vicious circle” which produces genetic effects sizes that are smaller and smaller, which potentially can make it close to impossible to conclusively identify most QTLs for personality. In other words, even though whole genome association studies in theory are able to simultaneously identify additional candidate genes for personality, which have a relatively large additive genetic effect, and it is
62
polymorphisms (SNP) across the whole genome is genotyped. Then, the SNPs frequencies between two extreme groups, or cases and controls, are compared with each other, and or with the expected random SNP frequencies in that population. Many investigators believe that the SNP scan of the genome can be made dense enough. At least 100,000 SNP markers are needed, and the sample size is huge; at least 10,000 subjects are needed to identify QTLs that can explain at least .1% of the variance. This will eventually make it possible to identify the QTLs those are responsible for a large proportion of the genetic variance for complex traits (Craig & Plomin, 2006; Hirschhorn & Daly, 2005; Plomin, 2005). One of the main challenges, though, is the cost of genotyping. To genotype 100,000 markers for two extreme groups, each with 5000 subjects, would cost $36 million (Plomin et al., 2006). So, in order to cut the cost of genotyping, pooled DNA and microarrays are used. Pooled DNA techniques take the DNA from the participants in each group and mix it into a single pool before genotyping, which makes it possible to use just two microarrays, one for each group, instead of one for each subject in the study. This would, according to Plomin (2006), reduce the cost of genotyping for a study of this kind to approximately $36,000 (including the assessment of replicating sub-pools to check for sampling variation). However, pooling techniques are never viable for finding associations alone; they are only a way of avoiding costly genotyping to generate possible candidate genes. QTLs nominated by pooled DNA on microarrays should therefore be individually genotyped; at the cost of $.05 per genotype and with a sample of 10,000 subjects, this would cost $500 per SNP, plus the cost of primers. Generally, it is only necessary to map a small number of SNPs individually, maybe two hundred or so (Butcher et al., 2005; Craig & Plomin, 2006), which would make the cost for genotyping the subjects in a study like this quite manageable, at about $136,000, plus cost for primers. Other good news are that there are now microarrays with 500,000 markers/SNPs available; they can provide the researcher with a very dense set of markers along the whole genome, which theoretically are able to simultaneously identify all the QTLs that influence the trait. The average linkage disequilibrium on the chips is about .90, meaning that the SNPs are so highly correlated with each other that adding more SNPs will only marginally increase the ability to identify additional QTLs. To date, pooled DNA on microarrays has been shown to be a reliable and valid technique that can systematically generate candidate genes for complex traits such as personality (Butcher et al., 2005; Docherty et al., 2007; Plomin, 2005). 3.7.2 Problems in whole genome association studies As mentioned earlier, personality traits are influenced by many QTLs that work together in self-organizing networks, and a genetic trait can only manifest itself if some proportion of the QTLs in the network has the right predisposing alleles. Whole genome strategies, such as pooled DNA, totally disregard this fact, since the DNA from the participants in each group is mixed in a single pool before genotyping, which totally obliterates the influence of genetic background. Thus, there is absolutely no guarantee that most QTLs of importance for personality, which in most cases only
27864 Avhandling_inlaga.indd 62 1/28/08 9:20:02 AM

63
have a specific behavioral effect against a specific genetic background, can be identified in this way (Hirschhorn & Daly, 2005; Weiss & Terwilliger, 2000). The association between the apolipoprotein E (APOE) gene and Alzheimer’s disease, mentioned earlier, is an illustrative example of this. Even though the additive effect of the apolipoprotein E (APOE) gene accounts for 15% of the liability for Alzheimer’s disease in populations of European descent, this gene shows inconsistent findings and sometimes negative associations in African Americans, where the genetic background is different (Farrer et al., 1997; Tang et al., 1996; Tang et al., 1998). Furthermore, since the DNA from the participants in each group is mixed in a single pool before genotyping, pooled DNA techniques are best equipped to identify QTLs that account for some proportion of the additive genetic variance (Sham et al., 2002). However, as mentioned above, non-additive genetic effects are likely to account for at least half of the genetic variance for personality, and non-additive genetic effects always mask some proportion of additive genetic effects in large samples (Cordell, 2002; Frankel & Schork, 1996). Thus, using pooled DNA on micro arrays may not work well for a phenotype such as personality. Moreover, even if several QTLs that add up to detectable effects in a “QTL set” and huge samples are used, the effect size for some QTL that influences a complex trait will simply be too small to be identified (Plomin & Caspi, 1998; Plomin et al., 2006). This appears to be the case for a phenotype such as general intelligence, where as much as 50% of the variance is assumed to be due to additive genetic effects. Butcher et al. (2005) used a chip with 10,000 SNPs in a sample of 6000 children, and expected to find one tenth of the hundred significantly associated QTLs that are needed to account for the additive genetic effects, if the average effect size for a QTL is .5%. They found that a QTL set with 4 QTLs could explain only .76% of the variance for general intelligence, which is considerably less than the 5% expected. Thus, the average effect size for a QTL that influences intelligence may be .2% instead of .5%. Accordingly, the genetic heterogeneity problem that is present in huge samples may be much larger than generally recognized (Meaburn et al., 2007) – even for a phenotype such as intelligence, where as much as 50% of the variance is assumed to be due to additive genetic effects. Consequently, there are no reasons to believe that the genetic heterogeneity problems for a phenotype such as personality, where about half of the genetic effects are non-additive, are smaller. This means that when the sample size in whole genome studies is increased to gain power, and the genetic heterogeneity is increased as a result, it is not necessarily the case that the actual power to detect an association with a genetic marker improves (Fanous & Kendler, 2005). The effort to increase power by increasing the sample size may instead create a “vicious circle” which produces genetic effects sizes that are smaller and smaller, which potentially can make it close to impossible to conclusively identify most QTLs for personality. In other words, even though whole genome association studies in theory are able to simultaneously identify additional candidate genes for personality, which have a relatively large additive genetic effect, and it is
62
polymorphisms (SNP) across the whole genome is genotyped. Then, the SNPs frequencies between two extreme groups, or cases and controls, are compared with each other, and or with the expected random SNP frequencies in that population. Many investigators believe that the SNP scan of the genome can be made dense enough. At least 100,000 SNP markers are needed, and the sample size is huge; at least 10,000 subjects are needed to identify QTLs that can explain at least .1% of the variance. This will eventually make it possible to identify the QTLs those are responsible for a large proportion of the genetic variance for complex traits (Craig & Plomin, 2006; Hirschhorn & Daly, 2005; Plomin, 2005). One of the main challenges, though, is the cost of genotyping. To genotype 100,000 markers for two extreme groups, each with 5000 subjects, would cost $36 million (Plomin et al., 2006). So, in order to cut the cost of genotyping, pooled DNA and microarrays are used. Pooled DNA techniques take the DNA from the participants in each group and mix it into a single pool before genotyping, which makes it possible to use just two microarrays, one for each group, instead of one for each subject in the study. This would, according to Plomin (2006), reduce the cost of genotyping for a study of this kind to approximately $36,000 (including the assessment of replicating sub-pools to check for sampling variation). However, pooling techniques are never viable for finding associations alone; they are only a way of avoiding costly genotyping to generate possible candidate genes. QTLs nominated by pooled DNA on microarrays should therefore be individually genotyped; at the cost of $.05 per genotype and with a sample of 10,000 subjects, this would cost $500 per SNP, plus the cost of primers. Generally, it is only necessary to map a small number of SNPs individually, maybe two hundred or so (Butcher et al., 2005; Craig & Plomin, 2006), which would make the cost for genotyping the subjects in a study like this quite manageable, at about $136,000, plus cost for primers. Other good news are that there are now microarrays with 500,000 markers/SNPs available; they can provide the researcher with a very dense set of markers along the whole genome, which theoretically are able to simultaneously identify all the QTLs that influence the trait. The average linkage disequilibrium on the chips is about .90, meaning that the SNPs are so highly correlated with each other that adding more SNPs will only marginally increase the ability to identify additional QTLs. To date, pooled DNA on microarrays has been shown to be a reliable and valid technique that can systematically generate candidate genes for complex traits such as personality (Butcher et al., 2005; Docherty et al., 2007; Plomin, 2005). 3.7.2 Problems in whole genome association studies As mentioned earlier, personality traits are influenced by many QTLs that work together in self-organizing networks, and a genetic trait can only manifest itself if some proportion of the QTLs in the network has the right predisposing alleles. Whole genome strategies, such as pooled DNA, totally disregard this fact, since the DNA from the participants in each group is mixed in a single pool before genotyping, which totally obliterates the influence of genetic background. Thus, there is absolutely no guarantee that most QTLs of importance for personality, which in most cases only
27864 Avhandling_inlaga.indd 63 1/28/08 9:20:02 AM

65
hopefully can contribute to establishing “firm” associations between genes and personality in the future.
64
reasonable to first try to identify these genes (Plomin & Caspi, 1998). It may, nevertheless, due to the presence of non-additive genetic effects and the elevated genetic heterogeneity that is present in huge samples, be very hard to identify most QTLs for personality by adopting this approach (Frankel & Schork, 1996; Terwilliger & Weiss, 1998; Weiss & Terwilliger, 2000). Accordingly, using pooled DNA on microarrays may not (despite the cut in the cost for genotyping) be the best way to find QTL for personality. For example, it has been suggested that it is more efficient to divide the material into several extreme groups and use a multistage approach (Lin, 2006). In this approach all subjects are genotyped at the first stage, and because the genetic effect sizes for personality QTLs are so small in large samples, at least 1000 subjects in each extreme group needs to be individually genotyped at the first stage. For complete coverage of the genome, this would cost $2 million, with each 500K micro array costing $1,000 (Thomas, 2006). Thereafter, at stage two the most strongly significantly associated QTLs would get tested again in two new extreme groups with the same or larger sample sizes. This process can then be repeated to distinguish the few true-positive associations identified at stage 1 from the many thousand false-positive results that typically occur by chance in whole genome association studies. In other word, a multistage sampling design like this can be thought of as a form of built-in replication that can handle the problem of numerous false-positive findings (Satagopan & Elston, 2003). But, if the same epidemiologic study designs and population are used at the different stages, this is just a form of statistical replication. True scientific replication involves different investigators, studying different populations, using different study designs, with potentially different strengths and weaknesses (Thomas, 2006). That is, associations between candidate genes and personality that have already been identified and that will be generated from whole genome association studies in the future must be replicated in additional samples. The genetic networks that contribute to a trait must be mapped out and these networks must be linked to the various biological mechanisms that are responsible for the associations, and it is exactly for these reasons that it can be of interest to collect iris data Thus, rather than trying to replicate candidate gene findings for personality using top-down approaches (i.e. using whole genome scan studies) in huge samples with elevated genetic heterogeneity, which give a very tiny effect size for each candidate gene (Plomin et al., 2006), and which are too expensive to perform for most labs (Meaburn et al., 2007; Thomas, 2006), it may be more efficient and therefore cheaper to identify the genes that influence personality by using iris data. As will be discussed in parts IV and V, iris data make it possible to increase power by decreasing the genetic heterogeneity that is present in huge unmatched samples. This is achieved by using a pathway based approach and a person-oriented methodology that takes advantage of the self-organizing mechanisms that govern the development of the nervous system which
27864 Avhandling_inlaga.indd 64 1/28/08 9:20:03 AM

65
hopefully can contribute to establishing “firm” associations between genes and personality in the future.
64
reasonable to first try to identify these genes (Plomin & Caspi, 1998). It may, nevertheless, due to the presence of non-additive genetic effects and the elevated genetic heterogeneity that is present in huge samples, be very hard to identify most QTLs for personality by adopting this approach (Frankel & Schork, 1996; Terwilliger & Weiss, 1998; Weiss & Terwilliger, 2000). Accordingly, using pooled DNA on microarrays may not (despite the cut in the cost for genotyping) be the best way to find QTL for personality. For example, it has been suggested that it is more efficient to divide the material into several extreme groups and use a multistage approach (Lin, 2006). In this approach all subjects are genotyped at the first stage, and because the genetic effect sizes for personality QTLs are so small in large samples, at least 1000 subjects in each extreme group needs to be individually genotyped at the first stage. For complete coverage of the genome, this would cost $2 million, with each 500K micro array costing $1,000 (Thomas, 2006). Thereafter, at stage two the most strongly significantly associated QTLs would get tested again in two new extreme groups with the same or larger sample sizes. This process can then be repeated to distinguish the few true-positive associations identified at stage 1 from the many thousand false-positive results that typically occur by chance in whole genome association studies. In other word, a multistage sampling design like this can be thought of as a form of built-in replication that can handle the problem of numerous false-positive findings (Satagopan & Elston, 2003). But, if the same epidemiologic study designs and population are used at the different stages, this is just a form of statistical replication. True scientific replication involves different investigators, studying different populations, using different study designs, with potentially different strengths and weaknesses (Thomas, 2006). That is, associations between candidate genes and personality that have already been identified and that will be generated from whole genome association studies in the future must be replicated in additional samples. The genetic networks that contribute to a trait must be mapped out and these networks must be linked to the various biological mechanisms that are responsible for the associations, and it is exactly for these reasons that it can be of interest to collect iris data Thus, rather than trying to replicate candidate gene findings for personality using top-down approaches (i.e. using whole genome scan studies) in huge samples with elevated genetic heterogeneity, which give a very tiny effect size for each candidate gene (Plomin et al., 2006), and which are too expensive to perform for most labs (Meaburn et al., 2007; Thomas, 2006), it may be more efficient and therefore cheaper to identify the genes that influence personality by using iris data. As will be discussed in parts IV and V, iris data make it possible to increase power by decreasing the genetic heterogeneity that is present in huge unmatched samples. This is achieved by using a pathway based approach and a person-oriented methodology that takes advantage of the self-organizing mechanisms that govern the development of the nervous system which
27864 Avhandling_inlaga.indd 65 1/28/08 9:20:03 AM

67
effect sizes for the candidate genes generated by whole genome scan studies most likely are very small, it will be interesting to replicate such findings in designs that are able to pinpoint for whom a particular gene is most relevant. For these reasons, and because iris data make it possible to use a pathway based approach capable of decreasing genetic heterogeneity in large samples, which most likely also makes it easier to identify genes that network together, it is worthwhile to investigate the extent to which iris data are helpful. 4.1.2 Iris data characteristics that may be helpful The iris spot is probably the most complex tissue structure that is readily available on the outside of the human body. Iris tissue forms complex patterns that contain many distinctive features, such as arching ligaments, contraction furrows, ridges, crypts, rings, pigment dots and zigzag collaret’s, some of which can be seen in Figure 4. Although the iris spot is small (11 mm), the variability among different individuals is enormous. Evidence from the iris recognition literature show that the iris spot holds as many as 249 degrees-of-freedom (Daugman, 2003).
Figure 4
A B
DFour different types of patterns in the human iris: A no crypts, only dense parallel fibers; B many pigment dots, but no crypts; C many crypts; D both crypts and pigment dots.
C
66
Part IV
This section examines molecular research on the iris and the brain, suggests that genes expressed in the iris may be associated with behavior, and explains how the use of iris characteristics can increase power to detect QTLs for personality by using a person-oriented approach that takes advantage of the self-organizing properties of the nervous system. The empirical foundation for the question asked in this dissertation, as well as the empirical work performed, is presented here. 4.1.1 Why use iris characteristics? The main reason why it may be more efficient to use iris characteristics than to try to replicate QTLs with small effects in large samples is that the four problems described above, i.e. incomplete penetrance, high frequency of predisposing alleles, genetic heterogeneity and polygenetic inheritance, have turned out to be so great for genetic personality research. Due to the genetic heterogeneity that is present in large samples, which (arguably is the most important obstacle of the four), most candidate genes are expected to explain less than 1% of the variance in personality. Indeed, the expected average QTL effect sizes for personality in large samples may fall to the same level as for intelligence (Meaburn et al., 2007), where the expected average effect size repeatedly has been halved during the last 10 years. The average QTL effect size for intelligence is currently believed to account for about .2% of the variance (Butcher et al., 2005; Plomin et al., 2006; Plomin et al., 1995). One explanation for this decrease in expected effect sizes for QTLs is that genetic heterogeneity increases when the sample size increases. Thus, the actual power to detect an association with a genetic marker may not improve when the sample size increases. If genetic heterogeneity increases more than sample size improves the power to detect small effects, then the effort of collecting data in large samples to improve power will be wasted (Fanous & Kendler, 2005). As discussed in Part III, this can potentially develop into a methodological deadlock for whole genome association studies (Frankel & Schork, 1996; Terwilliger & Weiss, 1998; Weiss & Terwilliger, 2000), at least for candidate genes without a relatively large additive genetic effect (Plomin & Caspi, 1998; Plomin et al., 2006). Thus, rather than trying to replicate candidate gene findings for personality using top-down approaches (i.e. using whole genome scan studies) in huge samples with elevated genetic heterogeneity, which give a very tiny effect size for each candidate gene (Plomin et al., 2006), and which are too expensive to perform for most labs (Thomas, 2006), it may be more efficient and therefore cheaper to identify the genes that influence personality by using iris data. Furthermore, there are also other reasons to use iris characteristics. The candidate genes generated from whole genome scan studies in the future need to be replicated in designs other than the one that is built into the multistage sampling method, which will be used in whole genome scan studies. True scientific replication involves different investigators, studying different populations and using different study designs, all with potentially different strengths and weaknesses (Thomas, 2006). Moreover, because the
27864 Avhandling_inlaga.indd 66 1/28/08 9:20:03 AM
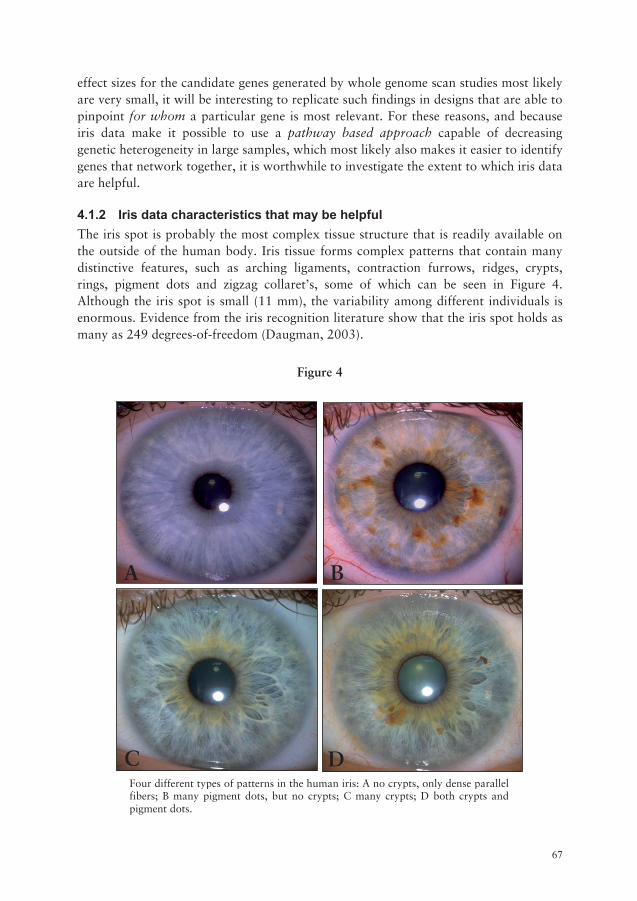
67
effect sizes for the candidate genes generated by whole genome scan studies most likely are very small, it will be interesting to replicate such findings in designs that are able to pinpoint for whom a particular gene is most relevant. For these reasons, and because iris data make it possible to use a pathway based approach capable of decreasing genetic heterogeneity in large samples, which most likely also makes it easier to identify genes that network together, it is worthwhile to investigate the extent to which iris data are helpful. 4.1.2 Iris data characteristics that may be helpful The iris spot is probably the most complex tissue structure that is readily available on the outside of the human body. Iris tissue forms complex patterns that contain many distinctive features, such as arching ligaments, contraction furrows, ridges, crypts, rings, pigment dots and zigzag collaret’s, some of which can be seen in Figure 4. Although the iris spot is small (11 mm), the variability among different individuals is enormous. Evidence from the iris recognition literature show that the iris spot holds as many as 249 degrees-of-freedom (Daugman, 2003).
Figure 4
A B
DFour different types of patterns in the human iris: A no crypts, only dense parallel fibers; B many pigment dots, but no crypts; C many crypts; D both crypts and pigment dots.
C
66
Part IV
This section examines molecular research on the iris and the brain, suggests that genes expressed in the iris may be associated with behavior, and explains how the use of iris characteristics can increase power to detect QTLs for personality by using a person-oriented approach that takes advantage of the self-organizing properties of the nervous system. The empirical foundation for the question asked in this dissertation, as well as the empirical work performed, is presented here. 4.1.1 Why use iris characteristics? The main reason why it may be more efficient to use iris characteristics than to try to replicate QTLs with small effects in large samples is that the four problems described above, i.e. incomplete penetrance, high frequency of predisposing alleles, genetic heterogeneity and polygenetic inheritance, have turned out to be so great for genetic personality research. Due to the genetic heterogeneity that is present in large samples, which (arguably is the most important obstacle of the four), most candidate genes are expected to explain less than 1% of the variance in personality. Indeed, the expected average QTL effect sizes for personality in large samples may fall to the same level as for intelligence (Meaburn et al., 2007), where the expected average effect size repeatedly has been halved during the last 10 years. The average QTL effect size for intelligence is currently believed to account for about .2% of the variance (Butcher et al., 2005; Plomin et al., 2006; Plomin et al., 1995). One explanation for this decrease in expected effect sizes for QTLs is that genetic heterogeneity increases when the sample size increases. Thus, the actual power to detect an association with a genetic marker may not improve when the sample size increases. If genetic heterogeneity increases more than sample size improves the power to detect small effects, then the effort of collecting data in large samples to improve power will be wasted (Fanous & Kendler, 2005). As discussed in Part III, this can potentially develop into a methodological deadlock for whole genome association studies (Frankel & Schork, 1996; Terwilliger & Weiss, 1998; Weiss & Terwilliger, 2000), at least for candidate genes without a relatively large additive genetic effect (Plomin & Caspi, 1998; Plomin et al., 2006). Thus, rather than trying to replicate candidate gene findings for personality using top-down approaches (i.e. using whole genome scan studies) in huge samples with elevated genetic heterogeneity, which give a very tiny effect size for each candidate gene (Plomin et al., 2006), and which are too expensive to perform for most labs (Thomas, 2006), it may be more efficient and therefore cheaper to identify the genes that influence personality by using iris data. Furthermore, there are also other reasons to use iris characteristics. The candidate genes generated from whole genome scan studies in the future need to be replicated in designs other than the one that is built into the multistage sampling method, which will be used in whole genome scan studies. True scientific replication involves different investigators, studying different populations and using different study designs, all with potentially different strengths and weaknesses (Thomas, 2006). Moreover, because the
27864 Avhandling_inlaga.indd 67 1/28/08 9:20:04 AM

69
of 100 MZ twin pairs, 99 DZ twin pairs, and 99 unrelated randomly paired subjects. Below follows a short summary of this study (STUDY I). The whole study with all details is available on page 192 – 200. Thus, to keep the “discussion-friendly” format that has been used throughout this dissertation, the reader interested in methodological issues is referred to the methodological section in STUDY I. The same is the case for the methodological details in STUDY II and STUDY III 4.2.2 Comparative scale construction Close-up color photos were taken of both irises from all twins and randomly paired unrelated subjects in the sample. The photo images of the subjects’ irises were placed on CD-ROM disks, so they could be viewed on a computer screen. Comparative scales were constructed for each iris characteristic by selecting photographs from the entire sample of all the pictures that represented the endpoints of each comparative scale. The photos representing an endpoint were found by looking through all photos in the sample (n=596), and pinpointing the most representative among the most extreme on the iris characteristics of interest. Photos in the steps between the endpoints were also selected to represent point distributed between endpoints, as equally as possible. Five continuous scales were constructed in this way. All scales had five scale steps except the scale for eye color which had four scale steps. The scales that measure the iris characteristics of interest has been published (STUDY II) and can be viewed on pages 822-824. 4.2.3 The rating catalogue and rating procedure Specially trained raters independently reviewed the photographs of the left iris and judged the scale step to which each photo was most similar. The raters judged the number, size and distinctiveness of crypts, as well as the pigment dots, the Wolfflin nodules, the contraction furrows, and the different shades of color. Two raters, blind to zygosity, reviewed each photograph. In order to secure reliable estimates, written decision rules were created for the raters. The rules made reference to photos that exemplified what the raters should do when they were confronted with iris photos that lay between two scale steps. In all, 90 photos were used as examples in scales or as reference photos. These photos were included in the analysis that estimated heritability but not used in reliability testing. The number of observations that was included in the inter-rater reliability analysis for the five iris characteristics ranged from 310 to 589; for details, see Table 1 on page 194 (in STUDY I).
4.2.4 Analysis and result The raters’ judgments of which scale steps each photo was most similar to was scored as a continuous variable. Variance-covariance matrices were calculated, and sex and age limiting structural equation models and a maximum-likelihood model fitting procedure using the program Mx (Neale et al., 1999) were undertaken. The variance-covariance matrices used for testing sex specificity were based on the residuals controlling for age, and the matrices for testing age effects were based on residuals controlling for sex. The results show the following:
68
Thus, because the appearances of the iris patterns are so complex, but nevertheless most likely influenced by genes in a systematic manner (Bito et al., 1997; Burkhardt, 1992a; Burkhardt, 1992b; Sturm & Frudakis, 2004), the iris may be a exceptionally suitable matching tool. That is, provided that iris patterns are inherited, then the variability in the genetic background for groups that have been matched on their iris characteristics by definition will decrease, compared with unmatched groups, and this drop in genetic complexity at the molecular level may allow the identification of QTLs and candidate genes for personality without large additive genetic effects. The basic idea is thus exactly the same as used in inbred mice strains, where it is much easier to identify QTLs for emotionality in strains where the genetic background is similar, than in strains where the genetic background is more complex. Remember that the effect size for each candidate gene is much larger in samples where the genetic background is similar, only 6 loci can account for almost all phenotypic variance for emotionality in inbred mice strains (Flint, 2003; Flint et al., 2005; Willis-Owen & Flint, 2006). Thus, because iris data can provide much more specific pathway based matching than is possible to achieve in large samples that have been matched on sex, age and ethnicity, which in turn can decrease the genetic heterogeneity that is present in large samples (Sham et al., 2002). The effect size for some candidate genes for personality may be larger in a group where all members in the group have the same type of iris characteristics (which is analyzed separately from other groups with other iris characteristics), and this may allow for the replication of candidate gene findings in a more straightforward manner than currently is possible. However, in order for this approach to work, a substantial proportion of the variability in iris characteristics used in the iris matching procedure must be inherited. 4.2.1 Study I The first study in this dissertation (STUDY I) addressed this question, and asked if iris characteristics other than eye color are heritable. This question is crucial to answer, in order to rule out that the variation in appearance of the iris characteristics in general is due to random effects, and to validate the extent to which the iris can be used as a biomarker that reflects genetic differences among people. Five major questions were addressed:
1) To what extent can independent raters who are blind to zygosity rate iris
characteristics in a reliable way?
2) What are the heritability estimates of different iris characteristics?
3) Are the same genes influencing the iris characteristics for males and females?
4) Are there any differences in the magnitudes in heritability for male and females?
5) To what extent are there any age-group differences in the heritability estimates?
In order to answer these questions the genetic contribution to the phenotypic variance among five general textural iris characteristics were examined in a German twin sample
27864 Avhandling_inlaga.indd 68 1/28/08 9:20:05 AM

69
of 100 MZ twin pairs, 99 DZ twin pairs, and 99 unrelated randomly paired subjects. Below follows a short summary of this study (STUDY I). The whole study with all details is available on page 192 – 200. Thus, to keep the “discussion-friendly” format that has been used throughout this dissertation, the reader interested in methodological issues is referred to the methodological section in STUDY I. The same is the case for the methodological details in STUDY II and STUDY III 4.2.2 Comparative scale construction Close-up color photos were taken of both irises from all twins and randomly paired unrelated subjects in the sample. The photo images of the subjects’ irises were placed on CD-ROM disks, so they could be viewed on a computer screen. Comparative scales were constructed for each iris characteristic by selecting photographs from the entire sample of all the pictures that represented the endpoints of each comparative scale. The photos representing an endpoint were found by looking through all photos in the sample (n=596), and pinpointing the most representative among the most extreme on the iris characteristics of interest. Photos in the steps between the endpoints were also selected to represent point distributed between endpoints, as equally as possible. Five continuous scales were constructed in this way. All scales had five scale steps except the scale for eye color which had four scale steps. The scales that measure the iris characteristics of interest has been published (STUDY II) and can be viewed on pages 822-824. 4.2.3 The rating catalogue and rating procedure Specially trained raters independently reviewed the photographs of the left iris and judged the scale step to which each photo was most similar. The raters judged the number, size and distinctiveness of crypts, as well as the pigment dots, the Wolfflin nodules, the contraction furrows, and the different shades of color. Two raters, blind to zygosity, reviewed each photograph. In order to secure reliable estimates, written decision rules were created for the raters. The rules made reference to photos that exemplified what the raters should do when they were confronted with iris photos that lay between two scale steps. In all, 90 photos were used as examples in scales or as reference photos. These photos were included in the analysis that estimated heritability but not used in reliability testing. The number of observations that was included in the inter-rater reliability analysis for the five iris characteristics ranged from 310 to 589; for details, see Table 1 on page 194 (in STUDY I).
4.2.4 Analysis and result The raters’ judgments of which scale steps each photo was most similar to was scored as a continuous variable. Variance-covariance matrices were calculated, and sex and age limiting structural equation models and a maximum-likelihood model fitting procedure using the program Mx (Neale et al., 1999) were undertaken. The variance-covariance matrices used for testing sex specificity were based on the residuals controlling for age, and the matrices for testing age effects were based on residuals controlling for sex. The results show the following:
68
Thus, because the appearances of the iris patterns are so complex, but nevertheless most likely influenced by genes in a systematic manner (Bito et al., 1997; Burkhardt, 1992a; Burkhardt, 1992b; Sturm & Frudakis, 2004), the iris may be a exceptionally suitable matching tool. That is, provided that iris patterns are inherited, then the variability in the genetic background for groups that have been matched on their iris characteristics by definition will decrease, compared with unmatched groups, and this drop in genetic complexity at the molecular level may allow the identification of QTLs and candidate genes for personality without large additive genetic effects. The basic idea is thus exactly the same as used in inbred mice strains, where it is much easier to identify QTLs for emotionality in strains where the genetic background is similar, than in strains where the genetic background is more complex. Remember that the effect size for each candidate gene is much larger in samples where the genetic background is similar, only 6 loci can account for almost all phenotypic variance for emotionality in inbred mice strains (Flint, 2003; Flint et al., 2005; Willis-Owen & Flint, 2006). Thus, because iris data can provide much more specific pathway based matching than is possible to achieve in large samples that have been matched on sex, age and ethnicity, which in turn can decrease the genetic heterogeneity that is present in large samples (Sham et al., 2002). The effect size for some candidate genes for personality may be larger in a group where all members in the group have the same type of iris characteristics (which is analyzed separately from other groups with other iris characteristics), and this may allow for the replication of candidate gene findings in a more straightforward manner than currently is possible. However, in order for this approach to work, a substantial proportion of the variability in iris characteristics used in the iris matching procedure must be inherited. 4.2.1 Study I The first study in this dissertation (STUDY I) addressed this question, and asked if iris characteristics other than eye color are heritable. This question is crucial to answer, in order to rule out that the variation in appearance of the iris characteristics in general is due to random effects, and to validate the extent to which the iris can be used as a biomarker that reflects genetic differences among people. Five major questions were addressed:
1) To what extent can independent raters who are blind to zygosity rate iris
characteristics in a reliable way?
2) What are the heritability estimates of different iris characteristics?
3) Are the same genes influencing the iris characteristics for males and females?
4) Are there any differences in the magnitudes in heritability for male and females?
5) To what extent are there any age-group differences in the heritability estimates?
In order to answer these questions the genetic contribution to the phenotypic variance among five general textural iris characteristics were examined in a German twin sample
27864 Avhandling_inlaga.indd 69 1/28/08 9:20:05 AM

71
American journal Molecular Vision (STUDY II). The whole study, with all details, is available on pages 821 – 831. 4.3.2 Method Just as it is possible to estimate the heritability for a trait by comparing how similar MZ and DZ twins are on the same trait, it is possible to estimate how much of the phenotypic correlation between two traits is due to the same set of genes. Such multivariate genetic analysis is an extension of the genetic univariate analysis that estimates heritability. The procedure is straightforward. Instead of correlating Twin 1’s scores with Twin 2’s scores on the same measures, which is done in univariate analysis that estimates heritability (see equations 5-9 in Part I), multivariate analysis uses the cross-twin correlation, which refers to the correlation between Twin 1’s and Twin 2’s scores across two measures. For example, in STUDY II, all possible cross-twin correlation for MZ and DZ twins for the five iris characteristics were calculated. That is, Twin 1’s scores on crypts were correlated with Twin 2’s score on pigment dots, iris color, Wolfflin nodules and contraction furrows, etc. When all cross-twin correlations for the MZ and DZ twins were obtained, the differences between them, just as in the univariate genetic analysis, were doubled. However, whereas doubling the difference between the MZ and DZ twin correlations on the same measure estimates the heritability, doubling the difference between the MZ and DZ cross-twin correlation estimates the genetic contribution to the phenotypic correlation between two traits (Neale & Cardon, 1992). In other words, by comparing all the cross-twin correlations for the iris characteristics among the MZ and DZ twins, STUDY II could estimate how much of the phenotypic correlation between the iris measures that is due to the same set of genes (this estimate is from now on called the “genetic correlation”). A structural equation model with a Cholesky decomposition was applied to the variance-covariance matrices for the MZ and DZ twins, using the statistical program Mx (Neale et al., 2004). The estimates were done on the same sample as used in Study 1. However, in order to evaluate whether the genetic correlations between the iris characteristics were logical from a morphological standpoint, and to assign plausible candidate genes that might explain the genetic correlation, STUDY II also needed to review the morphology and the embryological development of the iris characteristics. Below, I focus on crypt and contraction furrows, since the morphology and embryological development of these iris characteristics make them the most likely ones to be associated with personality. 4.3.3.1 The morphology of the human iris Crypts and contraction furrows are measures that are related to the thickness and the density of the iris. Crypt frequency is characterized by different degrees of hypoplasia in the two top cell layers in the iris, i.e. anterior border layer and underlying stroma, whereas contraction furrows are characterized by different degrees of hypoplasia or density conditions in any of the five cell layers present in the iris (Oyster, 1999). The overall thickness of these cell layers vary to a fairly large extent between people (Pavlin et al., 1992; Wirbelauer et al., 2005). Most people have an iris that is 0.173 – 0.766
70
1) The ability of independent raters to rate the iris characteristics in a similar manner, was satisfactory. The inter-rater reliabilities for the 5 scales ranged from .91 to .97, and the average inter-rater reliability was 95%. Thus, on average, there was only a 5% chance that the raters, when analyzing a specific tissue characteristic, would disagree in their judgment on which scale step was most appropriate. 2) The heritability estimates derived from the structural equation models revealed that 58-90% of the tissue differences in the iris were due to genetic effects, which implies that tissue differences in the iris can indeed be used as a biomarker that reflects genetic differences among people. There was no evidence of shared environmental effects. The heritability for crypts, pigment dots, Wolfflin nodules, and contraction furrows were 66, 58, 78 and 78%, respectively. 3 & 4) The next two questions concerned whether the same genes were influencing the iris characteristics of males and females, and if there was any difference in the magnitude of the heritability estimates for males and females. No such gender differences could be found in this sample. 5) And finally, there was only one iris characteristic that showed an age-group difference in the heritability estimates, namely Wolfflin nodules. The older cohort, age 25-75 years, had significantly larger heritability (90%) than the younger cohort, age 4-24 years (73%). No age-group differences were found for the other iris characteristics. Thus, the results of the first study support the notion that iris characteristics can be used as a matching tool that reflects genetic differences among people. Populations that have been matched on their iris characteristics will have a less complex genetic background than unmatched populations. This decrease in genetic complexity at the molecular level in iris-matched populations may be large enough, and suggests that iris data can provide much more specific pathway based matching than is possible to achieve in large samples that have been matched on sex, age and ethnicity (Sham et al., 2002). As mentioned earlier, the effect size for some candidate genes for personality may be larger in a group where all members in the group have the same type of iris characteristics (which is analyzed separately from other groups with other iris characteristics), and this may allow for the replication of candidate gene findings in a more straightforward manner than currently is possible. 4.3.1 Study II The second study in this dissertation revealed more facts about the iris as a biomarker, and investigated in a multivariate genetic analysis the extent to which the same set of genes influences more than one iris characteristic, i.e. the extent to which there is an overlap of genetic effects among the iris characteristics. The embryology and morphology of the iris characteristics were reviewed, and also – most importantly – the most plausible candidate genes responsible for the iris tissue differences. There follows a short summary of this study, which was published in the peer-reviewed international
27864 Avhandling_inlaga.indd 70 1/28/08 9:20:06 AM
71
American journal Molecular Vision (STUDY II). The whole study, with all details, is available on pages 821 – 831. 4.3.2 Method Just as it is possible to estimate the heritability for a trait by comparing how similar MZ and DZ twins are on the same trait, it is possible to estimate how much of the phenotypic correlation between two traits is due to the same set of genes. Such multivariate genetic analysis is an extension of the genetic univariate analysis that estimates heritability. The procedure is straightforward. Instead of correlating Twin 1’s scores with Twin 2’s scores on the same measures, which is done in univariate analysis that estimates heritability (see equations 5-9 in Part I), multivariate analysis uses the cross-twin correlation, which refers to the correlation between Twin 1’s and Twin 2’s scores across two measures. For example, in STUDY II, all possible cross-twin correlation for MZ and DZ twins for the five iris characteristics were calculated. That is, Twin 1’s scores on crypts were correlated with Twin 2’s score on pigment dots, iris color, Wolfflin nodules and contraction furrows, etc. When all cross-twin correlations for the MZ and DZ twins were obtained, the differences between them, just as in the univariate genetic analysis, were doubled. However, whereas doubling the difference between the MZ and DZ twin correlations on the same measure estimates the heritability, doubling the difference between the MZ and DZ cross-twin correlation estimates the genetic contribution to the phenotypic correlation between two traits (Neale & Cardon, 1992). In other words, by comparing all the cross-twin correlations for the iris characteristics among the MZ and DZ twins, STUDY II could estimate how much of the phenotypic correlation between the iris measures that is due to the same set of genes (this estimate is from now on called the “genetic correlation”). A structural equation model with a Cholesky decomposition was applied to the variance-covariance matrices for the MZ and DZ twins, using the statistical program Mx (Neale et al., 2004). The estimates were done on the same sample as used in Study 1. However, in order to evaluate whether the genetic correlations between the iris characteristics were logical from a morphological standpoint, and to assign plausible candidate genes that might explain the genetic correlation, STUDY II also needed to review the morphology and the embryological development of the iris characteristics. Below, I focus on crypt and contraction furrows, since the morphology and embryological development of these iris characteristics make them the most likely ones to be associated with personality. 4.3.3.1 The morphology of the human iris Crypts and contraction furrows are measures that are related to the thickness and the density of the iris. Crypt frequency is characterized by different degrees of hypoplasia in the two top cell layers in the iris, i.e. anterior border layer and underlying stroma, whereas contraction furrows are characterized by different degrees of hypoplasia or density conditions in any of the five cell layers present in the iris (Oyster, 1999). The overall thickness of these cell layers vary to a fairly large extent between people (Pavlin et al., 1992; Wirbelauer et al., 2005). Most people have an iris that is 0.173 – 0.766
70
1) The ability of independent raters to rate the iris characteristics in a similar manner, was satisfactory. The inter-rater reliabilities for the 5 scales ranged from .91 to .97, and the average inter-rater reliability was 95%. Thus, on average, there was only a 5% chance that the raters, when analyzing a specific tissue characteristic, would disagree in their judgment on which scale step was most appropriate. 2) The heritability estimates derived from the structural equation models revealed that 58-90% of the tissue differences in the iris were due to genetic effects, which implies that tissue differences in the iris can indeed be used as a biomarker that reflects genetic differences among people. There was no evidence of shared environmental effects. The heritability for crypts, pigment dots, Wolfflin nodules, and contraction furrows were 66, 58, 78 and 78%, respectively. 3 & 4) The next two questions concerned whether the same genes were influencing the iris characteristics of males and females, and if there was any difference in the magnitude of the heritability estimates for males and females. No such gender differences could be found in this sample. 5) And finally, there was only one iris characteristic that showed an age-group difference in the heritability estimates, namely Wolfflin nodules. The older cohort, age 25-75 years, had significantly larger heritability (90%) than the younger cohort, age 4-24 years (73%). No age-group differences were found for the other iris characteristics. Thus, the results of the first study support the notion that iris characteristics can be used as a matching tool that reflects genetic differences among people. Populations that have been matched on their iris characteristics will have a less complex genetic background than unmatched populations. This decrease in genetic complexity at the molecular level in iris-matched populations may be large enough, and suggests that iris data can provide much more specific pathway based matching than is possible to achieve in large samples that have been matched on sex, age and ethnicity (Sham et al., 2002). As mentioned earlier, the effect size for some candidate genes for personality may be larger in a group where all members in the group have the same type of iris characteristics (which is analyzed separately from other groups with other iris characteristics), and this may allow for the replication of candidate gene findings in a more straightforward manner than currently is possible. 4.3.1 Study II The second study in this dissertation revealed more facts about the iris as a biomarker, and investigated in a multivariate genetic analysis the extent to which the same set of genes influences more than one iris characteristic, i.e. the extent to which there is an overlap of genetic effects among the iris characteristics. The embryology and morphology of the iris characteristics were reviewed, and also – most importantly – the most plausible candidate genes responsible for the iris tissue differences. There follows a short summary of this study, which was published in the peer-reviewed international
27864 Avhandling_inlaga.indd 71 1/28/08 9:20:06 AM

73
Blue irises are the result of absent pigment production in the anterior border layer and stroma, and the interference and reflection of light from the minute protein particles in the iris that scatter the short blue wavelength to its surface, which gives the iris its blue appearance. However, a thin stoma without pigmentation may allow the brownish coloration of the posterior epithelium to show through (Sturm & Frudakis, 2004). Immunological cells, such as macrophages and mast cells are also present within the stroma (McMenamin, 1997). Mast cells produce pigment and they can accumulate into large egg shaped “clump cells” in the stroma, which tend to assemble near the collarette and at the periphery of the iris (Forrester et al., 2002). The density of mast cells in the stroma varies between people. Most people have 2.6 mast cells/mm3, but others may have ten times as many (May, 1999). Differences in pigment production may increase the overall density in stroma, and can influence how tight and often the iris folds when it adapts to different light conditions. Variability in mast cells and the amount of pigment that is produced by the melanocytes may therefore influence the number of contraction furrows that are present in the iris.
Figure 6
4.3.3.4 The sphincter and dilator muscles The sphincter and dilator muscles, which meet at the collarette, are cell layers that are situated on top of the anterior pigment epithelium. Their muscle fibers are organized differently (Figure 7). The sphincter forms a circumferential ring of smooth muscle, which consists of six to eight smooth muscle bundles. Altogether, they are about 1 mm in width. Dilator
Crypt of Fuchs: The cell- rich anterior border layer of the iris, which originates from the neural crest, is focally absent. In contrast to the smooth and matted appearance of the anterior border layer, the tissue deep down in the stroma seen on the crypt's floor, is loose.
72
mm thick (Mean = 0.369 +/- 0.084 mm). The cell layers in the iris are illustrated in Figure 5. 4.3.3.2 Anterior border layer The anterior border layer consists of modified stroma, i.e. a dense collection of fibroblasts, melanocytes and radially oriented collagen fibers. This layer has minute openings and therefore the underlying stroma is in free communication with the aqueous humor in the anterior chamber. Aqueous humor can thus move in and out of the stroma quickly during dilation and contraction. Larger deficiencies in the anterior border layer show up as crypt, readily visible from a close distance (figures 4B, 4C, 4D and 6). The principal distribution and depth of crypts are present at birth and do not appear to change much after birth (Oyster, 1999; Daugman, 2003; Larsson et al., 2003). 4.3.3.3 Stroma The stroma consists of loose connective tissue and is made up of fibroblasts, melanocytes, and collagen fibers (types I, III, VI and XVIII) (Maatta et al., 2006; Oyster, 1999; Rittig et al., 1990). About 66% of the cells in stroma are melanocytes, which are pigment-producing cells that determine the color of the iris (Sturm & Frudakis, 2004; Wilkerson et al., 1996). Normally, the pigmentation is fully developed a few years after birth (Bito et al., 1997; Sturm & Frudakis, 2004; Wilkerson et al., 1996).
Figure 5
1
The five cell layers in the human iris: 1 anterior border layer; 2 stroma; 3 sphincter, and dilator muscles (not shown); 4 anterior pigment epithelium; 5 posterior pigment epithelium.
2
3
4
5
27864 Avhandling_inlaga.indd 72 1/28/08 9:20:07 AM

73
Blue irises are the result of absent pigment production in the anterior border layer and stroma, and the interference and reflection of light from the minute protein particles in the iris that scatter the short blue wavelength to its surface, which gives the iris its blue appearance. However, a thin stoma without pigmentation may allow the brownish coloration of the posterior epithelium to show through (Sturm & Frudakis, 2004). Immunological cells, such as macrophages and mast cells are also present within the stroma (McMenamin, 1997). Mast cells produce pigment and they can accumulate into large egg shaped “clump cells” in the stroma, which tend to assemble near the collarette and at the periphery of the iris (Forrester et al., 2002). The density of mast cells in the stroma varies between people. Most people have 2.6 mast cells/mm3, but others may have ten times as many (May, 1999). Differences in pigment production may increase the overall density in stroma, and can influence how tight and often the iris folds when it adapts to different light conditions. Variability in mast cells and the amount of pigment that is produced by the melanocytes may therefore influence the number of contraction furrows that are present in the iris.
Figure 6
4.3.3.4 The sphincter and dilator muscles The sphincter and dilator muscles, which meet at the collarette, are cell layers that are situated on top of the anterior pigment epithelium. Their muscle fibers are organized differently (Figure 7). The sphincter forms a circumferential ring of smooth muscle, which consists of six to eight smooth muscle bundles. Altogether, they are about 1 mm in width. Dilator
Crypt of Fuchs: The cell- rich anterior border layer of the iris, which originates from the neural crest, is focally absent. In contrast to the smooth and matted appearance of the anterior border layer, the tissue deep down in the stroma seen on the crypt's floor, is loose.
72
mm thick (Mean = 0.369 +/- 0.084 mm). The cell layers in the iris are illustrated in Figure 5. 4.3.3.2 Anterior border layer The anterior border layer consists of modified stroma, i.e. a dense collection of fibroblasts, melanocytes and radially oriented collagen fibers. This layer has minute openings and therefore the underlying stroma is in free communication with the aqueous humor in the anterior chamber. Aqueous humor can thus move in and out of the stroma quickly during dilation and contraction. Larger deficiencies in the anterior border layer show up as crypt, readily visible from a close distance (figures 4B, 4C, 4D and 6). The principal distribution and depth of crypts are present at birth and do not appear to change much after birth (Oyster, 1999; Daugman, 2003; Larsson et al., 2003). 4.3.3.3 Stroma The stroma consists of loose connective tissue and is made up of fibroblasts, melanocytes, and collagen fibers (types I, III, VI and XVIII) (Maatta et al., 2006; Oyster, 1999; Rittig et al., 1990). About 66% of the cells in stroma are melanocytes, which are pigment-producing cells that determine the color of the iris (Sturm & Frudakis, 2004; Wilkerson et al., 1996). Normally, the pigmentation is fully developed a few years after birth (Bito et al., 1997; Sturm & Frudakis, 2004; Wilkerson et al., 1996).
Figure 5
1
The five cell layers in the human iris: 1 anterior border layer; 2 stroma; 3 sphincter, and dilator muscles (not shown); 4 anterior pigment epithelium; 5 posterior pigment epithelium.
2
3
4
5
27864 Avhandling_inlaga.indd 73 1/28/08 9:20:08 AM
75
posterior epithelia cell layers add to the stability of the iris, which prevents it from touching the lens (Oyster, 1999).
Figure 8
4.3.4 The genetic correlation between crypt and contraction furrows One of the main findings of STUDY II is that the cell layers that are likely to contribute to an iris characteristic’s appearance are generally influenced by the same set of genes. For instance, contraction furrows become manifest due to a tendency of the iris to fold in the same location when the iris aperture adapts to different light conditions. Contraction furrows may therefore, as argued above, be influenced by the overall thickness and density of the iris, which implies that all five cell layers in the iris influence the extension and distinction of contraction furrows (the scales that measure the iris characteristics of interest can be viewed in STUDY II on pages 822-824). This was precisely what was found in STUDY II. All iris characteristics measured in the anterior border layer except Wolfflin nodules, i.e. crypts, pigment dots and iris color,
A
B
C
D
A
B
C
D
E
E
The bottom cell layers in the iris; the anterior epithelium (A) is less pigmented than the posterior (B) which originates from the neural ectoderm.
74
muscle radiates from the periphery of the iris toward the pupil, and these muscle fibers are about 0.050 – 0.060 milliliters thick (Forrester et al., 2002).
Figure 7
4.3.3.5 Anterior and posterior pigmented epithelium The bottom cell layers in the iris are illustrated in Figure 8, on the next page. They consist of an anterior (A) and a posterior (B) pigmented epithelium. The anterior pigmented epithelium has two distinct morphological portions: a muscular portion (C) and a epithelial portion (D). The muscular portion of the anterior epithelium sends tongue-like projections into the iris stroma. These cellular projections are filled with myofilaments which form the dilator muscle. The epithelial portion of the anterior pigmented epithelium (D) is more pigmented. Note the scarcity of melanin granules in the anterior epithelium (C) and how the granule density increases, closer to the bottom of the posterior pigmented epithelium. Melanocytes, which are packed with melanin granules, are the most common cell types in the posterior pigmented epithelium but collagen (type VI) is also present (Rittig et al., 1990). On the bottom of the posterior iris epithelium there is a series of circumferential contraction furrows (E). However, it is not likely that these always result in contraction furrows that are visible on the surface of the iris (figure 4B). As can be seen in Figure 9 on page 76, which shows how a contraction furrow has grooved into the loosely packed, melanocytes-rich iris stroma (A), as well as some contraction furrows on the bottom of the iris (D), there is a huge difference in size between furrows on the surface and the bottom of the iris. Therefore, it is most likely density differences in the anterior border layer and stroma are most important in determination of the distinctiveness and number of contraction furrows present on the iris surface. However, thickness of the epithelial layers may also be of importance for the overall density of the iris, since the densely packed pigment granules in the
Sphincter muscle
Dilator muscle
The organization of muscle fibers in the iris (originates from the neural ectoderm).
27864 Avhandling_inlaga.indd 74 1/28/08 9:20:10 AM

75
posterior epithelia cell layers add to the stability of the iris, which prevents it from touching the lens (Oyster, 1999).
Figure 8
4.3.4 The genetic correlation between crypt and contraction furrows One of the main findings of STUDY II is that the cell layers that are likely to contribute to an iris characteristic’s appearance are generally influenced by the same set of genes. For instance, contraction furrows become manifest due to a tendency of the iris to fold in the same location when the iris aperture adapts to different light conditions. Contraction furrows may therefore, as argued above, be influenced by the overall thickness and density of the iris, which implies that all five cell layers in the iris influence the extension and distinction of contraction furrows (the scales that measure the iris characteristics of interest can be viewed in STUDY II on pages 822-824). This was precisely what was found in STUDY II. All iris characteristics measured in the anterior border layer except Wolfflin nodules, i.e. crypts, pigment dots and iris color,
A
B
C
D
A
B
C
D
E
E
The bottom cell layers in the iris; the anterior epithelium (A) is less pigmented than the posterior (B) which originates from the neural ectoderm.
74
muscle radiates from the periphery of the iris toward the pupil, and these muscle fibers are about 0.050 – 0.060 milliliters thick (Forrester et al., 2002).
Figure 7
4.3.3.5 Anterior and posterior pigmented epithelium The bottom cell layers in the iris are illustrated in Figure 8, on the next page. They consist of an anterior (A) and a posterior (B) pigmented epithelium. The anterior pigmented epithelium has two distinct morphological portions: a muscular portion (C) and a epithelial portion (D). The muscular portion of the anterior epithelium sends tongue-like projections into the iris stroma. These cellular projections are filled with myofilaments which form the dilator muscle. The epithelial portion of the anterior pigmented epithelium (D) is more pigmented. Note the scarcity of melanin granules in the anterior epithelium (C) and how the granule density increases, closer to the bottom of the posterior pigmented epithelium. Melanocytes, which are packed with melanin granules, are the most common cell types in the posterior pigmented epithelium but collagen (type VI) is also present (Rittig et al., 1990). On the bottom of the posterior iris epithelium there is a series of circumferential contraction furrows (E). However, it is not likely that these always result in contraction furrows that are visible on the surface of the iris (figure 4B). As can be seen in Figure 9 on page 76, which shows how a contraction furrow has grooved into the loosely packed, melanocytes-rich iris stroma (A), as well as some contraction furrows on the bottom of the iris (D), there is a huge difference in size between furrows on the surface and the bottom of the iris. Therefore, it is most likely density differences in the anterior border layer and stroma are most important in determination of the distinctiveness and number of contraction furrows present on the iris surface. However, thickness of the epithelial layers may also be of importance for the overall density of the iris, since the densely packed pigment granules in the
Sphincter muscle
Dilator muscle
The organization of muscle fibers in the iris (originates from the neural ectoderm).
27864 Avhandling_inlaga.indd 75 1/28/08 9:20:13 AM

77
procedure, it is possible for the researcher to vary how much of the genetic background that is stabilized. 4.3.6 The embryological origin of the human iris Historically, the various cell layers in the iris have been believed to originate from two of the three germ layers. However, even though the cells that give rise to the anterior border layer and stroma come from the mesoderm around the optic cup, more detailed investigations have confirmed that the anterior border layer and stroma are of neural crest cells origin (Johnston et al., 1979; Oyster, 1999; Trainor & Tam, 1995), whereas the sphincter and dilator muscles and the pigmented epithelial layers are derived from neural ectoderm. Table 4 Maximum-Likelihood Parameter Estimates in the full Cholesky Model
Heritabilities, environmentalbilities, covariances, and correlations1
Genetic Environmental
Scale Crypts P. dot Color Wolff. Furrow Crypts P. dot Color Wolff. Furrow
Crypts .66 -.06 .06 .37** -.41** .34 .08 -.04 -.13 .01
P. dot -.03 .56 .24** .00 .24* .03 .44 -.13 .07 -.09
Color .04 .16 .84 -.22** .44** -.01 -.03 .16 -.05 .17
Wolff. .26 .00 -.18 .76 -.05** -.04 .02 -.01 .24 -.12
Furrow -.29 .16 .36 -.03 .77 .00 -.03 .03 -.03 .23
1Diagnol elements are the heritabilities and environmentalbilities, upper elements of the diagonals are correlations, and elements below the diagonals are covariances. Additive genetic correlations among the five iris characteristics are in boldface. *p < .05 (two-tailed test). **p < .01 (two-tailed test).
Neural crest eventually develops into the peripheral nervous system, chromaffin cells that regulate epinephrine secretion as a response to stress in the sympathetic nervous system, as well as non-neuronal cells, such as the melanocytes that determine skin and eye color and the haemopoietic cells that promote the formation of blood cells. Neural ectoderm develops into motor neurons, retina and all the neurons in the spinal cord and brain. Thus, from an embryological perspective, some proportion of the 2,700 genes that are expressed in the iris, including the ones that influence the appearance of the iris characteristics of interest, may be expressed early in neural crest and neural ectoderm, as well as throughout the peripheral and central nervous system, and can therefore potentially play an important role in the wiring of the nervous system (Wistow et al., 2002). Thus, since genes that play an important role in the wiring of the nervous system are likely to be of importance for most behaviors, the embryological origin of the iris in itself increases the possibility that iris data can be a helpful matching tool for studies that attempt to replicate candidate gene findings for personality. Remember that the iris, for most people, is about 0.369 mm thick, and a thin stroma may allow the coloration of the bottom-cell layer in the iris to show through. This implies that the appearance of crypt and furrows can potentially be influenced by a relatively large proportion of the 2,700 genes that are expressed in the iris, and that these genes in turn
76
shared significant genetic correlations with contraction furrows. For instance, the genetic correlation between fewer crypt and more extended contraction furrows was rA
= -.41, p < 0.01. This means that about 41% of the genetic effect that contributes to increasing the number of crypts also influences the distinctiveness and prevalence of contraction furrows. That is, genes that increase the number of crypts also decrease the overall density and thickness of the iris, which in turn give less extended and distinct contraction furrows.
Figure 9
4.3.5 The results in Study II The results in STUDY II are presented in Table 4 on the next page. The genetic correlation fell between -.22 and .44. Furthermore, the magnitude of the genetic correlations accounted almost entirely for the phenotypic correlation among the iris characteristics. No evidence was found for specific environmental effects in common to the characteristics. The modest genetic correlations among the iris characteristic indicate that there is little overlap in genetic influences for these iris characteristics. This means that populations that are matched on more than one iris characteristic will have a less complex genetic background on the molecular level, compared with an unmatched population, or populations that have been matched on only one iris characteristics. At least if the genetic correlations that are found in this sample can be generalized to other samples, which is a possibility that is quite likely, considering how well the overall pattern of findings correspond with what can be expected from a morphological standpoint. Thus, by using several iris characteristics in the matching
Cross section of the iris: A contraction furrows on the surface of the iris; B stroma tissue; C anterior and posterior pigmented epithelium; D contraction furrows on the bottom of the iris.
A
C
B
D
27864 Avhandling_inlaga.indd 76 1/28/08 9:20:13 AM

77
procedure, it is possible for the researcher to vary how much of the genetic background that is stabilized. 4.3.6 The embryological origin of the human iris Historically, the various cell layers in the iris have been believed to originate from two of the three germ layers. However, even though the cells that give rise to the anterior border layer and stroma come from the mesoderm around the optic cup, more detailed investigations have confirmed that the anterior border layer and stroma are of neural crest cells origin (Johnston et al., 1979; Oyster, 1999; Trainor & Tam, 1995), whereas the sphincter and dilator muscles and the pigmented epithelial layers are derived from neural ectoderm. Table 4 Maximum-Likelihood Parameter Estimates in the full Cholesky Model
Heritabilities, environmentalbilities, covariances, and correlations1
Genetic Environmental
Scale Crypts P. dot Color Wolff. Furrow Crypts P. dot Color Wolff. Furrow
Crypts .66 -.06 .06 .37** -.41** .34 .08 -.04 -.13 .01
P. dot -.03 .56 .24** .00 .24* .03 .44 -.13 .07 -.09
Color .04 .16 .84 -.22** .44** -.01 -.03 .16 -.05 .17
Wolff. .26 .00 -.18 .76 -.05** -.04 .02 -.01 .24 -.12
Furrow -.29 .16 .36 -.03 .77 .00 -.03 .03 -.03 .23
1Diagnol elements are the heritabilities and environmentalbilities, upper elements of the diagonals are correlations, and elements below the diagonals are covariances. Additive genetic correlations among the five iris characteristics are in boldface. *p < .05 (two-tailed test). **p < .01 (two-tailed test).
Neural crest eventually develops into the peripheral nervous system, chromaffin cells that regulate epinephrine secretion as a response to stress in the sympathetic nervous system, as well as non-neuronal cells, such as the melanocytes that determine skin and eye color and the haemopoietic cells that promote the formation of blood cells. Neural ectoderm develops into motor neurons, retina and all the neurons in the spinal cord and brain. Thus, from an embryological perspective, some proportion of the 2,700 genes that are expressed in the iris, including the ones that influence the appearance of the iris characteristics of interest, may be expressed early in neural crest and neural ectoderm, as well as throughout the peripheral and central nervous system, and can therefore potentially play an important role in the wiring of the nervous system (Wistow et al., 2002). Thus, since genes that play an important role in the wiring of the nervous system are likely to be of importance for most behaviors, the embryological origin of the iris in itself increases the possibility that iris data can be a helpful matching tool for studies that attempt to replicate candidate gene findings for personality. Remember that the iris, for most people, is about 0.369 mm thick, and a thin stroma may allow the coloration of the bottom-cell layer in the iris to show through. This implies that the appearance of crypt and furrows can potentially be influenced by a relatively large proportion of the 2,700 genes that are expressed in the iris, and that these genes in turn
76
shared significant genetic correlations with contraction furrows. For instance, the genetic correlation between fewer crypt and more extended contraction furrows was rA
= -.41, p < 0.01. This means that about 41% of the genetic effect that contributes to increasing the number of crypts also influences the distinctiveness and prevalence of contraction furrows. That is, genes that increase the number of crypts also decrease the overall density and thickness of the iris, which in turn give less extended and distinct contraction furrows.
Figure 9
4.3.5 The results in Study II The results in STUDY II are presented in Table 4 on the next page. The genetic correlation fell between -.22 and .44. Furthermore, the magnitude of the genetic correlations accounted almost entirely for the phenotypic correlation among the iris characteristics. No evidence was found for specific environmental effects in common to the characteristics. The modest genetic correlations among the iris characteristic indicate that there is little overlap in genetic influences for these iris characteristics. This means that populations that are matched on more than one iris characteristic will have a less complex genetic background on the molecular level, compared with an unmatched population, or populations that have been matched on only one iris characteristics. At least if the genetic correlations that are found in this sample can be generalized to other samples, which is a possibility that is quite likely, considering how well the overall pattern of findings correspond with what can be expected from a morphological standpoint. Thus, by using several iris characteristics in the matching
Cross section of the iris: A contraction furrows on the surface of the iris; B stroma tissue; C anterior and posterior pigmented epithelium; D contraction furrows on the bottom of the iris.
A
C
B
D
27864 Avhandling_inlaga.indd 77 1/28/08 9:20:14 AM

79
membrane. These cell layers eventually become the epithelial layers of the iris. As they grow inward they incorporate the pupillary membrane, and become thinner (Figure 11). When this inward growth starts, the future posterior epithelial layer is largely lacking pigment, as it is derived from the non-pigmented ciliary epithelium (future neural retina) at the rim of the optic cup. The production of melanin in the posterior epithelium increases in the fourth month, initially near the pupil margin, and by months 7-8 the posterior epithetlium is heavily pigmented. The anterior epithelial layer, which is derived from the pigmented ciliary body at the rim of the optic cup (future choroids), has then lost its pigment. After about 7 months the inward growth of the epithelial layers is finished, and by then the cells in the pupillary membrane, stroma and epithelial layers have gradually grown to become very similar to the cell layers of the adult iris, described above (Forrester et al., 2002; Oyster, 1999).
Figure 11
It is around this time, at the beginning of the seventh month, that the pupil starts to form. The arcades of blood vessels that have penetrated to the centre of the iris begin to change (Figure 10A). Circulation in the most central branches slows, then ceases, depriving the central tissue of any supply. The closed down blood supply initiates both atrophy and cell migration in the center of the iris as well as at the outermost front of the iris. By the end of the seventh month the pupil is free from any obstructing tissue (Figure 10B). The size of the iris is at birth very near its adult size, and very little tissue is added, which is done during the first few postnatal years. This embryological sequence suggests that crypts primarily can be formed in the following ways (Oyster, 1999):
A: After about 15 weeks, the iris epithelium layers of the iris begin their migration inwards towards the center of the pupil, the migration starts at the rim of the optic cup (pupillary membrane and lens removed in these pictures). B: As the rim of the optic cup migrates forward to form the iris, it becomes thinner.
A B
78
potentially can influence the early development of the central nervous system (CNS) and peripheral nervous system (PNS). Iris data can thereby provide much more specific pathway based matching than is possible to achieve in large samples that have been matched on sex, age and ethnicity, which will decrease the genetic heterogeneity that is present in large samples (Sham et al., 2002). The effect size for some candidate genes for personality may thus be larger in a group where all members in the group have the same type of iris characteristics, (which is analyzed separately from other groups with other iris characteristics), and this may allow for the replication of candidate gene findings in a more straightforward manner than currently is possible. However, in order to evaluate this possibility, information is needed about the embryological development of the iris, and about which genes are most likely to influence the variability of the iris characteristics. 4.3.7 The embryological development of the human iris The first sight of the iris appears after 12 weeks of gestation. Then, a subset of neural-crest derived periocular mesenchymal cells migrate from the rim of the optic cup, over the lens to form the embryonic pupillary membrane, which eventually becomes the melanocytes, fibroblasts and collagen fibers of the anterior border layer and the adult stroma. When this migration is finished, after about 5 months of gestation, there is no hole for the pupil. The pupillary membrane covers the whole lens (figure 10A).
Figure 10
At around 15 weeks there is a second wave of cell migration. The two cell layers of the optic cup proliferate and grow inward in between the lens and newly formed pupillary
The edge of the iris
A) Fifth Month B) Seventh Month
The Edge of the Iris The Edge of the Iris
The pupillary membrane in the fifth and seventh months: A – In the fifth month the lens is covered by the pupillary membrane and the front of the iris has grown about halfway to its final destination; B – In the seventh month the front of the iris has reached its final destination. Then, the creation of the pupil starts. Adapted from Oyster (1999).
Blood Vessels
27864 Avhandling_inlaga.indd 78 1/28/08 9:20:14 AM

79
membrane. These cell layers eventually become the epithelial layers of the iris. As they grow inward they incorporate the pupillary membrane, and become thinner (Figure 11). When this inward growth starts, the future posterior epithelial layer is largely lacking pigment, as it is derived from the non-pigmented ciliary epithelium (future neural retina) at the rim of the optic cup. The production of melanin in the posterior epithelium increases in the fourth month, initially near the pupil margin, and by months 7-8 the posterior epithetlium is heavily pigmented. The anterior epithelial layer, which is derived from the pigmented ciliary body at the rim of the optic cup (future choroids), has then lost its pigment. After about 7 months the inward growth of the epithelial layers is finished, and by then the cells in the pupillary membrane, stroma and epithelial layers have gradually grown to become very similar to the cell layers of the adult iris, described above (Forrester et al., 2002; Oyster, 1999).
Figure 11
It is around this time, at the beginning of the seventh month, that the pupil starts to form. The arcades of blood vessels that have penetrated to the centre of the iris begin to change (Figure 10A). Circulation in the most central branches slows, then ceases, depriving the central tissue of any supply. The closed down blood supply initiates both atrophy and cell migration in the center of the iris as well as at the outermost front of the iris. By the end of the seventh month the pupil is free from any obstructing tissue (Figure 10B). The size of the iris is at birth very near its adult size, and very little tissue is added, which is done during the first few postnatal years. This embryological sequence suggests that crypts primarily can be formed in the following ways (Oyster, 1999):
A: After about 15 weeks, the iris epithelium layers of the iris begin their migration inwards towards the center of the pupil, the migration starts at the rim of the optic cup (pupillary membrane and lens removed in these pictures). B: As the rim of the optic cup migrates forward to form the iris, it becomes thinner.
A B
78
potentially can influence the early development of the central nervous system (CNS) and peripheral nervous system (PNS). Iris data can thereby provide much more specific pathway based matching than is possible to achieve in large samples that have been matched on sex, age and ethnicity, which will decrease the genetic heterogeneity that is present in large samples (Sham et al., 2002). The effect size for some candidate genes for personality may thus be larger in a group where all members in the group have the same type of iris characteristics, (which is analyzed separately from other groups with other iris characteristics), and this may allow for the replication of candidate gene findings in a more straightforward manner than currently is possible. However, in order to evaluate this possibility, information is needed about the embryological development of the iris, and about which genes are most likely to influence the variability of the iris characteristics. 4.3.7 The embryological development of the human iris The first sight of the iris appears after 12 weeks of gestation. Then, a subset of neural-crest derived periocular mesenchymal cells migrate from the rim of the optic cup, over the lens to form the embryonic pupillary membrane, which eventually becomes the melanocytes, fibroblasts and collagen fibers of the anterior border layer and the adult stroma. When this migration is finished, after about 5 months of gestation, there is no hole for the pupil. The pupillary membrane covers the whole lens (figure 10A).
Figure 10
At around 15 weeks there is a second wave of cell migration. The two cell layers of the optic cup proliferate and grow inward in between the lens and newly formed pupillary
The edge of the iris
A) Fifth Month B) Seventh Month
The Edge of the Iris The Edge of the Iris
The pupillary membrane in the fifth and seventh months: A – In the fifth month the lens is covered by the pupillary membrane and the front of the iris has grown about halfway to its final destination; B – In the seventh month the front of the iris has reached its final destination. Then, the creation of the pupil starts. Adapted from Oyster (1999).
Blood Vessels
27864 Avhandling_inlaga.indd 79 1/28/08 9:20:15 AM

81
expression leads to specific eye anterior segment defects (Sale et al., 2002; Schedl et al., 1996; Simpson & Price, 2002), and the most recent studies available suggest that PAX6 is likely to influence variability for crypt and contraction furrows (Davis-Silberman et al., 2005). Indeed, Davis-Silberman et al. (2005) show that the growth of iris stroma is affected by PAX6 dosage variation in two different ways: first, it determines the size of the progenitor cells destined to an iris fate; and second, it influences the development of the iris stroma (p. 2272). Crypt and contraction furrows may therefore be dependent on genes that interact with PAX6 (such as MITF) and downstream targets of PAX6, such as SIX3, the OLFM3 gene, as well as other genes, such as LMX1B, Hox-7.1, Hox-8, FOXC1, FOXC2, PITX2, and BMP4, which also are expressed early in the pupillary membrane (Grinchuk et al., 2005; Hsieh et al., 2002; Jensen, 2005; Lichter et al., 1997; Monaghan et al., 1991; Pressman et al., 2000; Smith et al., 2000). For example, as can be seen in Figure 12, miss-expression of PAX6 may lead to stroma defects that are very similar to crypts, and since the expression pattern of SIX3 and OLFM3 in the iris overlaps with PAX6 expression, mutations in these genes may cause similar defects (Grinchuk et al., 2005; Hsieh et al., 2002; Tzoulaki et al., 2005).
Figure 12
But other genes also expressed early in pupillary membrane have a well documented effect on the appearance of the adult iris. Mutation in genes that causes Axenfeld-Rieger anomaly, the Riegers and iridogoniodysgenesis syndrome, and the nail–patella syndrome, that is, the FOXC1 gene, the PITX2 gene, and the LMX1B gene, respectively, may also influence the frequency of crypts and contraction furrows (Kulak et al., 1998; Lehmann et al., 2003). Iris phenotypes that are associated with mutations in FOXC1, FOXC2 and PITX2 are illustrated in Figure 13. Overall, these findings suggest that mutations in multiple genes, expressed in the pupillary membrane or in other periocular cells, potentially can influence the variability of crypt and contraction furrows.
Mild iris hypoplasia caused by a missense mutation in PAX6, i.e., a novel single base deletion 1410del C in exon 12, codon 350, in the PAX6 gene. This mutation in the PST domain produces a STOP codon 15 codons later, which results in premature truncation of the Pax6 protein. The posterior pigmented epithelium was normal in these individuals. Adapted from Sale et al. (2002).
80
1) Crypts may form as a result of a lack of an inductive signal sometime between the third and seventh month of gestation in the pupillary membrane or in other periocular mesenchymal cells, as the two cell layers of the optic cup proliferate and grow inward, in between the lens and newly formed pupillary membrane (Oyster, 1999); 2) Crypts may start to form by the seventh month, when the absorption of the pupillary membrane (which will create the pupil) may spill over into the main stroma leaf, which potentially can create hypoplasia in the anterior border layer and stroma (Beauchamp & Meisler, 1986). Either one or both of these possibilities have been suggested by Beauchamp & Meisler (1996). In contrast, contraction furrows are likely to be influenced by a lack of inductive signals in any of the five cell layers in the iris, including the formation of the minute sphincter and dilator muscles fibers which influence the embryological growth of the stroma (Jensen, 2005). Genes expressed in precursors to the anterior border layer, stroma, the dilator muscles and the epithelial cell layers, can thereby potentially influence the genetic correlation between frequency of crypt and contraction furrows. 4.3.8 The most plausible candidate genes for crypt and contraction furrows As mentioned earlier, there are 2,700 unique genes expressed in the iris (Wistow et al., 2002). Thus, here we only mention the candidates that, due to their well-documented expression pattern in the iris, are likely to contribute most to the frequency of crypts and contraction furrows. About 66% of the cells in the iris are melanocytes (Wilkerson et al., 1996). Genes involved in the differentiation of melanocytes may thus contribute to frequency differences in crypts and contraction furrows. The gene MITF is required for the proper development of several cell lineages, including osteoclasts, retinal pigment epithelial cells, natural killer cells, as well as the mast cells and melanocytes in the iris. MITF is thus an obvious candidate genes for crypt and contraction furrows (Hershey & Fisher, 2004; Mochii et al., 1998; Opdecamp et al., 1997; Planque et al., 2001; Yavuzer et al., 1995). Furthermore, MITF negatively regulates the expression of PAX6 (Mochii et al., 1998), a highly conserved key regulator of a number of developmental processes controlling craniofacial and CNS morphogenesis, neuronal and endocrine cell-fate determination, as well as eye development. Heterozygous mutations of the PAX6 gene cause aniridia, which is characterized by a total or partial absence of the iris (Simpson & Price, 2002). Indeed, reductions in PAX6 dosage have been shown to affect the normal development of multiple organs, making PAX6 one of the most extensively studied transcription factors (over 1100 hits in Medline), in which a reduction in dosage has been shown to affect normal development (Van Heyningen & Williamson, 2002). In particular, it is now widely recognized that decrease or increase over the normal level of PAX6
27864 Avhandling_inlaga.indd 80 1/28/08 9:20:16 AM

81
expression leads to specific eye anterior segment defects (Sale et al., 2002; Schedl et al., 1996; Simpson & Price, 2002), and the most recent studies available suggest that PAX6 is likely to influence variability for crypt and contraction furrows (Davis-Silberman et al., 2005). Indeed, Davis-Silberman et al. (2005) show that the growth of iris stroma is affected by PAX6 dosage variation in two different ways: first, it determines the size of the progenitor cells destined to an iris fate; and second, it influences the development of the iris stroma (p. 2272). Crypt and contraction furrows may therefore be dependent on genes that interact with PAX6 (such as MITF) and downstream targets of PAX6, such as SIX3, the OLFM3 gene, as well as other genes, such as LMX1B, Hox-7.1, Hox-8, FOXC1, FOXC2, PITX2, and BMP4, which also are expressed early in the pupillary membrane (Grinchuk et al., 2005; Hsieh et al., 2002; Jensen, 2005; Lichter et al., 1997; Monaghan et al., 1991; Pressman et al., 2000; Smith et al., 2000). For example, as can be seen in Figure 12, miss-expression of PAX6 may lead to stroma defects that are very similar to crypts, and since the expression pattern of SIX3 and OLFM3 in the iris overlaps with PAX6 expression, mutations in these genes may cause similar defects (Grinchuk et al., 2005; Hsieh et al., 2002; Tzoulaki et al., 2005).
Figure 12
But other genes also expressed early in pupillary membrane have a well documented effect on the appearance of the adult iris. Mutation in genes that causes Axenfeld-Rieger anomaly, the Riegers and iridogoniodysgenesis syndrome, and the nail–patella syndrome, that is, the FOXC1 gene, the PITX2 gene, and the LMX1B gene, respectively, may also influence the frequency of crypts and contraction furrows (Kulak et al., 1998; Lehmann et al., 2003). Iris phenotypes that are associated with mutations in FOXC1, FOXC2 and PITX2 are illustrated in Figure 13. Overall, these findings suggest that mutations in multiple genes, expressed in the pupillary membrane or in other periocular cells, potentially can influence the variability of crypt and contraction furrows.
Mild iris hypoplasia caused by a missense mutation in PAX6, i.e., a novel single base deletion 1410del C in exon 12, codon 350, in the PAX6 gene. This mutation in the PST domain produces a STOP codon 15 codons later, which results in premature truncation of the Pax6 protein. The posterior pigmented epithelium was normal in these individuals. Adapted from Sale et al. (2002).
80
1) Crypts may form as a result of a lack of an inductive signal sometime between the third and seventh month of gestation in the pupillary membrane or in other periocular mesenchymal cells, as the two cell layers of the optic cup proliferate and grow inward, in between the lens and newly formed pupillary membrane (Oyster, 1999); 2) Crypts may start to form by the seventh month, when the absorption of the pupillary membrane (which will create the pupil) may spill over into the main stroma leaf, which potentially can create hypoplasia in the anterior border layer and stroma (Beauchamp & Meisler, 1986). Either one or both of these possibilities have been suggested by Beauchamp & Meisler (1996). In contrast, contraction furrows are likely to be influenced by a lack of inductive signals in any of the five cell layers in the iris, including the formation of the minute sphincter and dilator muscles fibers which influence the embryological growth of the stroma (Jensen, 2005). Genes expressed in precursors to the anterior border layer, stroma, the dilator muscles and the epithelial cell layers, can thereby potentially influence the genetic correlation between frequency of crypt and contraction furrows. 4.3.8 The most plausible candidate genes for crypt and contraction furrows As mentioned earlier, there are 2,700 unique genes expressed in the iris (Wistow et al., 2002). Thus, here we only mention the candidates that, due to their well-documented expression pattern in the iris, are likely to contribute most to the frequency of crypts and contraction furrows. About 66% of the cells in the iris are melanocytes (Wilkerson et al., 1996). Genes involved in the differentiation of melanocytes may thus contribute to frequency differences in crypts and contraction furrows. The gene MITF is required for the proper development of several cell lineages, including osteoclasts, retinal pigment epithelial cells, natural killer cells, as well as the mast cells and melanocytes in the iris. MITF is thus an obvious candidate genes for crypt and contraction furrows (Hershey & Fisher, 2004; Mochii et al., 1998; Opdecamp et al., 1997; Planque et al., 2001; Yavuzer et al., 1995). Furthermore, MITF negatively regulates the expression of PAX6 (Mochii et al., 1998), a highly conserved key regulator of a number of developmental processes controlling craniofacial and CNS morphogenesis, neuronal and endocrine cell-fate determination, as well as eye development. Heterozygous mutations of the PAX6 gene cause aniridia, which is characterized by a total or partial absence of the iris (Simpson & Price, 2002). Indeed, reductions in PAX6 dosage have been shown to affect the normal development of multiple organs, making PAX6 one of the most extensively studied transcription factors (over 1100 hits in Medline), in which a reduction in dosage has been shown to affect normal development (Van Heyningen & Williamson, 2002). In particular, it is now widely recognized that decrease or increase over the normal level of PAX6
27864 Avhandling_inlaga.indd 81 1/28/08 9:20:16 AM

83
crypt and contraction furrows all support the notion that iris matching is helpful in studies that attempt to replicate candidate gene findings for personality. Genes expressed both early and late in the developing nervous system are due to their cumulative effect likely to have a greater impact on the wiring of the nervous system than other genes, and thereby on behavior. In addition, when iris matching is used, it is not only the candidate genes for crypt and contraction furrows, mentioned above, that may reduce the genetic complexity present at the molecular level. Some proportion of the 2,700 genes expressed in the iris (Wistow et al., 2002), which contribute to thickness and density in the iris (which is 0.369 mm thick), may be in linkage disequilibrium with the genes that are responsible for crypts and contraction furrows. These genes may also be of importance for the development of the nervous system, giving the candidate genes expression patterns throughout the CNS (Baker et al., 2001; Wirbelauer et al., 2005). Thus, the genetic variability in hundreds of genes expressed early and throughout the development of the nervous system may decrease in iris-matched populations. 4.4.1 Study III The extent to which the iris will prove to be a useful matching tool for genetic association studies ultimately depends on which genes are responsible for the appearance of the characteristics in the iris and/or are in linkage disequilibrium with these genes. If the genes that influence iris differences mostly tap into early embryological development of the nervous system and brain, then it is possible that personality in adulthood will be affected, since a person’s personality in part is influenced by the embryological development of the nervous system (Christ et al., 2003; Harper, 2005; Thomson, 2004). Consequently, STUDY III combined variable- and person-oriented approaches in order to examine if the self-organizing properties of embryological development of the brain are reflected in the iris. This was done by investigating if there is an association between personality in adulthood, as measured by the five factor model (Costa & McCrea, 1992), and the variability of crypts, contraction furrows and pigment dots. Five hypotheses, based on PAX6 expression pattern in the brain, were tested in a sample of 428 college students. Below follows a short summary of this study, which is published in the peer-reviewed international British journal Biological Psychology (STUDY III). This paper, with all details, is available on pages 165 – 175. 4.4.2 Hypotheses concerning PAX6 expression in the brain, related to
personality and iris characteristics, assuming linear effects In order to discriminate between the many genes that potentially could influence the presumed association between iris characteristics and personality, and to more fully evaluate a potential role by PAX6, three hypotheses were tested. They draw heavily on PAX6 expression patterns in the anterior cingulate cortex (see figure 14 on next page) as documented by Ellison-White et al. (2004), in conjunction with the findings of Pujol et al. (2002) and Davidson et al. (1992, 1999, 2001), which show that tissue and activity differences in the left relative to the right anterior cingulate cortex influence the extent to which people engage in approach-related behaviors.
82
Furthermore, PAX6 is not only associated with aniridia, but also with Axenfeld-Rieger anomaly, Rieger’s and iridogoniodysgenesis syndrome (Hjalt & Semina, 2005; Riise et al., 2001), and identical mutations in PAX6 can result in both total absence of iris and very mild stroma hypoplasia, even in the same family (De Becker et al., 2004). In all, these findings indicate that the variability of crypt and contraction furrows is likely to depend on complex interactions between PAX6 and multiple candidates that are expressed in the pupillary membrane or in other periocular cells. However, the fact that all the candidate genes mentioned above, without exception, are expressed both early in neural crest/neural ectoderm, as well as later in the brain and in most cases throughout the CNS (i.e. PAX6, SIX3, LMX1B, FOXC1, FOXC2, PITX2, BMP4), should further increase the possibility that iris data can be helpful in studies that attempt to replicate candidate gene findings for personality. Genes expressed both early and late in the developing nervous system are, due to their cumulative effect, likely to have a greater impact on the wiring of the nervous system than other genes, and therefore it may be especially helpful to match on iris characteristics that potentially can be associated with ongoing neurological developmental events such as these (Bisgrove & Yost, 2001; Burbach et al., 2003; Cheng et al., 2006; Grinchuk et al., 2005; Ishibashi et al., 2005; Izpisua-Belmonte & Duboule, 1992; Kawakami et al., 1997; Kuiper et al., 2004; Lehmann et al., 2003; Mochii et al., 1998; Monaghan et al., 1991; Sarnat & Flores-Sarnat, 2005; Smidt et al., 2003; Wallis & Muenke, 1999).
Figure 13
To sum up, STUDY II reveals that most of the genetic variations in iris characteristics are independent of each other. Thus, by using several iris characteristics in the matching procedure, it is possible for research purposes to vary how much of the genetic background that is stabilized. Moreover, the substantial heritability estimates, the embryological origin of the iris in itself, and the most plausible candidates genes for
Different iris phenotypes associated with segmental duplication or deletion encompassing FOXC1and FOXC2 mutations, and also SNP mutations of PITX2: (A) FOXC1 causes hypoplasia of the iris stroma exposing the iris sphincter muscle, the pale band round the pupil; (B) FOXC2 mutation typically has subtler iris anomalies, and may include a relatively intact segment of the iris (arrow); (C) PITX2 mutation of an individual with iridogoniodysgenesis syndrome showing iris stroma hypoplasia and a distinct iris sphincter muscle. Adapted from Lehmann et al., (2003) and Kulak et al., (1998).
A B C
27864 Avhandling_inlaga.indd 82 1/28/08 9:20:17 AM

83
crypt and contraction furrows all support the notion that iris matching is helpful in studies that attempt to replicate candidate gene findings for personality. Genes expressed both early and late in the developing nervous system are due to their cumulative effect likely to have a greater impact on the wiring of the nervous system than other genes, and thereby on behavior. In addition, when iris matching is used, it is not only the candidate genes for crypt and contraction furrows, mentioned above, that may reduce the genetic complexity present at the molecular level. Some proportion of the 2,700 genes expressed in the iris (Wistow et al., 2002), which contribute to thickness and density in the iris (which is 0.369 mm thick), may be in linkage disequilibrium with the genes that are responsible for crypts and contraction furrows. These genes may also be of importance for the development of the nervous system, giving the candidate genes expression patterns throughout the CNS (Baker et al., 2001; Wirbelauer et al., 2005). Thus, the genetic variability in hundreds of genes expressed early and throughout the development of the nervous system may decrease in iris-matched populations. 4.4.1 Study III The extent to which the iris will prove to be a useful matching tool for genetic association studies ultimately depends on which genes are responsible for the appearance of the characteristics in the iris and/or are in linkage disequilibrium with these genes. If the genes that influence iris differences mostly tap into early embryological development of the nervous system and brain, then it is possible that personality in adulthood will be affected, since a person’s personality in part is influenced by the embryological development of the nervous system (Christ et al., 2003; Harper, 2005; Thomson, 2004). Consequently, STUDY III combined variable- and person-oriented approaches in order to examine if the self-organizing properties of embryological development of the brain are reflected in the iris. This was done by investigating if there is an association between personality in adulthood, as measured by the five factor model (Costa & McCrea, 1992), and the variability of crypts, contraction furrows and pigment dots. Five hypotheses, based on PAX6 expression pattern in the brain, were tested in a sample of 428 college students. Below follows a short summary of this study, which is published in the peer-reviewed international British journal Biological Psychology (STUDY III). This paper, with all details, is available on pages 165 – 175. 4.4.2 Hypotheses concerning PAX6 expression in the brain, related to
personality and iris characteristics, assuming linear effects In order to discriminate between the many genes that potentially could influence the presumed association between iris characteristics and personality, and to more fully evaluate a potential role by PAX6, three hypotheses were tested. They draw heavily on PAX6 expression patterns in the anterior cingulate cortex (see figure 14 on next page) as documented by Ellison-White et al. (2004), in conjunction with the findings of Pujol et al. (2002) and Davidson et al. (1992, 1999, 2001), which show that tissue and activity differences in the left relative to the right anterior cingulate cortex influence the extent to which people engage in approach-related behaviors.
82
Furthermore, PAX6 is not only associated with aniridia, but also with Axenfeld-Rieger anomaly, Rieger’s and iridogoniodysgenesis syndrome (Hjalt & Semina, 2005; Riise et al., 2001), and identical mutations in PAX6 can result in both total absence of iris and very mild stroma hypoplasia, even in the same family (De Becker et al., 2004). In all, these findings indicate that the variability of crypt and contraction furrows is likely to depend on complex interactions between PAX6 and multiple candidates that are expressed in the pupillary membrane or in other periocular cells. However, the fact that all the candidate genes mentioned above, without exception, are expressed both early in neural crest/neural ectoderm, as well as later in the brain and in most cases throughout the CNS (i.e. PAX6, SIX3, LMX1B, FOXC1, FOXC2, PITX2, BMP4), should further increase the possibility that iris data can be helpful in studies that attempt to replicate candidate gene findings for personality. Genes expressed both early and late in the developing nervous system are, due to their cumulative effect, likely to have a greater impact on the wiring of the nervous system than other genes, and therefore it may be especially helpful to match on iris characteristics that potentially can be associated with ongoing neurological developmental events such as these (Bisgrove & Yost, 2001; Burbach et al., 2003; Cheng et al., 2006; Grinchuk et al., 2005; Ishibashi et al., 2005; Izpisua-Belmonte & Duboule, 1992; Kawakami et al., 1997; Kuiper et al., 2004; Lehmann et al., 2003; Mochii et al., 1998; Monaghan et al., 1991; Sarnat & Flores-Sarnat, 2005; Smidt et al., 2003; Wallis & Muenke, 1999).
Figure 13
To sum up, STUDY II reveals that most of the genetic variations in iris characteristics are independent of each other. Thus, by using several iris characteristics in the matching procedure, it is possible for research purposes to vary how much of the genetic background that is stabilized. Moreover, the substantial heritability estimates, the embryological origin of the iris in itself, and the most plausible candidates genes for
Different iris phenotypes associated with segmental duplication or deletion encompassing FOXC1and FOXC2 mutations, and also SNP mutations of PITX2: (A) FOXC1 causes hypoplasia of the iris stroma exposing the iris sphincter muscle, the pale band round the pupil; (B) FOXC2 mutation typically has subtler iris anomalies, and may include a relatively intact segment of the iris (arrow); (C) PITX2 mutation of an individual with iridogoniodysgenesis syndrome showing iris stroma hypoplasia and a distinct iris sphincter muscle. Adapted from Lehmann et al., (2003) and Kulak et al., (1998).
A B C
27864 Avhandling_inlaga.indd 83 1/28/08 9:20:17 AM

85
The hypotheses in STUDY III increase in their specificity, and if all three hypotheses are found to be correct, then the likelihood that PAX6 is involved, relative to other candidates, is expected to be high. Thus, based on these findings:
First, it was expected that crypt more often than other iris characteristics will be associated with personality. Crypt is related to greater tissue loss in the iris than contraction furrows and pigment dots, which in turn may reflect greater tissue loss in the brain (which makes it likely that more measures of personality are associated with crypts than the other iris characteristics).
Second, because PAX6 causes more abundant tissue deficiencies in the left
anterior cingulate cortex (Ellison-Wright et al., 2004), and this hemisphere primarily relates to approach-related behaviors (Davidson, 1992; Davidson, 2001; Davidson et al., 1999), it was expected that crypt frequency in most cases will be related to approach-related behaviors.
Third, because greater tissue loss in the iris may reflect greater tissue loss in the
left anterior cingulate cortex, it was expected that individuals with an open crypt structure (those with more tissue loss in the iris) would score lower on traits that relate to approach-related behaviors than those with a dense crypt structure.
4.4.3 Hypotheses derived from PAX6 expression in the brain, assuming self-organized effects
The behavioral meaning of having a specific crypt frequency is likely to depend on which other iris characteristics are present (Lander & Schork, 1994; Larsson & Pedersen, 2004). Person-oriented analyses take these possibilities into consideration, since they are based on the totality of the whole person. Moreover, this totality is assumed to result from self-organization. This means that although there are, theoretically, an infinite variety of differences with regards to process characteristics and observed states at a detailed level, at a more global level there will often be a small number of more frequently observed patterns (Bergman & Magnusson, 1997; Bergman et al., 2003; Bosma & Kunnen, 2002; Carver & Scheier, 2002). Consequently, it can be expected that from the embryological events that form the adult iris (detailed level), distinct configurations of iris characteristics will occur in the population studied. Furthermore, if self-organizing properties of the embryological development of the brain are reflected in these naturally occurring iris configurations, then it can be expected that these configurations will define subgroups of individuals that differ from each other on personality in a systematic manner. In addition, the individuals in these subgroups may represent different developmental trajectories in regards to personality. Thus, in order to test these assumptions two additional expectations were considered:
First, subgroups of individuals that have configurations of iris characteristics with more tissue loss in the iris were, just as in the variable-oriented analysis, expected to score lower on approach-related behaviors.
84
Figure 14
The term “approach-related behavior” primarily refers to traits that measure goal-directed emotion, which – to various degrees in individuals – are activated by cues of impending rewards. Thus, traits in NEO PI R measuring behaviors that increase the likelihood that an individual is more likely to “approach” rather than “withdraw” from people, and different situations and challenges, are regarded as measures of approach-related behaviors. Such traits typically measure approach-related emotions that tap into the individual’s desires, interests, enthusiasms and cravings (Davidson, 1992; Fox, 1991; Gray, 2002).
Anterior cingulate cortex (ACC) anatomy. The upper-right part of the figure contains a reconstructed MRI of the medial surface of the right hemisphere of a single human brain. In this example, an anterior cingulate cortex lies between the cingulate sulcus and the corpus callosum. A schematic representation of Brodmann’s areas of ACC (numbered) is shown on the enlarged section (left). Cognitive division areas are outlined in red, and affective division areas in blue. A schematized flat map of actual anterior cingulate cortex areas is shown in the bottom-right panel. The borders of each sulcus appear as thin unbroken black lines, whereas a combination of broken and dotted lines outline cingulate areas. Adapted from (Bush et al., 2000). Family members with a mutation in PAX6 have local gray and white matter changes in the anterior cingulate cortex (approximate Brodmann areas 24a-c and 32, in both the dorsal and ventral regions), which primarily affect the left hemisphere (Ellison-White et al., 2004).
Dorsal region
Ventral region
Cingulate Cingu
Cingula
Cing
Anterior cingulate
cortex
Cingulate sulcus
Corpus callosum
27864 Avhandling_inlaga.indd 84 1/28/08 9:20:18 AM

85
The hypotheses in STUDY III increase in their specificity, and if all three hypotheses are found to be correct, then the likelihood that PAX6 is involved, relative to other candidates, is expected to be high. Thus, based on these findings:
First, it was expected that crypt more often than other iris characteristics will be associated with personality. Crypt is related to greater tissue loss in the iris than contraction furrows and pigment dots, which in turn may reflect greater tissue loss in the brain (which makes it likely that more measures of personality are associated with crypts than the other iris characteristics).
Second, because PAX6 causes more abundant tissue deficiencies in the left
anterior cingulate cortex (Ellison-Wright et al., 2004), and this hemisphere primarily relates to approach-related behaviors (Davidson, 1992; Davidson, 2001; Davidson et al., 1999), it was expected that crypt frequency in most cases will be related to approach-related behaviors.
Third, because greater tissue loss in the iris may reflect greater tissue loss in the
left anterior cingulate cortex, it was expected that individuals with an open crypt structure (those with more tissue loss in the iris) would score lower on traits that relate to approach-related behaviors than those with a dense crypt structure.
4.4.3 Hypotheses derived from PAX6 expression in the brain, assuming self-organized effects
The behavioral meaning of having a specific crypt frequency is likely to depend on which other iris characteristics are present (Lander & Schork, 1994; Larsson & Pedersen, 2004). Person-oriented analyses take these possibilities into consideration, since they are based on the totality of the whole person. Moreover, this totality is assumed to result from self-organization. This means that although there are, theoretically, an infinite variety of differences with regards to process characteristics and observed states at a detailed level, at a more global level there will often be a small number of more frequently observed patterns (Bergman & Magnusson, 1997; Bergman et al., 2003; Bosma & Kunnen, 2002; Carver & Scheier, 2002). Consequently, it can be expected that from the embryological events that form the adult iris (detailed level), distinct configurations of iris characteristics will occur in the population studied. Furthermore, if self-organizing properties of the embryological development of the brain are reflected in these naturally occurring iris configurations, then it can be expected that these configurations will define subgroups of individuals that differ from each other on personality in a systematic manner. In addition, the individuals in these subgroups may represent different developmental trajectories in regards to personality. Thus, in order to test these assumptions two additional expectations were considered:
First, subgroups of individuals that have configurations of iris characteristics with more tissue loss in the iris were, just as in the variable-oriented analysis, expected to score lower on approach-related behaviors.
84
Figure 14
The term “approach-related behavior” primarily refers to traits that measure goal-directed emotion, which – to various degrees in individuals – are activated by cues of impending rewards. Thus, traits in NEO PI R measuring behaviors that increase the likelihood that an individual is more likely to “approach” rather than “withdraw” from people, and different situations and challenges, are regarded as measures of approach-related behaviors. Such traits typically measure approach-related emotions that tap into the individual’s desires, interests, enthusiasms and cravings (Davidson, 1992; Fox, 1991; Gray, 2002).
Anterior cingulate cortex (ACC) anatomy. The upper-right part of the figure contains a reconstructed MRI of the medial surface of the right hemisphere of a single human brain. In this example, an anterior cingulate cortex lies between the cingulate sulcus and the corpus callosum. A schematic representation of Brodmann’s areas of ACC (numbered) is shown on the enlarged section (left). Cognitive division areas are outlined in red, and affective division areas in blue. A schematized flat map of actual anterior cingulate cortex areas is shown in the bottom-right panel. The borders of each sulcus appear as thin unbroken black lines, whereas a combination of broken and dotted lines outline cingulate areas. Adapted from (Bush et al., 2000). Family members with a mutation in PAX6 have local gray and white matter changes in the anterior cingulate cortex (approximate Brodmann areas 24a-c and 32, in both the dorsal and ventral regions), which primarily affect the left hemisphere (Ellison-White et al., 2004).
Dorsal region
Ventral region
Cingulate Cingu
Cingula
Cing
Anterior cingulate
cortex
Cingulate sulcus
Corpus callosum
27864 Avhandling_inlaga.indd 85 1/28/08 9:20:18 AM

87
the iris configurations that typically exist in young adults can identify subgroups of individuals that differ in their personality in a systematic manner on approach-related behaviors. The naturally occurring iris configurations in the population were identified with a cluster analysis based on Ward’s method (Peck & Williams, 2002), and only the iris characteristics that were found to be significantly associated with personality in the variable-oriented analysis were included (hence, crypt and contraction furrows). A four cluster solution was chosen, which explained 77% of the total error sums of squares in the sample (see Table 6). The variance explained was higher than the minimum criterion of 67%, recommended by Bergman, Magnusson, and El-Khouri (2003). A one-way analysis of variance (ANOVA, posthoc = Tukey HSD – Honest Significant Difference test) was used thereafter to investigate if any significant mean difference in personality existed between the four subgroups. Both facet level traits and the main domains of personality were included in the ANOVA analyses. Finally, to explore how efficiently the self-organizing properties of the developmental system could pick out subgroups of individuals that differed in their personality, we calculated the effect size (Cohen, 1988) for all associations that were found to be significant in the variable- and person-oriented analysis. Table 6 The configurations of iris characteristic that typically exists in early adults
Iris characteristic and scale description Subgroup 1
N = 1431
Subgroup 2
N = 1552
Subgroup 3
N = 733
Subgroup 4
N =574
Crypt frequency
1 Only parallel and/or packed curly fibres Yes Yes - -
2 Spots of wavy fibres and 1-3 shallow crypts Yes Yes - -
3 Four shallow crypts or more - - Yes Yes
Contraction furrows
1 Extending less than ¼ circle Yes - - Yes
2 Extending between ¼ and 8/10 of a circle Yes - Yes -
3 Distinct, extending 8/10 of one circle or more - Yes Yes - 1 MeanCrypts = 1.61 / MeanFurrows = 1.65 2 MeanCrypts = 1.52 / MeanFurrows = 3.00 3 MeanCrypts = 3.00 / MeanFurrows = 2.34 4 MeanCrypts = 3.00 / MeanFurrows = 1.00
4.4.5.1 The results of the variable- and person-oriented analyses: hypothesis testing
The first hypothesis, that most of the associations with personality would be with crypt frequency, was confirmed. Furthermore, the second and third hypotheses were also confirmed; crypts were primarily associated with approach-related behaviors, and individuals with a dense crypt structure scored higher than those with an open crypt structure on such behaviors. Thus, the findings in the variable-oriented analysis suggest that crypt frequency, presumably via PAX6, induces tissue deficiencies in the left
86
Second, because the self-organizing properties of the developmental system are expected to more efficiently reveal the behavioral impacts of the genes that are expressed in the iris, the effect size in the person-oriented analysis was expected to be larger than in the variable-oriented analysis.
4.4.4.1 Data collection, participants and measures The participants were all undergraduate student volunteers at Örebro University, Sweden. The mean age of the sample was 26.6 years (19-52 years, SD=7.1). The participants answered 240 questions regarding their personality functioning by filling out the NEO PI-R personality questionnaire (Costa & McCrea, 1992), which is considered to be a reliable and valid assessment of the Five Factor Model of Personality. Eight-item scales measured six specific facets for each of the five broad domains measured. The internal consistencies for the thirty-five scales (Cronbach’s alpha) were overall high, ranging from .69 to .85 (Mean=.72) and did not differ substantially from what has been found for other samples with NEO PI-R measured in Sweden and other countries (Costa & McCrae, 1985). Close-up iris color photography was taken individually in a lab setting at the university (for details, see STUDY II) . The same iris scales and rating procedure as in studies 1 and 2 were used.
Table 5 Distribution of iris characteristics
Iris characteristic and scale description Number of Observations
Fuchs’ crypt frequency 1 – Only parallel and/or densely packed curly fibres 129 2 – Spots of wavy fibres and 1-3 two shallow crypts 169 3 – Four shallow crypts or more 130 Pigment dots 1 – Absence of, or only minute grains of pigment dots 280 2 – One pigment dots or more 148 Contraction furrows 1 – Extending less than ¼ circle 106 2 – Extending between ¼ and 8/10 of a circle 142 3 – More distinct, extending 8/10 of one circle or more 180
4.4.4.2 Analysis The first set of analyses was variable-oriented by nature and tested whether the first three expectations derived from the PAX6 expression pattern in the anterior cingulate cortex were correct. This was done by performing a Pearson correlation between the three iris characteristics and the personality measures. The distributions of the iris characteristics used in these analyses are presented in Table 5. In the second set of analyses, we performed the person-oriented analysis, which tested whether the self-organization properties of how the iris tissue grows also reflect self-organizational events in the left anterior cingulate cortex. This was done by testing if
27864 Avhandling_inlaga.indd 86 1/28/08 9:20:19 AM

87
the iris configurations that typically exist in young adults can identify subgroups of individuals that differ in their personality in a systematic manner on approach-related behaviors. The naturally occurring iris configurations in the population were identified with a cluster analysis based on Ward’s method (Peck & Williams, 2002), and only the iris characteristics that were found to be significantly associated with personality in the variable-oriented analysis were included (hence, crypt and contraction furrows). A four cluster solution was chosen, which explained 77% of the total error sums of squares in the sample (see Table 6). The variance explained was higher than the minimum criterion of 67%, recommended by Bergman, Magnusson, and El-Khouri (2003). A one-way analysis of variance (ANOVA, posthoc = Tukey HSD – Honest Significant Difference test) was used thereafter to investigate if any significant mean difference in personality existed between the four subgroups. Both facet level traits and the main domains of personality were included in the ANOVA analyses. Finally, to explore how efficiently the self-organizing properties of the developmental system could pick out subgroups of individuals that differed in their personality, we calculated the effect size (Cohen, 1988) for all associations that were found to be significant in the variable- and person-oriented analysis. Table 6 The configurations of iris characteristic that typically exists in early adults
Iris characteristic and scale description Subgroup 1
N = 1431
Subgroup 2
N = 1552
Subgroup 3
N = 733
Subgroup 4
N =574
Crypt frequency
1 Only parallel and/or packed curly fibres Yes Yes - -
2 Spots of wavy fibres and 1-3 shallow crypts Yes Yes - -
3 Four shallow crypts or more - - Yes Yes
Contraction furrows
1 Extending less than ¼ circle Yes - - Yes
2 Extending between ¼ and 8/10 of a circle Yes - Yes -
3 Distinct, extending 8/10 of one circle or more - Yes Yes - 1 MeanCrypts = 1.61 / MeanFurrows = 1.65 2 MeanCrypts = 1.52 / MeanFurrows = 3.00 3 MeanCrypts = 3.00 / MeanFurrows = 2.34 4 MeanCrypts = 3.00 / MeanFurrows = 1.00
4.4.5.1 The results of the variable- and person-oriented analyses: hypothesis testing
The first hypothesis, that most of the associations with personality would be with crypt frequency, was confirmed. Furthermore, the second and third hypotheses were also confirmed; crypts were primarily associated with approach-related behaviors, and individuals with a dense crypt structure scored higher than those with an open crypt structure on such behaviors. Thus, the findings in the variable-oriented analysis suggest that crypt frequency, presumably via PAX6, induces tissue deficiencies in the left
86
Second, because the self-organizing properties of the developmental system are expected to more efficiently reveal the behavioral impacts of the genes that are expressed in the iris, the effect size in the person-oriented analysis was expected to be larger than in the variable-oriented analysis.
4.4.4.1 Data collection, participants and measures The participants were all undergraduate student volunteers at Örebro University, Sweden. The mean age of the sample was 26.6 years (19-52 years, SD=7.1). The participants answered 240 questions regarding their personality functioning by filling out the NEO PI-R personality questionnaire (Costa & McCrea, 1992), which is considered to be a reliable and valid assessment of the Five Factor Model of Personality. Eight-item scales measured six specific facets for each of the five broad domains measured. The internal consistencies for the thirty-five scales (Cronbach’s alpha) were overall high, ranging from .69 to .85 (Mean=.72) and did not differ substantially from what has been found for other samples with NEO PI-R measured in Sweden and other countries (Costa & McCrae, 1985). Close-up iris color photography was taken individually in a lab setting at the university (for details, see STUDY II) . The same iris scales and rating procedure as in studies 1 and 2 were used.
Table 5 Distribution of iris characteristics
Iris characteristic and scale description Number of Observations
Fuchs’ crypt frequency 1 – Only parallel and/or densely packed curly fibres 129 2 – Spots of wavy fibres and 1-3 two shallow crypts 169 3 – Four shallow crypts or more 130 Pigment dots 1 – Absence of, or only minute grains of pigment dots 280 2 – One pigment dots or more 148 Contraction furrows 1 – Extending less than ¼ circle 106 2 – Extending between ¼ and 8/10 of a circle 142 3 – More distinct, extending 8/10 of one circle or more 180
4.4.4.2 Analysis The first set of analyses was variable-oriented by nature and tested whether the first three expectations derived from the PAX6 expression pattern in the anterior cingulate cortex were correct. This was done by performing a Pearson correlation between the three iris characteristics and the personality measures. The distributions of the iris characteristics used in these analyses are presented in Table 5. In the second set of analyses, we performed the person-oriented analysis, which tested whether the self-organization properties of how the iris tissue grows also reflect self-organizational events in the left anterior cingulate cortex. This was done by testing if
27864 Avhandling_inlaga.indd 87 1/28/08 9:20:20 AM

89
Table 8
Means of the personality measures with standard deviations within parentheses in each of the four sub-groups, with test for mean differences between the subgroups (one-way ANOVA, posthoc = Tukey HSD)
Personality measure
Subgroup 1
N = 143
Subgroup 2
N = 155
Subgroup 3
N = 73
Subgroup 4
N = 57
df
F
Neuroticism -.15 (.89) .16 (1.01) 1 .01 (1.08) -.11 (1.08) 3; 423 2.63* Impulsiveness -.14 (.95) .19 (.96) 1 -.04 (1.14) -.18 (1.11) 3; 423 3.52* Extraversion - - - - - - Warmth .13 (.97) 3 .03 (.95) -.26 (1.13) -.13 (.99) 3; 423 2.90* Positive Emotions .13 (.92) 3 .05 (1.02) -.26(1.09) -.11 (.97) 3; 423 2.86* Openness .17 (.99) 3 -.00 (.98) -.30 (1.07) -.06 (.88) 3; 423 3.82** Aesthetics .21 (.96) 3 -.01 (.97) -.35 (1.09) -.06 (.90) 3; 423 5.42** Feelings .22 (.94) 3 .01 (1.01) 3 -.38 (1.00) -.15 (.96) 3; 423 6.49** Values .12 (.97) 3 .00 (.99) -.34 (1.10) .07 (.87) 3; 423 3.67** Agreeableness .18 (.97) 3 -.04 (1.01) -.18 (1.09) -.14 (.88) 3; 423 2.92* Trust .20 (.93) 3 -.03 (.98) -.22 (1.17) -.09 (.90) 3; 423 3.48** Tendermindedness .20 (.93) 3 -.07 (1.02) -.20 (1.08) -.12 (.91) 3; 423 3.57** Conscientiousness .11 (.94) 3 -.02 (.94) -.31 (1.04) .17(1.14) 3 3; 423 3.53* Achievement Striving .04 (.93) 3 .04 (.97) 3 -.33 (.99) .16(1.15) 3 3; 423 3.39* Self-Discipline .20 (.95) 3 -.08 (.98) -.39 (1.00) .19(1.02) 3 3; 423 6.84**
* The table show Z-transformed values. Elevated numbers indicates between which subgroups a significant mean difference was observed (posthoc = Tukey HSD) *p < .05; **p < .01.
Table 9 The effect size for all associations that was significant in the variable –and person-oriented analysis
Cohen’s d
Variable-oriented analysis1 Person-oriented analysis2
Personality measure
Pearson Correlations
Crypts Furrows
Subgroup
1 & 2
Subgroup
1 & 3
Subgroup
2 & 3
Subgroup
3 & 4
Neuroticism - .22* .33* - - - Impulsiveness - .30** .36* - - - Extraversion - - - - - - Warmth .30** - - .37* - - Positive Emotions .26** - - .39* - - Openness .20* - - .47** - - Aesthetics .26** - - .55** - - Feelings .28** - - .62** .40* - Values - - .44** - - Agreeableness .20* - - .36* - - Trust .22* - - .39** - - Tendermindedness .26** - - .41** - - Conscientiousness - - - .42* - .44* Achievement Striving - - - .38* .38* .49* Self-Discipline - .24** - .61** - .57**
*p < .05; ** p < .01; only significant associations shown; for definitions of Cohen’s d, see STUDY III.
88
anterior cingulate cortex, which in turn influence the extent individuals engage in approach-related behaviors (see Table 7). The results in the person-oriented analysis supported this notion, as the findings were essentially the same. Subgroups with less tissue loss in the iris were associated with higher scores on approach-related behaviors and the significant mean differences between subgroups 1 and 3 were systematically pinpointing such traits, i.e. Warmth, Positive Emotion, Feelings, Agreeableness, Trust and Tendermindedness (see Table 8). Furthermore, the effect sizes in the person-oriented analysis were, as expected (Mean = .44), larger than those found in the variable-oriented analysis (see Table 9). The effect sizes for the variable-oriented analysis are based on transformations of the correlations, and only consider the significant associations found. However, maybe the most intriguing finding was that also smaller tissue differences than crypts were of major importance. This was apparent in three different ways. First, the association between furrows and the facet scale Impulsiveness in the variable-oriented analysis were of the same magnitude as the strongest association found for crypts (see Table 7). Table 7 Pearson correlation between iris characteristics and the personality measures
Personality measure Iris Characteristics
Crypts Pigment dots Furrows
Neuroticism -.04 .06 .11* Impulsiveness -.06 .02 .15** Extraversion - - - Warmth -.15** -.04 .04 Positive Emotions -.13** .01 .03 Openness to Experience -.10* .01 -.06 Aesthetics -.13** .01 -.06 Feelings -.14** -.05 -.03 Agreeableness -.10* -.06 -.00 Trust -.11* -.05 -.01 Tendermindedness -.13** -.03 -.03 Conscientiousness - - - Self-Discipline -.08 -.03 -.12**
*p < .05; **p < .01; only the significant correlations is shown.
Second, in the person-oriented analysis furrows could differentiate between individuals who scored high and low on the Neuroticism and Conscientiousness domains, even when the individuals in these subgroups had the same crypt structure (see Table 8). Third, when the combined effect of having specific configurations of crypts and furrows was taken into consideration in the person-oriented analysis, the effect Table 8
27864 Avhandling_inlaga.indd 88 1/28/08 9:20:20 AM

89
Table 8
Means of the personality measures with standard deviations within parentheses in each of the four sub-groups, with test for mean differences between the subgroups (one-way ANOVA, posthoc = Tukey HSD)
Personality measure
Subgroup 1
N = 143
Subgroup 2
N = 155
Subgroup 3
N = 73
Subgroup 4
N = 57
df
F
Neuroticism -.15 (.89) .16 (1.01) 1 .01 (1.08) -.11 (1.08) 3; 423 2.63* Impulsiveness -.14 (.95) .19 (.96) 1 -.04 (1.14) -.18 (1.11) 3; 423 3.52* Extraversion - - - - - - Warmth .13 (.97) 3 .03 (.95) -.26 (1.13) -.13 (.99) 3; 423 2.90* Positive Emotions .13 (.92) 3 .05 (1.02) -.26(1.09) -.11 (.97) 3; 423 2.86* Openness .17 (.99) 3 -.00 (.98) -.30 (1.07) -.06 (.88) 3; 423 3.82** Aesthetics .21 (.96) 3 -.01 (.97) -.35 (1.09) -.06 (.90) 3; 423 5.42** Feelings .22 (.94) 3 .01 (1.01) 3 -.38 (1.00) -.15 (.96) 3; 423 6.49** Values .12 (.97) 3 .00 (.99) -.34 (1.10) .07 (.87) 3; 423 3.67** Agreeableness .18 (.97) 3 -.04 (1.01) -.18 (1.09) -.14 (.88) 3; 423 2.92* Trust .20 (.93) 3 -.03 (.98) -.22 (1.17) -.09 (.90) 3; 423 3.48** Tendermindedness .20 (.93) 3 -.07 (1.02) -.20 (1.08) -.12 (.91) 3; 423 3.57** Conscientiousness .11 (.94) 3 -.02 (.94) -.31 (1.04) .17(1.14) 3 3; 423 3.53* Achievement Striving .04 (.93) 3 .04 (.97) 3 -.33 (.99) .16(1.15) 3 3; 423 3.39* Self-Discipline .20 (.95) 3 -.08 (.98) -.39 (1.00) .19(1.02) 3 3; 423 6.84**
* The table show Z-transformed values. Elevated numbers indicates between which subgroups a significant mean difference was observed (posthoc = Tukey HSD) *p < .05; **p < .01.
Table 9 The effect size for all associations that was significant in the variable –and person-oriented analysis
Cohen’s d
Variable-oriented analysis1 Person-oriented analysis2
Personality measure
Pearson Correlations
Crypts Furrows
Subgroup
1 & 2
Subgroup
1 & 3
Subgroup
2 & 3
Subgroup
3 & 4
Neuroticism - .22* .33* - - - Impulsiveness - .30** .36* - - - Extraversion - - - - - - Warmth .30** - - .37* - - Positive Emotions .26** - - .39* - - Openness .20* - - .47** - - Aesthetics .26** - - .55** - - Feelings .28** - - .62** .40* - Values - - .44** - - Agreeableness .20* - - .36* - - Trust .22* - - .39** - - Tendermindedness .26** - - .41** - - Conscientiousness - - - .42* - .44* Achievement Striving - - - .38* .38* .49* Self-Discipline - .24** - .61** - .57**
*p < .05; ** p < .01; only significant associations shown; for definitions of Cohen’s d, see STUDY III.
88
anterior cingulate cortex, which in turn influence the extent individuals engage in approach-related behaviors (see Table 7). The results in the person-oriented analysis supported this notion, as the findings were essentially the same. Subgroups with less tissue loss in the iris were associated with higher scores on approach-related behaviors and the significant mean differences between subgroups 1 and 3 were systematically pinpointing such traits, i.e. Warmth, Positive Emotion, Feelings, Agreeableness, Trust and Tendermindedness (see Table 8). Furthermore, the effect sizes in the person-oriented analysis were, as expected (Mean = .44), larger than those found in the variable-oriented analysis (see Table 9). The effect sizes for the variable-oriented analysis are based on transformations of the correlations, and only consider the significant associations found. However, maybe the most intriguing finding was that also smaller tissue differences than crypts were of major importance. This was apparent in three different ways. First, the association between furrows and the facet scale Impulsiveness in the variable-oriented analysis were of the same magnitude as the strongest association found for crypts (see Table 7). Table 7 Pearson correlation between iris characteristics and the personality measures
Personality measure Iris Characteristics
Crypts Pigment dots Furrows
Neuroticism -.04 .06 .11* Impulsiveness -.06 .02 .15** Extraversion - - - Warmth -.15** -.04 .04 Positive Emotions -.13** .01 .03 Openness to Experience -.10* .01 -.06 Aesthetics -.13** .01 -.06 Feelings -.14** -.05 -.03 Agreeableness -.10* -.06 -.00 Trust -.11* -.05 -.01 Tendermindedness -.13** -.03 -.03 Conscientiousness - - - Self-Discipline -.08 -.03 -.12**
*p < .05; **p < .01; only the significant correlations is shown.
Second, in the person-oriented analysis furrows could differentiate between individuals who scored high and low on the Neuroticism and Conscientiousness domains, even when the individuals in these subgroups had the same crypt structure (see Table 8). Third, when the combined effect of having specific configurations of crypts and furrows was taken into consideration in the person-oriented analysis, the effect Table 8
27864 Avhandling_inlaga.indd 89 1/28/08 9:20:21 AM

91
4.4.5.3 The results of the person-oriented analysis – conceptualizations The results of the person-oriented analysis show that the self-organizing properties of the embryological development of the brain are reflected in the iris, and also that people with different iris configurations tend to develop along different trajectories with regard to personality. Three prerequisites embedded in the person-oriented methodology support this notion. First, when cluster analysis is used to identify the iris configurations (and thereby the subgroups) that naturally occur in the population, it is the embryological self-organizing properties of how the iris tissue develops over time that can be assumed to decide the assignment of the individuals to the subgroups. In other words, since both crypt and contraction furrows are taken into consideration simultaneously in the cluster analysis, it is the joint effect of how these variables tend to self-organize in different tissues within the individual that determines an individual’s assignment to a specific subgroup. If the genes that determine the variability of crypt and contraction furrow were not also self-organized in a meaningful way in relation to how the tissue grows and develops in the left anterior cingulate cortex, then there would not be any significant mean difference on personality between the subgroups. However, significant mean differences did occur in all main domains on personality (see Table 9 on page 89), and for this reason is it reasonable to assume that the self-organizing properties of iris tissue, most likely via PAX6 (or other candidate genes for crypt and furrows) are associated with the self-organizing properties of how the tissue grows and develops in the left anterior cingulate cortex. Furthermore, the fact that both the same personality traits and the direction of the mean differences in the person-oriented analysis were essentially the same as the result in the variable-oriented analysis also supports this notion. Indeed, cluster analysis in its search for the naturally occurring iris configurations sort out the joint effect of both crypt and furrows independently of the associations that are found in the univariate variable-oriented analysis. Hence, it is very unlikely that the association found in the variable-oriented analysis could be due to random effects, or unrelated to how the tissue develops and self-organizes in the left anterior cingulate cortex. This applies in particular in light of the fact that the directions of all the hypotheses derived from PAX6 expression pattern in the brain were confirmed in both the variable-oriented and person-oriented analysis. In other words, the results of the variable-oriented analysis were independently replicated in the person-oriented analysis, which increases the reliability and validity of the findings in this dissertation. Finally, because approach-related behaviors have been recognized to constitute a basic underlying biological predisposition for personality (Buss & Larsen, 2005; Davidson, 1992; Gray, 1990), it was not surprising that also novel associations with personality emerged when both crypt and furrows were taken into consideration in the person-oriented analysis. Tissue deficiencies in the anterior cingulate cortex support the expression of withdrawal- and approach-related behaviors, and as we will see in Part V, this structure of the brain is involved in a wide variety of behaviors that tap into the core of people’s personality functioning (Bush et al., 2000; Devinsky et al., 1995; Gray, 1990).
90
sizes were on average about twice the magnitude of what was found in the variable-oriented analysis (see Table 9 on page 89). Thus, it is apparent that even smaller tissue differences than crypts were of importance. Naturally, emerging configurations of both crypt and furrows were, as expected, pinpointing subgroups of individuals that were especially likely to differ in their personality. Overall, these findings support the notion that people with different iris configurations tend to develop along different trajectories in regards to personality. Furthermore, the self-organized properties of the developmental system that are reflected in the iris appear to be quite efficient in pinpointing the individuals who differ in their personality. The effect sizes between the subgroups in the person-oriented analysis ranged from d = .33 to .62, which is much larger than, for example, women’s tendency to be more emotional than men, d = .05 to .30, see Table 8 and 9 (Brebner, 2003). 4.4.5.2 The results of the variable-oriented analysis – conceptualizations When considering which approach-related behaviors were most salient in the variable-oriented analysis, it was apparent that a group of five approach-related traits i.e. Feelings, Warmth, Trust, Tendermindedness and Positive Emotions, was driving the significant associations in the main domains. Both the significant associations with the facet scales in the Openness to Experience and Agreeableness domains suggest that people with a dense structure were more receptive to their inner feelings as well as tended to sympathize, and feel concern for other people’s needs, more than people with an open crypt structure. Furthermore, the most robust results for crypt frequency suggest that people with a dense structure form warmer and more trustful attachments to others, as well as experience and express positive emotions such as joy, happiness and excitements, more often than those with an open crypt structure. Crypt frequency was thereby predominately associated with approach-related behaviors, and thereby with the facet scales that tap the emotional space in the Extraversion, Openness to Experience and Agreeableness domains. Thus, tissue loss in the two top cell layers in the iris, as assessed by our crypt measure, is in a general sense most strongly associated with the emotional component of personality.
Furthermore, contraction furrows, which measure the thickness and density differences in all five cell layers in the iris, also appear to be associated with emotional functioning. Furrows were primarily associated with Impulsiveness, and people with many contraction furrows were less able to control their cravings and urges than people with few contraction furrows. Thus, the variable-oriented analysis revealed that the behavioral impact of the two iris characteristics differs. Crypt frequency is most strongly related to approach-related behaviors, i.e. the emotional space in the Extraversion, Agreeable and Openness to Experience domains, whereas the effect for contraction furrows is more specific, and relates directly to impulse control.
27864 Avhandling_inlaga.indd 90 1/28/08 9:20:21 AM

91
4.4.5.3 The results of the person-oriented analysis – conceptualizations The results of the person-oriented analysis show that the self-organizing properties of the embryological development of the brain are reflected in the iris, and also that people with different iris configurations tend to develop along different trajectories with regard to personality. Three prerequisites embedded in the person-oriented methodology support this notion. First, when cluster analysis is used to identify the iris configurations (and thereby the subgroups) that naturally occur in the population, it is the embryological self-organizing properties of how the iris tissue develops over time that can be assumed to decide the assignment of the individuals to the subgroups. In other words, since both crypt and contraction furrows are taken into consideration simultaneously in the cluster analysis, it is the joint effect of how these variables tend to self-organize in different tissues within the individual that determines an individual’s assignment to a specific subgroup. If the genes that determine the variability of crypt and contraction furrow were not also self-organized in a meaningful way in relation to how the tissue grows and develops in the left anterior cingulate cortex, then there would not be any significant mean difference on personality between the subgroups. However, significant mean differences did occur in all main domains on personality (see Table 9 on page 89), and for this reason is it reasonable to assume that the self-organizing properties of iris tissue, most likely via PAX6 (or other candidate genes for crypt and furrows) are associated with the self-organizing properties of how the tissue grows and develops in the left anterior cingulate cortex. Furthermore, the fact that both the same personality traits and the direction of the mean differences in the person-oriented analysis were essentially the same as the result in the variable-oriented analysis also supports this notion. Indeed, cluster analysis in its search for the naturally occurring iris configurations sort out the joint effect of both crypt and furrows independently of the associations that are found in the univariate variable-oriented analysis. Hence, it is very unlikely that the association found in the variable-oriented analysis could be due to random effects, or unrelated to how the tissue develops and self-organizes in the left anterior cingulate cortex. This applies in particular in light of the fact that the directions of all the hypotheses derived from PAX6 expression pattern in the brain were confirmed in both the variable-oriented and person-oriented analysis. In other words, the results of the variable-oriented analysis were independently replicated in the person-oriented analysis, which increases the reliability and validity of the findings in this dissertation. Finally, because approach-related behaviors have been recognized to constitute a basic underlying biological predisposition for personality (Buss & Larsen, 2005; Davidson, 1992; Gray, 1990), it was not surprising that also novel associations with personality emerged when both crypt and furrows were taken into consideration in the person-oriented analysis. Tissue deficiencies in the anterior cingulate cortex support the expression of withdrawal- and approach-related behaviors, and as we will see in Part V, this structure of the brain is involved in a wide variety of behaviors that tap into the core of people’s personality functioning (Bush et al., 2000; Devinsky et al., 1995; Gray, 1990).
90
sizes were on average about twice the magnitude of what was found in the variable-oriented analysis (see Table 9 on page 89). Thus, it is apparent that even smaller tissue differences than crypts were of importance. Naturally, emerging configurations of both crypt and furrows were, as expected, pinpointing subgroups of individuals that were especially likely to differ in their personality. Overall, these findings support the notion that people with different iris configurations tend to develop along different trajectories in regards to personality. Furthermore, the self-organized properties of the developmental system that are reflected in the iris appear to be quite efficient in pinpointing the individuals who differ in their personality. The effect sizes between the subgroups in the person-oriented analysis ranged from d = .33 to .62, which is much larger than, for example, women’s tendency to be more emotional than men, d = .05 to .30, see Table 8 and 9 (Brebner, 2003). 4.4.5.2 The results of the variable-oriented analysis – conceptualizations When considering which approach-related behaviors were most salient in the variable-oriented analysis, it was apparent that a group of five approach-related traits i.e. Feelings, Warmth, Trust, Tendermindedness and Positive Emotions, was driving the significant associations in the main domains. Both the significant associations with the facet scales in the Openness to Experience and Agreeableness domains suggest that people with a dense structure were more receptive to their inner feelings as well as tended to sympathize, and feel concern for other people’s needs, more than people with an open crypt structure. Furthermore, the most robust results for crypt frequency suggest that people with a dense structure form warmer and more trustful attachments to others, as well as experience and express positive emotions such as joy, happiness and excitements, more often than those with an open crypt structure. Crypt frequency was thereby predominately associated with approach-related behaviors, and thereby with the facet scales that tap the emotional space in the Extraversion, Openness to Experience and Agreeableness domains. Thus, tissue loss in the two top cell layers in the iris, as assessed by our crypt measure, is in a general sense most strongly associated with the emotional component of personality.
Furthermore, contraction furrows, which measure the thickness and density differences in all five cell layers in the iris, also appear to be associated with emotional functioning. Furrows were primarily associated with Impulsiveness, and people with many contraction furrows were less able to control their cravings and urges than people with few contraction furrows. Thus, the variable-oriented analysis revealed that the behavioral impact of the two iris characteristics differs. Crypt frequency is most strongly related to approach-related behaviors, i.e. the emotional space in the Extraversion, Agreeable and Openness to Experience domains, whereas the effect for contraction furrows is more specific, and relates directly to impulse control.
27864 Avhandling_inlaga.indd 91 1/28/08 9:20:22 AM

93
findings in this dissertation correspond very well to these findings. Indeed, considering the complexity of the embryological development of the iris, it is quite astonishing that the self-organizing properties of the embryological development of the brain are reflected in the iris – in a systematic manner. As we have seen, people with different configurations of crypt and furrows score differently on approach-related behaviors. The explanation for this is most likely that PAX6, or other candidate genes for crypt and furrows, induce subtle tissue differences in both the iris and the frontal lobe (primarily the left anterior cingulate cortex). Furthermore, the consistency with which previous studies have associated left-sided asymmetries with approach-related behaviors over time further supports the notion that people with different iris configurations tend to develop along different personality trajectories. The facts that the principal distribution and depth of crypt are present at birth (Oyster, 1999) and that as many as six approach-related behaviors at age 26 – Feelings, Warmth, Trust, Tendermindedness, Positive Emotions and Agreeableness – are consistently associated with different tissue configurations of crypt and furrows support this notion. 5.1.2 Correspondences with other findings in the personality field:
the Conscientiousness and Impulsiveness findings The notion that approach-related behaviors are foundational for people’s personality development is further supported by the fact that relatively large mean differences in all main domains of personality emerged in the person-oriented analysis (see Table 9 on page 89). Configurations of crypt and furrows were also significantly associated with the Conscientiousness domain, the sub-scales Achievement Striving and Self-discipline in this domain, and also with the Neuroticism domain and the sub-scale Impulsiveness in this domain. These findings correspond well with what is previously known about the overall functioning of the anterior cingulate cortex. That is, the function of anterior cingulate cortex at large, illustrated in Figure 15 (on page 94), is to integrate attentional and affective information that is critical for self-regulation and adaptability. It plays a crucial role in initiation, motivation and goal-directed behaviors (Devinsky et al., 1995; Thayer & Lane, 2000). The ventral region (BA – 24a-c, 25, 32, 33, see figure 14) is primarily involved in assessing the salience of emotions, such as hurtful rejections and romantic love, as well as the regulation of emotional responses involved in the social interactions that assess one’s own and other people’s emotions and states of minds (Bartels & Zeki, 2000; Eisenberger & Lieberman, 2004; Simmons et al., 2006). The dorsal region (BA 24b’-c’, 32’, see Figure 14, on page 84) is primarily involved in response selection and the processing of cognitively demanding information. For example, the cognitions that are activated in reward related conflicts and the evaluation of different outcomes are processed in the dorsal anterior cingulate (Bush et al., 2000). Furthermore, damage to the anterior cingulate is associated with a host of social affective impairments including blunted affect, impulsivity, disinhibition and poor social judgments (Devinsky et al., 1995; Heyman et al., 1999). Thus, since the process of planning, organizing and carrying out tasks, and resisting impulses, is so central for anterior cingulate functioning at large, as well as for the Conscientiousness and Neuroticism domain, it is
92
Part V
Part V discusses the findings concerning iris characteristics and personality, and exemplifies how iris characteristics can be used within the theoretical frameworks presented in parts I, II, III and IV. In other words, Part V aims to explain how iris characteristics – in addition to suggesting candidate genes for personality – can also be used as a matching tool to increase the power to replicate candidate gene findings for personality, as well as being useful in brain scan studies, longitudinal studies and twin studies. 5.1.1 Correspondences with other findings in the personality field: approach-
related behaviors Gray postulates that the brain holds behavioral activation and inhibition systems that are specialized in recognizing cues for reward and punishment, and which in turn influence individual differences in withdrawal- and approach-related behaviors (Gray, 1972; Gray, 1975; Gray, 1990). Such behaviors are recognized to be of importance for personality, and for this reason a considerable amount of work has gone into trying to identify the brain structures that underpin withdrawal- and approach-related behaviors. Hemispheric asymmetries and the functioning of the anterior cingulate cortex have been studied since the sixties (Lansdell, 1964; Peretz, 1960), and this work has now accumulated enough evidence to bear fruit; frontal brain asymmetries are recognized today as an underlying biological disposition for personality (Buss & Larsen, 2005). Indeed, it has repeatedly been shown that tissue and activity asymmetries between the left and right hemispheres are associated with the tendency for people to be more engaged in approach-related behaviors. For example, hemispheric tissue asymmetries in the anterior cingulate cortex are very common. Eighty-three percent of us exhibit hemispheric tissue asymmetries between the left and right cingulate cortex. Surface measures of the anterior cingulate cortex can explain as much as 24% of the phenotypic variance in withdrawal- and approach-related behaviors and people with a larger left cingulate gyrus typically score higher on approach-related behaviors (Pujol et al., 2002; Davidson et al., 2001). For example, positive emotions experienced by monkeys increased the left-sided activation of their brain (Kosslyn et al., 2002). People with a positive disposition show greater relative left frontal EEG asymmetry at baseline and respond stronger to positive stimuli than to negative ones (Sutton & Davidson, 1997; Wheeler et al., 1993). Ten-month-old infants who do not cry when they are separated from their mothers exhibited more left-brain activation (Fox & Davidson, 1987). The thresholds for experiencing positive emotions is lower for people who display a left-sided activation pattern (Fox & Carlkins, 1993). In addition, these left-sided patterns are stable in both early childhood (Fox et al., 1992) and adulthood (Davidson, 2003). It is well established that these behaviors are foundational for people’s personality development, and for this reason it may be of interest for the personality field that the
27864 Avhandling_inlaga.indd 92 1/28/08 9:20:22 AM

93
findings in this dissertation correspond very well to these findings. Indeed, considering the complexity of the embryological development of the iris, it is quite astonishing that the self-organizing properties of the embryological development of the brain are reflected in the iris – in a systematic manner. As we have seen, people with different configurations of crypt and furrows score differently on approach-related behaviors. The explanation for this is most likely that PAX6, or other candidate genes for crypt and furrows, induce subtle tissue differences in both the iris and the frontal lobe (primarily the left anterior cingulate cortex). Furthermore, the consistency with which previous studies have associated left-sided asymmetries with approach-related behaviors over time further supports the notion that people with different iris configurations tend to develop along different personality trajectories. The facts that the principal distribution and depth of crypt are present at birth (Oyster, 1999) and that as many as six approach-related behaviors at age 26 – Feelings, Warmth, Trust, Tendermindedness, Positive Emotions and Agreeableness – are consistently associated with different tissue configurations of crypt and furrows support this notion. 5.1.2 Correspondences with other findings in the personality field:
the Conscientiousness and Impulsiveness findings The notion that approach-related behaviors are foundational for people’s personality development is further supported by the fact that relatively large mean differences in all main domains of personality emerged in the person-oriented analysis (see Table 9 on page 89). Configurations of crypt and furrows were also significantly associated with the Conscientiousness domain, the sub-scales Achievement Striving and Self-discipline in this domain, and also with the Neuroticism domain and the sub-scale Impulsiveness in this domain. These findings correspond well with what is previously known about the overall functioning of the anterior cingulate cortex. That is, the function of anterior cingulate cortex at large, illustrated in Figure 15 (on page 94), is to integrate attentional and affective information that is critical for self-regulation and adaptability. It plays a crucial role in initiation, motivation and goal-directed behaviors (Devinsky et al., 1995; Thayer & Lane, 2000). The ventral region (BA – 24a-c, 25, 32, 33, see figure 14) is primarily involved in assessing the salience of emotions, such as hurtful rejections and romantic love, as well as the regulation of emotional responses involved in the social interactions that assess one’s own and other people’s emotions and states of minds (Bartels & Zeki, 2000; Eisenberger & Lieberman, 2004; Simmons et al., 2006). The dorsal region (BA 24b’-c’, 32’, see Figure 14, on page 84) is primarily involved in response selection and the processing of cognitively demanding information. For example, the cognitions that are activated in reward related conflicts and the evaluation of different outcomes are processed in the dorsal anterior cingulate (Bush et al., 2000). Furthermore, damage to the anterior cingulate is associated with a host of social affective impairments including blunted affect, impulsivity, disinhibition and poor social judgments (Devinsky et al., 1995; Heyman et al., 1999). Thus, since the process of planning, organizing and carrying out tasks, and resisting impulses, is so central for anterior cingulate functioning at large, as well as for the Conscientiousness and Neuroticism domain, it is
92
Part V
Part V discusses the findings concerning iris characteristics and personality, and exemplifies how iris characteristics can be used within the theoretical frameworks presented in parts I, II, III and IV. In other words, Part V aims to explain how iris characteristics – in addition to suggesting candidate genes for personality – can also be used as a matching tool to increase the power to replicate candidate gene findings for personality, as well as being useful in brain scan studies, longitudinal studies and twin studies. 5.1.1 Correspondences with other findings in the personality field: approach-
related behaviors Gray postulates that the brain holds behavioral activation and inhibition systems that are specialized in recognizing cues for reward and punishment, and which in turn influence individual differences in withdrawal- and approach-related behaviors (Gray, 1972; Gray, 1975; Gray, 1990). Such behaviors are recognized to be of importance for personality, and for this reason a considerable amount of work has gone into trying to identify the brain structures that underpin withdrawal- and approach-related behaviors. Hemispheric asymmetries and the functioning of the anterior cingulate cortex have been studied since the sixties (Lansdell, 1964; Peretz, 1960), and this work has now accumulated enough evidence to bear fruit; frontal brain asymmetries are recognized today as an underlying biological disposition for personality (Buss & Larsen, 2005). Indeed, it has repeatedly been shown that tissue and activity asymmetries between the left and right hemispheres are associated with the tendency for people to be more engaged in approach-related behaviors. For example, hemispheric tissue asymmetries in the anterior cingulate cortex are very common. Eighty-three percent of us exhibit hemispheric tissue asymmetries between the left and right cingulate cortex. Surface measures of the anterior cingulate cortex can explain as much as 24% of the phenotypic variance in withdrawal- and approach-related behaviors and people with a larger left cingulate gyrus typically score higher on approach-related behaviors (Pujol et al., 2002; Davidson et al., 2001). For example, positive emotions experienced by monkeys increased the left-sided activation of their brain (Kosslyn et al., 2002). People with a positive disposition show greater relative left frontal EEG asymmetry at baseline and respond stronger to positive stimuli than to negative ones (Sutton & Davidson, 1997; Wheeler et al., 1993). Ten-month-old infants who do not cry when they are separated from their mothers exhibited more left-brain activation (Fox & Davidson, 1987). The thresholds for experiencing positive emotions is lower for people who display a left-sided activation pattern (Fox & Carlkins, 1993). In addition, these left-sided patterns are stable in both early childhood (Fox et al., 1992) and adulthood (Davidson, 2003). It is well established that these behaviors are foundational for people’s personality development, and for this reason it may be of interest for the personality field that the
27864 Avhandling_inlaga.indd 93 1/28/08 9:20:23 AM

95
create tissue-specific effects, and also the brain centers that influence self-reported personality, are almost entirely unknown (Plomin & Crabbe, 2000). Hence, iris data can potentially be a very useful tool for studies that try to elucidate these complexities. All predictions in study 3 were supported and, for this reason, the likelihood that PAX6 would be involved has to be considered high (Gottesman & Gould, 2003). Furthermore, since the effect sizes increased for all associations when the person-oriented analysis took advantage of the self-organized properties of the nervous system, it is likely that the genes for crypt and furrows are hooked up in genetic networks of relevance to personality. In addition, these networks may explain a relatively large proportion of the variance in approach-related behaviors. The effect sizes between the clusters in the person-oriented analyses ranged from d = .33 to .62, which is much larger than, for example, women’s tendency to be more emotional than men, d = .05 to .30 (Brebner, 2003). Genetic association studies that aim at pinpointing networks of genes that support the development of different approach-related behaviors may thus benefit from testing candidate genes for crypt and furrows. In other words, due to the consistency of the results in the variable- and person-oriented analyses, as well as with the previous findings reviewed above, crypt and furrows may be considered to be a biomarker for multiple biological pathways that potentially can be of great importance for the development of approach-related behaviors per se. As mentioned earlier, most candidate genes for crypt and furrows are expressed at an early stage during the embryological development of the nervous system, as well as throughout the development of the nervous system, which is likely to have a cumulative effect. For these reasons, the effect sizes of other genes that contribute to approach-related behaviors – that are NOT expressed in the iris – may depend on these developmental pathways (Baker et al., 2001). That is, candidate genes for personality that are not expressed in the iris, and also genes in linkage disequilibrium with candidate genes for crypt and furrows, may contribute to approach-related behaviors, and join with the genetic networks already in place; if these genes can be identified, they can potentially explain an additional chunk of the genetic variance in approach-related behaviors. However, because the behavioral meaning of most genes for personality is dependent on genetic background (Frankel & Schork, 1996; Keller et al., 2005; Lander & Schork, 1994), the effect of such genes may only be detectable if they are tested in a population with a more stable genetic background, where all members have the same type of iris characteristics – or expressed differently – if they are tested in a genetic background that is less heterogeneous with regard to the genes that are expressed early in these biological pathways. Thus, from this perspective, it can potentially be very useful to collect iris data (not just genotype DNA markers in candidate genes for crypt and furrows), and to create groups of individuals that have the same type of iris characteristics, and in these groups test
94
not surprising – given the expression pattern of PAX6 in the iris and anterior cingulate cortex – that individuals with different configurations of crypt and furrows scored differently in these domains.
Figure 15
This means that the findings in this dissertation not only correspond well with what previously is known about the biological foundation for approach-related behaviors, but also point toward what may will come to be recognized as the biological foundation for Impulsiveness and Conscientiousness in the future. 5.2.1 Novel findings and how iris data potentially can be useful for genetic
association studies The use of iris characteristics in this dissertation makes it possible to suggest which candidate genes, among the ones that is mentioned in STUDY II, that are most likely to influence the associations between frontal brain asymmetries and approach-related behaviors. As mentioned earlier, about one third of our 20-25,000 genes or so (Stein, 2004) are expressed in the brain, and can therefore be considered to be candidate genes for personality (Plomin & Crabbe, 2000). However, the genes that network together to
Meta-analysis of activations and deactivations during cognitive and emotional studies. Activations (a) and deactivations (b) are shown. The affective division is activated by tasks that relate to affective or emotional content, or symptom provocation. It is deactivated by cognitively demanding tasks. A direct comparison within the same subjects supports the cognitive versus affective distinction. The orange triangle indicates the activation of the cognitive division during the Cognitive Counting Stroop. The same group of subjects activated the affective division (blue diamond) while performing the Emotional Counting Stroop. Although matched normal controls activated the cognitive division during the Counting Stroop (yellow triangle), subjects with attention-deficit/hyperactivity disorder failed to activate this region. Abbreviation: CC = corpus callosum. Adapted from Buch et al. (2000).
27864 Avhandling_inlaga.indd 94 1/28/08 9:20:24 AM

95
create tissue-specific effects, and also the brain centers that influence self-reported personality, are almost entirely unknown (Plomin & Crabbe, 2000). Hence, iris data can potentially be a very useful tool for studies that try to elucidate these complexities. All predictions in study 3 were supported and, for this reason, the likelihood that PAX6 would be involved has to be considered high (Gottesman & Gould, 2003). Furthermore, since the effect sizes increased for all associations when the person-oriented analysis took advantage of the self-organized properties of the nervous system, it is likely that the genes for crypt and furrows are hooked up in genetic networks of relevance to personality. In addition, these networks may explain a relatively large proportion of the variance in approach-related behaviors. The effect sizes between the clusters in the person-oriented analyses ranged from d = .33 to .62, which is much larger than, for example, women’s tendency to be more emotional than men, d = .05 to .30 (Brebner, 2003). Genetic association studies that aim at pinpointing networks of genes that support the development of different approach-related behaviors may thus benefit from testing candidate genes for crypt and furrows. In other words, due to the consistency of the results in the variable- and person-oriented analyses, as well as with the previous findings reviewed above, crypt and furrows may be considered to be a biomarker for multiple biological pathways that potentially can be of great importance for the development of approach-related behaviors per se. As mentioned earlier, most candidate genes for crypt and furrows are expressed at an early stage during the embryological development of the nervous system, as well as throughout the development of the nervous system, which is likely to have a cumulative effect. For these reasons, the effect sizes of other genes that contribute to approach-related behaviors – that are NOT expressed in the iris – may depend on these developmental pathways (Baker et al., 2001). That is, candidate genes for personality that are not expressed in the iris, and also genes in linkage disequilibrium with candidate genes for crypt and furrows, may contribute to approach-related behaviors, and join with the genetic networks already in place; if these genes can be identified, they can potentially explain an additional chunk of the genetic variance in approach-related behaviors. However, because the behavioral meaning of most genes for personality is dependent on genetic background (Frankel & Schork, 1996; Keller et al., 2005; Lander & Schork, 1994), the effect of such genes may only be detectable if they are tested in a population with a more stable genetic background, where all members have the same type of iris characteristics – or expressed differently – if they are tested in a genetic background that is less heterogeneous with regard to the genes that are expressed early in these biological pathways. Thus, from this perspective, it can potentially be very useful to collect iris data (not just genotype DNA markers in candidate genes for crypt and furrows), and to create groups of individuals that have the same type of iris characteristics, and in these groups test
94
not surprising – given the expression pattern of PAX6 in the iris and anterior cingulate cortex – that individuals with different configurations of crypt and furrows scored differently in these domains.
Figure 15
This means that the findings in this dissertation not only correspond well with what previously is known about the biological foundation for approach-related behaviors, but also point toward what may will come to be recognized as the biological foundation for Impulsiveness and Conscientiousness in the future. 5.2.1 Novel findings and how iris data potentially can be useful for genetic
association studies The use of iris characteristics in this dissertation makes it possible to suggest which candidate genes, among the ones that is mentioned in STUDY II, that are most likely to influence the associations between frontal brain asymmetries and approach-related behaviors. As mentioned earlier, about one third of our 20-25,000 genes or so (Stein, 2004) are expressed in the brain, and can therefore be considered to be candidate genes for personality (Plomin & Crabbe, 2000). However, the genes that network together to
Meta-analysis of activations and deactivations during cognitive and emotional studies. Activations (a) and deactivations (b) are shown. The affective division is activated by tasks that relate to affective or emotional content, or symptom provocation. It is deactivated by cognitively demanding tasks. A direct comparison within the same subjects supports the cognitive versus affective distinction. The orange triangle indicates the activation of the cognitive division during the Cognitive Counting Stroop. The same group of subjects activated the affective division (blue diamond) while performing the Emotional Counting Stroop. Although matched normal controls activated the cognitive division during the Counting Stroop (yellow triangle), subjects with attention-deficit/hyperactivity disorder failed to activate this region. Abbreviation: CC = corpus callosum. Adapted from Buch et al. (2000).
27864 Avhandling_inlaga.indd 95 1/28/08 9:20:24 AM

97
this magnitude, i.e., one that can explain about 1% of the variance for the trait. Thus, there is no reason why it would not be possible conclusively to replicate such candidate gene findings, by pinpointing for whom a particular gene is most relevant, by using the design described above. In addition, since genes that play an important role in the early wiring of the nervous system are likely to be of importance for many behaviors, it may be efficient to use the pathway based iris matching procedure described above for behaviors other than personality. For example, genes that influence brain volume may also be important for intelligence (Posthuma et al., 2003). PAX6 mutations in mice decrease the number of neurons developed in the cerebral cortex by as much as 50% (Heins et al., 2002). Consequently, it is not surprising that a recent review has shown that tissue differences in Brodmann’s areas 32 in the anterior cingulate cortex, which are influenced by PAX6 (Ellison-Wright et al., 2004; Heyman et al., 1999), are consistently associated with intelligence measures across more than 30% of the studies. The review, which summarized 37 studies, concluded that “the anterior cingulate cortex remains a strong biological correlate of intelligence, as both volume and activation of this structure were found across several studies” (Jung & Haier, 2007). Collection of iris data, and the design described above, may thus also be useful for genetic studies that try to replicate candidate gene findings for intelligence (Saklofske et al., 1999). Indeed, considering that the average effect size for QTLs that influence intelligence is nowadays believed to be only .2 % (Plomin et al., 2006), it can potentially be fruitful to test the extent to which such effect sizes will increase in iris-matched populations. Each QTL for intelligence opens a tiny window where the biological mechanisms that influence intelligence can be studied. Furthermore, since the goal of genetic research on intelligence according to Plomin (2006, page 520), “must be to identify as many as possible of the QTLs that are responsible for the high heritability of intelligence regardless of how small their effect sizes”, there are at least four reasons why it may be worthwhile also to collect iris data in such studies.
1) If some of the “SNP sets” for intelligence that will be generated from whole genome scan studies in the future can be more readily replicated in iris-matched populations than in unmatched populations, then it will be possible to recognize for whom a particular “SNP set” would be most important.
2) It may also be easier to pinpoint how different networks of genes for intelligence work together in populations that have been matched on their iris characteristics (for the same reasons as outlined above for personality).
3) The “in-house” assessment of intelligence may also provide a convenient opportunity for taking the close-up digital iris photos needed.
4) There is the potential to replicate QTL findings for intelligence in a much cheaper way than currently is possible if iris data have been collected (as the replication of significant “SNP set” findings can be made in the same sample, i.e., in sub-groups that have been matched on their iris characteristics).
96
the extent to which it is possible to replicate candidate gene findings for personality. If some of the 60 or so candidate genes for personality that have been identified thus far (Comings et al., 2000a) turn out to be significantly associated with personality in one of these subgroups, but not in others, then it is likely that those genes will be relevant to the genetic networks that are already in place in that particular group. Thus, by working with just a few iris-matched groups in this manner, which makes it possible to cross-validate findings between different groups, and track how the same genes, in some instances, influence different behaviors (in different groups), it may be possible to conclusively identify which candidate genes that are most likely to be associated with personality. Indeed, conceptually this is exactly what was found in the person-oriented analysis, since the behavioral meaning of having many furrows for people changed when the genetic background changed. For example, people with a dense iris structure and many furrows were more Impulsive (compared with those with a dense structure and few contraction furrows), whereas people with an open iris structure and many furrows were less Conscientious (compared with those with an open structure and few contraction furrows). No mean differences on Impulsiveness emerged for people with different numbers of contraction furrows if they had an open iris structure (see Table 9, on page 89). Thus, placing people with different iris configurations in different groups, testing different candidate genes for personality, and analyzing these groups separately will make the design much more specific. That is, the possibility that the genes will influence the same behavior in the same way – i.e., that the direction of the associations will stay the same when replicated in additional iris-matched populations - will be much greater. This implies that it will be possible to map out the behavioral meaning of having a particular gene in a much more specific way in iris-matched populations than is possible in a population that has not been matched on iris characteristics. However, this design will also, because it pinpoints for whom (in which iris-matched group) a particular gene is most relevant, be of greater importance for the individual. Again, this was exactly what was found conceptually, when the effect of the self-organizing mechanisms that govern the development of the nervous system were taken into account in the person-oriented analyses. For example, the effect size of furrows’ association with Self- Discipline in the variable-oriented analysis was .24. This means that about 1% of the variance in Self-Discipline in the population as a whole could be explained by genes that influence furrows. However, when the effect of furrows was tested in populations where the genetic background was more stable (both subgroups 3 and 5 had an open crypt structure, see Table 9 on page 89), then the effect size in that sub-population more than doubled (to .57). The same was true for the whole Conscientiousness domain and also the Achievement Striving sub-scale in this domain, indicating that genes for furrows are most relevant for people with an open iris structure. Many candidate genes that have been impossible conclusively to replicate in large independent samples have, in some samples, been found to have an effect size of
27864 Avhandling_inlaga.indd 96 1/28/08 9:20:25 AM

97
this magnitude, i.e., one that can explain about 1% of the variance for the trait. Thus, there is no reason why it would not be possible conclusively to replicate such candidate gene findings, by pinpointing for whom a particular gene is most relevant, by using the design described above. In addition, since genes that play an important role in the early wiring of the nervous system are likely to be of importance for many behaviors, it may be efficient to use the pathway based iris matching procedure described above for behaviors other than personality. For example, genes that influence brain volume may also be important for intelligence (Posthuma et al., 2003). PAX6 mutations in mice decrease the number of neurons developed in the cerebral cortex by as much as 50% (Heins et al., 2002). Consequently, it is not surprising that a recent review has shown that tissue differences in Brodmann’s areas 32 in the anterior cingulate cortex, which are influenced by PAX6 (Ellison-Wright et al., 2004; Heyman et al., 1999), are consistently associated with intelligence measures across more than 30% of the studies. The review, which summarized 37 studies, concluded that “the anterior cingulate cortex remains a strong biological correlate of intelligence, as both volume and activation of this structure were found across several studies” (Jung & Haier, 2007). Collection of iris data, and the design described above, may thus also be useful for genetic studies that try to replicate candidate gene findings for intelligence (Saklofske et al., 1999). Indeed, considering that the average effect size for QTLs that influence intelligence is nowadays believed to be only .2 % (Plomin et al., 2006), it can potentially be fruitful to test the extent to which such effect sizes will increase in iris-matched populations. Each QTL for intelligence opens a tiny window where the biological mechanisms that influence intelligence can be studied. Furthermore, since the goal of genetic research on intelligence according to Plomin (2006, page 520), “must be to identify as many as possible of the QTLs that are responsible for the high heritability of intelligence regardless of how small their effect sizes”, there are at least four reasons why it may be worthwhile also to collect iris data in such studies.
1) If some of the “SNP sets” for intelligence that will be generated from whole genome scan studies in the future can be more readily replicated in iris-matched populations than in unmatched populations, then it will be possible to recognize for whom a particular “SNP set” would be most important.
2) It may also be easier to pinpoint how different networks of genes for intelligence work together in populations that have been matched on their iris characteristics (for the same reasons as outlined above for personality).
3) The “in-house” assessment of intelligence may also provide a convenient opportunity for taking the close-up digital iris photos needed.
4) There is the potential to replicate QTL findings for intelligence in a much cheaper way than currently is possible if iris data have been collected (as the replication of significant “SNP set” findings can be made in the same sample, i.e., in sub-groups that have been matched on their iris characteristics).
96
the extent to which it is possible to replicate candidate gene findings for personality. If some of the 60 or so candidate genes for personality that have been identified thus far (Comings et al., 2000a) turn out to be significantly associated with personality in one of these subgroups, but not in others, then it is likely that those genes will be relevant to the genetic networks that are already in place in that particular group. Thus, by working with just a few iris-matched groups in this manner, which makes it possible to cross-validate findings between different groups, and track how the same genes, in some instances, influence different behaviors (in different groups), it may be possible to conclusively identify which candidate genes that are most likely to be associated with personality. Indeed, conceptually this is exactly what was found in the person-oriented analysis, since the behavioral meaning of having many furrows for people changed when the genetic background changed. For example, people with a dense iris structure and many furrows were more Impulsive (compared with those with a dense structure and few contraction furrows), whereas people with an open iris structure and many furrows were less Conscientious (compared with those with an open structure and few contraction furrows). No mean differences on Impulsiveness emerged for people with different numbers of contraction furrows if they had an open iris structure (see Table 9, on page 89). Thus, placing people with different iris configurations in different groups, testing different candidate genes for personality, and analyzing these groups separately will make the design much more specific. That is, the possibility that the genes will influence the same behavior in the same way – i.e., that the direction of the associations will stay the same when replicated in additional iris-matched populations - will be much greater. This implies that it will be possible to map out the behavioral meaning of having a particular gene in a much more specific way in iris-matched populations than is possible in a population that has not been matched on iris characteristics. However, this design will also, because it pinpoints for whom (in which iris-matched group) a particular gene is most relevant, be of greater importance for the individual. Again, this was exactly what was found conceptually, when the effect of the self-organizing mechanisms that govern the development of the nervous system were taken into account in the person-oriented analyses. For example, the effect size of furrows’ association with Self- Discipline in the variable-oriented analysis was .24. This means that about 1% of the variance in Self-Discipline in the population as a whole could be explained by genes that influence furrows. However, when the effect of furrows was tested in populations where the genetic background was more stable (both subgroups 3 and 5 had an open crypt structure, see Table 9 on page 89), then the effect size in that sub-population more than doubled (to .57). The same was true for the whole Conscientiousness domain and also the Achievement Striving sub-scale in this domain, indicating that genes for furrows are most relevant for people with an open iris structure. Many candidate genes that have been impossible conclusively to replicate in large independent samples have, in some samples, been found to have an effect size of
27864 Avhandling_inlaga.indd 97 1/28/08 9:20:25 AM

99
In any event, the fact that the self-organized embryological development of the anterior cingulate cortex is reflected in the iris in a systematic manner, and that effect sizes were found to be higher in the person-oriented than the variable-oriented analyses, support the notion that if iris-matched sub-populations are used, then the more similar genetic background present in subgroups is likely to improve the power to replicate candidate findings for personality.
5.2.2 Other future studies Before iris data are used as described above in genetic association studies, however, it may be necessary to perform additional studies that investigate the extent to which crypt and furrows really are associated with personality and other behaviors that are supported by the frontal lobe. The following areas are highlighted, where it may be especially rewarding to further investigate the potential usefulness of the iris as a biomarker: Magnetic resonance imaging (MRI) studies of the brain can identify the extent to which crypt and furrows are associated with structural difference in the anterior cingulate cortex. Thus, in such a study, additional evidence can be produced that potentially will support the notion that crypt and furrows can be biomarkers for developmental brain differences in large samples, where it would be too expensive and time consuming to collect MRI data on the brain. In contrast to MRI data, it takes about 3 min per person to take the digital iris photos needed, which readily can be rated automatically by an iris scanner once the algorithm currently used for personal identification (Daugman, 2003) have been modified to fit this purpose (J. Dougman, personal communication, July, 2, 1999). As discussed throughout this dissertation, such efforts would make it possible to study many neurodevelopmental questions that today are “impossible” to study in large samples. For example, do genes that influence the dopamine, serotonin and noradrenalin systems and their assumed behavioral associations to specific personality traits (Cloninger et al., 1993; Comings et al., 2000a) change when the structure of the brain shifts? Longitudinal-studies: Iris data may be able to map out how impulsive and approach-related behaviors of genetic origin, in interaction with environmental factors, influence dyadic relationships between family members. For example, it would be interesting to find out if measures of control and warmth in families (i.e. measured through child disclosure, parental solicitation, parental control, parental support and parents’ bad reactions to disclosure) differ from what is normal in parent-child dyads where there is a low concordance between the child and the parent iris configurations. The fact that the expression pattern for PAX6 in the brain overlaps with the cortical foundation for maternal behaviors (mainly BA 24/32 and 47) and hurtful social rejections (BA 24/32), in conjunction with our results in regard to approach-related and impulsive behaviors, suggests that the iris can be useful marker for biological mechanisms that influence the interaction between such child and parent-based behaviors (Eisenberger & Lieberman, 2004; Kerr & Stattin, 2003; Lorberbaum et al., 2002; Neiderhiser et al., 2004).
98
To sum up, Pujol (2002) has demonstrated that about 83% of us exhibit hemispheric tissue asymmetries between the left and right cingulate cortex, and that surface asymmetries in the anterior cingulate cortex can explain as much as 24% of the phenotypic variance in withdrawal- and approach-related behaviors. This means that hemispheric tissue asymmetries in large samples are far too common to be ignored, since they are likely to mask most associations between genes with small effects on personality (Davidson, 2001; Gray, 1990; Munafo et al., 2007; Pujol et al., 2002). Indeed, the poor track record of genetic personality research thus far, at least in regard to genes’ predictive power (see Part III), are most likely due to the fact that few genetic personality studies have considered genetic networks that influence the structural foundation of the brain (Davidson, 2001; Gray, 1990; Hamer, 2002; Saklofske et al., 1999; Van Gestel & Van Broeckhoven, 2003). Thus, from this perspective it is possible that iris data can be useful in at least two different ways: 1) Genetic association studies that aim at pinpointing the genetic networks that support the development of different approach-related behaviors as well as other behaviors, which are influenced by genes that contribute to personality, may benefit from testing candidate genes for crypt and furrows. 2) Genetic association studies aimed at replicating candidate gene findings that have already been found for personality and that will be generated from whole genome scan studies in the future - as well as other behaviors (which are influenced by the genes that are expressed early in the developing nervous system, such as intelligence) may benefit from using the iris as a matching tool. As we have seen, by creating iris-matched subgroups of individuals that are analyzed separately, the genetic heterogeneity present in such groups decreases, which will increase the power to detect genes with small effects, and also pinpoint for whom a particular gene is most relevant. The basic idea is thus exactly the same as used in inbred mice strains and family studies, where it is much easier to identify QTLs for emotionality in strains where the genetic background is similar than in strains where the genetic background is more complex. Remember that just 6 loci can account for almost all phenotypic variance for emotionality in inbred mice strains (Flint, 2003; Flint et al., 2005; Willis-Owen & Flint, 2006). Similarly, it is only in groups of relatives where a substantial chunk of the genetic background is the same, that people are expected to score in a more similar manner on personality (Plomin et al., 2001b). Thus, if we take all these facts together, the results of the person-oriented analysis suggests that it may be possible to use iris data, person-oriented analyses and various genomic association techniques to identify QTLs that are responsible for differences in the anterior cingulate cortex, and with time develop a hierarchical model that maps out how personality genes that influence the structural foundation of the brain interact with genes for neurotransmission (Baker et al., 2001; Davidson, 2001; Hamer, 2002; Lee et al., 2006; Saklofske et al., 1999).
27864 Avhandling_inlaga.indd 98 1/28/08 9:20:26 AM

99
In any event, the fact that the self-organized embryological development of the anterior cingulate cortex is reflected in the iris in a systematic manner, and that effect sizes were found to be higher in the person-oriented than the variable-oriented analyses, support the notion that if iris-matched sub-populations are used, then the more similar genetic background present in subgroups is likely to improve the power to replicate candidate findings for personality.
5.2.2 Other future studies Before iris data are used as described above in genetic association studies, however, it may be necessary to perform additional studies that investigate the extent to which crypt and furrows really are associated with personality and other behaviors that are supported by the frontal lobe. The following areas are highlighted, where it may be especially rewarding to further investigate the potential usefulness of the iris as a biomarker: Magnetic resonance imaging (MRI) studies of the brain can identify the extent to which crypt and furrows are associated with structural difference in the anterior cingulate cortex. Thus, in such a study, additional evidence can be produced that potentially will support the notion that crypt and furrows can be biomarkers for developmental brain differences in large samples, where it would be too expensive and time consuming to collect MRI data on the brain. In contrast to MRI data, it takes about 3 min per person to take the digital iris photos needed, which readily can be rated automatically by an iris scanner once the algorithm currently used for personal identification (Daugman, 2003) have been modified to fit this purpose (J. Dougman, personal communication, July, 2, 1999). As discussed throughout this dissertation, such efforts would make it possible to study many neurodevelopmental questions that today are “impossible” to study in large samples. For example, do genes that influence the dopamine, serotonin and noradrenalin systems and their assumed behavioral associations to specific personality traits (Cloninger et al., 1993; Comings et al., 2000a) change when the structure of the brain shifts? Longitudinal-studies: Iris data may be able to map out how impulsive and approach-related behaviors of genetic origin, in interaction with environmental factors, influence dyadic relationships between family members. For example, it would be interesting to find out if measures of control and warmth in families (i.e. measured through child disclosure, parental solicitation, parental control, parental support and parents’ bad reactions to disclosure) differ from what is normal in parent-child dyads where there is a low concordance between the child and the parent iris configurations. The fact that the expression pattern for PAX6 in the brain overlaps with the cortical foundation for maternal behaviors (mainly BA 24/32 and 47) and hurtful social rejections (BA 24/32), in conjunction with our results in regard to approach-related and impulsive behaviors, suggests that the iris can be useful marker for biological mechanisms that influence the interaction between such child and parent-based behaviors (Eisenberger & Lieberman, 2004; Kerr & Stattin, 2003; Lorberbaum et al., 2002; Neiderhiser et al., 2004).
98
To sum up, Pujol (2002) has demonstrated that about 83% of us exhibit hemispheric tissue asymmetries between the left and right cingulate cortex, and that surface asymmetries in the anterior cingulate cortex can explain as much as 24% of the phenotypic variance in withdrawal- and approach-related behaviors. This means that hemispheric tissue asymmetries in large samples are far too common to be ignored, since they are likely to mask most associations between genes with small effects on personality (Davidson, 2001; Gray, 1990; Munafo et al., 2007; Pujol et al., 2002). Indeed, the poor track record of genetic personality research thus far, at least in regard to genes’ predictive power (see Part III), are most likely due to the fact that few genetic personality studies have considered genetic networks that influence the structural foundation of the brain (Davidson, 2001; Gray, 1990; Hamer, 2002; Saklofske et al., 1999; Van Gestel & Van Broeckhoven, 2003). Thus, from this perspective it is possible that iris data can be useful in at least two different ways: 1) Genetic association studies that aim at pinpointing the genetic networks that support the development of different approach-related behaviors as well as other behaviors, which are influenced by genes that contribute to personality, may benefit from testing candidate genes for crypt and furrows. 2) Genetic association studies aimed at replicating candidate gene findings that have already been found for personality and that will be generated from whole genome scan studies in the future - as well as other behaviors (which are influenced by the genes that are expressed early in the developing nervous system, such as intelligence) may benefit from using the iris as a matching tool. As we have seen, by creating iris-matched subgroups of individuals that are analyzed separately, the genetic heterogeneity present in such groups decreases, which will increase the power to detect genes with small effects, and also pinpoint for whom a particular gene is most relevant. The basic idea is thus exactly the same as used in inbred mice strains and family studies, where it is much easier to identify QTLs for emotionality in strains where the genetic background is similar than in strains where the genetic background is more complex. Remember that just 6 loci can account for almost all phenotypic variance for emotionality in inbred mice strains (Flint, 2003; Flint et al., 2005; Willis-Owen & Flint, 2006). Similarly, it is only in groups of relatives where a substantial chunk of the genetic background is the same, that people are expected to score in a more similar manner on personality (Plomin et al., 2001b). Thus, if we take all these facts together, the results of the person-oriented analysis suggests that it may be possible to use iris data, person-oriented analyses and various genomic association techniques to identify QTLs that are responsible for differences in the anterior cingulate cortex, and with time develop a hierarchical model that maps out how personality genes that influence the structural foundation of the brain interact with genes for neurotransmission (Baker et al., 2001; Davidson, 2001; Hamer, 2002; Lee et al., 2006; Saklofske et al., 1999).
27864 Avhandling_inlaga.indd 99 1/28/08 9:20:27 AM

101
Furthermore, the heritability of some personality traits may be higher among MZ twin pairs that have been matched on their iris characteristics, compared with what is the case in unmatched populations. For example, it is quite possible that the heritability of Achievement Striving, Self-Discipline and Conscientiousness in a sub-population of MZ twins, where both twins have an open iris structure with many furrows, will be higher compared with what would be the case for those traits when all twins in the population are considered. Likewise, the heritability of Feelings, Warmth, Trust, Tender-mindedness, Values, Positive Emotions, Agreeableness and Openness for subgroups of MZ twins with a dense iris structure with few furrows may be higher than generally found when all twins in the population are analyzed. Thus, by collecting iris data on twins, it may be possible to pinpoint the aspects of an individual’s personality profile that are most strongly influenced by genetic factors. People may not find it very interesting (especially not for better understanding of their own genetic propensities) that about 40% of the personality differences observed in large populations - as an overall average for those populations - are due to genetic effects. However, if science can show us which aspects of our own personality profile that are most strongly influenced by genetic factors, it would be very surprising, considering how individualized our culture is, if that would not evoke considerably more interest. Thus, if other behaviors influenced by genes that contribute to personality are examined (see Part III on page 45 for a detailed list of such behaviors), it may be possible to discover a wide range of core traits (in different behavioral domains) that, from a genetic standpoint, are of greater importance to the individual. Research that uses iris data collected from twins and a person-oriented methodology is therefore in an excellent position to stimulate a holistic approach to personality. A holistic approach emphasizes the importance of studying more comprehensive wholes of the person-environment system as a unit, and is bound to benefit from the identification of genes or other biomarkers that can link different domains in the person-environment system together (Bergman, 2000; Bronfenbrenner & Ceci, 1994; Kendler et al., 2006; Kerr & Stattin, 2003; Magnusson, 1999; Plomin & Asbury, 2005; Rutter et al., 2006; Stattin & Magnusson, 1996). Furthermore, considering how difficult it has been to replicate candidate gene findings for personality over the last 10 years and that research, for the most part, has relied on the assumption that that there is a direct link between the expression of additive genes and behavior. This is a questionable assumption given that as much as half of the genetic effect of personality is non-additive by nature, which is bound to mask some proportion of the additive genetic impact. It is quite possible that it will be fruitful to introduce iris data and a person-oriented methodology into behavioral genetic research in the future. As we have seen, the self-organized embryological developments of the iris and the frontal lobe are systematically related to each other. The more stable genetic background present in iris-matched populations can increase power to detect
100
Likewise, as discussed in Part II, there is a whole range of measures that tap into the qualities in close/intimate relationships that are also influenced by the genes contributing to personality. Thus, it would be very interesting to investigate whether measures, such as those concerning divorce risk, marital satisfaction, adult attachment styles, different person x situation interactions, differ in a systematic manner with regard to the iris characteristics present in different dyads. People with different iris configurations differ in their emotional functioning to a much greater extent than generally is found when men and women are compared (Brebner, 2003); the effect sizes found in our person-oriented analyses were large enough to presume that people with different iris configurations tend to develop along different trajectories with regard to personality (Study III). Iris data can therefore potentially be used to study dyadic relationships and gender differences in a much more specific way than currently is possible. For example, are stereotypic gender roles in dyads where men (according to their iris characteristics) are more “feeling oriented” than their spouse, less stereotypic than usually is the case? Are some constellations of iris characteristics in close/intimate relationships more frequent than would be expected if only random and environmental factors influence mate selection? Are people with some iris characteristics constellations more likely to be more deeply in love (Bartels & Zeki, 2000; Heyman et al., 1999), or more deeply attached to each other? Likewise, it would also be possible to investigate whether the difficulties that tend to surface in close relationships over time differ systematically with regard to the types of iris characteristics that are present in different dyads. As mentioned above, the genes that influence personality also affect how people cope with stressful situations (Kato & Pedersen, 2005). The extent to which people seek co-operation rather than conflict with their partner in different situations is, in adulthood, to a relatively large extent affected by the same genes that influence personality (Lensvelt Mulders & Hettema, 2001). Thus, there is no reason why it should not be possible to study such behaviors (and most dyadic relationships are personality matters) in a more specific way than is currently possible by collecting iris data. Twin-studies: The monozygotic (MZ) intra-pair twin correlations for crypt, pigment dots and furrows are .66, .58 and .79, respectively (STUDY I). Thus, given that it actually is quite common, at least in some MZ pairs, to observe intra-pair differences that are relatively large, especially in regard to crypt and pigment dot, and smaller iris differences than those that were associated with personality differences in our sample, it is quite possible that small MZ intra-pair iris differences could be associated with non-systematic non-shared environmental effects for personality, that is, random embryological events that make MZ twins less similar. In any event, since there is a quest for more theory and research in this area (Plomin et al., 2001a; Plomin & Daniels, 1987; Turkheimer & Waldron, 2000), it is worth mentioning that, by collecting iris data from MZ twins, it may be possible to learn more about how non-systematic non-shared environmental effects influence personality as well as other behaviors.
27864 Avhandling_inlaga.indd 100 1/28/08 9:20:27 AM

101
Furthermore, the heritability of some personality traits may be higher among MZ twin pairs that have been matched on their iris characteristics, compared with what is the case in unmatched populations. For example, it is quite possible that the heritability of Achievement Striving, Self-Discipline and Conscientiousness in a sub-population of MZ twins, where both twins have an open iris structure with many furrows, will be higher compared with what would be the case for those traits when all twins in the population are considered. Likewise, the heritability of Feelings, Warmth, Trust, Tender-mindedness, Values, Positive Emotions, Agreeableness and Openness for subgroups of MZ twins with a dense iris structure with few furrows may be higher than generally found when all twins in the population are analyzed. Thus, by collecting iris data on twins, it may be possible to pinpoint the aspects of an individual’s personality profile that are most strongly influenced by genetic factors. People may not find it very interesting (especially not for better understanding of their own genetic propensities) that about 40% of the personality differences observed in large populations - as an overall average for those populations - are due to genetic effects. However, if science can show us which aspects of our own personality profile that are most strongly influenced by genetic factors, it would be very surprising, considering how individualized our culture is, if that would not evoke considerably more interest. Thus, if other behaviors influenced by genes that contribute to personality are examined (see Part III on page 45 for a detailed list of such behaviors), it may be possible to discover a wide range of core traits (in different behavioral domains) that, from a genetic standpoint, are of greater importance to the individual. Research that uses iris data collected from twins and a person-oriented methodology is therefore in an excellent position to stimulate a holistic approach to personality. A holistic approach emphasizes the importance of studying more comprehensive wholes of the person-environment system as a unit, and is bound to benefit from the identification of genes or other biomarkers that can link different domains in the person-environment system together (Bergman, 2000; Bronfenbrenner & Ceci, 1994; Kendler et al., 2006; Kerr & Stattin, 2003; Magnusson, 1999; Plomin & Asbury, 2005; Rutter et al., 2006; Stattin & Magnusson, 1996). Furthermore, considering how difficult it has been to replicate candidate gene findings for personality over the last 10 years and that research, for the most part, has relied on the assumption that that there is a direct link between the expression of additive genes and behavior. This is a questionable assumption given that as much as half of the genetic effect of personality is non-additive by nature, which is bound to mask some proportion of the additive genetic impact. It is quite possible that it will be fruitful to introduce iris data and a person-oriented methodology into behavioral genetic research in the future. As we have seen, the self-organized embryological developments of the iris and the frontal lobe are systematically related to each other. The more stable genetic background present in iris-matched populations can increase power to detect
100
Likewise, as discussed in Part II, there is a whole range of measures that tap into the qualities in close/intimate relationships that are also influenced by the genes contributing to personality. Thus, it would be very interesting to investigate whether measures, such as those concerning divorce risk, marital satisfaction, adult attachment styles, different person x situation interactions, differ in a systematic manner with regard to the iris characteristics present in different dyads. People with different iris configurations differ in their emotional functioning to a much greater extent than generally is found when men and women are compared (Brebner, 2003); the effect sizes found in our person-oriented analyses were large enough to presume that people with different iris configurations tend to develop along different trajectories with regard to personality (Study III). Iris data can therefore potentially be used to study dyadic relationships and gender differences in a much more specific way than currently is possible. For example, are stereotypic gender roles in dyads where men (according to their iris characteristics) are more “feeling oriented” than their spouse, less stereotypic than usually is the case? Are some constellations of iris characteristics in close/intimate relationships more frequent than would be expected if only random and environmental factors influence mate selection? Are people with some iris characteristics constellations more likely to be more deeply in love (Bartels & Zeki, 2000; Heyman et al., 1999), or more deeply attached to each other? Likewise, it would also be possible to investigate whether the difficulties that tend to surface in close relationships over time differ systematically with regard to the types of iris characteristics that are present in different dyads. As mentioned above, the genes that influence personality also affect how people cope with stressful situations (Kato & Pedersen, 2005). The extent to which people seek co-operation rather than conflict with their partner in different situations is, in adulthood, to a relatively large extent affected by the same genes that influence personality (Lensvelt Mulders & Hettema, 2001). Thus, there is no reason why it should not be possible to study such behaviors (and most dyadic relationships are personality matters) in a more specific way than is currently possible by collecting iris data. Twin-studies: The monozygotic (MZ) intra-pair twin correlations for crypt, pigment dots and furrows are .66, .58 and .79, respectively (STUDY I). Thus, given that it actually is quite common, at least in some MZ pairs, to observe intra-pair differences that are relatively large, especially in regard to crypt and pigment dot, and smaller iris differences than those that were associated with personality differences in our sample, it is quite possible that small MZ intra-pair iris differences could be associated with non-systematic non-shared environmental effects for personality, that is, random embryological events that make MZ twins less similar. In any event, since there is a quest for more theory and research in this area (Plomin et al., 2001a; Plomin & Daniels, 1987; Turkheimer & Waldron, 2000), it is worth mentioning that, by collecting iris data from MZ twins, it may be possible to learn more about how non-systematic non-shared environmental effects influence personality as well as other behaviors.
27864 Avhandling_inlaga.indd 101 1/28/08 9:20:28 AM

103
REFERENCES
af Klinteberg B, Schalling D, Edman G, Oreland L, et al. (1987): Personality correlates
of platelet monoamine oxidase (MAO) activity in female and male subjects. Neuropsychobiology 18:89-96.
Agrawal A, Jacobson KC, Prescott CA, Kendler KS (2004): A twin study of personality and illicit drug use and abuse/dependence. Twin Res 7:72-81.
Ahern FM (1982): Family resemblances in personality. Behavior genetics 12:261-280.
Baker BS, Taylor BJ, Hall JC (2001): Are complex behaviors specified by dedicated regulatory genes? Reasoning from Drosophila. Cell 105:13-24.
Barnes MR (2006): Navigating the HapMap. Briefings in bioinformatics 7:211-224.
Bartels A, Zeki S (2000): The neural basis of romantic love. Neuroreport 11:3829-3834.
Beauchamp GR, Meisler DM (1986): An alternative hypothesis for iris maldevelopment (aniridia). J Pediatr Ophthalmol Strabismus 23:281-283.
Belli RF, Shay WL, Stafford FP (2001): Event History Calendars and Question List Surveys: A Direct Comparison of Interviewing Methods. Public Opin Q 65:45-74.
Benjamin J, Li L, Patterson C, Greenberg BD, Murphy DL, Hamer DH (1996): Population and familial association between the D4 dopamine receptor gene and measures of Novelty Seeking. Nature genetics 12:81-84.
Bergeman CS, Plomin R, McClearn GE, Pedersen NL, et al. (1988): Genotype^environment interaction in personality development: Indentical twins reared apart. Psychology and Aging 3:399-406.
Bergman LR (2000): The application of a person-oriented approach: Types and clusters. (2000) Cairns, Robert B (Ed), et al Bergman, Lars R (Ed), Developmental science and the holistic approach (pp137 154) Mahwah, NJ, US: Lawrence Erlbaum Associates, Publishers x, 484 pp.
Bergman LR, Magnusson D (1997): A person-oriented approach in research on developmental psychopathology. Development and Psychopathology 9:291-319.
Bergman LR, Magnusson D, El Khouri BM (2003): Studying individual development in an interindividual context: A person-oriented approach. Mahwah, NJ.: Lawrence Erlbaum Associates.
Bisgrove BW, Yost HJ (2001): Classification of left-right patterning defects in zebrafish, mice, and humans. American journal of medical genetics 101:315-323.
102
genes with small effects. Thus, when iris data and a person-oriented methodology are used – which can pinpoint for whom a particular gene is most important - it will be much easier to replicate candidate findings for personality.
27864 Avhandling_inlaga.indd 102 1/28/08 9:20:28 AM

103
REFERENCES
af Klinteberg B, Schalling D, Edman G, Oreland L, et al. (1987): Personality correlates
of platelet monoamine oxidase (MAO) activity in female and male subjects. Neuropsychobiology 18:89-96.
Agrawal A, Jacobson KC, Prescott CA, Kendler KS (2004): A twin study of personality and illicit drug use and abuse/dependence. Twin Res 7:72-81.
Ahern FM (1982): Family resemblances in personality. Behavior genetics 12:261-280.
Baker BS, Taylor BJ, Hall JC (2001): Are complex behaviors specified by dedicated regulatory genes? Reasoning from Drosophila. Cell 105:13-24.
Barnes MR (2006): Navigating the HapMap. Briefings in bioinformatics 7:211-224.
Bartels A, Zeki S (2000): The neural basis of romantic love. Neuroreport 11:3829-3834.
Beauchamp GR, Meisler DM (1986): An alternative hypothesis for iris maldevelopment (aniridia). J Pediatr Ophthalmol Strabismus 23:281-283.
Belli RF, Shay WL, Stafford FP (2001): Event History Calendars and Question List Surveys: A Direct Comparison of Interviewing Methods. Public Opin Q 65:45-74.
Benjamin J, Li L, Patterson C, Greenberg BD, Murphy DL, Hamer DH (1996): Population and familial association between the D4 dopamine receptor gene and measures of Novelty Seeking. Nature genetics 12:81-84.
Bergeman CS, Plomin R, McClearn GE, Pedersen NL, et al. (1988): Genotype^environment interaction in personality development: Indentical twins reared apart. Psychology and Aging 3:399-406.
Bergman LR (2000): The application of a person-oriented approach: Types and clusters. (2000) Cairns, Robert B (Ed), et al Bergman, Lars R (Ed), Developmental science and the holistic approach (pp137 154) Mahwah, NJ, US: Lawrence Erlbaum Associates, Publishers x, 484 pp.
Bergman LR, Magnusson D (1997): A person-oriented approach in research on developmental psychopathology. Development and Psychopathology 9:291-319.
Bergman LR, Magnusson D, El Khouri BM (2003): Studying individual development in an interindividual context: A person-oriented approach. Mahwah, NJ.: Lawrence Erlbaum Associates.
Bisgrove BW, Yost HJ (2001): Classification of left-right patterning defects in zebrafish, mice, and humans. American journal of medical genetics 101:315-323.
102
genes with small effects. Thus, when iris data and a person-oriented methodology are used – which can pinpoint for whom a particular gene is most important - it will be much easier to replicate candidate findings for personality.
27864 Avhandling_inlaga.indd 103 1/28/08 9:20:29 AM

105
Carey G (2003): Human genetics for the social sciences: Sage Publications.
Carver CS, Scheier MF (2002): Control processes and self-organization as complementary principles underlying behavior. Journal of Social Psychology Review 6:304-315.
Caspi A, Herbener ES (1990): Continuity and change: Assortative marriage and the consistency of personality in adulthood. Journal of Personality and Social Psychology 58:250-258.
Caspi A, McClay J, Moffitt TE, Mill J, Martin J, Craig IW, et al (2002): Role of genotype in the cycle of violence in maltreated children. Science 297:851-854.
Caspi A, Roberts BW, Shiner RL (2005): Personality development: stability and change. Annual review of psychology 56:453-484.
Caspi A, Sugden K, Moffitt TE, Taylor A, Craig IW, Harrington H, et al (2003): Influence of life stress on depression: moderation by a polymorphism in the 5-HTT gene. Science 301:386-389.
Cederlof R, Friberg L, Jonsson E, Kaij L (1961): Studies on similarity diagnosis in twins with the aid of mailed questionnaires. Acta Genet Stat Med 11:338-362.
Cheng X, Hsu CM, Currle DS, Hu JS, Barkovich AJ, Monuki ES (2006): Central roles of the roof plate in telencephalic development and holoprosencephaly. J Neurosci 26:7640-7649.
Chipuer HM, Plomin R, Pedersen NL, McClearn GE, et al. (1993): Genetic influence on family environment: The role of personality. Developmental Psychology 29:110-118.
Christ SE, White D, Brunstrom JE, Abrams RA (2003): Inhibitory control following perinatal brain injury. Neuropsychology 17:171-178.
Cloninger CR (1987): A systematic method for clinical description and classification of personality variants: A proposal. Archives of general psychiatry 44:573-588.
Cloninger CR (1994): Temperament and personality. Curr Opin Neurobiol 4:266-273.
Cloninger CR, Svrakic DM (1997): Integrative psychobiological approach to psychiatric assessment and treatment. Psychiatry: Interpersonal and Biological Processes 60:120-141.
Cloninger CR, Svrakic DM, Przybeck TR (1993): A psychobiological model of temperament and character. Archives of general psychiatry 50:975-990.
Cloninger CR, Svrakic NM, Svrakic DM (1997): Role of personality self-organization in development of mental order and disorder. Development and Psychopathology 9:881-906.
Cohen DJ, Dibble E, Grawe JM, Pollin W (1973): Separating identical from fraternal twins. Archives of general psychiatry 29:465-469.
104
Bito LZ, Matheny A, Cruickshanks KJ, Nondahl DM, Carino OB (1997): Eye color changes past early childhood. The Louisville Twin Study. Archives of ophthalmology 115:659-663.
Bobb AJ, Addington AM, Sidransky E, Gornick MC, Lerch JP, Greenstein DK, et al (2005): Support for association between ADHD and two candidate genes: NET1 and DRD1. Am J Med Genet B Neuropsychiatr Genet 134:67-72.
Boomsma DI, Beem AL, van den Berg M, Dolan CV, Koopmans JR, Vink JM, et al (2000): Netherlands twin family study of anxious depression (NETSAD). Twin Res 3:323-334.
Bornholdt S (2001): Modeling genetic networks and their evolution: a complex dynamical systems perspective. Biol Chem 382:1289-1299.
Bosma HA, Kunnen E (2002): Identity and emotion: Development through self-organization. New York: Cambridge University Press.
Botstein D, Risch N (2003): Discovering genotypes underlying human phenotypes: past successes for mendelian disease, future approaches for complex disease. Nature genetics 33 Suppl:228-237.
Brebner J (2003): Gender and emotions. Personality and Individual Differences 34:387-394.
Bronfenbrenner U, Ceci SJ (1994): Natureuture reconceptualized in developmental perspective: A bioecological model. Psychological Review 101:568-586.
Burbach JP, Smits S, Smidt MP (2003): Transcription factors in the development of midbrain dopamine neurons. Annals of the New York Academy of Sciences 991:61-68.
Burkhardt A (1992a): [The color and structure of the human iris. 1. Morphological studies]. Anthropol Anz 50:83-126.
Burkhardt A (1992b): [The color and structure of the human iris. 2. Studies of 200 twins]. Anthropol Anz 50:235-270.
Bush G, Luu P, Posner MI (2000): Cognitive and emotional influences in anterior cingulate cortex. Trends in Cognitive Sciences 4:215-222.
Busjahn A, Faulhaber HD, Freier K, Luft FC (1999): Genetic and environmental influences on coping styles: a twin study. Psychosomatic medicine 61:469-475.
Buss DM, Larsen RJ (2005): Personality Psychology: Domains of knowledge about human nature. New York: McGraw-Hill.
Butcher LM, Meaburn E, Knight J, Sham PC, Schalkwyk LC, Craig IW, et al (2005): SNPs, microarrays and pooled DNA: identification of four loci associated with mild mental impairment in a sample of 6000 children. Human molecular genetics 14:1315-1325.
27864 Avhandling_inlaga.indd 104 1/28/08 9:20:29 AM

105
Carey G (2003): Human genetics for the social sciences: Sage Publications.
Carver CS, Scheier MF (2002): Control processes and self-organization as complementary principles underlying behavior. Journal of Social Psychology Review 6:304-315.
Caspi A, Herbener ES (1990): Continuity and change: Assortative marriage and the consistency of personality in adulthood. Journal of Personality and Social Psychology 58:250-258.
Caspi A, McClay J, Moffitt TE, Mill J, Martin J, Craig IW, et al (2002): Role of genotype in the cycle of violence in maltreated children. Science 297:851-854.
Caspi A, Roberts BW, Shiner RL (2005): Personality development: stability and change. Annual review of psychology 56:453-484.
Caspi A, Sugden K, Moffitt TE, Taylor A, Craig IW, Harrington H, et al (2003): Influence of life stress on depression: moderation by a polymorphism in the 5-HTT gene. Science 301:386-389.
Cederlof R, Friberg L, Jonsson E, Kaij L (1961): Studies on similarity diagnosis in twins with the aid of mailed questionnaires. Acta Genet Stat Med 11:338-362.
Cheng X, Hsu CM, Currle DS, Hu JS, Barkovich AJ, Monuki ES (2006): Central roles of the roof plate in telencephalic development and holoprosencephaly. J Neurosci 26:7640-7649.
Chipuer HM, Plomin R, Pedersen NL, McClearn GE, et al. (1993): Genetic influence on family environment: The role of personality. Developmental Psychology 29:110-118.
Christ SE, White D, Brunstrom JE, Abrams RA (2003): Inhibitory control following perinatal brain injury. Neuropsychology 17:171-178.
Cloninger CR (1987): A systematic method for clinical description and classification of personality variants: A proposal. Archives of general psychiatry 44:573-588.
Cloninger CR (1994): Temperament and personality. Curr Opin Neurobiol 4:266-273.
Cloninger CR, Svrakic DM (1997): Integrative psychobiological approach to psychiatric assessment and treatment. Psychiatry: Interpersonal and Biological Processes 60:120-141.
Cloninger CR, Svrakic DM, Przybeck TR (1993): A psychobiological model of temperament and character. Archives of general psychiatry 50:975-990.
Cloninger CR, Svrakic NM, Svrakic DM (1997): Role of personality self-organization in development of mental order and disorder. Development and Psychopathology 9:881-906.
Cohen DJ, Dibble E, Grawe JM, Pollin W (1973): Separating identical from fraternal twins. Archives of general psychiatry 29:465-469.
104
Bito LZ, Matheny A, Cruickshanks KJ, Nondahl DM, Carino OB (1997): Eye color changes past early childhood. The Louisville Twin Study. Archives of ophthalmology 115:659-663.
Bobb AJ, Addington AM, Sidransky E, Gornick MC, Lerch JP, Greenstein DK, et al (2005): Support for association between ADHD and two candidate genes: NET1 and DRD1. Am J Med Genet B Neuropsychiatr Genet 134:67-72.
Boomsma DI, Beem AL, van den Berg M, Dolan CV, Koopmans JR, Vink JM, et al (2000): Netherlands twin family study of anxious depression (NETSAD). Twin Res 3:323-334.
Bornholdt S (2001): Modeling genetic networks and their evolution: a complex dynamical systems perspective. Biol Chem 382:1289-1299.
Bosma HA, Kunnen E (2002): Identity and emotion: Development through self-organization. New York: Cambridge University Press.
Botstein D, Risch N (2003): Discovering genotypes underlying human phenotypes: past successes for mendelian disease, future approaches for complex disease. Nature genetics 33 Suppl:228-237.
Brebner J (2003): Gender and emotions. Personality and Individual Differences 34:387-394.
Bronfenbrenner U, Ceci SJ (1994): Natureuture reconceptualized in developmental perspective: A bioecological model. Psychological Review 101:568-586.
Burbach JP, Smits S, Smidt MP (2003): Transcription factors in the development of midbrain dopamine neurons. Annals of the New York Academy of Sciences 991:61-68.
Burkhardt A (1992a): [The color and structure of the human iris. 1. Morphological studies]. Anthropol Anz 50:83-126.
Burkhardt A (1992b): [The color and structure of the human iris. 2. Studies of 200 twins]. Anthropol Anz 50:235-270.
Bush G, Luu P, Posner MI (2000): Cognitive and emotional influences in anterior cingulate cortex. Trends in Cognitive Sciences 4:215-222.
Busjahn A, Faulhaber HD, Freier K, Luft FC (1999): Genetic and environmental influences on coping styles: a twin study. Psychosomatic medicine 61:469-475.
Buss DM, Larsen RJ (2005): Personality Psychology: Domains of knowledge about human nature. New York: McGraw-Hill.
Butcher LM, Meaburn E, Knight J, Sham PC, Schalkwyk LC, Craig IW, et al (2005): SNPs, microarrays and pooled DNA: identification of four loci associated with mild mental impairment in a sample of 6000 children. Human molecular genetics 14:1315-1325.
27864 Avhandling_inlaga.indd 105 1/28/08 9:20:30 AM

107
Crawford CB, DeFries JC (1978): Factor analysis of genetic and environmental correlation matrices. Multivariate Behavioral Research Vol 13(3) Jul 1978, 297 318.
Cryan JF, Mombereau C (2004): In search of a depressed mouse: Utility of models for studying depression-related behavior in genetically modified mice. Molecular psychiatry 9:326-357.
Csikszentmihalyi M (1990): Flow: The psychology of optimal experience. New York: HarperCollins.
Csikszentmihalyi M (1993): The evolving self: A psychology for the third millennium. New York: HarperCollins.
Cubells JF, Zabetian CP (2004): Human genetics of plasma dopamine beta-hydroxylase activity: applications to research in psychiatry and neurology. Psychopharmacology (Berl) 174:463-476.
Damberg M (2005): Transcription factor AP-2 and monoaminergic functions in the central nervous system. J Neural Transm 112:1281-1296.
Damberg M, Garpenstrand H, Hallman J, Oreland L (2001): Genetic mechanisms of behavior--don't forget about the transcription factors. Molecular psychiatry 6:503-510.
Daugman J (2003): The importance of being random: Statistical principles of iris recognition. Pattern Recognition 36:279-291.
Davidson RJ (1992): Anterior cerebral asymmetry and the nature of emotion. Brain and Cognition 20:125-151.
Davidson RJ (2001): Toward a biology of personality and emotion. In: Damasio AR editor. Unity of knowledge: The convergence of natural and human science. New York, NY: New York Academy of Sciences, pp 191-207.
Davidson RJ (2003): Affective neuroscience and psychophysiology: toward a synthesis. Psychophysiology 40:655-665.
Davidson RJ, Abercrombie H, Nitschke JB, Putnam K (1999): Regional brain function, emotion and disorders of emotion. Curr Opin Neurobiol 9:228-234.
Davis-Silberman N, Kalich T, Oron-Karni V, Marquardt T, Kroeber M, Tamm ER, et al (2005): Genetic dissection of Pax6 dosage requirements in the developing mouse eye. Human molecular genetics 14:2265-2276.
De Becker I, Walter M, Noel LP (2004): Phenotypic variations in patients with a 1630 A>T point mutation in the PAX6 gene. Can J Ophthalmol 39:272-278.
Denney RM, Denney CB (1985): An update on the identity crisis of monoamine oxidase: new and old evidence for the independence of MAO A and B. Pharmacol Ther 30:227-258.
106
Cohen J (1988): Statistical power analysis for the behavioral sciences, 2 ed. Hillsdale, NJ: Lawrence Earlbaum Associates.
Comings DE (1998a): Polygenic inheritance and micro/minisatellites. Molecular psychiatry 3:21-31.
Comings DE (1998b): Why different rules are required for polygenic inheritance: lessons from studies of the DRD2 gene. Alcohol 16:61-70.
Comings DE, Blum K (2000): Reward deficiency syndrome: genetic aspects of behavioral disorders. Prog Brain Res 126:325-341.
Comings DE, Gade-Andavolu R, Gonzalez N, Blake H, Wu S, MacMurray JP (1999): Additive effect of three noradrenergic genes (ADRA2a, ADRA2C, DBH) on attention-deficit hyperactivity disorder and learning disabilities in Tourette syndrome subjects. Clin Genet 55:160-172.
Comings DE, Gade-Andavolu R, Gonzalez N, Wu S, Muhleman D, Blake H, et al (2000a): A multivariate analysis of 59 candidate genes in personality traits: the temperament and character inventory. Clin Genet 58:375-385.
Comings DE, Gonzales N, Saucier G, Johnson JP, MacMurray JP (2000b): The DRD4 gene and the spiritual transcendence scale of the character temperament index. Psychiatric Genetics 10:185-189.
Cook-Greuter SR (2000): Mature ego development: A gateway to ego transcendence? Journal of Adult Development 7:227-240.
Coolidge FL, Thede LL, Jang KL (2004): Are personality disorders psychological manifestations of executive function deficits? Bivariate heritability evidence from a twin study. Behavior genetics 34:75-84.
Cordell HJ (2002): Epistasis: what it means, what it doesn't mean, and statistical methods to detect it in humans. Human molecular genetics 11:2463-2468.
Costa PT, McCrae RR (1985): Revised NEO Personality Inventory (NEO PI-R) and NEO Five-Factor Inventory (NEO-FFI) Professional manual. 2003: Odessa, FL: Psychological Assessment Resources. Stockholm, Sweden: Psykologiförlaget AB, Svensk version: NEO PI-R
Costa PT, McCrae RR (1995): Solid ground in the wetlands of personality: A reply to Block. Psychological Bulletin 117:216-220.
Costa PT, McCrea RR (1992): Neo Personality Inventory Revised. Lutz, Florida 33549: Psychological Assessment Resources, Inc., 16204 North Florida Avenue.
Craig I, Plomin R (2006): Quantitative trait loci for IQ and other complex traits: single-nucleotide polymorphism genotyping using pooled DNA and microarrays. Genes Brain Behav 5 Suppl 1:32-37.
27864 Avhandling_inlaga.indd 106 1/28/08 9:20:30 AM

107
Crawford CB, DeFries JC (1978): Factor analysis of genetic and environmental correlation matrices. Multivariate Behavioral Research Vol 13(3) Jul 1978, 297 318.
Cryan JF, Mombereau C (2004): In search of a depressed mouse: Utility of models for studying depression-related behavior in genetically modified mice. Molecular psychiatry 9:326-357.
Csikszentmihalyi M (1990): Flow: The psychology of optimal experience. New York: HarperCollins.
Csikszentmihalyi M (1993): The evolving self: A psychology for the third millennium. New York: HarperCollins.
Cubells JF, Zabetian CP (2004): Human genetics of plasma dopamine beta-hydroxylase activity: applications to research in psychiatry and neurology. Psychopharmacology (Berl) 174:463-476.
Damberg M (2005): Transcription factor AP-2 and monoaminergic functions in the central nervous system. J Neural Transm 112:1281-1296.
Damberg M, Garpenstrand H, Hallman J, Oreland L (2001): Genetic mechanisms of behavior--don't forget about the transcription factors. Molecular psychiatry 6:503-510.
Daugman J (2003): The importance of being random: Statistical principles of iris recognition. Pattern Recognition 36:279-291.
Davidson RJ (1992): Anterior cerebral asymmetry and the nature of emotion. Brain and Cognition 20:125-151.
Davidson RJ (2001): Toward a biology of personality and emotion. In: Damasio AR editor. Unity of knowledge: The convergence of natural and human science. New York, NY: New York Academy of Sciences, pp 191-207.
Davidson RJ (2003): Affective neuroscience and psychophysiology: toward a synthesis. Psychophysiology 40:655-665.
Davidson RJ, Abercrombie H, Nitschke JB, Putnam K (1999): Regional brain function, emotion and disorders of emotion. Curr Opin Neurobiol 9:228-234.
Davis-Silberman N, Kalich T, Oron-Karni V, Marquardt T, Kroeber M, Tamm ER, et al (2005): Genetic dissection of Pax6 dosage requirements in the developing mouse eye. Human molecular genetics 14:2265-2276.
De Becker I, Walter M, Noel LP (2004): Phenotypic variations in patients with a 1630 A>T point mutation in the PAX6 gene. Can J Ophthalmol 39:272-278.
Denney RM, Denney CB (1985): An update on the identity crisis of monoamine oxidase: new and old evidence for the independence of MAO A and B. Pharmacol Ther 30:227-258.
106
Cohen J (1988): Statistical power analysis for the behavioral sciences, 2 ed. Hillsdale, NJ: Lawrence Earlbaum Associates.
Comings DE (1998a): Polygenic inheritance and micro/minisatellites. Molecular psychiatry 3:21-31.
Comings DE (1998b): Why different rules are required for polygenic inheritance: lessons from studies of the DRD2 gene. Alcohol 16:61-70.
Comings DE, Blum K (2000): Reward deficiency syndrome: genetic aspects of behavioral disorders. Prog Brain Res 126:325-341.
Comings DE, Gade-Andavolu R, Gonzalez N, Blake H, Wu S, MacMurray JP (1999): Additive effect of three noradrenergic genes (ADRA2a, ADRA2C, DBH) on attention-deficit hyperactivity disorder and learning disabilities in Tourette syndrome subjects. Clin Genet 55:160-172.
Comings DE, Gade-Andavolu R, Gonzalez N, Wu S, Muhleman D, Blake H, et al (2000a): A multivariate analysis of 59 candidate genes in personality traits: the temperament and character inventory. Clin Genet 58:375-385.
Comings DE, Gonzales N, Saucier G, Johnson JP, MacMurray JP (2000b): The DRD4 gene and the spiritual transcendence scale of the character temperament index. Psychiatric Genetics 10:185-189.
Cook-Greuter SR (2000): Mature ego development: A gateway to ego transcendence? Journal of Adult Development 7:227-240.
Coolidge FL, Thede LL, Jang KL (2004): Are personality disorders psychological manifestations of executive function deficits? Bivariate heritability evidence from a twin study. Behavior genetics 34:75-84.
Cordell HJ (2002): Epistasis: what it means, what it doesn't mean, and statistical methods to detect it in humans. Human molecular genetics 11:2463-2468.
Costa PT, McCrae RR (1985): Revised NEO Personality Inventory (NEO PI-R) and NEO Five-Factor Inventory (NEO-FFI) Professional manual. 2003: Odessa, FL: Psychological Assessment Resources. Stockholm, Sweden: Psykologiförlaget AB, Svensk version: NEO PI-R
Costa PT, McCrae RR (1995): Solid ground in the wetlands of personality: A reply to Block. Psychological Bulletin 117:216-220.
Costa PT, McCrea RR (1992): Neo Personality Inventory Revised. Lutz, Florida 33549: Psychological Assessment Resources, Inc., 16204 North Florida Avenue.
Craig I, Plomin R (2006): Quantitative trait loci for IQ and other complex traits: single-nucleotide polymorphism genotyping using pooled DNA and microarrays. Genes Brain Behav 5 Suppl 1:32-37.
27864 Avhandling_inlaga.indd 107 1/28/08 9:20:31 AM
109
Ellison-Wright Z, Heyman I, Frampton I, Rubia K, Chitnis X, Ellison-Wright I, et al (2004): Heterozygous PAX6 mutation, adult brain structure and fronto-striato-thalamic function in a human family. Eur J Neurosci 19:1505-1512.
Enoch MA, Xu K, Ferro E, Harris CR, Goldman D (2003): Genetic origins of anxiety in women: a role for a functional catechol-O-methyltransferase polymorphism. Psychiatr Genet 13:33-41.
Eysenck HJ (1967): The biological basis of personality. Thomas: Spring-field, Ill.
Eysenck HJ, Eysenck MW (1985): Personality and individual differences: A natural science approach. New York: Plenum Press.
Fanous AH, Kendler KS (2005): Genetic heterogeneity, modifier genes, and quantitative phenotypes in psychiatric illness: searching for a framework. Molecular psychiatry 10:6-13.
Farrer LA, Cupples LA, Haines JL, Hyman B, Kukull WA, Mayeux R, et al (1997): Effects of age, sex, and ethnicity on the association between apolipoprotein E genotype and Alzheimer disease. A meta-analysis. APOE and Alzheimer Disease Meta Analysis Consortium. Jama 278:1349-1356.
Fisher SE (2006): Tangled webs: Tracing the connections between genes and cognition. Cognition.
Flint J (2003): Analysis of quantitative trait loci that influence animal behavior. J Neurobiol 54:46-77.
Flint J, Valdar W, Shifman S, Mott R (2005): Strategies for mapping and cloning quantitative trait genes in rodents. Nature reviews 6:271-286.
Foley DL, Eaves LJ, Wormley B, Silberg JL, Maes HH, Kuhn J, et al (2004): Childhood adversity, monoamine oxidase a genotype, and risk for conduct disorder. Archives of general psychiatry 61:738-744.
Ford D, Easton DF, Bishop DT, Narod SA, Goldgar DE (1994): Risks of cancer in BRCA1-mutation carriers. Breast Cancer Linkage Consortium. Lancet 343:692-695.
Forrester JV, Dick AD, McMenamin PG, Lee WR (2002): The Eye: W B Saunders Co.
Fox J, Gelb AW, Enns J, Murkin JM, Farrar JK, Manninen PH (1992): The responsiveness of cerebral blood flow to changes in arterial carbon dioxide is maintained during propofol-nitrous oxide anesthesia in humans. Anesthesiology 77:453-456.
Fox NA (1991): If it's not left, it's right. Electroencephalograph asymmetry and the development of emotion. The American psychologist 46:863-872.
Fox NA, Carlkins SD (1993): Multiple-measure approaches to the study of infant emotion. In: Lewis M, Haviland JM editors. Handbook of emotions. New York: Guilford, pp 167-185.
108
Devinsky O, Morrell MJ, Vogt BA (1995): Contributions of anterior cingulate cortex to behaviour. Brain 118 ( Pt 1):279-306.
Di Chiara G, Bassareo V, Fenu S, De Luca MA, Spina L, Cadoni C, et al (2004): Dopamine and drug addiction: the nucleus accumbens shell connection. Neuropharmacology 47 Suppl 1:227-241.
Docherty SJ, Butcher LM, Schalkwyk LC, Plomin R (2007): Applicability of DNA pools on 500 K SNP microarrays for cost-effective initial screens in genomewide association studies. BMC genomics 8:214.
Dunn J, Plomin R (1990): Separate lives: Why siblings are so different. New York, NY: Basic Books, Inc.
Dunne MP, Martin NG, Statham DJ, Pangan T, Madden PA, Heath AC (1997): The consistency of recalled age at first sexual intercourse. Journal of biosocial science 29:1-7.
Easton D, Ford D, Peto J (1993): Inherited susceptibility to breast cancer. Cancer Surv 18:95-113.
Eaves L, Eysenck H (1976): Genotype * Age interaction for neuroticism. Behavior genetics 6:359-362.
Eaves L, Heath A, Martin N, Maes H, Neale M, Kendler K, et al (1999): Comparing the biological and cultural inheritance of personality and social attitudes in the Virginia 30,000 study of twins and their relatives. Twin Res 2:62-80.
Eaves LJ, Heath AC, Neale MC, Hewitt JK, Martin NG (1998): Sex differences and non-additivity in the effects of genes on personality. Twin Res 1:131-137.
Ebstein RP (2006): The molecular genetic architecture of human personality: beyond self-report questionnaires. Molecular psychiatry 11:427-445.
Ebstein RP, Novick O, Umansky R, Priel B, Osher Y, Blaine D, et al (1996): Dopamine D4 receptor (D4DR) exon III polymorphism associated with the human personality trait of Novelty Seeking. Nature genetics 12:78-80.
Edelman GM (1993): Neural Darwinism: selection and reentrant signaling in higher brain function. Neuron 10:115-125.
Eisenberger NI, Lieberman MD (2004): Why rejection hurts: a common neural alarm system for physical and social pain. Trends in Cognitive Sciences 8:294-300.
Elder GH, Caspi A, Downey G (1986): Problem behavior and family relationships: Life course and intergenerational themes In: Sorensen A, Weinert F, Sherrrod L editors. Human development: Interdiciplinary perspectives: Hillsdale, NJ: Lawrence Erlbaum Associates, pp 293-340.
27864 Avhandling_inlaga.indd 108 1/28/08 9:20:31 AM

109
Ellison-Wright Z, Heyman I, Frampton I, Rubia K, Chitnis X, Ellison-Wright I, et al (2004): Heterozygous PAX6 mutation, adult brain structure and fronto-striato-thalamic function in a human family. Eur J Neurosci 19:1505-1512.
Enoch MA, Xu K, Ferro E, Harris CR, Goldman D (2003): Genetic origins of anxiety in women: a role for a functional catechol-O-methyltransferase polymorphism. Psychiatr Genet 13:33-41.
Eysenck HJ (1967): The biological basis of personality. Thomas: Spring-field, Ill.
Eysenck HJ, Eysenck MW (1985): Personality and individual differences: A natural science approach. New York: Plenum Press.
Fanous AH, Kendler KS (2005): Genetic heterogeneity, modifier genes, and quantitative phenotypes in psychiatric illness: searching for a framework. Molecular psychiatry 10:6-13.
Farrer LA, Cupples LA, Haines JL, Hyman B, Kukull WA, Mayeux R, et al (1997): Effects of age, sex, and ethnicity on the association between apolipoprotein E genotype and Alzheimer disease. A meta-analysis. APOE and Alzheimer Disease Meta Analysis Consortium. Jama 278:1349-1356.
Fisher SE (2006): Tangled webs: Tracing the connections between genes and cognition. Cognition.
Flint J (2003): Analysis of quantitative trait loci that influence animal behavior. J Neurobiol 54:46-77.
Flint J, Valdar W, Shifman S, Mott R (2005): Strategies for mapping and cloning quantitative trait genes in rodents. Nature reviews 6:271-286.
Foley DL, Eaves LJ, Wormley B, Silberg JL, Maes HH, Kuhn J, et al (2004): Childhood adversity, monoamine oxidase a genotype, and risk for conduct disorder. Archives of general psychiatry 61:738-744.
Ford D, Easton DF, Bishop DT, Narod SA, Goldgar DE (1994): Risks of cancer in BRCA1-mutation carriers. Breast Cancer Linkage Consortium. Lancet 343:692-695.
Forrester JV, Dick AD, McMenamin PG, Lee WR (2002): The Eye: W B Saunders Co.
Fox J, Gelb AW, Enns J, Murkin JM, Farrar JK, Manninen PH (1992): The responsiveness of cerebral blood flow to changes in arterial carbon dioxide is maintained during propofol-nitrous oxide anesthesia in humans. Anesthesiology 77:453-456.
Fox NA (1991): If it's not left, it's right. Electroencephalograph asymmetry and the development of emotion. The American psychologist 46:863-872.
Fox NA, Carlkins SD (1993): Multiple-measure approaches to the study of infant emotion. In: Lewis M, Haviland JM editors. Handbook of emotions. New York: Guilford, pp 167-185.
108
Devinsky O, Morrell MJ, Vogt BA (1995): Contributions of anterior cingulate cortex to behaviour. Brain 118 ( Pt 1):279-306.
Di Chiara G, Bassareo V, Fenu S, De Luca MA, Spina L, Cadoni C, et al (2004): Dopamine and drug addiction: the nucleus accumbens shell connection. Neuropharmacology 47 Suppl 1:227-241.
Docherty SJ, Butcher LM, Schalkwyk LC, Plomin R (2007): Applicability of DNA pools on 500 K SNP microarrays for cost-effective initial screens in genomewide association studies. BMC genomics 8:214.
Dunn J, Plomin R (1990): Separate lives: Why siblings are so different. New York, NY: Basic Books, Inc.
Dunne MP, Martin NG, Statham DJ, Pangan T, Madden PA, Heath AC (1997): The consistency of recalled age at first sexual intercourse. Journal of biosocial science 29:1-7.
Easton D, Ford D, Peto J (1993): Inherited susceptibility to breast cancer. Cancer Surv 18:95-113.
Eaves L, Eysenck H (1976): Genotype * Age interaction for neuroticism. Behavior genetics 6:359-362.
Eaves L, Heath A, Martin N, Maes H, Neale M, Kendler K, et al (1999): Comparing the biological and cultural inheritance of personality and social attitudes in the Virginia 30,000 study of twins and their relatives. Twin Res 2:62-80.
Eaves LJ, Heath AC, Neale MC, Hewitt JK, Martin NG (1998): Sex differences and non-additivity in the effects of genes on personality. Twin Res 1:131-137.
Ebstein RP (2006): The molecular genetic architecture of human personality: beyond self-report questionnaires. Molecular psychiatry 11:427-445.
Ebstein RP, Novick O, Umansky R, Priel B, Osher Y, Blaine D, et al (1996): Dopamine D4 receptor (D4DR) exon III polymorphism associated with the human personality trait of Novelty Seeking. Nature genetics 12:78-80.
Edelman GM (1993): Neural Darwinism: selection and reentrant signaling in higher brain function. Neuron 10:115-125.
Eisenberger NI, Lieberman MD (2004): Why rejection hurts: a common neural alarm system for physical and social pain. Trends in Cognitive Sciences 8:294-300.
Elder GH, Caspi A, Downey G (1986): Problem behavior and family relationships: Life course and intergenerational themes In: Sorensen A, Weinert F, Sherrrod L editors. Human development: Interdiciplinary perspectives: Hillsdale, NJ: Lawrence Erlbaum Associates, pp 293-340.
27864 Avhandling_inlaga.indd 109 1/28/08 9:20:32 AM

111
Grinchuk O, Kozmik Z, Wu X, Tomarev S (2005): The Optimedin gene is a downstream target of Pax6. J Biol Chem 280:35228-35237.
Gutierrez B, Bertranpetit J, Guillamat R, Valles V, Arranz MJ, Kerwin R, et al (1997): Association analysis of the catechol O-methyltransferase gene and bipolar affective disorder. The American journal of psychiatry 154:113-115.
Haberstick BC, Lessem JM, Hopfer CJ, Smolen A, Ehringer MA, Timberlake D, et al (2005): Monoamine oxidase A (MAOA) and antisocial behaviors in the presence of childhood and adolescent maltreatment. Am J Med Genet B Neuropsychiatr Genet 135:59-64.
Hamer D (1997): Adventures of a molecular biologist. Currentdirections in psychological science 6:111-114.
Hamer D (2002): Genetics. Rethinking behavior genetics. Science 298:71-72.
Hamer DH, Greenberg BD, Sabol SZ, Murphy DL (1999): Role of the serotonin transporter gene in temperament and character. Journal of Personality Disorders 13:312-328.
Harper L (2005): Epigenetic Inheritance and the Intergenerational Transfer of Experience. Psychological Bulletin 131:340-360.
Harris JA (1998): The narture assumption: Why chlidren turn out the way they do: London: Bloomsbury.
Harris JR (2000): Socialization, personality development, and the child's environments: Comment on Vandell (2000). Developmental Psychology 36:711-723.
Hart D, Eisenberg N, Valiente C (2007): Personality change at the intersection of autonomic arousal and stress. Psychological Science 18:492-497.
Heath AC, Eaves LJ, Kirk KM, Martin NG (1998): Effects of lifestyle, personality, symptoms of anxiety and depression, and genetic predisposition on subjective sleep disturbance and sleep pattern. Twin Res 1:176-188.
Heins N, Malatesta P, Cecconi F, Nakafuku M, Tucker KL, Hack MA, et al (2002): Glial cells generate neurons: the role of the transcription factor Pax6. Nat Neurosci 5:308-315.
Henderson AS, Korten AE, Jorm AF, Jacomb PA, Christensen H, Rodgers B, et al (2000): COMT and DRD3 polymorphisms, environmental exposures, and personality traits related to common mental disorders. American journal of medical genetics 96:102-107.
Hershberger SL, Lichtenstein P, Knox SS (1994): Genetic and environmental influences on perceptions of organizational climate. Journal of Applied Psychology 79:24-33.
110
Fox NA, Davidson RJ (1987): Electroencephalogram asymmetry in response to the approach of a stranger and maternal separation in 10-month-old infants. Developmental Psychology 23:233-240.
Frankel WN, Schork NJ (1996): Who's afraid of epistasis? Nature genetics 14:371-373.
Gabel S, Stadler J, Bjorn J, Shindledecker R (1995): Homovanillic acid and dopamine-beta-hydroxylase in male youth: relationships with paternal substance abuse and antisocial behavior. Am J Drug Alcohol Abuse 21:363-378.
Gade R, Muhleman D, Blake H, MacMurray J, Johnson P, Verde R, et al (1998): Correlation of length of VNTR alleles at the X-linked MAOA gene and phenotypic effect in Tourette syndrome and drug abuse. Molecular psychiatry 3:50-60.
Galvin M, Ten Eyck R, Shekhar A, Stilwell B, Fineberg N, Laite G, et al (1995): Serum dopamine beta hydroxylase and maltreatment in psychiatrically hospitalized boys. Child Abuse Negl 19:821-832.
Ge X, Best KM, Conger RD, Simons RL (1996): Parenting behaviors and the occurrence and co-occurrence of adolescent depressive symptoms and conduct problems. Developmental Psychology 32:717-731.
Gogos JA, Morgan M, Luine V, Santha M, Ogawa S, Pfaff D, et al (1998): Catechol-O-methyltransferase-deficient mice exhibit sexually dimorphic changes in catecholamine levels and behavior. Proceedings of the National Academy of Sciences of the United States of America 95:9991-9996.
Gottesman, II, Gould TD (2003): The endophenotype concept in psychiatry: etymology and strategic intentions. The American journal of psychiatry 160:636-645.
Gottlieb G (2003): On making behavioral genetics truly developmental. Human Development 46:337-355.
Graeff FG, Guimaraes FS, De Andrade TG, Deakin JF (1996): Role of 5-HT in stress, anxiety, and depression. Pharmacol Biochem Behav 54:129-141.
Gray JA (1972): The psychology of fear and stress. New York: McGraw-Hill.
Gray JA (1975): Elements of a two-process theory of learning. New York: Academic Press.
Gray JA (1990): Brain systems that mediate both emotion and cognition. Cognition and Emotion 4:269-288.
Gray JR (2002): Does a prosocial-selfish distinction help explain the biological affects? Comment on Buck (1999). Psychological Review 109:729-738.
27864 Avhandling_inlaga.indd 110 1/28/08 9:20:32 AM

111
Grinchuk O, Kozmik Z, Wu X, Tomarev S (2005): The Optimedin gene is a downstream target of Pax6. J Biol Chem 280:35228-35237.
Gutierrez B, Bertranpetit J, Guillamat R, Valles V, Arranz MJ, Kerwin R, et al (1997): Association analysis of the catechol O-methyltransferase gene and bipolar affective disorder. The American journal of psychiatry 154:113-115.
Haberstick BC, Lessem JM, Hopfer CJ, Smolen A, Ehringer MA, Timberlake D, et al (2005): Monoamine oxidase A (MAOA) and antisocial behaviors in the presence of childhood and adolescent maltreatment. Am J Med Genet B Neuropsychiatr Genet 135:59-64.
Hamer D (1997): Adventures of a molecular biologist. Currentdirections in psychological science 6:111-114.
Hamer D (2002): Genetics. Rethinking behavior genetics. Science 298:71-72.
Hamer DH, Greenberg BD, Sabol SZ, Murphy DL (1999): Role of the serotonin transporter gene in temperament and character. Journal of Personality Disorders 13:312-328.
Harper L (2005): Epigenetic Inheritance and the Intergenerational Transfer of Experience. Psychological Bulletin 131:340-360.
Harris JA (1998): The narture assumption: Why chlidren turn out the way they do: London: Bloomsbury.
Harris JR (2000): Socialization, personality development, and the child's environments: Comment on Vandell (2000). Developmental Psychology 36:711-723.
Hart D, Eisenberg N, Valiente C (2007): Personality change at the intersection of autonomic arousal and stress. Psychological Science 18:492-497.
Heath AC, Eaves LJ, Kirk KM, Martin NG (1998): Effects of lifestyle, personality, symptoms of anxiety and depression, and genetic predisposition on subjective sleep disturbance and sleep pattern. Twin Res 1:176-188.
Heins N, Malatesta P, Cecconi F, Nakafuku M, Tucker KL, Hack MA, et al (2002): Glial cells generate neurons: the role of the transcription factor Pax6. Nat Neurosci 5:308-315.
Henderson AS, Korten AE, Jorm AF, Jacomb PA, Christensen H, Rodgers B, et al (2000): COMT and DRD3 polymorphisms, environmental exposures, and personality traits related to common mental disorders. American journal of medical genetics 96:102-107.
Hershberger SL, Lichtenstein P, Knox SS (1994): Genetic and environmental influences on perceptions of organizational climate. Journal of Applied Psychology 79:24-33.
110
Fox NA, Davidson RJ (1987): Electroencephalogram asymmetry in response to the approach of a stranger and maternal separation in 10-month-old infants. Developmental Psychology 23:233-240.
Frankel WN, Schork NJ (1996): Who's afraid of epistasis? Nature genetics 14:371-373.
Gabel S, Stadler J, Bjorn J, Shindledecker R (1995): Homovanillic acid and dopamine-beta-hydroxylase in male youth: relationships with paternal substance abuse and antisocial behavior. Am J Drug Alcohol Abuse 21:363-378.
Gade R, Muhleman D, Blake H, MacMurray J, Johnson P, Verde R, et al (1998): Correlation of length of VNTR alleles at the X-linked MAOA gene and phenotypic effect in Tourette syndrome and drug abuse. Molecular psychiatry 3:50-60.
Galvin M, Ten Eyck R, Shekhar A, Stilwell B, Fineberg N, Laite G, et al (1995): Serum dopamine beta hydroxylase and maltreatment in psychiatrically hospitalized boys. Child Abuse Negl 19:821-832.
Ge X, Best KM, Conger RD, Simons RL (1996): Parenting behaviors and the occurrence and co-occurrence of adolescent depressive symptoms and conduct problems. Developmental Psychology 32:717-731.
Gogos JA, Morgan M, Luine V, Santha M, Ogawa S, Pfaff D, et al (1998): Catechol-O-methyltransferase-deficient mice exhibit sexually dimorphic changes in catecholamine levels and behavior. Proceedings of the National Academy of Sciences of the United States of America 95:9991-9996.
Gottesman, II, Gould TD (2003): The endophenotype concept in psychiatry: etymology and strategic intentions. The American journal of psychiatry 160:636-645.
Gottlieb G (2003): On making behavioral genetics truly developmental. Human Development 46:337-355.
Graeff FG, Guimaraes FS, De Andrade TG, Deakin JF (1996): Role of 5-HT in stress, anxiety, and depression. Pharmacol Biochem Behav 54:129-141.
Gray JA (1972): The psychology of fear and stress. New York: McGraw-Hill.
Gray JA (1975): Elements of a two-process theory of learning. New York: Academic Press.
Gray JA (1990): Brain systems that mediate both emotion and cognition. Cognition and Emotion 4:269-288.
Gray JR (2002): Does a prosocial-selfish distinction help explain the biological affects? Comment on Buck (1999). Psychological Review 109:729-738.
27864 Avhandling_inlaga.indd 111 1/28/08 9:20:33 AM

113
Izpisua-Belmonte JC, Duboule D (1992): Homeobox genes and pattern formation in the vertebrate limb. Dev Biol 152:26-36.
Jang KL, Livesley WJ (1999): Why do measures of normal and disordered personality correlate? A study of genetic comorbidity. J Personal Disord 13:10-17.
Jang KL, Stein MB, Taylor S, Asmundson GJ, Livesley WJ (2003): Exposure to traumatic events and experiences: aetiological relationships with personality function. Psychiatry Res 120:61-69.
Jensen AM (2005): Potential roles for BMP and Pax genes in the development of iris smooth muscle. Dev Dyn 232:385-392.
Jockin V, McGue M, Lykken DT (1996): Personality and divorce: a genetic analysis. J Pers Soc Psychol 71:288-299.
Johnson AM, Vernon PA, Harris JA, Jang KL (2004): A behavior genetic investigation of the relationship between leadership and personality. Twin Res 7:27-32.
Johnson RC, et al. (1976): Assortative marriage for specific cognitive abilities in two ethnic groups. Human Biology 48:343-352.
Johnston MC, Noden DM, Hazelton RD, Coulombre JL, Coulombre AJ (1979): Origins of avian ocular and periocular tissues. Exp Eye Res 29:27-43.
Jones HE (1955): Perceived differences among twins. Eugen Quart:98-102.
Joseph J (2002): Twin studies in psychiatry and psychology: science or pseudoscience? Psychiatr Q 73:71-82.
Jung RE, Haier RJ (2007): The Parieto-Frontal Integration Theory (P-FIT) of intelligence: Converging neuroimaging evidence. The Behavioral and brain sciences 30:135-154.
Kagan J, Snidman N, Arcus D, Reznick JS (1994): Galen's prophecy: Temperament in human nature.
Kato K, Pedersen NL (2005): Personality and coping: a study of twins reared apart and twins reared together. Behavior genetics 35:147-158.
Kawakami A, Kimura-Kawakami M, Nomura T, Fujisawa H (1997): Distributions of PAX6 and PAX7 proteins suggest their involvement in both early and late phases of chick brain development. Mech Dev 66:119-130.
Keller MC, Coventry WL, Heath AC, Martin NG (2005): Widespread Evidence for Non-Additive Genetic Variation in Cloninger's and Eysenck's Personality Dimensions using a Twin Plus Sibling Design. Behavior genetics 35:707-721.
Kelly EL, Conley JJ (1987): Personality and compatibility: a prospective analysis of marital stability and marital satisfaction. J Pers Soc Psychol 52:27-40.
112
Hershey CL, Fisher DE (2004): Mitf and Tfe3: members of a b-HLH-ZIP transcription factor family essential for osteoclast development and function. Bone 34:689-696.
Hetherington E, Clingempeel W (1992): Coping with marital transitions: A family systems perspective. Monographs of the Society for Research in Child Development 57 (2-3) [Serial No 227]:1-242.
Hettema JM, Prescott CA, Kendler KS (2004): Genetic and environmental sources of covariation between generalized anxiety disorder and neuroticism. The American journal of psychiatry 161:1581-1587.
Heyman I, Frampton I, van Heyningen V, Hanson I, Teague P, Taylor A, et al (1999): Psychiatric disorder and cognitive function in a family with an inherited novel mutation of the developmental control gene PAX6. Psychiatr Genet 9:85-90.
Hirschhorn JN, Daly MJ (2005): Genome-wide association studies for common diseases and complex traits. Nature reviews 6:95-108.
Hjalt TA, Semina EV (2005): Current molecular understanding of Axenfeld-Rieger syndrome. Expert Rev Mol Med 7:1-17.
Holmes A, Hariri AR (2003): The serotonin transporter gene-linked polymorphism and negative emotionality: placing single gene effects in the context of genetic background and environment. Genes Brain Behav 2:332-335.
Holmes A, Lit Q, Murphy DL, Gold E, Crawley JN (2003): Abnormal anxiety-related behavior in serotonin transporter null mutant mice: the influence of genetic background. Genes Brain Behav 2:365-380.
Hood L, Galas D (2003): The digital code of DNA. Nature 421:444-448.
Howard MO, Cowley DS, Roy-Byrne PP, Hopfenbeck JR (1996): Tridimensional personality traits in sons of alcoholic and nonalcoholic fathers. Alcohol Clin Exp Res 20:445-448.
Hsieh YW, Zhang XM, Lin E, Oliver G, Yang XJ (2002): The homeobox gene Six3 is a potential regulator of anterior segment formation in the chick eye. Dev Biol 248:265-280.
Huizinga D, Haberstick BC, Smolen A, Menard S, Young SE, Corley RP, et al (2006): Childhood Maltreatment, Subsequent Antisocial Behavior, and the Role of Monoamine Oxidase A Genotype. Biological Psychiatry 60:677-683.
Ilies R, Judge TA (2003): On the heritability of job satisfaction: The mediating role of personality. Journal of Applied Psychology 88:750-759.
Ishibashi M, Saitsu H, Komada M, Shiota K (2005): Signaling cascade coordinating growth of dorsal and ventral tissues of the vertebrate brain, with special reference to the involvement of Sonic Hedgehog signaling. Anat Sci Int 80:30-36.
27864 Avhandling_inlaga.indd 112 1/28/08 9:20:33 AM

113
Izpisua-Belmonte JC, Duboule D (1992): Homeobox genes and pattern formation in the vertebrate limb. Dev Biol 152:26-36.
Jang KL, Livesley WJ (1999): Why do measures of normal and disordered personality correlate? A study of genetic comorbidity. J Personal Disord 13:10-17.
Jang KL, Stein MB, Taylor S, Asmundson GJ, Livesley WJ (2003): Exposure to traumatic events and experiences: aetiological relationships with personality function. Psychiatry Res 120:61-69.
Jensen AM (2005): Potential roles for BMP and Pax genes in the development of iris smooth muscle. Dev Dyn 232:385-392.
Jockin V, McGue M, Lykken DT (1996): Personality and divorce: a genetic analysis. J Pers Soc Psychol 71:288-299.
Johnson AM, Vernon PA, Harris JA, Jang KL (2004): A behavior genetic investigation of the relationship between leadership and personality. Twin Res 7:27-32.
Johnson RC, et al. (1976): Assortative marriage for specific cognitive abilities in two ethnic groups. Human Biology 48:343-352.
Johnston MC, Noden DM, Hazelton RD, Coulombre JL, Coulombre AJ (1979): Origins of avian ocular and periocular tissues. Exp Eye Res 29:27-43.
Jones HE (1955): Perceived differences among twins. Eugen Quart:98-102.
Joseph J (2002): Twin studies in psychiatry and psychology: science or pseudoscience? Psychiatr Q 73:71-82.
Jung RE, Haier RJ (2007): The Parieto-Frontal Integration Theory (P-FIT) of intelligence: Converging neuroimaging evidence. The Behavioral and brain sciences 30:135-154.
Kagan J, Snidman N, Arcus D, Reznick JS (1994): Galen's prophecy: Temperament in human nature.
Kato K, Pedersen NL (2005): Personality and coping: a study of twins reared apart and twins reared together. Behavior genetics 35:147-158.
Kawakami A, Kimura-Kawakami M, Nomura T, Fujisawa H (1997): Distributions of PAX6 and PAX7 proteins suggest their involvement in both early and late phases of chick brain development. Mech Dev 66:119-130.
Keller MC, Coventry WL, Heath AC, Martin NG (2005): Widespread Evidence for Non-Additive Genetic Variation in Cloninger's and Eysenck's Personality Dimensions using a Twin Plus Sibling Design. Behavior genetics 35:707-721.
Kelly EL, Conley JJ (1987): Personality and compatibility: a prospective analysis of marital stability and marital satisfaction. J Pers Soc Psychol 52:27-40.
112
Hershey CL, Fisher DE (2004): Mitf and Tfe3: members of a b-HLH-ZIP transcription factor family essential for osteoclast development and function. Bone 34:689-696.
Hetherington E, Clingempeel W (1992): Coping with marital transitions: A family systems perspective. Monographs of the Society for Research in Child Development 57 (2-3) [Serial No 227]:1-242.
Hettema JM, Prescott CA, Kendler KS (2004): Genetic and environmental sources of covariation between generalized anxiety disorder and neuroticism. The American journal of psychiatry 161:1581-1587.
Heyman I, Frampton I, van Heyningen V, Hanson I, Teague P, Taylor A, et al (1999): Psychiatric disorder and cognitive function in a family with an inherited novel mutation of the developmental control gene PAX6. Psychiatr Genet 9:85-90.
Hirschhorn JN, Daly MJ (2005): Genome-wide association studies for common diseases and complex traits. Nature reviews 6:95-108.
Hjalt TA, Semina EV (2005): Current molecular understanding of Axenfeld-Rieger syndrome. Expert Rev Mol Med 7:1-17.
Holmes A, Hariri AR (2003): The serotonin transporter gene-linked polymorphism and negative emotionality: placing single gene effects in the context of genetic background and environment. Genes Brain Behav 2:332-335.
Holmes A, Lit Q, Murphy DL, Gold E, Crawley JN (2003): Abnormal anxiety-related behavior in serotonin transporter null mutant mice: the influence of genetic background. Genes Brain Behav 2:365-380.
Hood L, Galas D (2003): The digital code of DNA. Nature 421:444-448.
Howard MO, Cowley DS, Roy-Byrne PP, Hopfenbeck JR (1996): Tridimensional personality traits in sons of alcoholic and nonalcoholic fathers. Alcohol Clin Exp Res 20:445-448.
Hsieh YW, Zhang XM, Lin E, Oliver G, Yang XJ (2002): The homeobox gene Six3 is a potential regulator of anterior segment formation in the chick eye. Dev Biol 248:265-280.
Huizinga D, Haberstick BC, Smolen A, Menard S, Young SE, Corley RP, et al (2006): Childhood Maltreatment, Subsequent Antisocial Behavior, and the Role of Monoamine Oxidase A Genotype. Biological Psychiatry 60:677-683.
Ilies R, Judge TA (2003): On the heritability of job satisfaction: The mediating role of personality. Journal of Applied Psychology 88:750-759.
Ishibashi M, Saitsu H, Komada M, Shiota K (2005): Signaling cascade coordinating growth of dorsal and ventral tissues of the vertebrate brain, with special reference to the involvement of Sonic Hedgehog signaling. Anat Sci Int 80:30-36.
27864 Avhandling_inlaga.indd 113 1/28/08 9:20:34 AM

115
Kulak SC, Kozlowski K, Semina EV, Pearce WG, Walter MA (1998): Mutation in the RIEG1 gene in patients with iridogoniodysgenesis syndrome. Human molecular genetics 7:1113-1117.
Kunugi H, Hattori M, Kato T, Tatsumi M, Sakai T, Sasaki T, et al (1997): Serotonin transporter gene polymorphisms: ethnic difference and possible association with bipolar affective disorder. Molecular psychiatry 2:457-462.
Lachman HM, Kelsoe J, Moreno L, Katz S, Papolos DF (1997): Lack of association of catechol-O-methyltransferase (COMT) functional polymorphism in bipolar affective disorder. Psychiatr Genet 7:13-17.
Lachman HM, Nolan KA, Mohr P, Saito T, Volavka J (1998): Association between catechol O-methyltransferase genotype and violence in schizophrenia and schizoaffective disorder. The American journal of psychiatry 155:835-837.
Lachman HM, Papolos DF, Saito T, Yu YM, Szumlanski CL, Weinshilboum RM (1996): Human catechol-O-methyltransferase pharmacogenetics: description of a functional polymorphism and its potential application to neuropsychiatric disorders. Pharmacogenetics 6:243-250.
Lake RI, Eaves LJ, Maes HH, Heath AC, Martin NG (2000): Further evidence against the environmental transmission of individual differences in neuroticism from a collaborative study of 45,850 twins and relatives on two continents. Behavior genetics 30:223-233.
Lander ES, Schork NJ (1994): Genetic dissection of complex traits. Science 265:2037-2048.
Lansdell H (1964): Sex differences in hemispheric asymmetries of the human brain. Nature 203:550.
Larsson M, Pedersen NL (2004): Genetic correlations among texture characteristics in the human iris. Mol Vis 10:821-831.
Larsson M, Pedersen NL, Stattin H (2003): Importance of genetic effects for characteristics of the human iris. Twin Research 6:192-200.
Lee KH, Choi YY, Gray JR, Cho SH, Chae JH, Lee S, et al (2006): Neural correlates of superior intelligence: stronger recruitment of posterior parietal cortex. NeuroImage 29:578-586.
Lehmann OJ, Sowden JC, Carlsson P, Jordan T, Bhattacharya SS (2003): Fox's in development and disease. Trends Genet 19:339-344.
Lensvelt Mulders G, Hettema J (2001): Analysis of genetic influences on the consistency and variability of the Big Five across different stressful situations. European Journal of Personality 15:355-371.
Lesch KP, Bengel D, Heils A, Sabol SZ, Greenberg BD, Petri S, et al (1996): Association of anxiety-related traits with a polymorphism in the serotonin transporter gene regulatory region. Science 274:1527-1531.
114
Kendler KS, Gatz M, Gardner CO, Pedersen NL (2006): A Swedish National Twin Study of Lifetime Major Depression. American Journal of Psychiatry 163:109-114.
Kendler KS, Kessler RC, Heath AC, Neale MC, Eaves LJ (1991): Coping: a genetic epidemiological investigation. Psychol Med 21:337-346.
Kendler KS, Neale MC, Kessler R, Heath AC (1993): A twin study of recent life events and difficulties. Archives of general psychiatry 50:789-796.
Kendler KS, Neale MC, Kessler RC, Heath AC (1994): Parental treatment and the equal environment assumption in twin studies of psychiatric illness. Psychological Medicine 24:579-590.
Kerr M, Stattin H (2003): Parenting of adolescents: Action or reaction? In: Crouter AC, Booth A editors. Children's influence on family dynamics: The neglected side of family relationships. Mahwah, NJ: Lawrence Erlbaum Associates, pp 121-151.
Kirk KM, Whitfield JB, Pang D, Heath AC, Martin NG (2001): Genetic covariation of neuroticism with monoamine oxidase activity and smoking. American journal of medical genetics 105:700-706.
Kirov G, Murphy KC, Arranz MJ, Jones I, McCandles F, Kunugi H, et al (1998): Low activity allele of catechol-O-methyltransferase gene associated with rapid cycling bipolar disorder. Molecular psychiatry 3:342-345.
Kluger AN, Siegfried Z, Ebstein RP (2002): A meta-analysis of the association between DRD4 polymorphism and novelty seeking. Molecular psychiatry 7:712-717.
Knutson B, Wolkowitz OM, Cole SW, Chan T, Moore EA, Johnson RC, et al (1998): Selective alteration of personality and social behavior by serotonergic intervention. The American journal of psychiatry 155:373-379.
Kosslyn SM, Cacioppo JT, Davidson RJ, Hugdahl K, Lovallo WR, Spiegel D, et al (2002): Bridging psychology and biology: the analysis of individuals in groups. American Psychologist 57:341-351.
Kotler M, Barak P, Cohen H, Averbuch IE, Grinshpoon A, Gritsenko I, et al (1999): Homicidal behavior in schizophrenia associated with a genetic polymorphism determining low catechol O-methyltransferase (COMT) activity. American journal of medical genetics 88:628-633.
Krueger RF, Markon KE, Bouchard TJ, Jr. (2003): The extended genotype: the heritability of personality accounts for the heritability of recalled family environments in twins reared apart. Journal of personality 71:809-833.
Kuiper RP, Schepens M, Thijssen J, Schoenmakers EF, van Kessel AG (2004): Regulation of the MiTF/TFE bHLH-LZ transcription factors through restricted spatial expression and alternative splicing of functional domains. Nucleic Acids Res 32:2315-2322.
27864 Avhandling_inlaga.indd 114 1/28/08 9:20:34 AM

115
Kulak SC, Kozlowski K, Semina EV, Pearce WG, Walter MA (1998): Mutation in the RIEG1 gene in patients with iridogoniodysgenesis syndrome. Human molecular genetics 7:1113-1117.
Kunugi H, Hattori M, Kato T, Tatsumi M, Sakai T, Sasaki T, et al (1997): Serotonin transporter gene polymorphisms: ethnic difference and possible association with bipolar affective disorder. Molecular psychiatry 2:457-462.
Lachman HM, Kelsoe J, Moreno L, Katz S, Papolos DF (1997): Lack of association of catechol-O-methyltransferase (COMT) functional polymorphism in bipolar affective disorder. Psychiatr Genet 7:13-17.
Lachman HM, Nolan KA, Mohr P, Saito T, Volavka J (1998): Association between catechol O-methyltransferase genotype and violence in schizophrenia and schizoaffective disorder. The American journal of psychiatry 155:835-837.
Lachman HM, Papolos DF, Saito T, Yu YM, Szumlanski CL, Weinshilboum RM (1996): Human catechol-O-methyltransferase pharmacogenetics: description of a functional polymorphism and its potential application to neuropsychiatric disorders. Pharmacogenetics 6:243-250.
Lake RI, Eaves LJ, Maes HH, Heath AC, Martin NG (2000): Further evidence against the environmental transmission of individual differences in neuroticism from a collaborative study of 45,850 twins and relatives on two continents. Behavior genetics 30:223-233.
Lander ES, Schork NJ (1994): Genetic dissection of complex traits. Science 265:2037-2048.
Lansdell H (1964): Sex differences in hemispheric asymmetries of the human brain. Nature 203:550.
Larsson M, Pedersen NL (2004): Genetic correlations among texture characteristics in the human iris. Mol Vis 10:821-831.
Larsson M, Pedersen NL, Stattin H (2003): Importance of genetic effects for characteristics of the human iris. Twin Research 6:192-200.
Lee KH, Choi YY, Gray JR, Cho SH, Chae JH, Lee S, et al (2006): Neural correlates of superior intelligence: stronger recruitment of posterior parietal cortex. NeuroImage 29:578-586.
Lehmann OJ, Sowden JC, Carlsson P, Jordan T, Bhattacharya SS (2003): Fox's in development and disease. Trends Genet 19:339-344.
Lensvelt Mulders G, Hettema J (2001): Analysis of genetic influences on the consistency and variability of the Big Five across different stressful situations. European Journal of Personality 15:355-371.
Lesch KP, Bengel D, Heils A, Sabol SZ, Greenberg BD, Petri S, et al (1996): Association of anxiety-related traits with a polymorphism in the serotonin transporter gene regulatory region. Science 274:1527-1531.
114
Kendler KS, Gatz M, Gardner CO, Pedersen NL (2006): A Swedish National Twin Study of Lifetime Major Depression. American Journal of Psychiatry 163:109-114.
Kendler KS, Kessler RC, Heath AC, Neale MC, Eaves LJ (1991): Coping: a genetic epidemiological investigation. Psychol Med 21:337-346.
Kendler KS, Neale MC, Kessler R, Heath AC (1993): A twin study of recent life events and difficulties. Archives of general psychiatry 50:789-796.
Kendler KS, Neale MC, Kessler RC, Heath AC (1994): Parental treatment and the equal environment assumption in twin studies of psychiatric illness. Psychological Medicine 24:579-590.
Kerr M, Stattin H (2003): Parenting of adolescents: Action or reaction? In: Crouter AC, Booth A editors. Children's influence on family dynamics: The neglected side of family relationships. Mahwah, NJ: Lawrence Erlbaum Associates, pp 121-151.
Kirk KM, Whitfield JB, Pang D, Heath AC, Martin NG (2001): Genetic covariation of neuroticism with monoamine oxidase activity and smoking. American journal of medical genetics 105:700-706.
Kirov G, Murphy KC, Arranz MJ, Jones I, McCandles F, Kunugi H, et al (1998): Low activity allele of catechol-O-methyltransferase gene associated with rapid cycling bipolar disorder. Molecular psychiatry 3:342-345.
Kluger AN, Siegfried Z, Ebstein RP (2002): A meta-analysis of the association between DRD4 polymorphism and novelty seeking. Molecular psychiatry 7:712-717.
Knutson B, Wolkowitz OM, Cole SW, Chan T, Moore EA, Johnson RC, et al (1998): Selective alteration of personality and social behavior by serotonergic intervention. The American journal of psychiatry 155:373-379.
Kosslyn SM, Cacioppo JT, Davidson RJ, Hugdahl K, Lovallo WR, Spiegel D, et al (2002): Bridging psychology and biology: the analysis of individuals in groups. American Psychologist 57:341-351.
Kotler M, Barak P, Cohen H, Averbuch IE, Grinshpoon A, Gritsenko I, et al (1999): Homicidal behavior in schizophrenia associated with a genetic polymorphism determining low catechol O-methyltransferase (COMT) activity. American journal of medical genetics 88:628-633.
Krueger RF, Markon KE, Bouchard TJ, Jr. (2003): The extended genotype: the heritability of personality accounts for the heritability of recalled family environments in twins reared apart. Journal of personality 71:809-833.
Kuiper RP, Schepens M, Thijssen J, Schoenmakers EF, van Kessel AG (2004): Regulation of the MiTF/TFE bHLH-LZ transcription factors through restricted spatial expression and alternative splicing of functional domains. Nucleic Acids Res 32:2315-2322.
27864 Avhandling_inlaga.indd 115 1/28/08 9:20:35 AM

117
Maatta M, Heljasvaara R, Pihlajaniemi T, Uusitalo M (2006): Collagen XVIII/endostatin shows a ubiquitous distribution in human ocular tissues and endostatin-containing fragments accumulate in ocular fluid samples. Graefes Arch Clin Exp Ophthalmol.
Maccoby EE (1992): The role of parents in the socialization of children: An historical overview. Developmental Psychology 28:1006-1017.
Magnusson D (1990): Personality research: Challenges for the future. European Journal of Personality 4:1-17.
Magnusson D (1999): Holistic interactionism: a theoretical framework. In: Pervin LA, John OP editors. Handbook of personality, 2 ed. New York, NY: Guildford press, pp 219-247.
Major LF, Lerner P, Goodwin FK, Ballenger JC, Brown GL, Lovenberg W (1980): Dopamine beta-hydroxylase in CSF. Relationship to personality measures. Archives of general psychiatry 37:308-310.
Manke B, McGuire S, Reiss D, Hetherington E (1995): Genetic contributions to adolescents' extrafamilial social interactions: Teachers, best friends, and peers. Social Development 4:238-256.
Manor I, Tyano S, Mel E, Eisenberg J, Bachner-Melman R, Kotler M, et al (2002): Family-based and association studies of monoamine oxidase A and attention deficit hyperactivity disorder (ADHD): preferential transmission of the long promoter-region repeat and its association with impaired performance on a continuous performance test (TOVA). Molecular psychiatry 7:626-632.
Manuck SB, Flory JD, Ferrell RE, Mann JJ, Muldoon MF (2000): A regulatory polymorphism of the monoamine oxidase-A gene may be associated with variability in aggression, impulsivity, and central nervous system serotonergic responsivity. Psychiatry Res 95:9-23.
Matheny AP, Dolan AB (1975): Persons, situations, and time: A genetic view of behavioral change in children. Journal of Personality and Social Psychology 32:1106-1110.
Matheny AP, Jr. (1988): Accidental injuries. (1988) Routh, Donald K (Ed), Handbook of pediatric psychology (pp108 134) New York, NY, US: Guilford Press viii, 612 pp.
Mattick JS (2004): RNA regulation: a new genetics? Nature reviews 5:316-323.
May CA (1999): Mast cell heterogeneity in the human uvea. Histochem Cell Biol 112:381-386.
McCall RB editor (1991): So many interactions, so little evidence. Why? Washington, DC: American Psychological Association.
116
Li T, Vallada H, Curtis D, Arranz M, Xu K, Cai G, et al (1997): Catechol-O-methyltransferase Val158Met polymorphism: frequency analysis in Han Chinese subjects and allelic association of the low activity allele with bipolar affective disorder. Pharmacogenetics 7:349-353.
Lichtenstein P, Holm NV, Verkasalo PK, Iliadou A, Kaprio J, Koskenvuo M, et al (2000): Environmental and heritable factors in the causation of cancer--analyses of cohorts of twins from Sweden, Denmark, and Finland. N Engl J Med 343:78-85.
Lichter PR, Richards JE, Downs CA, Stringham HM, Boehnke M, Farley FA (1997): Cosegregation of open-angle glaucoma and the nail-patella syndrome. American journal of ophthalmology 124:506-515.
Lin DY (2006): Evaluating statistical significance in two-stage genomewide association studies. American journal of human genetics 78:505-509.
Loehlin JC (1989): Partitioning environmental and genetic contributions to behavioral development. The American psychologist 44:1285-1292.
Loehlin JC, Neiderhiser JM, Reiss D (2005): Genetic and environmental components of adolescent adjustment and parental behavior: a multivariate analysis. Child Dev 76:1104-1115.
Loehlin JC, Nichols J (1976): Heredity, environmnet, and personality. Austin: University of Texas Press.
Loehlin JC, Willerman L, Horn JM (1985): Personality resemblances in adoptive families when the children are late-adolescent or adult. J Pers Soc Psychol 48:376-392.
Loehlin JC, Willerman L, Horn JM (1987): Personality resemblance in adoptive families: A 10-year follow-up. Journal of Personality and Social Psychology 53:961-969.
Loehlin JC, Willerman L, Horn JM (1988): Human behavior genetics. Annual review of psychology 39:101-133.
Lorberbaum JP, Newman JD, Horwitz AR, Dubno JR, Lydiard RB, Hamner MB, et al (2002): A potential role for thalamocingulate circuitry in human maternal behavior. Biol Psychiatry 51:431-445.
Lutz A, Greischar LL, Rawlings NB, Ricard M, Davidson RJ (2004): Long-term meditators self-induce high-amplitude gamma synchrony during mental practice. Proceedings of the National Academy of Sciences of the United States of America 101:16369-16373.
Lykken D, Csikszentmihalyi M (2001): Happiness--stuck with what you've got? Psychologist 14:470-472.
Lykken DT (2006): The mechanism of emergenesis. Genes, Brain and Behavior 5:306-310.
27864 Avhandling_inlaga.indd 116 1/28/08 9:20:36 AM
117
Maatta M, Heljasvaara R, Pihlajaniemi T, Uusitalo M (2006): Collagen XVIII/endostatin shows a ubiquitous distribution in human ocular tissues and endostatin-containing fragments accumulate in ocular fluid samples. Graefes Arch Clin Exp Ophthalmol.
Maccoby EE (1992): The role of parents in the socialization of children: An historical overview. Developmental Psychology 28:1006-1017.
Magnusson D (1990): Personality research: Challenges for the future. European Journal of Personality 4:1-17.
Magnusson D (1999): Holistic interactionism: a theoretical framework. In: Pervin LA, John OP editors. Handbook of personality, 2 ed. New York, NY: Guildford press, pp 219-247.
Major LF, Lerner P, Goodwin FK, Ballenger JC, Brown GL, Lovenberg W (1980): Dopamine beta-hydroxylase in CSF. Relationship to personality measures. Archives of general psychiatry 37:308-310.
Manke B, McGuire S, Reiss D, Hetherington E (1995): Genetic contributions to adolescents' extrafamilial social interactions: Teachers, best friends, and peers. Social Development 4:238-256.
Manor I, Tyano S, Mel E, Eisenberg J, Bachner-Melman R, Kotler M, et al (2002): Family-based and association studies of monoamine oxidase A and attention deficit hyperactivity disorder (ADHD): preferential transmission of the long promoter-region repeat and its association with impaired performance on a continuous performance test (TOVA). Molecular psychiatry 7:626-632.
Manuck SB, Flory JD, Ferrell RE, Mann JJ, Muldoon MF (2000): A regulatory polymorphism of the monoamine oxidase-A gene may be associated with variability in aggression, impulsivity, and central nervous system serotonergic responsivity. Psychiatry Res 95:9-23.
Matheny AP, Dolan AB (1975): Persons, situations, and time: A genetic view of behavioral change in children. Journal of Personality and Social Psychology 32:1106-1110.
Matheny AP, Jr. (1988): Accidental injuries. (1988) Routh, Donald K (Ed), Handbook of pediatric psychology (pp108 134) New York, NY, US: Guilford Press viii, 612 pp.
Mattick JS (2004): RNA regulation: a new genetics? Nature reviews 5:316-323.
May CA (1999): Mast cell heterogeneity in the human uvea. Histochem Cell Biol 112:381-386.
McCall RB editor (1991): So many interactions, so little evidence. Why? Washington, DC: American Psychological Association.
116
Li T, Vallada H, Curtis D, Arranz M, Xu K, Cai G, et al (1997): Catechol-O-methyltransferase Val158Met polymorphism: frequency analysis in Han Chinese subjects and allelic association of the low activity allele with bipolar affective disorder. Pharmacogenetics 7:349-353.
Lichtenstein P, Holm NV, Verkasalo PK, Iliadou A, Kaprio J, Koskenvuo M, et al (2000): Environmental and heritable factors in the causation of cancer--analyses of cohorts of twins from Sweden, Denmark, and Finland. N Engl J Med 343:78-85.
Lichter PR, Richards JE, Downs CA, Stringham HM, Boehnke M, Farley FA (1997): Cosegregation of open-angle glaucoma and the nail-patella syndrome. American journal of ophthalmology 124:506-515.
Lin DY (2006): Evaluating statistical significance in two-stage genomewide association studies. American journal of human genetics 78:505-509.
Loehlin JC (1989): Partitioning environmental and genetic contributions to behavioral development. The American psychologist 44:1285-1292.
Loehlin JC, Neiderhiser JM, Reiss D (2005): Genetic and environmental components of adolescent adjustment and parental behavior: a multivariate analysis. Child Dev 76:1104-1115.
Loehlin JC, Nichols J (1976): Heredity, environmnet, and personality. Austin: University of Texas Press.
Loehlin JC, Willerman L, Horn JM (1985): Personality resemblances in adoptive families when the children are late-adolescent or adult. J Pers Soc Psychol 48:376-392.
Loehlin JC, Willerman L, Horn JM (1987): Personality resemblance in adoptive families: A 10-year follow-up. Journal of Personality and Social Psychology 53:961-969.
Loehlin JC, Willerman L, Horn JM (1988): Human behavior genetics. Annual review of psychology 39:101-133.
Lorberbaum JP, Newman JD, Horwitz AR, Dubno JR, Lydiard RB, Hamner MB, et al (2002): A potential role for thalamocingulate circuitry in human maternal behavior. Biol Psychiatry 51:431-445.
Lutz A, Greischar LL, Rawlings NB, Ricard M, Davidson RJ (2004): Long-term meditators self-induce high-amplitude gamma synchrony during mental practice. Proceedings of the National Academy of Sciences of the United States of America 101:16369-16373.
Lykken D, Csikszentmihalyi M (2001): Happiness--stuck with what you've got? Psychologist 14:470-472.
Lykken DT (2006): The mechanism of emergenesis. Genes, Brain and Behavior 5:306-310.
27864 Avhandling_inlaga.indd 117 1/28/08 9:20:36 AM
119
Munafo MR, Yalcin B, Willis-Owen SA, Flint J (2007): Association of the Dopamine D4 Receptor (DRD4) Gene and Approach-Related Personality Traits: Meta-Analysis and New Data. Biol Psychiatry.
Murphy DL, Andrews AM, Wichems CH, Li Q, Tohda M, Greenberg B (1998): Brain serotonin neurotransmission: an overview and update with an emphasis on serotonin subsystem heterogeneity, multiple receptors, interactions with other neurotransmitter systems, and consequent implications for understanding the actions of serotonergic drugs. J Clin Psychiatry 59 Suppl 15:4-12.
Mynett-Johnson LA, Murphy VE, Claffey E, Shields DC, McKeon P (1998): Preliminary evidence of an association between bipolar disorder in females and the catechol-O-methyltransferase gene. Psychiatr Genet 8:221-225.
Neale M-C, Cardon L-R (1992): Methodology for genetic studies of twins and families.
Neale M, Boker S, Xie G, Maes H (1999): Mx: Statistical Modeling. Box 126, MCV, Richmond, VA 23298: Department of Psychiatry. 5th Edition.
Neale MC, Boker SM, Xie G, Maes HH (2004): Mx: Statistical Modeling. 6nd ed: Richmond (VA): MCV Richmond Department of Psychiatry.
Neiderhiser JM, Reiss D, Pedersen NL, Lichtenstein P, Spotts EL, Hansson K, et al (2004): Genetic and environmental influences on mothering of adolescents: a comparison of two samples. Dev Psychol 40:335-351.
Newman TK, Syagailo YV, Barr CS, Wendland JR, Champoux M, Graessle M, et al (2005): Monoamine oxidase A gene promoter variation and rearing experience influences aggressive behavior in rhesus monkeys. Biol Psychiatry 57:167-172.
Nichols RC, Bilbro WC, Jr. (1966): The diagnosis of twin zygosity. Acta Genet Stat Med 16:265-275.
O'Connor TG, Caspi A, DeFries JC, Plomin R (2000): Are associations between parental divorce and children's adjustment genetically mediated? An adoption study. Dev Psychol 36:429-437.
O'Connor TG, Deater-Deckard K, Fulker D, Rutter M, Plomin R (1998): Genotype-environment correlations in late childhood and early adolescence: antisocial behavioral problems and coercive parenting. Dev Psychol 34:970-981.
Ohara K, Nagai M, Suzuki Y, Ohara K (1998): Low activity allele of catechol-o-methyltransferase gene and Japanese unipolar depression. Neuroreport 9:1305-1308.
Opdecamp K, Nakayama A, Nguyen MT, Hodgkinson CA, Pavan WJ, Arnheiter H (1997): Melanocyte development in vivo and in neural crest cell cultures: crucial dependence on the Mitf basic-helix-loop-helix-zipper transcription factor. Development 124:2377-2386.
118
McCartney K, Harris MJ, Bernieri F (1990): Growing up and growing apart: A developmental meta-analysis of twin studies. Psychological Bulletin 107:226-237.
McCrae RR, Costa PTJR (2003): Personality in adulthood: A five-factor theory perspective, 2nd ed. New York, NY: Guilford Press.
McGue M, Bacon S, Lykken DT (1993): Personality stability and change in early adulthood: A behavioral genetic analysis. Developmental Psychology 29:96-109.
McMenamin PG (1997): The distribution of immune cells in the uveal tract of the normal eye. Eye 11 ( Pt 2):183-193.
Meaburn EL, Harlaar N, Craig IW, Schalkwyk LC, Plomin R (2007): Quantitative trait locus association scan of early reading disability and ability using pooled DNA and 100K SNP microarrays in a sample of 5760 children. Molecular psychiatry.
Mellins CA, Gatz M, Baker L (1996): Children's methods of coping with stress: a twin study of genetic and environmental influences. Journal of child psychology and psychiatry, and allied disciplines 37:721-730.
Mischel W (1968): Personality and assessment. New York: Wiley.
Mischel W (1981): Introdution to personality, 3 ed. New York: Holt, Rinehart & Winston.
Mochii M, Mazaki Y, Mizuno N, Hayashi H, Eguchi G (1998): Role of Mitf in differentiation and transdifferentiation of chicken pigmented epithelial cell. Dev Biol 193:47-62.
Monaghan AP, Davidson DR, Sime C, Graham E, Baldock R, Bhattacharya SS, et al (1991): The Msh-like homeobox genes define domains in the developing vertebrate eye. Development 112:1053-1061.
Moneta GB, Csikszentmihalyi M (1999): Models of concentration in natural environments: A comparative approach based on streams of experiential data. Social Behavior and Personality 27:603-638.
Morris-Yates A, Andrews G, Howie P, Henderson S (1990): Twins: a test of the equal environments assumption. Acta Psychiatr Scand 81:322-326.
Munafo MR, Clark T, Flint J (2005): Does measurement instrument moderate the association between the serotonin transporter gene and anxiety-related personality traits? A meta-analysis. Molecular psychiatry 10:415-419.
Munafo MR, Clark TG, Moore LR, Payne E, Walton R, Flint J (2003): Genetic polymorphisms and personality in healthy adults: a systematic review and meta-analysis. Molecular psychiatry 8:471-484.
27864 Avhandling_inlaga.indd 118 1/28/08 9:20:37 AM

119
Munafo MR, Yalcin B, Willis-Owen SA, Flint J (2007): Association of the Dopamine D4 Receptor (DRD4) Gene and Approach-Related Personality Traits: Meta-Analysis and New Data. Biol Psychiatry.
Murphy DL, Andrews AM, Wichems CH, Li Q, Tohda M, Greenberg B (1998): Brain serotonin neurotransmission: an overview and update with an emphasis on serotonin subsystem heterogeneity, multiple receptors, interactions with other neurotransmitter systems, and consequent implications for understanding the actions of serotonergic drugs. J Clin Psychiatry 59 Suppl 15:4-12.
Mynett-Johnson LA, Murphy VE, Claffey E, Shields DC, McKeon P (1998): Preliminary evidence of an association between bipolar disorder in females and the catechol-O-methyltransferase gene. Psychiatr Genet 8:221-225.
Neale M-C, Cardon L-R (1992): Methodology for genetic studies of twins and families.
Neale M, Boker S, Xie G, Maes H (1999): Mx: Statistical Modeling. Box 126, MCV, Richmond, VA 23298: Department of Psychiatry. 5th Edition.
Neale MC, Boker SM, Xie G, Maes HH (2004): Mx: Statistical Modeling. 6nd ed: Richmond (VA): MCV Richmond Department of Psychiatry.
Neiderhiser JM, Reiss D, Pedersen NL, Lichtenstein P, Spotts EL, Hansson K, et al (2004): Genetic and environmental influences on mothering of adolescents: a comparison of two samples. Dev Psychol 40:335-351.
Newman TK, Syagailo YV, Barr CS, Wendland JR, Champoux M, Graessle M, et al (2005): Monoamine oxidase A gene promoter variation and rearing experience influences aggressive behavior in rhesus monkeys. Biol Psychiatry 57:167-172.
Nichols RC, Bilbro WC, Jr. (1966): The diagnosis of twin zygosity. Acta Genet Stat Med 16:265-275.
O'Connor TG, Caspi A, DeFries JC, Plomin R (2000): Are associations between parental divorce and children's adjustment genetically mediated? An adoption study. Dev Psychol 36:429-437.
O'Connor TG, Deater-Deckard K, Fulker D, Rutter M, Plomin R (1998): Genotype-environment correlations in late childhood and early adolescence: antisocial behavioral problems and coercive parenting. Dev Psychol 34:970-981.
Ohara K, Nagai M, Suzuki Y, Ohara K (1998): Low activity allele of catechol-o-methyltransferase gene and Japanese unipolar depression. Neuroreport 9:1305-1308.
Opdecamp K, Nakayama A, Nguyen MT, Hodgkinson CA, Pavan WJ, Arnheiter H (1997): Melanocyte development in vivo and in neural crest cell cultures: crucial dependence on the Mitf basic-helix-loop-helix-zipper transcription factor. Development 124:2377-2386.
118
McCartney K, Harris MJ, Bernieri F (1990): Growing up and growing apart: A developmental meta-analysis of twin studies. Psychological Bulletin 107:226-237.
McCrae RR, Costa PTJR (2003): Personality in adulthood: A five-factor theory perspective, 2nd ed. New York, NY: Guilford Press.
McGue M, Bacon S, Lykken DT (1993): Personality stability and change in early adulthood: A behavioral genetic analysis. Developmental Psychology 29:96-109.
McMenamin PG (1997): The distribution of immune cells in the uveal tract of the normal eye. Eye 11 ( Pt 2):183-193.
Meaburn EL, Harlaar N, Craig IW, Schalkwyk LC, Plomin R (2007): Quantitative trait locus association scan of early reading disability and ability using pooled DNA and 100K SNP microarrays in a sample of 5760 children. Molecular psychiatry.
Mellins CA, Gatz M, Baker L (1996): Children's methods of coping with stress: a twin study of genetic and environmental influences. Journal of child psychology and psychiatry, and allied disciplines 37:721-730.
Mischel W (1968): Personality and assessment. New York: Wiley.
Mischel W (1981): Introdution to personality, 3 ed. New York: Holt, Rinehart & Winston.
Mochii M, Mazaki Y, Mizuno N, Hayashi H, Eguchi G (1998): Role of Mitf in differentiation and transdifferentiation of chicken pigmented epithelial cell. Dev Biol 193:47-62.
Monaghan AP, Davidson DR, Sime C, Graham E, Baldock R, Bhattacharya SS, et al (1991): The Msh-like homeobox genes define domains in the developing vertebrate eye. Development 112:1053-1061.
Moneta GB, Csikszentmihalyi M (1999): Models of concentration in natural environments: A comparative approach based on streams of experiential data. Social Behavior and Personality 27:603-638.
Morris-Yates A, Andrews G, Howie P, Henderson S (1990): Twins: a test of the equal environments assumption. Acta Psychiatr Scand 81:322-326.
Munafo MR, Clark T, Flint J (2005): Does measurement instrument moderate the association between the serotonin transporter gene and anxiety-related personality traits? A meta-analysis. Molecular psychiatry 10:415-419.
Munafo MR, Clark TG, Moore LR, Payne E, Walton R, Flint J (2003): Genetic polymorphisms and personality in healthy adults: a systematic review and meta-analysis. Molecular psychiatry 8:471-484.
27864 Avhandling_inlaga.indd 119 1/28/08 9:20:37 AM

121
Phillips PC (1999): From complex traits to complex alleles. Trends Genet 15:6-8.
Pivac N, Knezevic J, Mustapic M, Dezeljin M, Muck-Seler D, Kozaric-Kovacic D, et al (2006): The lack of association between monoamine oxidase (MAO) intron 13 polymorphism and platelet MAO-B activity among men. Life Sci 79:45-49.
Planque N, Leconte L, Coquelle FM, Martin P, Saule S (2001): Specific Pax-6/microphthalmia transcription factor interactions involve their DNA-binding domains and inhibit transcriptional properties of both proteins. J Biol Chem 276:29330-29337.
Plomin R (1987): Developmental behavioral genetics and infancy. Wiley series on personality processes.
Plomin R (1994): Genetics and experience: The interplay between nature and nurture.
Plomin R (2005): Finding genes in child psychology and psychiatry: When are we going to be there? Journal of Child Psychology and Psychiatry 46:1030-1038.
Plomin R, Asbury K (2005): Nature and Nurture: Genetic and Environmental Influences on Behavior. Annals of the American Academy of Political and Social Science 600:86-98.
Plomin R, Asbury K, Dunn J (2001a): Why are children in the same family so different? Nonshared environment a decade later. Can J Psychiatry 46:225-233.
Plomin R, Caspi A (1998): DNA and personality. European Journal of Personality 12:387-407.
Plomin R, Chipuer HM, Loehlin JC (1990): Behavioral genetics and personality. (1990) Pervin, Lawrence A (Ed), Handbook of personality: Theory and research (pp225 243) New York, NY, US: Guilford Press xiv, 738 pp.
Plomin R, Corley R, Caspi A, Fulker DW, DeFries J (1998): Adoption results for self-reported personality: Evidence for nonadditive genetic effects? Journal of Personality and Social Psychology 75:211-218.
Plomin R, Crabbe J (2000): DNA. Psychol Bull 126:806-828.
Plomin R, Daniels D (1987): Why are children in the same family so different from one another? Behavioral and Brain Sciences 10:1-16.
Plomin R, DeFries JC, Loehlin JC (1977): Genotype-environment interaction and correlation in the analysis of human behavior. Psychol Bull 84:309-322.
Plomin R, DeFries JC, McClearn GE, McGuffin P (2001b): Behavioral Genetics, 4th ed. New York, NY: Worth Publishers.
Plomin R, Kennedy JKJ, Craig IW (2006): Editorial: The quest for quantitative trait loci associated with intelligence. Intelligence 34:513-526.
120
Oreland L, Hallman J (1995): The correlation between platelet MAO activity and personality: short review of findings and a discussion on possible mechanisms. Prog Brain Res 106:77-84.
Oreland L, Hallman J, Damberg M (2004): Platelet MAO and personality--function and dysfunction. Curr Med Chem 11:2007-2016.
Oreland L, Shaskan EG (1983): Monoamine oxidase activity as a biological marker. Trend Pharmacol Sci 4:339-341.
Oyster CW (1999): The human eye structure and function: Sunderland, Mass. Sinauer Associates.
Pam A, Kemker SS, Ross CA, Golden R (1996): The "equal environments assumption" in MZ-DZ twin comparisons: an untenable premise of psychiatric genetics? Acta Genet Med Gemellol (Roma) 45:349-360.
Papolos DF, Veit S, Faedda GL, Saito T, Lachman HM (1998): Ultra-ultra rapid cycling bipolar disorder is associated with the low activity catecholamine-O-methyltransferase allele. Molecular psychiatry 3:346-349.
Paterson DR (1968): The clinical study of social behavior. New York: Appleton.
Pavlin CJ, Harasiewicz K, Foster FS (1992): Ultrasound biomicroscopy of anterior segment structures in normal and glaucomatous eyes. American journal of ophthalmology 113:381-389.
Peck R, Williams LA (2002): SPSS Manual / Roger Peck. New York: Addison Wesley Publishing Company.
Pedersen NL (1994): The nature and nurture of personality. In: De Raad B, Hofsteen WKB, Van Heck GL editors. Personaltiy psychlogy in Europe. Tilburg: Tilburg University Press, pp 110-132.
Pedersen Nl (2002): Behavior genetics and the future of psychology. In: von Hofsten C, Baeckman L editors. Psychology at the turn of the millennium, vol 2: Social, developmental, and clinical perspectives. Florence, KY: Taylor & Frances/Routledge, pp 3-16.
Pedersen NL, Reynolds CA (1998): Stability and change in adult personality: Genetic and environmental components. European Journal of Personality 12:365-386.
Pedersen NL, Reynolds CA (2002): "Stability and change in adult personality: Genetic and environmental components": Erratum. European Journal of Personality 16:77-78.
Peretz E (1960): The effects of lesions of the anterior cingulate cortex on the behavior of the rat. Journal of comparative and physiological psychology 53:540-548.
Phillips K, Matheny AP, Jr. (1997): Evidence for genetic influence on both cross-situation and situation-specific components of behavior. J Pers Soc Psychol 73:129-138.
27864 Avhandling_inlaga.indd 120 1/28/08 9:20:38 AM
121
Phillips PC (1999): From complex traits to complex alleles. Trends Genet 15:6-8.
Pivac N, Knezevic J, Mustapic M, Dezeljin M, Muck-Seler D, Kozaric-Kovacic D, et al (2006): The lack of association between monoamine oxidase (MAO) intron 13 polymorphism and platelet MAO-B activity among men. Life Sci 79:45-49.
Planque N, Leconte L, Coquelle FM, Martin P, Saule S (2001): Specific Pax-6/microphthalmia transcription factor interactions involve their DNA-binding domains and inhibit transcriptional properties of both proteins. J Biol Chem 276:29330-29337.
Plomin R (1987): Developmental behavioral genetics and infancy. Wiley series on personality processes.
Plomin R (1994): Genetics and experience: The interplay between nature and nurture.
Plomin R (2005): Finding genes in child psychology and psychiatry: When are we going to be there? Journal of Child Psychology and Psychiatry 46:1030-1038.
Plomin R, Asbury K (2005): Nature and Nurture: Genetic and Environmental Influences on Behavior. Annals of the American Academy of Political and Social Science 600:86-98.
Plomin R, Asbury K, Dunn J (2001a): Why are children in the same family so different? Nonshared environment a decade later. Can J Psychiatry 46:225-233.
Plomin R, Caspi A (1998): DNA and personality. European Journal of Personality 12:387-407.
Plomin R, Chipuer HM, Loehlin JC (1990): Behavioral genetics and personality. (1990) Pervin, Lawrence A (Ed), Handbook of personality: Theory and research (pp225 243) New York, NY, US: Guilford Press xiv, 738 pp.
Plomin R, Corley R, Caspi A, Fulker DW, DeFries J (1998): Adoption results for self-reported personality: Evidence for nonadditive genetic effects? Journal of Personality and Social Psychology 75:211-218.
Plomin R, Crabbe J (2000): DNA. Psychol Bull 126:806-828.
Plomin R, Daniels D (1987): Why are children in the same family so different from one another? Behavioral and Brain Sciences 10:1-16.
Plomin R, DeFries JC, Loehlin JC (1977): Genotype-environment interaction and correlation in the analysis of human behavior. Psychol Bull 84:309-322.
Plomin R, DeFries JC, McClearn GE, McGuffin P (2001b): Behavioral Genetics, 4th ed. New York, NY: Worth Publishers.
Plomin R, Kennedy JKJ, Craig IW (2006): Editorial: The quest for quantitative trait loci associated with intelligence. Intelligence 34:513-526.
120
Oreland L, Hallman J (1995): The correlation between platelet MAO activity and personality: short review of findings and a discussion on possible mechanisms. Prog Brain Res 106:77-84.
Oreland L, Hallman J, Damberg M (2004): Platelet MAO and personality--function and dysfunction. Curr Med Chem 11:2007-2016.
Oreland L, Shaskan EG (1983): Monoamine oxidase activity as a biological marker. Trend Pharmacol Sci 4:339-341.
Oyster CW (1999): The human eye structure and function: Sunderland, Mass. Sinauer Associates.
Pam A, Kemker SS, Ross CA, Golden R (1996): The "equal environments assumption" in MZ-DZ twin comparisons: an untenable premise of psychiatric genetics? Acta Genet Med Gemellol (Roma) 45:349-360.
Papolos DF, Veit S, Faedda GL, Saito T, Lachman HM (1998): Ultra-ultra rapid cycling bipolar disorder is associated with the low activity catecholamine-O-methyltransferase allele. Molecular psychiatry 3:346-349.
Paterson DR (1968): The clinical study of social behavior. New York: Appleton.
Pavlin CJ, Harasiewicz K, Foster FS (1992): Ultrasound biomicroscopy of anterior segment structures in normal and glaucomatous eyes. American journal of ophthalmology 113:381-389.
Peck R, Williams LA (2002): SPSS Manual / Roger Peck. New York: Addison Wesley Publishing Company.
Pedersen NL (1994): The nature and nurture of personality. In: De Raad B, Hofsteen WKB, Van Heck GL editors. Personaltiy psychlogy in Europe. Tilburg: Tilburg University Press, pp 110-132.
Pedersen Nl (2002): Behavior genetics and the future of psychology. In: von Hofsten C, Baeckman L editors. Psychology at the turn of the millennium, vol 2: Social, developmental, and clinical perspectives. Florence, KY: Taylor & Frances/Routledge, pp 3-16.
Pedersen NL, Reynolds CA (1998): Stability and change in adult personality: Genetic and environmental components. European Journal of Personality 12:365-386.
Pedersen NL, Reynolds CA (2002): "Stability and change in adult personality: Genetic and environmental components": Erratum. European Journal of Personality 16:77-78.
Peretz E (1960): The effects of lesions of the anterior cingulate cortex on the behavior of the rat. Journal of comparative and physiological psychology 53:540-548.
Phillips K, Matheny AP, Jr. (1997): Evidence for genetic influence on both cross-situation and situation-specific components of behavior. J Pers Soc Psychol 73:129-138.
27864 Avhandling_inlaga.indd 121 1/28/08 9:20:38 AM

123
dynamics: The neglected side of family relationships (pp3 25) Mahwah, NJ, US: Lawrence Erlbaum Associates, Publishers x, 269 pp.
Reiss D, Neiderhiser JM, Hetherington EM, Plomin R (2000): The relationship code: Deciphering genetic and social influences on adolescent development. Cambridge, MA: Harvard University Press.
Riese ML (1990): Neonatal temperament in monozygotic and dizygotic twin pairs. Child Development 61:1230-1237.
Riise R, Storhaug K, Brondum-Nielsen K (2001): Rieger syndrome is associated with PAX6 deletion. Acta Ophthalmol Scand 79:201-203.
Rittig M, Lutjen-Drecoll E, Rauterberg J, Jander R, Mollenhauer J (1990): Type-VI collagen in the human iris and ciliary body. Cell Tissue Res 259:305-312.
Rose RJ, Kaprio J (1987): Shared experience and similarity of personality: Positive data from Finnish and American twins. Behavioral and Brain Sciences 10:35-36.
Rose RJ, Kaprio J (1988): Frequency of social contact and intrapair resemblance of adult monozygotic cotwins: or Does shared experience influence personality after all? Behavior genetics 18:309-328.
Rowe DC (1981): Environmental and genetic influences on dimensions of perceived parenting: A twin study. Developmental Psychology 17:203-208.
Rowe DC (1983): A biometrical analysis of perceptions of family environment: a study of twin and singleton sibling kinships. Child Dev 54:416-423.
Rowe DC (1994): The limits of family influence: Genes, experience, and behavior.
Rowe DC, Jacobson KC, Van den Oord EJ (1999): Genetic and environmental influences on vocabulary IQ: parental education level as moderator. Child Dev 70:1151-1162.
Ruchkin VV, Koposov RA, af Klinteberg B, Oreland L, Grigorenko EL (2005): Platelet MAO-B, personality, and psychopathology. J Abnorm Psychol 114:477-482.
Rujescu D, Giegling I, Gietl A, Hartmann AM, Moller HJ (2003): A functional single nucleotide polymorphism (V158M) in the COMT gene is associated with aggressive personality traits. Biol Psychiatry 54:34-39.
Rutter M, Dunn J, Plomin R, Simonoff E (1997): Integrating nature and nurture: Implications of person-environment correlations and interactions for developmental psychopathology. Development and Psychopathology 9:335-364.
Rutter M, Moffitt TE, Caspi A (2006): Gene-environment interplay and psychopathology: multiple varieties but real effects. Journal of child psychology and psychiatry, and allied disciplines 47:226-261.
122
Plomin R, McClearn GE, Pedersen NL, Nesselroade JR, et al. (1988): Genetic influence on childhood family environment perceived retrospectively from the last half of the life span. Developmental Psychology 24:738-745.
Plomin R, McClearn GE, Smith DL, Skuder P, et al. (1995): Allelic associations between 100 DNA markers and high versus low IQ. Intelligence 21:31-48.
Plomin R, Nesselroade JR (1990): Behavioral genetics and personality change. Journal of personality 58:191-220.
Plomin R, Reiss D, Hetherington E, Howe GW (1994): Nature and nurture: Genetic contributions to measures of the family environment. Developmental Psychology 30:32-43.
Plomin R, Rutter M (1998): Child development, molecular genetics, and what to do with genes once they are found. Child Dev 69:1223-1242.
Posthuma D, Baare WF, Hulshoff Pol HE, Kahn RS, Boomsma DI, De Geus EJ (2003): Genetic correlations between brain volumes and the WAIS-III dimensions of verbal comprehension, working memory, perceptual organization, and processing speed. Twin Res 6:131-139.
Posthuma D, Boomsma DI (2000): A note on the statistical power in extended twin designs. Behavior genetics 30:147-158.
Pressman CL, Chen H, Johnson RL (2000): LMX1B, a LIM homeodomain class transcription factor, is necessary for normal development of multiple tissues in the anterior segment of the murine eye. Genesis 26:15-25.
Price RA, Vandenberg SG (1979): Matching for physical attractiveness in married couples. Personality and Social Psychology Bulletin 5:398-400.
Price RA, Vandenberg SG (1980): Spouse similarity in American and Swedish couples. Behavior genetics 10:59-71.
Price RA, Vandenberg SG, Iyer H, Williams JS (1982): Components of variation in normal personality. Journal of Personality and Social Psychology 43:328-340.
Pujol J, Lopez A, Deus J, Cardoner N, Vallejo J, Capdevila A, et al (2002): Anatomical variability of the anterior cingulate gyrus and basic dimensions of human personality. NeuroImage 15:847-855.
Purcell S, Sham PC (2004): Epistasis in quantitative trait locus linkage analysis: interaction or main effect? Behavior genetics 34:143-152.
Raleigh MJ, McGuire MT, Brammer GL, Pollack DB, Yuwiler A (1991): Serotonergic mechanisms promote dominance acquisition in adult male vervet monkeys. Brain Res 559:181-190.
Reiss D (2003): Child effects on family systems: Behavioral genetic strategies. (2003) Booth, Alan (Ed), Crouter, Ann C (Ed), Children's influence on family
27864 Avhandling_inlaga.indd 122 1/28/08 9:20:39 AM

123
dynamics: The neglected side of family relationships (pp3 25) Mahwah, NJ, US: Lawrence Erlbaum Associates, Publishers x, 269 pp.
Reiss D, Neiderhiser JM, Hetherington EM, Plomin R (2000): The relationship code: Deciphering genetic and social influences on adolescent development. Cambridge, MA: Harvard University Press.
Riese ML (1990): Neonatal temperament in monozygotic and dizygotic twin pairs. Child Development 61:1230-1237.
Riise R, Storhaug K, Brondum-Nielsen K (2001): Rieger syndrome is associated with PAX6 deletion. Acta Ophthalmol Scand 79:201-203.
Rittig M, Lutjen-Drecoll E, Rauterberg J, Jander R, Mollenhauer J (1990): Type-VI collagen in the human iris and ciliary body. Cell Tissue Res 259:305-312.
Rose RJ, Kaprio J (1987): Shared experience and similarity of personality: Positive data from Finnish and American twins. Behavioral and Brain Sciences 10:35-36.
Rose RJ, Kaprio J (1988): Frequency of social contact and intrapair resemblance of adult monozygotic cotwins: or Does shared experience influence personality after all? Behavior genetics 18:309-328.
Rowe DC (1981): Environmental and genetic influences on dimensions of perceived parenting: A twin study. Developmental Psychology 17:203-208.
Rowe DC (1983): A biometrical analysis of perceptions of family environment: a study of twin and singleton sibling kinships. Child Dev 54:416-423.
Rowe DC (1994): The limits of family influence: Genes, experience, and behavior.
Rowe DC, Jacobson KC, Van den Oord EJ (1999): Genetic and environmental influences on vocabulary IQ: parental education level as moderator. Child Dev 70:1151-1162.
Ruchkin VV, Koposov RA, af Klinteberg B, Oreland L, Grigorenko EL (2005): Platelet MAO-B, personality, and psychopathology. J Abnorm Psychol 114:477-482.
Rujescu D, Giegling I, Gietl A, Hartmann AM, Moller HJ (2003): A functional single nucleotide polymorphism (V158M) in the COMT gene is associated with aggressive personality traits. Biol Psychiatry 54:34-39.
Rutter M, Dunn J, Plomin R, Simonoff E (1997): Integrating nature and nurture: Implications of person-environment correlations and interactions for developmental psychopathology. Development and Psychopathology 9:335-364.
Rutter M, Moffitt TE, Caspi A (2006): Gene-environment interplay and psychopathology: multiple varieties but real effects. Journal of child psychology and psychiatry, and allied disciplines 47:226-261.
122
Plomin R, McClearn GE, Pedersen NL, Nesselroade JR, et al. (1988): Genetic influence on childhood family environment perceived retrospectively from the last half of the life span. Developmental Psychology 24:738-745.
Plomin R, McClearn GE, Smith DL, Skuder P, et al. (1995): Allelic associations between 100 DNA markers and high versus low IQ. Intelligence 21:31-48.
Plomin R, Nesselroade JR (1990): Behavioral genetics and personality change. Journal of personality 58:191-220.
Plomin R, Reiss D, Hetherington E, Howe GW (1994): Nature and nurture: Genetic contributions to measures of the family environment. Developmental Psychology 30:32-43.
Plomin R, Rutter M (1998): Child development, molecular genetics, and what to do with genes once they are found. Child Dev 69:1223-1242.
Posthuma D, Baare WF, Hulshoff Pol HE, Kahn RS, Boomsma DI, De Geus EJ (2003): Genetic correlations between brain volumes and the WAIS-III dimensions of verbal comprehension, working memory, perceptual organization, and processing speed. Twin Res 6:131-139.
Posthuma D, Boomsma DI (2000): A note on the statistical power in extended twin designs. Behavior genetics 30:147-158.
Pressman CL, Chen H, Johnson RL (2000): LMX1B, a LIM homeodomain class transcription factor, is necessary for normal development of multiple tissues in the anterior segment of the murine eye. Genesis 26:15-25.
Price RA, Vandenberg SG (1979): Matching for physical attractiveness in married couples. Personality and Social Psychology Bulletin 5:398-400.
Price RA, Vandenberg SG (1980): Spouse similarity in American and Swedish couples. Behavior genetics 10:59-71.
Price RA, Vandenberg SG, Iyer H, Williams JS (1982): Components of variation in normal personality. Journal of Personality and Social Psychology 43:328-340.
Pujol J, Lopez A, Deus J, Cardoner N, Vallejo J, Capdevila A, et al (2002): Anatomical variability of the anterior cingulate gyrus and basic dimensions of human personality. NeuroImage 15:847-855.
Purcell S, Sham PC (2004): Epistasis in quantitative trait locus linkage analysis: interaction or main effect? Behavior genetics 34:143-152.
Raleigh MJ, McGuire MT, Brammer GL, Pollack DB, Yuwiler A (1991): Serotonergic mechanisms promote dominance acquisition in adult male vervet monkeys. Brain Res 559:181-190.
Reiss D (2003): Child effects on family systems: Behavioral genetic strategies. (2003) Booth, Alan (Ed), Crouter, Ann C (Ed), Children's influence on family
27864 Avhandling_inlaga.indd 123 1/28/08 9:20:39 AM

125
Sen S, Burmeister M, Ghosh D (2004): Meta-analysis of the association between a serotonin transporter promoter polymorphism (5-HTTLPR) and anxiety-related personality traits. Am J Med Genet B Neuropsychiatr Genet 127:85-89.
Sham P, Bader JS, Craig I, O'Donovan M, Owen M (2002): DNA Pooling: a tool for large-scale association studies. Nature reviews 3:862-871.
Silberg J, Rutter M, Neale M, Eaves L (2001): Genetic moderation of environmental risk for depression and anxiety in adolescent girls. Br J Psychiatry 179:116-121.
Simmons A, Stein MB, Matthews SC, Feinstein JS, Paulus MP (2006): Affective ambiguity for a group recruits ventromedial prefrontal cortex. NeuroImage 29:655-661.
Simpson TI, Price DJ (2002): Pax6; a pleiotropic player in development. Bioessays 24:1041-1051.
Smidt MP, Smits SM, Burbach JP (2003): Molecular mechanisms underlying midbrain dopamine neuron development and function. Eur J Pharmacol 480:75-88.
Smith RS, Zabaleta A, Kume T, Savinova OV, Kidson SH, Martin JE, et al (2000): Haploinsufficiency of the transcription factors FOXC1 and FOXC2 results in aberrant ocular development. Human molecular genetics 9:1021-1032.
Smith RT (1965): A comparison of socioenvironmnetal factors in monozygotic and dizygot twins, testing an assumption. In: Vandenberg SG editor. Methos and goals in human behavior genetics. New York: Academic Press.
Spotts EL, Lichtenstein P, Pedersen N, Neiderhiser JM, Hansson K, Cederblad M, et al (2005): Personality and Marital Satisfaction: A Behavioural Genetic Analysis. European Journal of Personality 19:205-227.
Stattin H, Magnusson D (1996): Antisocial development: A holistic approach. Development and Psychopathology 8:617-645.
Stein LD (2004): Human genome: end of the beginning. Nature 431:915-916.
Strous RD, Bark N, Parsia SS, Volavka J, Lachman HM (1997): Analysis of a functional catechol-O-methyltransferase gene polymorphism in schizophrenia: evidence for association with aggressive and antisocial behavior. Psychiatry Res 69:71-77.
Sturm RA, Frudakis TN (2004): Eye colour: portals into pigmentation genes and ancestry. Trends Genet 20:327-332.
Sutton SK, Davidson RJ (1997): Prefrontal brain asymmetry: A biological substrate of the behavioral approach and inhibition systems. Psychological Science 8:204-210.
Syvanen AC, Tilgmann C, Rinne J, Ulmanen I (1997): Genetic polymorphism of catechol-O-methyltransferase (COMT): correlation of genotype with individual variation of S-COMT activity and comparison of the allele frequencies in the
124
Rutter M, Plomin R (1997): Opportunities for psychiatry from genetic findings. Br J Psychiatry 171:209-219.
Rutter M, Silberg J (2002): Gene-environment interplay in relation to emotional and behavioral disturbance. Annual review of psychology 53:463-490.
Sabol SZ, Hu S, Hamer D (1998): A functional polymorphism in the monoamine oxidase A gene promoter. Hum Genet 103:273-279.
Saklofske DH, Zeidner M, Deary IJ, Austin EJ, Matthews G, Sternberg R (1999): The intelligence-personality interface: Prospects for integration. In: Mervielde I, de Fruyt F, Ostendorf F editors. Personality Psychology in Europe, Vol 7: Tilburg: Tilburg University Press, pp 235-262.
Sale MM, Craig JE, Charlesworth JC, FitzGerald LM, Hanson IM, Dickinson JL, et al (2002): Broad phenotypic variability in a single pedigree with a novel 1410delC mutation in the PST domain of the PAX6 gene. Hum Mutat 20:322.
Sali A, Kuriyan J (1999): Challenges at the frontiers of structural biology. Trends Cell Biol 9:M20-24.
Sarnat HB, Flores-Sarnat L (2005): Embryology of the neural crest: its inductive role in the neurocutaneous syndromes. J Child Neurol 20:637-643.
Satagopan JM, Elston RC (2003): Optimal two-stage genotyping in population-based association studies. Genetic epidemiology 25:149-157.
Saudino KJ, Pedersen NL, Lichtenstein P, McClearn GE, et al. (1997): Can personality explain genetic influences on life events? Journal of Personality and Social Psychology 72:196-206.
Scarr S (1968): Environmental bias in twin studies. Eugen Q 15:34-40.
Scarr S (1992): Developmental therories for the 1990s: Development and individual differences. Child Development 63:1-19.
Scarr S editor (1997): The development of individual differences in intelligence and personality. Hillsdale, NJ, England: Lawrence Erlbaum Associates, Inc.
Scarr S, Carter Saltzman L (1979): Twin method: Defense of a critical assumption. Behavior genetics 9:527-542.
Scarr S, Webber PL, Weinberg RA, Wittig MA (1981): Personality resemblance among adolescents and their parents in biologically related and adoptive families. Journal of Personality and Social Psychology 40:885-898.
Schedl A, Ross A, Lee M, Engelkamp D, Rashbass P, van Heyningen V, et al (1996): Influence of PAX6 gene dosage on development: overexpression causes severe eye abnormalities. Cell 86:71-82.
Schinka JA, Letsch EA, Crawford FC (2002): DRD4 and novelty seeking: results of meta-analyses. American journal of medical genetics 114:643-648.
27864 Avhandling_inlaga.indd 124 1/28/08 9:20:40 AM

125
Sen S, Burmeister M, Ghosh D (2004): Meta-analysis of the association between a serotonin transporter promoter polymorphism (5-HTTLPR) and anxiety-related personality traits. Am J Med Genet B Neuropsychiatr Genet 127:85-89.
Sham P, Bader JS, Craig I, O'Donovan M, Owen M (2002): DNA Pooling: a tool for large-scale association studies. Nature reviews 3:862-871.
Silberg J, Rutter M, Neale M, Eaves L (2001): Genetic moderation of environmental risk for depression and anxiety in adolescent girls. Br J Psychiatry 179:116-121.
Simmons A, Stein MB, Matthews SC, Feinstein JS, Paulus MP (2006): Affective ambiguity for a group recruits ventromedial prefrontal cortex. NeuroImage 29:655-661.
Simpson TI, Price DJ (2002): Pax6; a pleiotropic player in development. Bioessays 24:1041-1051.
Smidt MP, Smits SM, Burbach JP (2003): Molecular mechanisms underlying midbrain dopamine neuron development and function. Eur J Pharmacol 480:75-88.
Smith RS, Zabaleta A, Kume T, Savinova OV, Kidson SH, Martin JE, et al (2000): Haploinsufficiency of the transcription factors FOXC1 and FOXC2 results in aberrant ocular development. Human molecular genetics 9:1021-1032.
Smith RT (1965): A comparison of socioenvironmnetal factors in monozygotic and dizygot twins, testing an assumption. In: Vandenberg SG editor. Methos and goals in human behavior genetics. New York: Academic Press.
Spotts EL, Lichtenstein P, Pedersen N, Neiderhiser JM, Hansson K, Cederblad M, et al (2005): Personality and Marital Satisfaction: A Behavioural Genetic Analysis. European Journal of Personality 19:205-227.
Stattin H, Magnusson D (1996): Antisocial development: A holistic approach. Development and Psychopathology 8:617-645.
Stein LD (2004): Human genome: end of the beginning. Nature 431:915-916.
Strous RD, Bark N, Parsia SS, Volavka J, Lachman HM (1997): Analysis of a functional catechol-O-methyltransferase gene polymorphism in schizophrenia: evidence for association with aggressive and antisocial behavior. Psychiatry Res 69:71-77.
Sturm RA, Frudakis TN (2004): Eye colour: portals into pigmentation genes and ancestry. Trends Genet 20:327-332.
Sutton SK, Davidson RJ (1997): Prefrontal brain asymmetry: A biological substrate of the behavioral approach and inhibition systems. Psychological Science 8:204-210.
Syvanen AC, Tilgmann C, Rinne J, Ulmanen I (1997): Genetic polymorphism of catechol-O-methyltransferase (COMT): correlation of genotype with individual variation of S-COMT activity and comparison of the allele frequencies in the
124
Rutter M, Plomin R (1997): Opportunities for psychiatry from genetic findings. Br J Psychiatry 171:209-219.
Rutter M, Silberg J (2002): Gene-environment interplay in relation to emotional and behavioral disturbance. Annual review of psychology 53:463-490.
Sabol SZ, Hu S, Hamer D (1998): A functional polymorphism in the monoamine oxidase A gene promoter. Hum Genet 103:273-279.
Saklofske DH, Zeidner M, Deary IJ, Austin EJ, Matthews G, Sternberg R (1999): The intelligence-personality interface: Prospects for integration. In: Mervielde I, de Fruyt F, Ostendorf F editors. Personality Psychology in Europe, Vol 7: Tilburg: Tilburg University Press, pp 235-262.
Sale MM, Craig JE, Charlesworth JC, FitzGerald LM, Hanson IM, Dickinson JL, et al (2002): Broad phenotypic variability in a single pedigree with a novel 1410delC mutation in the PST domain of the PAX6 gene. Hum Mutat 20:322.
Sali A, Kuriyan J (1999): Challenges at the frontiers of structural biology. Trends Cell Biol 9:M20-24.
Sarnat HB, Flores-Sarnat L (2005): Embryology of the neural crest: its inductive role in the neurocutaneous syndromes. J Child Neurol 20:637-643.
Satagopan JM, Elston RC (2003): Optimal two-stage genotyping in population-based association studies. Genetic epidemiology 25:149-157.
Saudino KJ, Pedersen NL, Lichtenstein P, McClearn GE, et al. (1997): Can personality explain genetic influences on life events? Journal of Personality and Social Psychology 72:196-206.
Scarr S (1968): Environmental bias in twin studies. Eugen Q 15:34-40.
Scarr S (1992): Developmental therories for the 1990s: Development and individual differences. Child Development 63:1-19.
Scarr S editor (1997): The development of individual differences in intelligence and personality. Hillsdale, NJ, England: Lawrence Erlbaum Associates, Inc.
Scarr S, Carter Saltzman L (1979): Twin method: Defense of a critical assumption. Behavior genetics 9:527-542.
Scarr S, Webber PL, Weinberg RA, Wittig MA (1981): Personality resemblance among adolescents and their parents in biologically related and adoptive families. Journal of Personality and Social Psychology 40:885-898.
Schedl A, Ross A, Lee M, Engelkamp D, Rashbass P, van Heyningen V, et al (1996): Influence of PAX6 gene dosage on development: overexpression causes severe eye abnormalities. Cell 86:71-82.
Schinka JA, Letsch EA, Crawford FC (2002): DRD4 and novelty seeking: results of meta-analyses. American journal of medical genetics 114:643-648.
27864 Avhandling_inlaga.indd 125 1/28/08 9:20:41 AM

127
Wahlsten D (1990): Insensitivity of the analysis of variance to heredity^environment interaction. Behavioral and Brain Sciences 13:109-161.
Wallis DE, Muenke M (1999): Molecular mechanisms of holoprosencephaly. Mol Genet Metab 68:126-138.
Van Gestel S, Van Broeckhoven C (2003): Genetics of personality: Are we making progress? Molecular psychiatry 8:840-852.
Van Heyningen V, Williamson KA (2002): PAX6 in sensory development. Human molecular genetics 11:1161-1167.
van Os J, Park SB, Jones PB (2001): Neuroticism, life events and mental health: evidence for person-environment correlation. Br J Psychiatry Suppl 40:s72-77.
van Wezel T, Stassen AP, Moen CJ, Hart AA, van der Valk MA, Demant P (1996): Gene interaction and single gene effects in colon tumour susceptibility in mice. Nature genetics 14:468-470.
Vandell DL (2000): Parents, peer groups, and other socializing influences. Developmental Psychology 36:699-710.
Weinmaster G (1997): The ins and outs of notch signaling. Mol Cell Neurosci 9:91-102.
Weiss KM, Terwilliger JD (2000): How many diseases does it take to map a gene with SNPs? Nature genetics 26:151-157.
Wheeler RE, Davidson RJ, Tomarken AJ (1993): Frontal brain asymmetry and emotional reactivity: a biological substrate of affective style. Psychophysiology 30:82-89.
Wiberg A, Gottfries CG, Oreland L (1977): Low platelet monoamine oxidase activity in human alcoholics. Med Biol 55:181-186.
Wichers MC, Purcell S, Danckaerts M, Derom C, Derom R, Vlietinck R, et al (2002): Prenatal life and post-natal psychopathology: Evidence for negative gene-birth weight interaction. Psychological Medicine 32:1165-1174.
Widom CS (1997): Handbook of Antisocial Behavior. In: Stuff DM, Breiling JD editors: Wiley, New York.
Viken RJ, Rose RJ, Kaprio J, Koskenvuo M (1994): A developmental genetic analysis of adult personality: extraversion and neuroticism from 18 to 59 years of age. J Pers Soc Psychol 66:722-730.
Wilkerson CL, Syed NA, Fisher MR, Robinson NL, Wallow IH, Albert DM (1996): Melanocytes and iris color. Light microscopic findings. Archives of ophthalmology 114:437-442.
Willis-Owen SA, Flint J (2006): The genetic basis of emotional behaviour in mice. Eur J Hum Genet 14:721-728.
126
normal population and parkinsonian patients in Finland. Pharmacogenetics 7:65-71.
Tambs K, Harris JR, Magnus P (1995): Sex-specific causal factors and effects of common environment for symptoms of anxiety and depression in twins. Behavior genetics 25:33-44.
Tang MX, Maestre G, Tsai WY, Liu XH, Feng L, Chung WY, et al (1996): Relative risk of Alzheimer disease and age-at-onset distributions, based on APOE genotypes among elderly African Americans, Caucasians, and Hispanics in New York City. American journal of human genetics 58:574-584.
Tang MX, Stern Y, Marder K, Bell K, Gurland B, Lantigua R, et al (1998): The APOE-epsilon4 allele and the risk of Alzheimer disease among African Americans, whites, and Hispanics. Jama 279:751-755.
Tellegen A, Lykken DT, Bouchard TJ, Wilcox KJ, et al. (1988): Personality similarity in twins reared apart and together. Journal of Personality and Social Psychology 54:1031-1039.
Terwilliger JD, Weiss KM (1998): Linkage disequilibrium mapping of complex disease: fantasy or reality? Current opinion in biotechnology 9:578-594.
Thayer JF, Lane RD (2000): A model of neurovisceral integration in emotion regulation and dysregulation. Journal of Affective Disorders 61:201-216.
Thomas CD (2006): Are we redy for genome-wide association studies? Cancer Epidemiol Biomarkers Prev 15:595-598.
Thomson P (2004): The Impact of Trauma on the Embryo and Fetus: An Application of the Diathesis-Stress Model and the Neurovulnerability-Neurotoxicity Model. Journal of Prenatal & Perinatal Psychology & Health 19:392-402.
Torgersen AM, Janson H (2002): Why do identical twins differ in personality: shared environment reconsidered. Twin Res 5:44-52.
Trainor PA, Tam PP (1995): Cranial paraxial mesoderm and neural crest cells of the mouse embryo: co-distribution in the craniofacial mesenchyme but distinct segregation in branchial arches. Development 121:2569-2582.
Tremblay RE, Nagin DS, Seguin JR, Zoccolillo M, Zelazo PD, Boivin M, et al (2004): Physical aggression during early childhood: trajectories and predictors. Pediatrics 114:e43-50.
Turbes CC (1993): Brain self-organization dynamics. Biomed Sci Instrum 29:135-146.
Turkheimer E, Waldron M (2000): Nonshared environment: A theoretical, methodological, and quantitative review. Psychological Bulletin 126:78-108.
Tzoulaki I, White IM, Hanson IM (2005): PAX6 mutations: genotype-phenotype correlations. BMC Genet 6:27.
27864 Avhandling_inlaga.indd 126 1/28/08 9:20:41 AM

127
Wahlsten D (1990): Insensitivity of the analysis of variance to heredity^environment interaction. Behavioral and Brain Sciences 13:109-161.
Wallis DE, Muenke M (1999): Molecular mechanisms of holoprosencephaly. Mol Genet Metab 68:126-138.
Van Gestel S, Van Broeckhoven C (2003): Genetics of personality: Are we making progress? Molecular psychiatry 8:840-852.
Van Heyningen V, Williamson KA (2002): PAX6 in sensory development. Human molecular genetics 11:1161-1167.
van Os J, Park SB, Jones PB (2001): Neuroticism, life events and mental health: evidence for person-environment correlation. Br J Psychiatry Suppl 40:s72-77.
van Wezel T, Stassen AP, Moen CJ, Hart AA, van der Valk MA, Demant P (1996): Gene interaction and single gene effects in colon tumour susceptibility in mice. Nature genetics 14:468-470.
Vandell DL (2000): Parents, peer groups, and other socializing influences. Developmental Psychology 36:699-710.
Weinmaster G (1997): The ins and outs of notch signaling. Mol Cell Neurosci 9:91-102.
Weiss KM, Terwilliger JD (2000): How many diseases does it take to map a gene with SNPs? Nature genetics 26:151-157.
Wheeler RE, Davidson RJ, Tomarken AJ (1993): Frontal brain asymmetry and emotional reactivity: a biological substrate of affective style. Psychophysiology 30:82-89.
Wiberg A, Gottfries CG, Oreland L (1977): Low platelet monoamine oxidase activity in human alcoholics. Med Biol 55:181-186.
Wichers MC, Purcell S, Danckaerts M, Derom C, Derom R, Vlietinck R, et al (2002): Prenatal life and post-natal psychopathology: Evidence for negative gene-birth weight interaction. Psychological Medicine 32:1165-1174.
Widom CS (1997): Handbook of Antisocial Behavior. In: Stuff DM, Breiling JD editors: Wiley, New York.
Viken RJ, Rose RJ, Kaprio J, Koskenvuo M (1994): A developmental genetic analysis of adult personality: extraversion and neuroticism from 18 to 59 years of age. J Pers Soc Psychol 66:722-730.
Wilkerson CL, Syed NA, Fisher MR, Robinson NL, Wallow IH, Albert DM (1996): Melanocytes and iris color. Light microscopic findings. Archives of ophthalmology 114:437-442.
Willis-Owen SA, Flint J (2006): The genetic basis of emotional behaviour in mice. Eur J Hum Genet 14:721-728.
126
normal population and parkinsonian patients in Finland. Pharmacogenetics 7:65-71.
Tambs K, Harris JR, Magnus P (1995): Sex-specific causal factors and effects of common environment for symptoms of anxiety and depression in twins. Behavior genetics 25:33-44.
Tang MX, Maestre G, Tsai WY, Liu XH, Feng L, Chung WY, et al (1996): Relative risk of Alzheimer disease and age-at-onset distributions, based on APOE genotypes among elderly African Americans, Caucasians, and Hispanics in New York City. American journal of human genetics 58:574-584.
Tang MX, Stern Y, Marder K, Bell K, Gurland B, Lantigua R, et al (1998): The APOE-epsilon4 allele and the risk of Alzheimer disease among African Americans, whites, and Hispanics. Jama 279:751-755.
Tellegen A, Lykken DT, Bouchard TJ, Wilcox KJ, et al. (1988): Personality similarity in twins reared apart and together. Journal of Personality and Social Psychology 54:1031-1039.
Terwilliger JD, Weiss KM (1998): Linkage disequilibrium mapping of complex disease: fantasy or reality? Current opinion in biotechnology 9:578-594.
Thayer JF, Lane RD (2000): A model of neurovisceral integration in emotion regulation and dysregulation. Journal of Affective Disorders 61:201-216.
Thomas CD (2006): Are we redy for genome-wide association studies? Cancer Epidemiol Biomarkers Prev 15:595-598.
Thomson P (2004): The Impact of Trauma on the Embryo and Fetus: An Application of the Diathesis-Stress Model and the Neurovulnerability-Neurotoxicity Model. Journal of Prenatal & Perinatal Psychology & Health 19:392-402.
Torgersen AM, Janson H (2002): Why do identical twins differ in personality: shared environment reconsidered. Twin Res 5:44-52.
Trainor PA, Tam PP (1995): Cranial paraxial mesoderm and neural crest cells of the mouse embryo: co-distribution in the craniofacial mesenchyme but distinct segregation in branchial arches. Development 121:2569-2582.
Tremblay RE, Nagin DS, Seguin JR, Zoccolillo M, Zelazo PD, Boivin M, et al (2004): Physical aggression during early childhood: trajectories and predictors. Pediatrics 114:e43-50.
Turbes CC (1993): Brain self-organization dynamics. Biomed Sci Instrum 29:135-146.
Turkheimer E, Waldron M (2000): Nonshared environment: A theoretical, methodological, and quantitative review. Psychological Bulletin 126:78-108.
Tzoulaki I, White IM, Hanson IM (2005): PAX6 mutations: genotype-phenotype correlations. BMC Genet 6:27.
27864 Avhandling_inlaga.indd 127 1/28/08 9:20:42 AM

128
Willis-Owen SAG, Turri MG, Munafò MR, Surtees PG, Wainwright NWJ, Brixey RD, et al (2005): The Serotonin Transporter Length Polymorphism, Neuroticism, and Depression: A Comprehensive Assessment of Association. Biological Psychiatry 58:451-456.
Wilson AF, Elston RC, Sellers TA, Bailey-Wilson JE, Gersting JM, Deen DK, et al (1990): Stepwise oligogenic segregation and linkage analysis illustrated with dopamine-beta-hydroxylase activity. American journal of medical genetics 35:425-432.
Winblad B, Bucht G, Gottfries CG, Roos BE (1979): Monoamines and monoamine metabolites in brains from demented schizophrenics. Acta Psychiatrica Scandinavica 60:17-28.
Wirbelauer C, Karandish A, Haberle H, Pham DT (2005): Noncontact goniometry with optical coherence tomography. Archives of ophthalmology 123:179-185.
Wistow G, Berstein SL, Ray S, Wyatt MK, Behal A, Touchman JW, et al (2002): Expressed sequence tag analysis of adult human iris for the NEIBank Project: steroid-response factors and similarities with retinal pigment epithelium. Mol Vis 8:185-195.
Vogt BA, Nimchinsky EA, Vogt LJ, Hof PR (1995): Human cingulate cortex: surface features, flat maps, and cytoarchitecture. J Comp Neurol 359:490-506.
Xian H, Scherrer JF, Eisen SA, True WR, Heath AC, Goldberg J, et al (2000): Self-Reported zygosity and the equal-environments assumption for psychiatric disorders in the Vietnam Era Twin Registry. Behavior genetics 30:303-310.
Yavuzer U, Keenan E, Lowings P, Vachtenheim J, Currie G, Goding CR (1995): The Microphthalmia gene product interacts with the retinoblastoma protein in vitro and is a target for deregulation of melanocyte- specific transcription. Oncogene 10:123-134.
Young SE, Smolen A, Hewitt JK, Haberstick BC, Stallings MC, Corley RP, et al (2006): Interaction between MAO-A genotype and maltreatment in the risk for conduct disorder: failure to confirm in adolescent patients. The American journal of psychiatry 163:1019-1025.
27864 Avhandling_inlaga.indd 128 1/28/08 9:20:42 AM

128
Wilkerson CL, Syed NA, Fisher MR, Robinson NL, Wallow IH, Albert DM (1996): Melanocytes and iris color. Light microscopic findings. Archives of ophthalmology 114:437-442.
Willis-Owen SA, Flint J (2006): The genetic basis of emotional behaviour in mice. Eur J Hum Genet 14:721-728.
Willis-Owen SAG, Turri MG, Munafò MR, Surtees PG, Wainwright NWJ, Brixey RD, et al (2005): The Serotonin Transporter Length Polymorphism, Neuroticism, and Depression: A Comprehensive Assessment of Association. Biological Psychiatry 58:451-456.
Wilson AF, Elston RC, Sellers TA, Bailey-Wilson JE, Gersting JM, Deen DK, et al (1990): Stepwise oligogenic segregation and linkage analysis illustrated with dopamine-beta-hydroxylase activity. American journal of medical genetics 35:425-432.
Winblad B, Bucht G, Gottfries CG, Roos BE (1979): Monoamines and monoamine metabolites in brains from demented schizophrenics. Acta Psychiatrica Scandinavica 60:17-28.
Wirbelauer C, Karandish A, Haberle H, Pham DT (2005): Noncontact goniometry with optical coherence tomography. Archives of ophthalmology 123:179-185.
Wistow G, Berstein SL, Ray S, Wyatt MK, Behal A, Touchman JW, et al (2002): Expressed sequence tag analysis of adult human iris for the NEIBank Project: steroid-response factors and similarities with retinal pigment epithelium. Mol Vis 8:185-195.
Vogt BA, Nimchinsky EA, Vogt LJ, Hof PR (1995): Human cingulate cortex: surface features, flat maps, and cytoarchitecture. J Comp Neurol 359:490-506.
Xian H, Scherrer JF, Eisen SA, True WR, Heath AC, Goldberg J, et al (2000): Self-Reported zygosity and the equal-environments assumption for psychiatric disorders in the Vietnam Era Twin Registry. Behavior genetics 30:303-310.
Yavuzer U, Keenan E, Lowings P, Vachtenheim J, Currie G, Goding CR (1995): The Microphthalmia gene product interacts with the retinoblastoma protein in vitro and is a target for deregulation of melanocyte- specific transcription. Oncogene 10:123-134.
Young SE, Smolen A, Hewitt JK, Haberstick BC, Stallings MC, Corley RP, et al (2006): Interaction between MAO-A genotype and maltreatment in the risk for conduct disorder: failure to confirm in adolescent patients. The American journal of psychiatry 163:1019-1025.

ASDSADFDFSDDDDDDDDDDDDDDDDDDDDDDDDDDDDDDDDDDDDDDDDDDDSTUDY I

ASDSADFDFSDDDDDDDDDDDDDDDDDDDDDDDDDDDDDDDDDDDDDDDDDDDSTUDY I

192 Twin Research Volume 6 Number 3 pp. 192±200
The�relative�importance�of�genetic�influences�(heritability)�onfive�general�textural�quality�characteristics�of�the�human�iris
was�assessed� using�sex�and�age� limitation� models.�Colourphotographs� of� irises�were�available� from� 100� monozygotictwin�pairs,�99�dizygotic�twin�pairs,�and�99�unrelated�randomlypaired�age-matched�German�subjects.� Comparative� scaleswere�constructed�and�two�judges�who�were�blind�to�zygosityindependently�rated�five�characteristic�of�the�subjects’�left�iris.Inter-rater�reliabilities�were� larger�than� .90� for� all� five�scales.The� heritabilities� for� the� five� iris�characteristics� ranged�from.51–.90.�No�sex-specific�genetic�factors�were�found�for�the�irischaracteristics.�Age-group� differences�in� heritability�werefound�for� one�of� the� five� iris�characteristics�—� “distinction�ofwhite�dot� rings”.� Heritability�was�greater�for� the�older�cohort(90%)� than� the� younger�(73%).�The� iris�characteristics�thatshowed�the� next�highest�additive-genetic� effect�were�“con-tractional� furrows”� (78%)� and�“frequency� of� crypts”� in� themain�stroma�leaf�(66%).
Little is known about the relative importance of geneticinfluences on textural quality of the human iris, although anumber of genes (Pax6, Cox-1, Cox-2, NF1, VEGF,Ezerin, IR 185/OPTC), are expressed in the iris as well asthroughout the central nervous system. Nevertheless, theirrelative importance for variation in iris textural qualities isnot known.
In the few studies reported, iris features are highly heri-table. The heritability for eye color in the Louisville TwinStudy (Bito et al., 1997) was .98. Intra-pair differences for30 iris characteristics were such that Burkhardt (1992) con-cluded that nine of these traits were heritable, althoughheritability was not estimated. These findings, in conjunc-tion with the gene expression studies, suggest that iris char-acteristics other than color may be heritable.
Two unpublished studies show that there may be a rela-tionship between specific textural characteristics of the irisand the personality (Bruno, 1990; Larsson, 1998). Sevenout of 11 iris features were significantly correlated with per-sonality factors (Bruno, 1990). The strongest relationshipwas between extraversion and crypts in the main stromaleaf (r = .23, p < .001, n = 208). However, simply evaluat-ing phenotypic associations between iris characteristics and personality traits does not say anything about whetherthe associations reflect shared genetic mechanisms. To answer that question, heritability for the specific irischaracteristic as well as personality must be estimated in thesame twin sample.
Past results are suggestive but before any conclusionsconcerning the validity of the relationships can be made,the relative importance of genetic effects for different tex-tural quality characteristics in the iris must be demon-strated. The present study investigates whether texturaldifferences in the iris can be used as a biomarker, presum-ably for a cluster of genes that is expressed in the iris (andputatively in the CNS), by estimating the relative impor-tance of genetic effects for five general textural characteris-tics. We evaluated the nature of individual differences infive iris features in a sample of like and unlike-sexed twinsand unrelated randomly paired age matched dyads.
Materials and MethodsSample
Data for this study came from a German sample (Burkhardt,1992) of 100 monozygotic twin pairs (54 male-male, 46female-female), 99 dizygotic pairs (27 male-male, 34 female-female, 39 male-female) and 99 age-matched randomlypaired, unrelated subjects (22 male-male, 28 female-female,49 male-female). The mean age for the MZ, DZ and unre-lated subjects was 20.1 (5–70 years, SD = 12.4); 20.5 (4–72years, SD = 12.3) and 27.5, (4–78 years, SD = 9.2), respec-tively. All were healthy volunteers who were recruitedthrough advertising in the town Braunschweig close toHanover, Germany. The human subjects committee atBraunschweig University reviewed the research protocol.Black and white photographs were taken of the face (frontand profile), mouth, eye area, nose and ears, and close-upcolor photographs were taken of the subjects’ irises.
Zygosity was established by comparing intra-pair simi-larity for 10 physical characteristics of the head, includingeye color, hair type, and shape of the ears. The attributeswere selected on the basis of the diagnostic rules developed by Nichols & Bilbro (1966). Two of the twin pairs who claimed to be monozygotic had too large intra-pairdifferences to be accepted by the algorithm and wereexcluded from the sample.
Importance of Genetic Effects for Characteristics of the Human Iris
Mats�Larsson1,�Nancy�L.�Pedersen2,�and�Håkan�Stattin1
1 Department�of�Behavioral, Social�and�Legal�Sciences, Center�for�Developmental�Research, Örebro�University, Sweden2 Department�of�Medical�Epidemiology, Karolinska�Institutet, Stockholm, Sweden
Address� for�correspondence:�Mats�Larsson,�Department�ofBehavioral,�Social�and�Legal�Sciences,�Center�for�DevelopmentalResearch,�Örebro�University,�701�82�Örebro,�Sweden.�Email:[email protected]

192 Twin Research Volume 6 Number 3 pp. 192±200
The�relative�importance�of�genetic�influences�(heritability)�onfive�general�textural�quality�characteristics�of�the�human�iris
was�assessed� using�sex�and�age� limitation� models.�Colourphotographs� of� irises�were�available� from� 100� monozygotictwin�pairs,�99�dizygotic�twin�pairs,�and�99�unrelated�randomlypaired�age-matched�German�subjects.� Comparative�scaleswere�constructed�and�two�judges�who�were�blind�to�zygosityindependently�rated�five�characteristic�of�the�subjects’�left�iris.Inter-rater�reliabilities�were� larger�than� .90� for� all� five�scales.The� heritabilities� for� the� five� iris�characteristics� ranged�from.51–.90.�No�sex-specific�genetic�factors�were�found�for�the�irischaracteristics.�Age-group� differences�in� heritability�werefound�for� one�of� the� five� iris�characteristics�—� “distinction�ofwhite�dot� rings”.� Heritability�was�greater�for� the�older�cohort(90%)� than� the� younger�(73%).�The� iris�characteristics�thatshowed�the� next�highest�additive-genetic� effect�were�“con-tractional� furrows”� (78%)� and�“frequency� of� crypts”� in� themain�stroma�leaf�(66%).
Little is known about the relative importance of geneticinfluences on textural quality of the human iris, although anumber of genes (Pax6, Cox-1, Cox-2, NF1, VEGF,Ezerin, IR 185/OPTC), are expressed in the iris as well asthroughout the central nervous system. Nevertheless, theirrelative importance for variation in iris textural qualities isnot known.
In the few studies reported, iris features are highly heri-table. The heritability for eye color in the Louisville TwinStudy (Bito et al., 1997) was .98. Intra-pair differences for30 iris characteristics were such that Burkhardt (1992) con-cluded that nine of these traits were heritable, althoughheritability was not estimated. These findings, in conjunc-tion with the gene expression studies, suggest that iris char-acteristics other than color may be heritable.
Two unpublished studies show that there may be a rela-tionship between specific textural characteristics of the irisand the personality (Bruno, 1990; Larsson, 1998). Sevenout of 11 iris features were significantly correlated with per-sonality factors (Bruno, 1990). The strongest relationshipwas between extraversion and crypts in the main stromaleaf (r = .23, p < .001, n = 208). However, simply evaluat-ing phenotypic associations between iris characteristics and personality traits does not say anything about whetherthe associations reflect shared genetic mechanisms. To answer that question, heritability for the specific irischaracteristic as well as personality must be estimated in thesame twin sample.
Past results are suggestive but before any conclusionsconcerning the validity of the relationships can be made,the relative importance of genetic effects for different tex-tural quality characteristics in the iris must be demon-strated. The present study investigates whether texturaldifferences in the iris can be used as a biomarker, presum-ably for a cluster of genes that is expressed in the iris (andputatively in the CNS), by estimating the relative impor-tance of genetic effects for five general textural characteris-tics. We evaluated the nature of individual differences infive iris features in a sample of like and unlike-sexed twinsand unrelated randomly paired age matched dyads.
Materials and MethodsSample
Data for this study came from a German sample (Burkhardt,1992) of 100 monozygotic twin pairs (54 male-male, 46female-female), 99 dizygotic pairs (27 male-male, 34 female-female, 39 male-female) and 99 age-matched randomlypaired, unrelated subjects (22 male-male, 28 female-female,49 male-female). The mean age for the MZ, DZ and unre-lated subjects was 20.1 (5–70 years, SD = 12.4); 20.5 (4–72years, SD = 12.3) and 27.5, (4–78 years, SD = 9.2), respec-tively. All were healthy volunteers who were recruitedthrough advertising in the town Braunschweig close toHanover, Germany. The human subjects committee atBraunschweig University reviewed the research protocol.Black and white photographs were taken of the face (frontand profile), mouth, eye area, nose and ears, and close-upcolor photographs were taken of the subjects’ irises.
Zygosity was established by comparing intra-pair simi-larity for 10 physical characteristics of the head, includingeye color, hair type, and shape of the ears. The attributeswere selected on the basis of the diagnostic rules developed by Nichols & Bilbro (1966). Two of the twin pairs who claimed to be monozygotic had too large intra-pairdifferences to be accepted by the algorithm and wereexcluded from the sample.
Importance of Genetic Effects for Characteristics of the Human Iris
Mats�Larsson1,�Nancy�L.�Pedersen2,�and�Håkan�Stattin1
1 Department�of�Behavioral, Social�and�Legal�Sciences, Center�for�Developmental�Research, Örebro�University, Sweden2 Department�of�Medical�Epidemiology, Karolinska�Institutet, Stockholm, Sweden
Address� for�correspondence:�Mats�Larsson,�Department�ofBehavioral,�Social�and�Legal�Sciences,�Center�for�DevelopmentalResearch,�Örebro�University,�701�82�Örebro,�Sweden.�Email:[email protected]
ST
UD
Y I

194 Twin Research June 2003
Mats Larsson, Nancy L. Pedersen, and HŒkan Stattin
each rating session. After each session, the reliability waschecked and discrepancies between the ratings were dis-cussed together with the test leader. Inter-rater reliabilityfor the scales ranged from .91–.97.
Analysis
The raters’ judgment of which scale step each photo wasmost similar to was scored as a continuous variable. All fivescales were positively skewed, and for this reason the scoreswere log-transformed. A regression procedure was thenapplied to the transformed scores to produce residuals con-trolling for sex and age, respectively (McGue & Bouchard,1984). These residuals were thereafter used to computevariance-covariance matrices for MZ, like-sexed DZ, andunlike-sexed DZ pairs, using SPSS.
To use all twin groups simultaneously, estimate geneticand environmental parameters, and test for sex specificityand age effects, maximum-likelihood model fitting usingthe structural equation modeling package Mx (Neale,1999) was undertaken. The variance-covariance matricesused for testing sex specificity were based on the residualscontrolling for age and the matrices for testing age effectswere based on residuals controlling for sex.
In order to (1) estimate the magnitude of genetic andenvironmental effects in males and females separately and(2) determine whether the same set of genes or shared envi-ronmental experiences influence the characteristics in malesand females, four models were tested (Neale, 1999). Forvariables where non-additive genetic effects were indicated(i.e., rDZ < 1/2 rMZ), the models included additive geneticfactors (a 2), non-additive genetic factors (d 2), and non-shared environmental factors (c 2). For the other variables(i.e., rDZ > 1/2 rMZ), shared environmental factors (c 2), wereincluded, but not non-additive genetic factors (d 2).
The first model allowed different values for the threeparameters for males and females and also estimated a malespecific genetic effect (a’m or d’m). This model allowed theestimates of the relative importance of the three latentfactors (i.e., values of a 2, c 2 or d 2, and e 2) to differ for menand women, as well as a male specific genetic effect indicat-ing qualitative differences. The second model was like thefirst except that the male specific parameter was fixed at 0,testing whether or not the qualitative difference was signifi-cant. In the third model parameters a2, c2 or d 2, and e 2 werefixed to be equal for men and women, and a’m or d’m fixed
to 0. The fourth model was like the third except that theshared-environmental or non-additive genetic parameterfor men and women was fixed at 0 — the most parsimo-nious model.
In order to test for age effects, the twin material wasdivided into two age groups where the younger cohort wasbetween 4–24 years (nMZ = 74; nDZ = 78 pairs), and theolder was between 25–72 years of age (nMZ = 26; nDZ = 21pairs). Three models were used to test for potential ageeffects (Neale & Cardon, 1992). The first model estimatedthe parameters a 2 and e 2 using the information from 4 twingroups simultaneously (both the younger and older cohortsof MZ and all DZ twin pairs) constraining the estimates tobe the same. The second and the third model estimated theparameters a 2 and e 2 for the older and younger cohort,respectively. A formal test of heterogeneity is then c 2
model 1 –(c 2
model 2 + c 2model 3). Testing for age effects was only per-
formed for those iris characteristics for which no sex-spe-cific factors were found.
ResultsInter-rater Reliability
Two raters judged each photograph for frequency of cryptsin the iris stroma leaf, iris color, distinction of white dotrings, and distinction of contractional furrows in the iris.For the scale that measured frequency of nevi, the inter-rater reliability for the first 51% of the sample was so high(.97) that it was evident that it would be sufficient to haveonly one judge rate the rest of the sample.
The inter-rater reliabilities for scales 1 to 5 are shown inTable 1. The Spearman-Brown inter-rater reliability, whichestimates the reliability of the average individual rater(mean reliability), was consistently high for all five scales.The Spearman-Brown aggregated reliabilities, which esti-mate the reliability of two raters simultaneously, were alsovery high.
Descriptive Statistics
Table 2 summarizes means and standard deviations of thefive iris characteristics for the MZ and DZ twin pairs.Mean differences between MZ and DZ twins were foundon the scale that measured frequency of nevi and distinc-tion of contractional furrows. Likewise, variances differedon the scale that measures iris color. No other mean or
Table 1
Inter-rater Reliability for Scales of Iris Characteristics
Number of Inter-rater Aggregated
Scale/Iris Characteristics Raters/Observations Reliability1 Reliability1
1. Frequency of crypts 2/5762 .91 .95
2. Frequency of nevi 2/3103 .96 .97
3. Iris color 2/5842 .91 .95
4. Distinction of white dot rings 2/5892 .83 .91
5. Distinction of contractional furrows 2/5892 .91 .95Note: 1 The Spearman-Brown formula.
2All photos in the sample except those used in the scales and for definitions.3 51% of the total sample.
193Twin Research June 2003
Genetic Effects for Characteristics of the Human Iris
Material
A stereomicroscope (ZISS-Universalspaltlampe 30 SL/M)with an attached camera (Pentax 1000) with a 125 mm lenswas used to obtain color photographs of the subjects’ irises.The exposure time was < 1/1000 seconds and set automati-cally by the flash exposure control. The shutter speed on thecamera was set to 1/60 and the aperture was set to 32. Allrolls of film used for the twins had the same charge number.Close-up color photos (where the diameter of the iris on theslide was about 22 mm) were taken of both irises from allsubjects. The photo slides of the subjects’ irises were placedon 12 CD-rom discs. The quality of the transformationfrom slide positives to the images on the CD-rom waschosen through Kodak’s Photo-CD (5 levels, 3072 ´ 2048pixels). The photos were viewed on a high contrast colorcomputer screen (Brand: Eizo; Model: FlexScan F55) with1024 ´ 768 / 85 Hz resolution (0.28 mm Dot Pitch CRT;fH:27-70 kHz/fV: 50-120 Hz) using the software programPhoto Shop 4.0. Iris photographs and other characteristicsof the sample were purchased from Dr Angelica Burkhardt,Institute for Human Biology, Technical University Carolo-Wilhelmina in Brunswick, Germany.
Comparative Scale Construction
For each iris characteristic, selected photographs werechosen from the entire sample of all pictures to representthe endpoints of each comparative scale. The photos repre-senting the endpoints were found by looking through allphotos in the sample and pinpointing the most representa-tive among the most extreme on the iris characteristic ofinterest. Photos in the steps between the endpoints werealso selected to represent points distributed between endpoints, as equally as possible. Five continuous scales wereconstructed in this way by the first author. All scales hadfive scale steps except the scale for eye color which had four
scale steps (blue, grey, hazel and brown). The iris character-istics of interest for each scale are illustrated in Figure 1.
The Rating Catalog
Specially trained raters independently reviewed the pho-tographs of the left iris and judged which scale step towhich each photo was most similar. The raters judged thenumber, size, and distinctiveness of the crypts, as well as thenevi, the white dots, the contractional furrows, and the dif-ferent shades of color. Two raters, blind to zygosity, reviewedeach photograph. In order to secure reliable estimates,detailed rules were created for the raters. The rules made ref-erence to photos that exemplified what the raters should dowhen they were confronted with iris photos that laybetween two scale steps. From 8 to 13 photos per scale wereselectively chosen for this purpose. The written decisionrules and the photos for the scales are available from the firstauthor on request. In all, seven photos from MZ twins,eight photos from DZ twins, and 75 photos from the groupof unrelated individuals were used as examples in the scalesor as reference photos. These photos were included in thetwin analyses but not used in reliability testing.
Rating Procedure
At all times, the ratings were performed in a room withsubdued soft lighting. The raters sat approximately 0.50meter from the computer screen. All photos were presentedat the same magnification (i.e., 66.7% — the diameter ofthe iris spots were 120–130 mm), except for the scale thatmeasured nevi. The magnification for all photos was 100%(i.e., the diameter of the iris spot was then 180–190 mm)for ratings of nevi. The scale was presented to the left of thescreen. The photos that exemplified what the raters shoulddo when they were confronted with iris photos that laybetween two scale steps were accessible as bookmarks pre-sented at the bottom of the screen. The photos to be ratedwere randomly sorted into catalogs, and 100 were rated in
Figure 1
The numbered arrows point toward the iris characteristics of interest. 1 crypts in the main stroma; 2 nevi; 3 iris color; 4 a white dot ring, and 5 a contractional furrow.
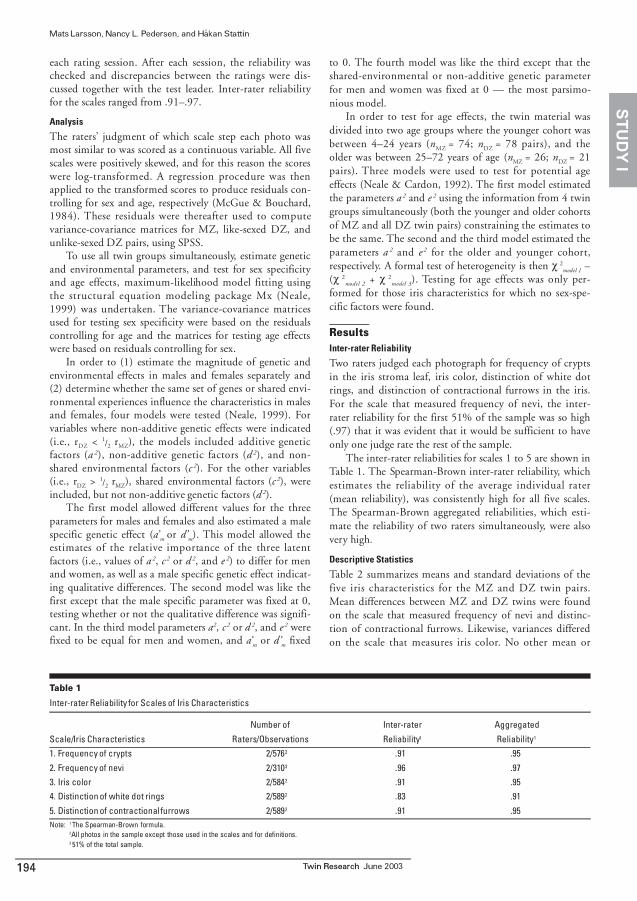
ST
UD
Y I

196 Twin Research June 2003
Mats Larsson, Nancy L. Pedersen, and HŒkan Stattin
younger (73%) (see Table 5). The change in fit betweenmodel 1 (constraining the parameter estimates to be thesame for the older and the younger cohorts) and the sum ofthe chi-squares for models 2 and 3 (separate parameter esti-mates for the younger and older cohort), was significant,change in c 2
2 = 7.30, p < .05.
DiscussionThe heritabilities of five characteristics of the human iriswere substantial and ranged from .51 to .90. Heritability fordistinction of white dot rings was greater for an older(25–72 years) than a younger (4–24 years) cohort. The setof genes that influenced the iris traits as well as their relativeimportance was the same in males and females for all traits.
Candidate genes responsible for variation in iris texturemay be different alleles of Pax6, and its downstream target genes, COX-1, COX-2, NF1, VEGF, Ezrin, IR 185/OPTC, FOXC1, TIGR/GCL1A/ Myocilin, UBL5,RIEG1, BARX1, CB1, TRP-1, TRP-2, OCA1, OCA2,EYCL1, EYCL2, EYCL3, TYRP1 the P gene, and QNR-71(Aksan & Goding, 1998; Anderson et al., 2002; Boissy & Nordlund, 1997; Chang et al., 1999; Damm et al., 2001;Friedman et al., 2001; Friedman et al., 2000; Gould & Walter
2000; Huang & Wenhu, 2000; Jaworksi et al., 1997; Kim etal., 1999; Kivelä et al., 2000; Kulak et al., 1998; Lowings etal., 1992; Lu et al., 1998; Orlow & Brilliant, 1999; Oetting& King, 1999; Procella et al., 2000; Ragge et al., 1993;Rebbeck et al., 2002; Shen et al., 1996; Simpson & Price,2002; Wang et al., 2001; Zehavi et al., 1986) and othergenes that expressed in the iris (Wistow et al., 2002; Wistow,2002). Mutations in the Pax6 gene lead to aniridia, a malfor-mation of the eye, chiefly characterized by iris hypoplasia,and disturbances in the development of the lens, cornea andretina (Glaser, 1992; Gronskov, 2001). This gene is also rec-ognized as one of the most important control genes for theCNS and its expression pattern in the iris and throughoutthe CNS has been reported elsewhere (Chalepakis et al.,1993; Jaworksi, et al., 1997; Mansouri et al., 1994;Simpson & Price, 2002; Stoykova & Gruss, 1994; Walther& Gruss, 1991; Warren et al, 1999; Van Heyningen &Williamson, 2002). Most noteworthy is Pax6 expression inthe amygdala and involvement in the production ofdopamin and noradrenaline neurons (Jaworski & Wistow,1997; Stoykova & Gruss 1994). Family members with amutation in Pax6 show high rates of unusual behaviorincluding disinhibition, impulsive behavior, impaired social
Table 4
Parameter Estimates and Goodness of Fit Statistics for the Five Iris Characteristics of Interest
Males Females Fit Statistics
Model a2 c2 or d 2 e2 a 2 c2 or d 2 e 2 a’m2 or d’m
2 AIC c 2 df pCrypts
1 .62 .051 .33 .64 .011 .35 .002 –2.97 13.03 8 .112 .62 .051 .33 .64 .011 .35 — –4.97 13.03 9 .163EQ .66 .021 .32 .66 .021 .32 — –10.61 13.39 12 .344EQ .66 — .34 .66 — .34 — –12.61 13.39 13 .41
Nevi1 .00 .07 .43 .52 .08 .40 .50 –9.41 6.59 8 .582 .49 .10 .41 .00 .41 .59 — –3.03 14.97 9 .093EQ .58 .00 .42 .58 .00 .42 — –13.74 10.26 11 .594EQ .58 — .42 .58 — .42 — –15.74 10.26 12 .67
Color1 .84 .00 .16 .52 .34 .14 .00 –2.67 13.33 8 .102 .84 .00 .16 .52 .34 .14 — –4.15 13.33 9 .153EQ .51 .34 .15 .51 .34 .15 — –6.00 18.00 12 .124EQ .85 — .15 .85 — .15 — –3.37 22.63 13 .05
White dot rings1 .02 .761 .22 .19 .591 .22 .002 –6.98 9.03 8 .342 .02 .761 .22 .19 .591 .22 — –8.98 9.03 9 .443EQ .00 .781 .22 .00 .781 .22 — –14.62 9.38 12 .674EQ .77 — .23 .77 — .23 — –10.69 15.31 13 .29
Cont. furrows1 .30 .121 .25 .43 .381 .19 .332 –11.89 4.11 8 .852 .34 .411 .25 .81 .001 .19 — –13.33 4.67 9 .863EQ .81 .001 .19 .81 .001 .19 — –18.32 5.68 12 .934EQ .78 — .22 .78 — .22 — –18.84 7.16 13 .89
Note: Best fitting model when comparing the models is in bold.1Modeled as d 2.2Modeled as d’m
2.
Model 1: all parameters freely estimated.
Model 2: a’m2 or d’m
2 fixed at 0 all other parameters freely estimated.
Model 3EQ: the same parameter values (a2, c2 or d 2, e2) were required for male and females, a’m2 or d’m
2 fixed at 0.
Model 4EQ: c2 or d 2 fixed at 0 for both males and females, the same parameter values (a2, e2) were required for male and females, a’m2 or d’m
2 fixed at 0.
195Twin Research June 2003
Genetic Effects for Characteristics of the Human Iris
variance differences were found between first and secondborn twins, or between MZ and DZ twins.
The intra-class correlations for MZ twins were generallylarger than those for same-sex DZ twins, indicating thatgenetic factors are of importance (see Table 4). For nevi andiris color, the intra-class correlations for MZ twins were lessthan twice as large as for DZ same-sex twins, suggesting aninfluence by shared environmental factors. For the remain-ing three characteristics, non-additive genetic variance wasindicated. When comparing the patterns of intra-class cor-relations between the opposite-sex and like-sexed DZ twinpairs, only frequency of nevi had a markedly lower oppo-site-sex correlation, suggesting that sex-specific factors mayplay a role for this iris characteristic.
Significant differences in intra-class correlationsbetween the young (4–24 years old) and the old cohort(25–72 years old) were evident for crypts in the iris stroma(rDZYOUNG = .44; rDZOLD = .07), distinction of white dot rings(rMZYOUNG = .72; rMZOLD = .90), and iris color (rMZYOUNG = .83;rMZOLD = .93). No other significant differences between theintra-class correlations for the young and the old cohortwere found.
As expected, the intra-class correlations for the age-matched randomly paired unrelated dyads (both the sameand opposite sex dyads) were close to zero and non-signifi-cant for all five iris characteristics. These dyads were notincluded in the model fitting procedure.
Sex Differences and Age Effects
The parameter estimates from the four models are reportedin Table 4 and the parameter estimates and 95% confidence
intervals for the best fitting model are given in Table 5. The relative importance of genetic effects was the same inmales and females for all iris characteristics, although themale specific parameter was significant for frequency ofnevi. Nevertheless, the most parsimonious model for fre-quency of nevi suggested that there were no qualitativegenetic differences between males and females and that theparameter estimates were the same.
Model 4, where the additive genetic, and non-sharedenvironmental factors were constrained to be the same forboth sexes, and the shared-environmental factor or thenon-additive genetic factor were fixed at 0 for both sexesprovided the most parsimonious explanation of the data forall five iris characteristics but eye color and distinction ofwhite dot rings. The shared environmental parameters formales and females for eye color in Model 3 could not beconstrained to be 0 without a worsening in fit (change inc 2
1 between Models 3 and 4 = 4.63, p < .05). The sharedenvironmental parameters were significant primarily due tothe relatively high female DZ and the opposite sexed DZcorrelations. Likewise, the non-additive parameter for dis-tinction of white dot rings in Model 3 could not be con-strained to be 0 without a worsening in fit (change in c 2
1
between Models 3 and 4 = 5.93, p < .05). Distinction ofwhite dot rings was the only variable where a model withnon-additive genetic and non-shared environmental effectsobtained the best fit.
Distinction of white dot rings was the only iris charac-teristics where age effects were evident. The older cohorthad a significantly larger heritability (90%) than the
Table 3
Intra-class Correlation for Five Scales Describing Iris Characteristics in MZ and DZ Twins
Scale / Iris characteristics MZ M DZ M MZ F DZ F DZ OS
Number of pairs n = 46 n = 27 n = 54 n = 33 n = 39
1. Frequency of crypts .69** .04 ns .64** .24 ns .59**
2. Frequency of nevi .60** .29* .57** .51** .05 ns
3. Iris color .87** .26 ns .86** .43** .69**
4. Distinction of white dot rings .75** .07 ns .75** .22 ns .26*
5. Distinction of contractional furrows .74** .32* .83** .28 ns .25 nsNote: **p < .01; *p < .05.
Table 2
Means and Standard Deviations for Five Scales Describing Iris Characteristics in MZ and DZ Twins
MZ (n = 100 pairs) DZ (n = 99 pairs)
Scale / Iris characteristics Mean SD Mean SD1. Frequency of crypts1 2.14 0.90 2.21 0.88
2. Frequency of nevi1, 3 2.03 1.04 1.76 0.99
3. Iris color2, 4 2.32 0.90 2.17 0.79
4. Distinction of white dot rings1 1.40 0.67 1.45 0.77
5. Distinction of contractional furrows1,3 2.25 1.18 1.85 1.12Note: 1 Five scale-steps.
2 Four scale-steps.3 Significant mean differences between MZ and DZ twins (p < .05).4 Significant variance differences between MZ and DZ twins (p < .05).
ST
UD
Y I

The present study analyzed the same material asBurkhardt (1992). However, the results presented in theearlier German study did not allow for estimation of the rel-ative importance of genetic effects. Furthermore, the raterwas not blind to zygosity. Therefore, we chose to repeat therating process, with raters blind to zygosity and using stan-dardized scales that covered the whole range of variabilityfor each iris characteristic in the sample. Another advantagewas that two independent judges rated each photograph,which made it possible to test inter-rater reliability. Inter-rater reliability was substantial, greater than .90 for each ofthe five scales. The most important factor contributing tothe high inter-rater reliability was probably the use of therating catalog and references photos which exemplified ingreat detail what the raters should do when they were con-fronted with photos that fell between two scale steps. Thesecond most important factor was probably feedback givento the raters concerning their inter-rater reliability scoreafter each rating session. Furthermore, all pictures that notall raters judged the same way were discussed with the testleader. This led to a higher score in the next rating session.Despite these methodological differences, there were strikingsimilarities in the results of Burkhardt (1992) and thepresent study. The iris characteristics that were estimated tohave highest heritability in the present study were also con-sidered to be highly heritable by Burkhardt (i.e., eye color,crypts in the main stroma leaf, distinction of white dots anddistinction of contractional furrows).
The random influences on how the iris texture growsand develops over time were combined with measurementerror in the non-shared environmental parameter (e 2),which ranged from .10–.42. The frequency of nevi andcrypts in the iris were most influenced by random factors(Table 5). For most of the characteristics, we believe thatmeasurement error is the most important source of e 2. Inthe case of nevi, however — which has the largest e 2 —developmental changes which can reflect disease later in life(Habour et al., 1995), may be another source of e2.
Methodological Implications for Behavioral Research
The main purpose of the present study was to estimate theheritability of the iris features that had shown the strongestrelationship with personality (Bruno, 1990; Larsson, 1998).An additional purpose was to develop a method for training raters to secure the reliability of the iris tissuetexture estimate. Given the high inter-rater reliabilities and heritabilities for the iris characteristics reported here,we suggest that it may be fruitful to perform additionalstudies that replicate the associations found by Larsson(1998) and Bruno (1990), but that include both personal-ity and iris data collected from twins in order to evaluatewhether the associations reflect genetic correlations amongthe traits. Due to the ethnic stratification of eye color andpersonality (and putatively also of other iris characteris-tics), will it be necessary to conduct within-family tests ofa potential association.
If the genes that are expressed in the iris tissue explainsubstantial amounts of the genetic variation in iris charac-teristics, and if there is a substantial genetic correlationbetween personality and iris characteristics, then the iris
characteristics may be considered as biomarkers of person-ality. Such findings may give the old expression “it was allin the eyes” a new meaning in the future.
Acknowledgment
This study was supported by funds from the Departmentof Social Sciences at Örebro University in Sweden and The Swedish Foundation for International Cooperation in Research and Higher Education. We are grateful to Dr Angelica Burkhardt for preparing the data material,Anna Törnblom and Ulrika Sandberg for their accuratework as raters, and all the twins as well as the unrelated par-ticipants for their cooperation.
ReferencesAksan, I., & Goding, C. R. (1998). Targeting the microphthalmia
basic helix-loop-helix-leucine zipper transcription factor to a subset of E-box elements in vitro and in vivo. Molecular andCellular Biology, 18(12), 6930–6938.
Anderson, M. G., Smith, R. S., Hawes, N. L., Zabaleta, A.,Chang, B., Wiggs, J. L., & John, S. W. (2002). Mutations ingenes encoding melanosomal proteins cause pigmentary glau-coma in DBA/2J mice. Nature Genetics, 30(1), 81–85.
Bito, L. Z., Matheny, A., Cruickshanks, K. J., Nondahl, D. M., & Carino, O. B. (1997). Eye color changes past early child-hood. The Louisville Twin Study. Archives of Ophthalmology,115(5), 659–663.
Bohling, T., Turunen, O., Jaaskelainen, J., Carpen, O., Sainio, M.,Wahlstrom, T., Vaheri, A., & Haltia, M. (1996). Ezrin expres-sion in stromal cells of capillary hemangioblastoma. Animmunohistochemical survey of brain tumors. AmericanJournal of Pathology, 148(2), 367–373.
Boissy, R. E., & Nordlund, J. J. (1997). Molecular basis of con-genital hypopigmentary disorders in humans: A review.Pigment Cell Research, 10(1–2), 12–24.
Bruno, J. J. (1990). Iris features and personality characteristics.Unpublished doctoral dissertation, Faculty of the CaliforniaInstitute of Integral Studies, San Francisco, California.
Burkhardt, A. (1992). {The color and structure of the human iris.2. Studies of 200 twins}. Anthropologischer Anzeiger, 50(3),235–270.
Chang, B., Smith, R. S., Hawes, N. L., Anderson, M. G., Zabaleta,A., Savinova, O., Roderick, T. H., et al. (1999). Interacting locicause severe iris atrophy and glaucoma in DBA/2J mice.Nature Genetics, 21(4), 405–409.
Carmeliet, P., & Collen, D. (1997). Molecular analysis of bloodvessel formation and disease. American Journal of Physiology,273(5 Pt 2), H2091–2104.
Chalepakis, G., Stoykova, A., Wijnholds, J., Tremblay, P., & Gruss, P. (1993). Pax: Gene regulators in the developingnervous system. Journal of Neurobiology, 24(10), 1367–1384.
Damm, J., Rau, T., Maihofner, C., Pahl, A., & Brune, K. (2001).Constitutive expression and localization of COX-1 and COX-2 in rabbit iris and ciliary body. Experiential Eye Research,72(6), 611–621.
Duffy, D., Box, N., Chen, W., Palmer, J., Montgomery, G.,James, M., Hayward, N., Martin, N., & Sturm, R. (2003).Interactive effects of MC1R and OCA2 on melanoma risk pheno-types. Manuscript submitted for publication.
198 Twin Research June 2003
Mats Larsson, Nancy L. Pedersen, and HŒkan Stattin
197Twin Research June 2003
Genetic Effects for Characteristics of the Human Iris
understanding and impaired verbal inhibition (Heyman et al., 1999). Thus, different alleles of Pax6 may be respon-sible for a potential genetic correlation between iris patternsand personality.
The heritability estimates for eye color in the presentstudy and the Louisville twin study (Bito, 1997) differedsomewhat from each other. The heritability for iris color in the Louisville study was 98% for both males andfemales. This high heritability is in line with recent linkagefindings that suggest that much of the genetic variance foreye color is explained by the OCA2 genes and the P gene(Duffy et al., 2003; Rebbeck et al., 2002). In our study theheritability was 85% for both males and females when theshared environmental parameter was fixed to 0. However,the shared environmental parameter is significant, primarilydue to relatively high female DZ and opposite sexed DZcorrelations. One potential explanation for this unlikelyfinding could be assortative mating for eye color, whichwould lead to elevated DZ correlations. However, Hasstedt(1995) found little evidence for assortative mating for eyecolor nor were spouses similar for eye color in anothersample (N. G. Martin, personal communication, March 21,2003). Furthermore, an artifact in the model can occur insmall samples for traits caused by a major single locus with alarge non-additive genetic effect, which is plausible for eyecolor as demonstrated by Bito (1997), Rebbeck (2002), andDuffy (2003). When the pattern of intra-class correlationsbetween MZ and DZ twins determines the type of modelthat is used (i.e., for variables were rDZ > 1/2 rMZ , d
2 was alwaysmodeled as c2), rather than more refined knowledge aboutthe nature of the genetic effects, d 2 sometimes can come outas c 2. The risk that the intra-class correlations do not reflectthe true nature of the genetic effects in large samples isusually very small, but as can be seen in our sample for eyecolor, this is apparently not completely negligible. Theresults from the larger Lousiville twin study in conjunctionwith the linkage findings lead us to believe that shared envi-ronmental effect is due to a sampling effect.
Another difference between the two studies was that theLouisville twin study found age differences for eye color,but we did not. Ten to 15% of the white subjects in the Louisville sample had changes in eye color throughoutadolescence and adulthood. The heritability estimates were
greater in the older cohorts, (Bito et al., 1997). In ourstudy, the MZ intra-class correlations were slightly larger inthe older cohort (rMZYOUNG = .83 versus rMZOLD = .93), but theparameter estimates did not differ significantly. This proba-bly reflects our relatively small sample size as well as thebroad age range. Furthermore, the Louisville study was lon-gitudinal, and could evaluate true age effects rather thancohort differences.
The only iris characteristic where significant age differ-ences in heritability and non-additive genetic effects ratherthan additive genetic effects could be observed was distinc-tion of white dot rings (see Table 5). The patterns for theDZ correlation for the young and old cohort followed thepattern that was observed for eye color in the LouisvilleTwin Study, with smaller DZ correlations in the oldercohort (rDZYOUNG = .29 versus rDZOLD = .09). One possibleexplanation for why we found age differences for white dotrings but not for iris color may be that the scale for distinc-tiveness of white dot rings records much smaller changes inquantities of pigmentation than the iris color scale. Evensmall changes in pigmentation that cover white dots(making the white dots darker and more distinct) aredetectable by the scale measuring the distinctiveness ofwhite dot rings. On the other hand, small pigment quan-tity changes in iris color may stay undetectable, since muchlager quantities of pigment are needed in order to influencethe rating for this iris characteristic. Thus, even very smallchanges in pigmentation that occur over time may decreasethe similarity for white dots rings within the DZ twinpairs, and result in a greater heritability for white dot ringsin the older cohort.
Our capability to observe sex and age differences in her-itability was limited by the relatively small sample size.Nevertheless, is it striking that so few age and sex differ-ences in parameter estimates for the iris characteristics werefound. It may be that most iris characteristics generallyreach their genetically influenced appearance before adult-hood, and then do not change much over time. Furtherinvestigations assessing iris characteristics other than eyecolor in large longitudinal twin samples with more powerthan the present study need to be performed in order toconfirm this assumption.
Table 5
Variance Component Estimates from Best-fitting ACE, ADE and AE Models with 95% Lower and Upper Confidence Intervals
Scale/Iris characteristics Additive genetic Non-additive genetic None-shared environmental variance a2 (95% CI) variance d2 (95% CI) variance e2 (95% CI)
1. Frequency of crypts1 66% (55–75%) — 33% (25–50%)
2. Frequency of nevi1 58% (45–68%) — 42% (32–55%)
3. Iris color1 51% (29–81%) 34% (3–55%)2 15% (11–21%)
4. Distinction of white dot rings1 0% (0–75%) 78% (15–84%) 22% (16–31%)
Young cohort (4–24 years old) 73% (61–82%) — 27% (19–39%)
Old cohort (25–72 years old) 90% (80–94%) — 10% (5–20%)
5. Distinction of contractional furrows1 78% (70–84%) — 22% (16–30%)Note: 1 No quantitative or qualitative sex difference in the estimates
2 d 2 was modeled as c2
ST
UD
Y I

200 Twin Research June 2003
Mats Larsson, Nancy L. Pedersen, and HŒkan Stattin
Silva, A. J., Frankland, P. W., Marowitz, Z., Friedman, E., Lazlo,G., Cioffi, D., Jacks, T., & Bourtchuladze, R. (1997). A mousemodel for the learning and memory deficits associated withneurofibromatosis type I. Nature Genetics, 15(3), 281–284.
Simpson, T. I., & Price D. J. (2002). Pax 6; a pleitropic player indevelopment. Bioessays, 24(11), 1041–1051.
Stoykova, A., & Gruss, P. (1994). Roles of Pax-genes in develop-ing and adult brain as suggested by expression patterns.Journal of Neuroscience, 14(3 Pt 2), 1395–1412.
Van Heyningen, V., & Williamson, K. A. (2002). PAX6 in sensorydevelopment. Human Molecular Genetics, 11(10), 1161–1167.
Walther, C., & Gruss, P. (1991). Pax-6, a murine paired box gene,is expressed in the developing CNS. Development, 113(4),1435–1449.
Wang, W. H., McNatt, L. G., Shepard, A. R., Jacobson, N.,Nishimura, D. Y., Stone, E. M., et al. (2001). Optimal proce-dure for extracting RNA from human ocular tissues and
expression profiling of the congenital glaucoma gene FOXC1using quantitative RT-PCR. Molecular Vision, 7, 89–94.
Warren, N., Caric, D., Pratt, T., Clausen, J. A., Asavaritikrai, P.,Mason, J. O., Hill, R. E., & Price, D. J. (1999). The tran-scription factor, Pax6, is required for cell proliferation and dif-ferentiation in the developing cerebral cortex. Cereb Cortex,9(6), 627–635.
Wistow, G., Berstein, S. L., Ray, S., Wyatt, M. K., Behal, A.,Touchman, J. W., et al. (2002). Expressed sequence tag analy-sis of adult human iris for the NEIBank Project: Steroid-response factors and s imilar ities with retinal pigmentepithelium. Molecular Vision, 8, 185–195.
Wistow, G. (2002). A project for ocular bioinformatics: NEIBank.Molecular Vision, 8, 161–163.
Zehavi, C., Romano, A., & Goodman, R. M. (1986). Iris (Lisch)nodules in neurofibromatosis. Clinical Genetics, 29(1), 51–55.
Fosslien, E. (2000). Biochemistry of cyclooxygenase (COX)-2inhibitors and molecular pathology of COX-2 in neoplasia.Critical Reviews in Clinical Laborator y Sciences, 37(5),431–502.
Friedman, J. S., Ducharme, R., Raymond, V., & Walter, M. A.(2000). Isolation of a novel iris-specific and leucine-richrepeat protein (oculoglycan) using differential selection.Investigative Ophthalmology and Visual Science, 41(8),2059–2066.
Friedman, J. S., Koop, B. F., Raymond, V., & Walter, M. A.(2001). Isolation of a ubiquitin-like (UBL5) gene from ascreen identifying highly expressed and conserved iris genes.Genomics, 71(2), 252–255.
Glaser, T., Walton, D. S., & Maas, R. L. (1992). Genomic struc-ture, evolutionary conservation and aniridia mutations in thehuman PAX6 gene. Nature Genetics, 2(3), 232–239.
Gould, D. B., & Walter, M. A. (2000). Cloning, characterization,localization, and mutational screening of the human BARX1gene. Genomics, 68(3), 336–342.
Goussia, A. C., Agnantis, N. J., Rao, J. S., & Kyritsis, A. P.(2000). Cytogenetic and molecular abnormalities in astrocyticgliomas (review). Oncology Reports, 7(2), 401–412.
Gronskov, K., Olsen, J. H., Sand, A., Pedersen, W., Carlsen, N.,Bak Jylling, A. M., et al. (2001). Population-based risk esti-mates of Wilms tumor in sporadic aniridia. A comprehensivemutation screening procedure of PAX6 identifies 80% ofmutat- ions in aniridia. Human Genetics, 109(1), 11–18.
Heyman, I., Frampton, I., van Heyningen, V., Hanson, I., Teague,P., Taylor, A., et al. (1999). Psychiatric disorder and cognitivefunction in a family with an inherited novel mutation of thedevelopmental control gene PAX6. Psychiatric Genetics, 9(2),85–90.
Hasstedt, S. J. (1995). Phenotypic assortative mating in segrega-tion analysis. Genetic Epidemiology, 12(2), 109–127.
Hobby, P., Wyatt, M. K., Gan, W., Bernstein, S., Tomarev, S.,Slingsby, C., et al. (2000). Cloning, modeling, and chromoso-mal localization for a small leucine- rich repeat proteoglycan(SLRP) family member expressed in human eye. MolecularVision, 6, 72–78.
Huang, W., Jaroszewski, J., Ortego, J., Escribano, J., & Coca-Prados, M. (2000). Expression of the TIGR gene in the iris,ciliary body, and trabecular meshwork of the human eye.Ophthalmic Genetics, 21(3), 155–169.
Harbour, J. W., Augsburger, J. J., & Eagle, R. C., Jr. (1995).Initial management and follow-up of melanocytic iris tumors.Ophthalmology, 102(12), 1987–1993.
Jaworski, C., Sperbeck, S., Graham, C., & Wistow, G. (1997).Alternative splicing of Pax6 in bovine eye and evolutionaryconservation of intron sequences. Biochemical and BiophysicalResearch Communications, 240(1), 196–202.
Katori, M., & Majima, M. (2000). Cyclooxygenase-2: its richdiversity of roles and possible application of its selectiveinhibitors. Inflammation Research, 49(8), 367–392.
Kim, I., Ryan, A. M., Rohan, R., Amano, S., Agular, S., Miller, J.W., et al. (1999). Constitutive expression of VEGF, VEGFR-1, and VEGFR-2 in normal eyes. Investigative Ophthalmologyand Visual Sciene, 40(9), 2115–2121.
Kivela, T., Jaaskelainen, J., Vaheri, A., & Carpen, O. (2000).Ezrin, a membrane-organizing protein, as a polarization
199Twin Research June 2003
Genetic Effects for Characteristics of the Human Iris
marker of the retinal pigment epithelium in vertebrates. CellTissue Research, 301(2), 217–223.
Kulak, S. C., Kozlowski, K., Semina, E. V., Pearce, W. G., & Walter,M. A. (1998). Mutation in the RIEG1 gene in patients with iridogoniodysgenesis syndrome. Human Molecular Genetics,7(7), 1113–1117.
Larsson, M. (1998). Iris patt erns and personality: Doe s a relationship exists that can be useful for the five factor model and behavioral genetics. Paper presented at Behavioral GeneticsAssociation’s Annual meeting in Stockholm, 1998.
Lowings, P., Yavuzer, U., & Goding, C. R. (1992). Positive andnegative elements regulate a melanocyte-specific promoter.Molecular Cell Biology, 12(8), 3653–3662.
Lu, M., Kuroki, M., Amano, S., Tolentino, M., Keough, K., Kim,I., et al. (1998). Advanced glycation end products increaseretina l vascular endothelial growth factor expression. The Journal of Clinical Investigation, 101(6), 1219–1224.
Mansouri, A., Stoykova, A., & Gruss, P. (1994). Pax genes indevelopment. Journal of Cell Science. Supplement, 18, 35–42.
McGue, M., & Bouchard, T. J. (1984). Adjustment of twin datafor the effects of age and sex. Behavior Genetics, 14(4),325–343.
Neale, M. C., & Cardon, L. R. (1992). Methodology for geneticstudies of twins and families. Dordrecht: Kluwer AcademicPublichers.
Neale, M., Boker, S., Xie, G., & Maes, H. (1999). Mx: Statisticalmodeling (5th ed). Box 126 MCV, Richmond, VA 23298:Department of Psychiatry.
Nichols, R. C., & Bilbro, W. C., Jr. (1966). The diagnosis of twinzygosity. Acta Genetica et Statistica Medica , 16(3), 265–275.
Oetting, W. S., Brilliant, M. H., & King, R. A. (1996). The clini-cal spectrum of albinism in humans. Molecular MedicineToday, 2(8), 330–335.
Orlow, S. J., & Brilliant, M. H. (1999). The pink-eyed dilutionlocus controls the biogenesis of melanosomes and levels ofmelanosomal proteins in the eye. Experiential Eye Research,68(2), 147–154.
Porcella, A., Maxia, C., Gessa, G. L., & Pani, L. (2000). Thehuman eye expresses high levels of CB1 cannabinoid receptormRNA and protein. European Journal of Neuroscience, 12(3),1123–1127.
Ragge, N. K., Falk, R. E., Cohen, W. E., & Murphree, A. L. (1993).Images of Lisch nodules across the spectrum. Eye, 7(Pt. 1),95–101.
Rebbeck, T. R., Kanetsky, P. A., Walker, A. H., Holmes, R.,Halpern, A. C., Schuchter, L. M., et al. (2002). P gene as aninherited biomarker of human eye color. Cancer Epidemiology,Biomarkers & Prevention, 11(8), 782–784.
Riccardi, V. M., & Lewis, R. A. (1988). Penetrance of von Reckling-hausen neurofibromatosis: A distinction between predecessorsand descendants. America Journal of Human Genetics, 42(2),284–289.
Richardson, J., Cvekl, A., & Wistow, G. (1995). Pax-6 is essentialfor lens-specific expression of zeta-crystallin. Proceedings of theNational Academy of Sciences of the United States of America US A, 92(10), 4676–4680.
Shen, M. H., Harper, P. S., & Upadhyaya, M. (1996). Moleculargenetics of neurofibromatosis type 1 (NF1). Journal of MedicalGenetics, 33(1), 2–17.
ST
UD
Y I

ASDSADFDFSDDDDDDDDDDDDDDDDDDDDDDDDDDDDDDDDDDDDDDDDDDDSTUDY II

ASDSADFDFSDDDDDDDDDDDDDDDDDDDDDDDDDDDDDDDDDDDDDDDDDDDSTUDY II

Molecular Vision 2004; 10:821-31 <http://www.molvis.org/molvis/v10/a98>Received 26 March 2004 | Accepted 18 October 2004 | Published 2 November 2004
Despite hundreds of molecular studies investigating genesthat influence the health and function of the human iris, thereare only few studies available that have evaluated the relativeimportance of genes for variation in iris textural qualities innormally developed eyes. In the few studies reported, the rela-tive importance of genetic influences (heritability) on iris char-acteristics is substantial. The heritability for eye color in theLouisville Twin Study was 98% [1], whereas the heritabilityfor Fuchs’ crypts in the main stroma leaf, pigment dots,Wolfflin nodules, and contraction furrows in a German twinsample were, 66, 58, 78, and 78 percent, respectively [2]. Therewere no sex differences in heritability in these studies. Theonly iris characteristics for which heritability differs as a func-tion of age are eye color and Wolfflin nodules, for which greaterestimates were observed in the older cohorts. These findingssuggest that iris characteristics in populations with normal eyedevelopment are moderately to highly heritable and generallyshow no sex specific genetic influences.
Potential candidate genes responsible for variation in iristexture characteristics are different alleles of Pax6 and itsdownstream target genes [3], COX-1, COX-2, VEGF, Ezrin,IR 185/OPTC, FKHL7/FOXC1, FOXC2, TIGR/GCL1A/Myocilin, RIEG1/PITX2, Lmx1b, Hox-7.1, Hox-8.1, the P gene[4-17] as well as other genes that are expressed in the humaniris [18,19]. Many of these genes influence more than one eyephenotype [20], which suggests that there may be pleiotropiceffects on different textural characteristics in the iris. For in-
stance, the Pax6 gene may influence both the crypt frequencyon the iris surface, and the extension and distinction of con-traction furrows. Pax6 is expressed both early [21] and late[4] in iris development. Family members with aniridia, whichoriginates from Pax6 deficiencies [20], have been observedwith a broad spectrum of iris abnormalities, including abnor-mal crypt and contraction furrow structure [22]. One couldtherefore imagine that different alleles of Pax6 could impactseveral aspects of the iris tissue in normally developed eyes.However, the extent to which there is overlap of genetic ef-fects (i.e., a genetic correlation) among different iris charac-teristics is not known.
The purpose of this study is to estimate the genetic corre-lations among five general textural quality characteristics inthe human iris. The genetic contributions to the observed phe-notypic correlation among frequency of Fuchs’ crypts in themain stroma leaf, frequency of pigment dots, iris color, theextension, and distinction of Wolfflin nodules as well as con-traction furrows were examined in a sample of monozygotic(MZ) and dizygotic (DZ) twins.
METHODSSample: Data for this study came from a German sample of100 monozygotic twin pairs reared together (54 male-male,46 female-female), and 99 dizygotic pairs reared together (27male-male, 33 female-female, 39 male-female) [23]. The meanage was 20.1 (5-70 years, SD=12.4), and 20.5 (4-72 years,SD=12.3), respectively. All were volunteers with good ocularhealth who were recruited through advertising in the townBraunschweig close to Hanover, Germany. The human sub-jects committee at Braunschweig University reviewed the re-search protocol. Black and white photographs were taken of
©2004 Molecular Vision
Genetic correlations among texture characteristics in the humaniris
Mats Larsson,1 Nancy L. Pedersen2
1Center for Developmental Research, Department of Behavioral, Social, and Legal Sciences (BSR), Örebro University, Örebro,Sweden; 2Department of Medical Epidemiology and Biostatistics, Karolinska Institute, Stockholm, Sweden
Purpose: To estimate the magnitude of genetic correlations among five general textural characteristics of the human iris.Methods: Color photographs of iris were available from 100 monozygotic and 99 dizygotic twin pairs. Comparativescales were constructed based on ratings of the subjects’ left iris. To explore the genetic and environmental covariationamong frequency of Fuchs’ crypts, frequency of pigment dots, iris color, the extension, and distinction of Wolfflin nod-ules, and contraction furrows, a structural equation model with Cholesky decomposition was applied to variance-covari-ance matrices for monozygotic (MZ) and dizygotic (DZ) pairs.Results: Significant genetic correlations fell between -0.22 and 0.44 and accounted almost entirely for the phenotypiccorrelations among the iris characteristics. No evidence for individual specific environmental effects in common to thecharacteristics was found.Conclusions: The modest genetic correlations indicate that there is little overlap in the genetic influence for these charac-teristics. Candidate genes with embryological and histological expression patterns in the eye could potentially influencethe iris characteristics’ variability.
Correspondence to: Mats Larsson, Center for Developmental Re-search, Department of Behavioral, Social, and Legal Sciences (BSR),Örebro University, 701 82, Örebro, Sweden; Phone: (+46) 19 303415;FAX: (+46) 19 303484; email: [email protected]
821
ST
UD
Y II
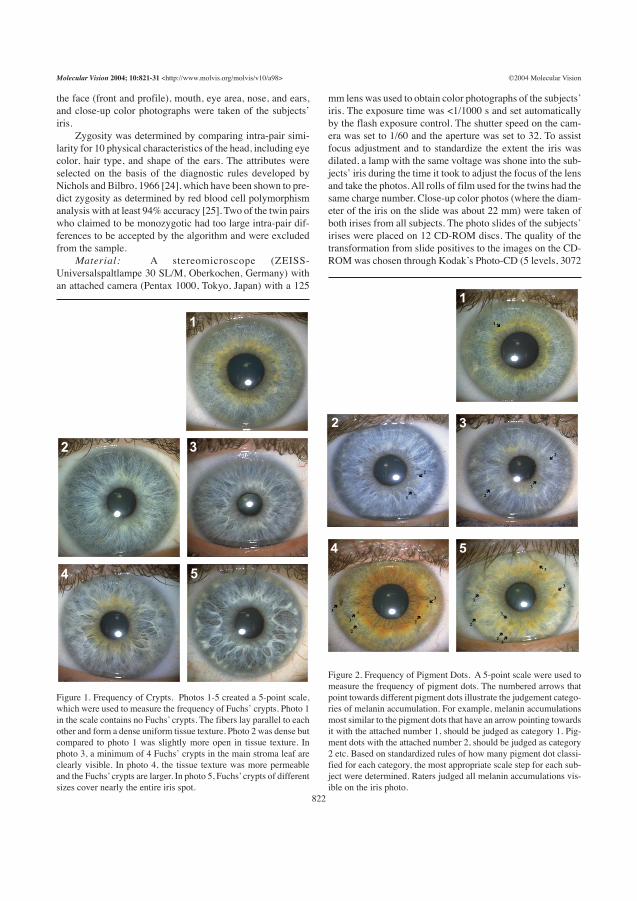
x 2048 pixels; Kodak, Rochester, New York, USA). The pho-tos were viewed on a high contrast color computer screen(Model: FlexScan F55; Eizo, Ishikawa, Japan) with 1024 x768/85 Hz resolution (0.28 mm Dot Pitch CRT; fH:27-70 kHz/fV: 50-120 Hz) using the software program PhotoShop 4.0.Iris photographs and other characteristics of the sample werepurchased from Dr. Angelica Burkhardt, Institute for HumanBiology, Technical University Carolo-Wilhelmina inBrunswick, Germany.
The first author constructed five continuous scales, onefor each iris characteristic of interest. The pictures used forthe scales may be seen in Figure 1 for the frequency of crypts,Figure 2 for the frequency of pigment dots, Figure 3 for iriscolor, Figure 4 for the frequency of Wolfflin nodules, and Fig-ure 5 for contraction furrows. Two independent raters, blindto zygosity, graded the photos of the subject’s iris characteris-tics using the reference photos. The raters’ judgments werescored as continuous variables. Scale construction, the ratingprocedure, and results of the reliability test of the proceduresare reported in detail in Larsson et al. [2].
Quantitative genetic models: Monozygotic twins sharein principle all of their genes, while dizygotic twins share, onaverage, half of their segregating genes. By comparing howsimilar monozygotic and dizygotic twin pairs are on the irischaracteristics of interest, one can assess to what extent ge-netic and environmental factors contribute to within pair co-variances. Quantitative genetic methods subdivide genetic in-fluences into additive and nonadditive components [26]. Thedistinction refers to the way in which alleles co-act to influ-ence expression of the phenotype: The additive componentreflects the summed effects of alleles within and across loci,and the nonadditive component reflects the interaction of al-
leles within (dominance) and across (epistasis) different loci.Environmental influences may also be important for individualdifferences and are typically subdivided into nonshared, andshared components. Nonshared environmental influences areunique to each individual and therefore contribute only to dif-ferences within twin pairs, regardless of their genetic similar-ity. Errors of measurement, which contribute to twin differ-ences, are included in the nonshared environmental compo-nent. Shared environmental components, such as family envi-ronments, make members of a twin pair similar regardless oftheir genetic similarity. If genetic influences are important fora trait, MZ correlations should be approximately twice themagnitude of DZ correlations. Analogous comparisons canbe made to evaluate sources of covariation among the traits.We distinguish between the “twin correlation”, which is thewithin pair correlation for a single scale (e.g., correlation ofTwin 1’s crypt score with Twin 2’s crypt score), and the cross-
©2004 Molecular VisionMolecular Vision 2004; 10:821-31 <http://www.molvis.org/molvis/v10/a98>
Figure 3. Iris color. Photos 1-4 created a 4-point scale, which wasused to measure iris color. The color of the iris in photos 1, 2, 3 and4 are gray, blue, hazel, and brown, respectively.
Figure 4. Wolfflin Nodules. Photo 1 in the scale has no Wolfflinnodules at the periphery of the iris. In photo 2, a ring of clumpednodules extends from 3 to 10 o’clock. In photo 3, the white nodulesare more visible and distinct from each other. In photo 4, the noduleslager, are lighter and are closer together. In photo 5, the Wolfflinnodules have formed a uniform white ring that is much thicker anddistinct than in the previous scale steps. A corresponding scale, show-ing what the Wolfflin nodules look like when partly covered by pig-ment was used to assist the raters judgments.
823
the face (front and profile), mouth, eye area, nose, and ears,and close-up color photographs were taken of the subjects’iris.
Zygosity was determined by comparing intra-pair simi-larity for 10 physical characteristics of the head, including eyecolor, hair type, and shape of the ears. The attributes wereselected on the basis of the diagnostic rules developed byNichols and Bilbro, 1966 [24], which have been shown to pre-dict zygosity as determined by red blood cell polymorphismanalysis with at least 94% accuracy [25]. Two of the twin pairswho claimed to be monozygotic had too large intra-pair dif-ferences to be accepted by the algorithm and were excludedfrom the sample.
Material: A stereomicroscope (ZEISS-Universalspaltlampe 30 SL/M, Oberkochen, Germany) withan attached camera (Pentax 1000, Tokyo, Japan) with a 125
mm lens was used to obtain color photographs of the subjects’iris. The exposure time was <1/1000 s and set automaticallyby the flash exposure control. The shutter speed on the cam-era was set to 1/60 and the aperture was set to 32. To assistfocus adjustment and to standardize the extent the iris wasdilated, a lamp with the same voltage was shone into the sub-jects’ iris during the time it took to adjust the focus of the lensand take the photos. All rolls of film used for the twins had thesame charge number. Close-up color photos (where the diam-eter of the iris on the slide was about 22 mm) were taken ofboth irises from all subjects. The photo slides of the subjects’irises were placed on 12 CD-ROM discs. The quality of thetransformation from slide positives to the images on the CD-ROM was chosen through Kodak’s Photo-CD (5 levels, 3072
©2004 Molecular VisionMolecular Vision 2004; 10:821-31 <http://www.molvis.org/molvis/v10/a98>
Figure 1. Frequency of Crypts. Photos 1-5 created a 5-point scale,which were used to measure the frequency of Fuchs’ crypts. Photo 1in the scale contains no Fuchs’ crypts. The fibers lay parallel to eachother and form a dense uniform tissue texture. Photo 2 was dense butcompared to photo 1 was slightly more open in tissue texture. Inphoto 3, a minimum of 4 Fuchs’ crypts in the main stroma leaf areclearly visible. In photo 4, the tissue texture was more permeableand the Fuchs’ crypts are larger. In photo 5, Fuchs’ crypts of differentsizes cover nearly the entire iris spot.
Figure 2. Frequency of Pigment Dots. A 5-point scale were used tomeasure the frequency of pigment dots. The numbered arrows thatpoint towards different pigment dots illustrate the judgement catego-ries of melanin accumulation. For example, melanin accumulationsmost similar to the pigment dots that have an arrow pointing towardsit with the attached number 1, should be judged as category 1. Pig-ment dots with the attached number 2, should be judged as category2 etc. Based on standardized rules of how many pigment dot classi-fied for each category, the most appropriate scale step for each sub-ject were determined. Raters judged all melanin accumulations vis-ible on the iris photo.
822
1
2 3
4 5
1
1
2
1
2
3
2
2
3
3
3
2
3
2
4
3
3
2
3 2
3
3
5

x 2048 pixels; Kodak, Rochester, New York, USA). The pho-tos were viewed on a high contrast color computer screen(Model: FlexScan F55; Eizo, Ishikawa, Japan) with 1024 x768/85 Hz resolution (0.28 mm Dot Pitch CRT; fH:27-70 kHz/fV: 50-120 Hz) using the software program PhotoShop 4.0.Iris photographs and other characteristics of the sample werepurchased from Dr. Angelica Burkhardt, Institute for HumanBiology, Technical University Carolo-Wilhelmina inBrunswick, Germany.
The first author constructed five continuous scales, onefor each iris characteristic of interest. The pictures used forthe scales may be seen in Figure 1 for the frequency of crypts,Figure 2 for the frequency of pigment dots, Figure 3 for iriscolor, Figure 4 for the frequency of Wolfflin nodules, and Fig-ure 5 for contraction furrows. Two independent raters, blindto zygosity, graded the photos of the subject’s iris characteris-tics using the reference photos. The raters’ judgments werescored as continuous variables. Scale construction, the ratingprocedure, and results of the reliability test of the proceduresare reported in detail in Larsson et al. [2].
Quantitative genetic models: Monozygotic twins sharein principle all of their genes, while dizygotic twins share, onaverage, half of their segregating genes. By comparing howsimilar monozygotic and dizygotic twin pairs are on the irischaracteristics of interest, one can assess to what extent ge-netic and environmental factors contribute to within pair co-variances. Quantitative genetic methods subdivide genetic in-fluences into additive and nonadditive components [26]. Thedistinction refers to the way in which alleles co-act to influ-ence expression of the phenotype: The additive componentreflects the summed effects of alleles within and across loci,and the nonadditive component reflects the interaction of al-
leles within (dominance) and across (epistasis) different loci.Environmental influences may also be important for individualdifferences and are typically subdivided into nonshared, andshared components. Nonshared environmental influences areunique to each individual and therefore contribute only to dif-ferences within twin pairs, regardless of their genetic similar-ity. Errors of measurement, which contribute to twin differ-ences, are included in the nonshared environmental compo-nent. Shared environmental components, such as family envi-ronments, make members of a twin pair similar regardless oftheir genetic similarity. If genetic influences are important fora trait, MZ correlations should be approximately twice themagnitude of DZ correlations. Analogous comparisons canbe made to evaluate sources of covariation among the traits.We distinguish between the “twin correlation”, which is thewithin pair correlation for a single scale (e.g., correlation ofTwin 1’s crypt score with Twin 2’s crypt score), and the cross-
©2004 Molecular VisionMolecular Vision 2004; 10:821-31 <http://www.molvis.org/molvis/v10/a98>
Figure 3. Iris color. Photos 1-4 created a 4-point scale, which wasused to measure iris color. The color of the iris in photos 1, 2, 3 and4 are gray, blue, hazel, and brown, respectively.
Figure 4. Wolfflin Nodules. Photo 1 in the scale has no Wolfflinnodules at the periphery of the iris. In photo 2, a ring of clumpednodules extends from 3 to 10 o’clock. In photo 3, the white nodulesare more visible and distinct from each other. In photo 4, the noduleslager, are lighter and are closer together. In photo 5, the Wolfflinnodules have formed a uniform white ring that is much thicker anddistinct than in the previous scale steps. A corresponding scale, show-ing what the Wolfflin nodules look like when partly covered by pig-ment was used to assist the raters judgments.
823
the face (front and profile), mouth, eye area, nose, and ears,and close-up color photographs were taken of the subjects’iris.
Zygosity was determined by comparing intra-pair simi-larity for 10 physical characteristics of the head, including eyecolor, hair type, and shape of the ears. The attributes wereselected on the basis of the diagnostic rules developed byNichols and Bilbro, 1966 [24], which have been shown to pre-dict zygosity as determined by red blood cell polymorphismanalysis with at least 94% accuracy [25]. Two of the twin pairswho claimed to be monozygotic had too large intra-pair dif-ferences to be accepted by the algorithm and were excludedfrom the sample.
Material: A stereomicroscope (ZEISS-Universalspaltlampe 30 SL/M, Oberkochen, Germany) withan attached camera (Pentax 1000, Tokyo, Japan) with a 125
mm lens was used to obtain color photographs of the subjects’iris. The exposure time was <1/1000 s and set automaticallyby the flash exposure control. The shutter speed on the cam-era was set to 1/60 and the aperture was set to 32. To assistfocus adjustment and to standardize the extent the iris wasdilated, a lamp with the same voltage was shone into the sub-jects’ iris during the time it took to adjust the focus of the lensand take the photos. All rolls of film used for the twins had thesame charge number. Close-up color photos (where the diam-eter of the iris on the slide was about 22 mm) were taken ofboth irises from all subjects. The photo slides of the subjects’irises were placed on 12 CD-ROM discs. The quality of thetransformation from slide positives to the images on the CD-ROM was chosen through Kodak’s Photo-CD (5 levels, 3072
©2004 Molecular VisionMolecular Vision 2004; 10:821-31 <http://www.molvis.org/molvis/v10/a98>
Figure 1. Frequency of Crypts. Photos 1-5 created a 5-point scale,which were used to measure the frequency of Fuchs’ crypts. Photo 1in the scale contains no Fuchs’ crypts. The fibers lay parallel to eachother and form a dense uniform tissue texture. Photo 2 was dense butcompared to photo 1 was slightly more open in tissue texture. Inphoto 3, a minimum of 4 Fuchs’ crypts in the main stroma leaf areclearly visible. In photo 4, the tissue texture was more permeableand the Fuchs’ crypts are larger. In photo 5, Fuchs’ crypts of differentsizes cover nearly the entire iris spot.
Figure 2. Frequency of Pigment Dots. A 5-point scale were used tomeasure the frequency of pigment dots. The numbered arrows thatpoint towards different pigment dots illustrate the judgement catego-ries of melanin accumulation. For example, melanin accumulationsmost similar to the pigment dots that have an arrow pointing towardsit with the attached number 1, should be judged as category 1. Pig-ment dots with the attached number 2, should be judged as category2 etc. Based on standardized rules of how many pigment dot classi-fied for each category, the most appropriate scale step for each sub-ject were determined. Raters judged all melanin accumulations vis-ible on the iris photo.
822
ST
UD
Y II
1 2
3 4
1
2 3
4 5

second was like the first except that the potential contributionfrom all parameters representing shared environmental effectswere fixed at 0, testing whether shared environmental effectswere significant. The third model was like the second exceptthat the 10 additive genetic parameters representing geneticcovariation (a12, a13, a14, a15, a23, a24, a25, a34, a35, and a45) werealso fixed at 0, testing whether the genetic influences on theiris characteristics were independent of each other. In otherwords if this model fit well, there is no genetic covariationand genetic influences do not contribute to the phenotypiccorrelation. The fourth model was like the second except thatthe 10 nonshared environmental parameters (e12, e13, e14, e15,e23, e24, e25, e34, e35, and e45) were fixed at 0, testing whether theenvironmental influences on the iris characteristics were in-dependent of each other.
In order to remove variance caused by the effects of gen-der and age in the twin analyses, scores for all twins with com-plete data on the five iris characteristics (n=398) were adjusted
for gender, age and gender by age using the regression proce-dure described by McGue and Bouchard [27]. All five scaleswere positively skewed, and for this reason the scores werelog transformed. Model fitting analyses using Mx [28] werebased on observed variance and covariance matrices computedseparately for MZ and DZ twin pairs using SPSS [29]. Choiceof the best fitting model was based on the Akaike informationcriterion (AIC) [30], which equals the 2 statistic minus twicethe degrees of freedom (df):
This reflects both the goodness of fit and parsimony ofthe model. The model with the most negative value for theAIC was considered the best model.
©2004 Molecular VisionMolecular Vision 2004; 10:821-31 <http://www.molvis.org/molvis/v10/a98>
Figure 6. The factor structure underlying the five iris characteristics. This illustrates the genetic and environmental factor structures for thefive iris characteristics Fuchs’ crypt frequency (Crypts), pigment dot frequency (P. Dots), iris color (Color), extension and distinction ofWolfflin nodules (Wolfflin), and Contraction furrows (Furrows) for one twin only. Each of the five measures of iris characteristics loaded onadditive genetic (A1 through A5) and environmental latent factors (E1 through E5).
825
twin correlation, which is the correlation within a twin pairacross two scales (e.g., correlation of Twin 1’s crypt scorewith Twin 2’s pigment dots score). Thus, if genetic influencesare important for the covariation between two traits, the MZcross correlation should be twice as large as the DZ cross cor-relation.
Recent univariate analyses based on this sample [2] dem-onstrated that genetic influences for all iris characteristics ex-cept Wolfflin nodules were additive and therefore we chose totest models with additive genetic effects (h2). The quantitativegenetic expectations for the covariances among the multiplemeasures (assuming additivity of genetic effects) are 1.0 and0.5 for monozygotic and dizygotic twin pairs, respectively [26].
Associations among the iris characteristics were evalu-ated using a Cholesky decomposition model, as depicted inFigure 6. For simplicity, the diagram shows sources of vari-
ance for only one twin and excludes shared environmentalinfluences. Each of the five measures of iris characteristicsloaded on latent additive genetic (A1 through A5) and environ-mental factors (E1 through E5). All five scales load on the firstgenetic and environmental factors. The second latent factor isorthogonal to the first factor and has loadings on the subse-quent four scales. The third and fourth latent factors operatein the same manner, reflecting influences independent of theprior factors. The fifth latent factor is unique to the contrac-tion furrow scale. Using this model, the genetic and environ-mental etiology of the relationships among iris characteristicscan be assessed (i.e., the extent to which the correlations amongthe measures are due to genetic and environmental influences).In addition, estimates genetic and environmental correlationsamong the measures can be computed.
The genetic correlation (rA), which can range from -1.00to 1.00, is an estimate of the extent to which the same genesinfluence two variables, reflecting the degree of pleiotropy.Estimates of genetic and environmental correlations amongthe iris characteristics are obtained from the standardized pathcoefficients. For example, the product of the paths a11 and a12estimates the phenotypically standardized genetic covariance:
where h is the square root of the heritability of the indicatedmeasure and rA is the genetic correlation between the twomeasures. The phenotypically standardized genotypic covari-ance represents the genetic component of the phenotypic cor-relation (rP). Similarly, e11e12 represents the environmentalcomponent, so:
The genetic correlation is calculated by dividing the pheno-typically standardized genetic covariance with the product ofthe square roots of the two heritabilities:
The environmental correlation is computed in an analogousfashion.
A full model and three nested models were tested [26].The first model estimated additive genetic, shared environ-mental, and nonshared environmental parameters freely. The
©2004 Molecular VisionMolecular Vision 2004; 10:821-31 <http://www.molvis.org/molvis/v10/a98>
Figure 5. Contraction Furrows. This scale measured the extensionand distinction of contraction furrows in the main stroma leaf of theiris. Photo 1 in the scale had no contraction furrows. In photo 2, acontraction furrow extends halfway from the periphery of the irisfrom 1 to 8 o clock. In photo 3, the contraction furrows are moredistinct and extend around the whole iris. In photo 4, the contractionfurrows are more distinct. In photo 5, a minimum of two full circlesof contraction furrows present. A corresponding scale showing whatthe contraction furrows look like in brown colored iris were alsoused to assist the rater judgments.
824
1
54
2 3

second was like the first except that the potential contributionfrom all parameters representing shared environmental effectswere fixed at 0, testing whether shared environmental effectswere significant. The third model was like the second exceptthat the 10 additive genetic parameters representing geneticcovariation (a12, a13, a14, a15, a23, a24, a25, a34, a35, and a45) werealso fixed at 0, testing whether the genetic influences on theiris characteristics were independent of each other. In otherwords if this model fit well, there is no genetic covariationand genetic influences do not contribute to the phenotypiccorrelation. The fourth model was like the second except thatthe 10 nonshared environmental parameters (e12, e13, e14, e15,e23, e24, e25, e34, e35, and e45) were fixed at 0, testing whether theenvironmental influences on the iris characteristics were in-dependent of each other.
In order to remove variance caused by the effects of gen-der and age in the twin analyses, scores for all twins with com-plete data on the five iris characteristics (n=398) were adjusted
for gender, age and gender by age using the regression proce-dure described by McGue and Bouchard [27]. All five scaleswere positively skewed, and for this reason the scores werelog transformed. Model fitting analyses using Mx [28] werebased on observed variance and covariance matrices computedseparately for MZ and DZ twin pairs using SPSS [29]. Choiceof the best fitting model was based on the Akaike informationcriterion (AIC) [30], which equals the 2 statistic minus twicethe degrees of freedom (df):
This reflects both the goodness of fit and parsimony ofthe model. The model with the most negative value for theAIC was considered the best model.
©2004 Molecular VisionMolecular Vision 2004; 10:821-31 <http://www.molvis.org/molvis/v10/a98>
Figure 6. The factor structure underlying the five iris characteristics. This illustrates the genetic and environmental factor structures for thefive iris characteristics Fuchs’ crypt frequency (Crypts), pigment dot frequency (P. Dots), iris color (Color), extension and distinction ofWolfflin nodules (Wolfflin), and Contraction furrows (Furrows) for one twin only. Each of the five measures of iris characteristics loaded onadditive genetic (A1 through A5) and environmental latent factors (E1 through E5).
825
twin correlation, which is the correlation within a twin pairacross two scales (e.g., correlation of Twin 1’s crypt scorewith Twin 2’s pigment dots score). Thus, if genetic influencesare important for the covariation between two traits, the MZcross correlation should be twice as large as the DZ cross cor-relation.
Recent univariate analyses based on this sample [2] dem-onstrated that genetic influences for all iris characteristics ex-cept Wolfflin nodules were additive and therefore we chose totest models with additive genetic effects (h2). The quantitativegenetic expectations for the covariances among the multiplemeasures (assuming additivity of genetic effects) are 1.0 and0.5 for monozygotic and dizygotic twin pairs, respectively [26].
Associations among the iris characteristics were evalu-ated using a Cholesky decomposition model, as depicted inFigure 6. For simplicity, the diagram shows sources of vari-
ance for only one twin and excludes shared environmentalinfluences. Each of the five measures of iris characteristicsloaded on latent additive genetic (A1 through A5) and environ-mental factors (E1 through E5). All five scales load on the firstgenetic and environmental factors. The second latent factor isorthogonal to the first factor and has loadings on the subse-quent four scales. The third and fourth latent factors operatein the same manner, reflecting influences independent of theprior factors. The fifth latent factor is unique to the contrac-tion furrow scale. Using this model, the genetic and environ-mental etiology of the relationships among iris characteristicscan be assessed (i.e., the extent to which the correlations amongthe measures are due to genetic and environmental influences).In addition, estimates genetic and environmental correlationsamong the measures can be computed.
The genetic correlation (rA), which can range from -1.00to 1.00, is an estimate of the extent to which the same genesinfluence two variables, reflecting the degree of pleiotropy.Estimates of genetic and environmental correlations amongthe iris characteristics are obtained from the standardized pathcoefficients. For example, the product of the paths a11 and a12estimates the phenotypically standardized genetic covariance:
where h is the square root of the heritability of the indicatedmeasure and rA is the genetic correlation between the twomeasures. The phenotypically standardized genotypic covari-ance represents the genetic component of the phenotypic cor-relation (rP). Similarly, e11e12 represents the environmentalcomponent, so:
The genetic correlation is calculated by dividing the pheno-typically standardized genetic covariance with the product ofthe square roots of the two heritabilities:
The environmental correlation is computed in an analogousfashion.
A full model and three nested models were tested [26].The first model estimated additive genetic, shared environ-mental, and nonshared environmental parameters freely. The
©2004 Molecular VisionMolecular Vision 2004; 10:821-31 <http://www.molvis.org/molvis/v10/a98>
Figure 5. Contraction Furrows. This scale measured the extensionand distinction of contraction furrows in the main stroma leaf of theiris. Photo 1 in the scale had no contraction furrows. In photo 2, acontraction furrow extends halfway from the periphery of the irisfrom 1 to 8 o clock. In photo 3, the contraction furrows are moredistinct and extend around the whole iris. In photo 4, the contractionfurrows are more distinct. In photo 5, a minimum of two full circlesof contraction furrows present. A corresponding scale showing whatthe contraction furrows look like in brown colored iris were alsoused to assist the rater judgments.
824
ST
UD
Y II

whereas the nonshared environmental factors were not. Thus,Model 4 provided the most parsimonious description of therelationships among the five iris characteristics. Nevertheless,we chose to present the results based on Model 2, as they pro-vide important information about nonshared environmentalinfluences for the individual measures. The maximum likeli-hood parameter estimates from Model 2 are presented in Table5. The standardized path coefficients and the 95% upper andlower confidence intervals of the estimates within parenthesisafter each estimate from Model 2 are depicted in the CholeskyModel (Figure 7).
The genetic covariances in Table 5 were very similar tothe corresponding phenotypic correlations, indicating that thegenetic influences accounted almost entirely for the pheno-typic correlations among the five iris characteristics. The sig-nificant genetic correlations ranged from -0.22 to 0.44.
Because pigment dots generally develop before adulthoodand then show little change over time [31,32], we also per-formed analyses (data not shown) excluding twins under 15years of age. In these analyses the phenotypic correlationsbetween pigment dots and the other iris characteristics werenegligible and none of the genetic correlations with pigmentdots reached significance. The remaining correlations werealmost identical to those in the full sample.
DISCUSSION The purpose of the present study was to estimate the geneticcorrelations among five iris characteristics: frequency of Fuchs’crypts; frequency of pigment dots; iris color; extension anddistinction of Wolfflin nodules; and contraction furrows. Ge-netic correlations ranged between -0.22 and 0.44. No evidencefor significant environmental covariation was found. Struc-tural equation models demonstrated that the phenotypic cor-relations among the iris characteristics were due to geneticcovariation.
The significant genetic correlations were relatively fewand low in magnitude, which may not be surprising consider-ing morphological differences during development. One suchdifference is the timing of formation. For instance, Fuchs’crypts are patch like atrophies of the anterior border layer.The principal distribution and depth of these atrophies arepresent at birth [33]. Pigment dots on the other hand, rarelyappear on the surface of the anterior border layer before theage of six [31]. The genetic correlation between Fuchs’ cryptsand pigment dots is close to zero (rA=-0.06, ns), in keepingwith this developmental difference. Similarly, no genetic cor-relation could be found between Fuchs’ crypts and iris color(rA=0.06, ns). The melanocytes, which determine iris color[34], normally reach their genetically determined amount ofmelanin in early childhood and then usually remain constantin adulthood [1]. These results suggest that morphological dif-ferences during development, in this case the timing in theformation of iris characteristics, tend to preclude a potentialgenetic correlation. Similarly, iris characteristics that origi-nate from different processes within the cells generally do notshare any genetic factors in common. Thus, Wolfflin nodules,which are accumulations of fibrous tissue in the anterior bor-der layer [35,36], did not share any genetic influences withpigment dots (rA=0.00, ns).
An examination of morphology for iris characteristics withsignificant genetic correlations suggests that those originat-ing from the same cell layers, or cell layers that are likely tocontribute to an iris characteristic’s prevalence, generally doshare genetic factors. For instance, contraction furrows be-come manifest due to a tendency of the iris to fold in the samelocation when the iris aperture adapts to different light condi-tions. Contraction furrows may therefore be influenced by theoverall thickness and density of the iris, which implies that allfive cell layers in the iris i.e., the anterior border layer, stroma,dilator muscle fibers and the anterior and posterior epitheliallayers, potentially could influence the extension and distinc-tion of contraction furrows. It is therefore not surprising thatall iris characteristics measured in the anterior border layerexcept Wolfflin nodules, i.e., Fuchs’ crypts, pigment dots andiris color, shared significant genetic correlations with contrac-tion furrows. The strongest of these was iris color, for whichthe genetic influences contributing to more pigmented iris alsocontributed to increased extension and distinction of contrac-tion furrows (rA=0.44, p<0.05). This finding, which suggeststhat the amount of melanin in the anterior border layer influ-ences the overall density and thickness of the iris, is supportedby previous published results. Imesch et al. [34] found thatthe number of melanosomes and the area they cover in themelanocyte’s cytoplasm in hazel and brown iris were three tofive times as large as in blue iris. Thus, genes involved in thedifferentiation of melanocytes and melanin production maycontribute to the genetic correlation between iris color andcontraction furrows. The gene Mitf is required for the differ-entiation of melanocytes as well as the onset and maintenanceof melanin production in these cells [37-39]. Moreover, sev-eral mutations of the tyrosinase gene TYR and the P gene pro-duce clinical albino phenotypes [18]. Recent linkage findings
©2004 Molecular VisionMolecular Vision 2004; 10:821-31 <http://www.molvis.org/molvis/v10/a98>
TABLE 5. MAXIMUM LIKELIHOOD PARAMETER ESTIMATES FROM
MODEL 2, EXCLUDING SHARED ENVIRONMENTAL INFLUENCES
Genetic ---------------------------------------------- Scales Crypts P. Dots Color Wolfflin Furrows-------- ------ ------- ------ -------- -------Crypts 0.66*P. Dots -0.06 0.56*Color 0.06 0.24* 0.84*Wolfflin 0.37* 0.00 -0.22* 0.76*Furrows -0.41* 0.24* 0.44* -0.05 0.77*
Environmental ---------------------------------------------- Scales Crypts P. Dots Color Wolfflin Furrows-------- ------ ------- ------ -------- -------
Crypts 0.34*P. Dots 0.08 0.44*Color -0.04 -0.13 0.16*Wolfflin -0.13 0.07 -0.05 0.24*Furrows 0.01 -0.09 0.17 -0.12 0.23*
Diagonal elements are the heritabilities and environmentalities, ele-ments below are the genetic and environmental correlations. The as-terisk represents a p<0.05 (by a two tailed test).
827
RESULTSDescriptive statistics: Table 1 shows the means and standarddeviations for the five iris characteristics of interest in MZand DZ twins. Levene’s Test for Equality of Variances and t-tests were carried out to examine mean and variance differ-ences between the two groups. Two of the five scales showedno significant mean or variance differences between the groups,satisfying a basic assumption of the twin method. Variancedifferences can affect the fit of the models. However, the fullmodel received an acceptable fit (Table 2), indicating that themagnitude of the variance differences was too small to ob-scure the fit to any great extent.
Age was significantly associated with increasing numberof pigment dots (r=0.31, p<0.05), Fuchs’ crypts (r=0.14,p<0.05), as well as lighter iris color (r=-0.14, p<0.05), andless distinct contraction furrows (r=-0.12, p<0.05). Males hada greater number of Fuchs’ crypts than females (t(396)=-2.17,p<0.05).
Phenotypic correlations: The phenotypic correlationsamong the iris characteristics are presented in Table 3. Six outof ten phenotypic correlations were significant. Darker iriscolor, lower frequency of Fuchs’ crypts, and increasing fre-quency of pigment dots were associated with more extendedand distinct contraction furrows. Increasing number of pig-
ment dots was also associated with darker iris color. Increas-ing number of Fuchs’ crypts and lighter iris color were associ-ated with more extended and distinct Wolfflin nodules. Allother correlations were non significant and lower than 0.10.
The twin correlations and cross correlations for the fiveiris characteristics, separately for MZ and DZ twin pairs, arereported in Table 4.
The MZ twin correlations were higher than the DZ twincorrelations, providing support for substantial genetic influ-ences as reported previously [2]. The MZ cross correlationswere in most cases greater than the corresponding DZ crosscorrelations, at least for the pairs of measures for which thephenotypic correlation was significant. This pattern of twincross correlations suggests that the covariance among the fiveiris characteristics is determined largely by genetic influencesshared by the measures.
Model fitting analysis: Table 2 summarizes goodness offit statistics for the full Cholesky Model and the threesubmodels. Two main findings emerged from these analyses.First, shared environmental effects were absent and could beconstrained to 0 without a deterioration of the fit to the data( 2=6.94, df=15, p=0.96). In fact Model 2 (excluding sharedenvironmental factors) yielded a better fit than Model 1 (AIC=-77.18 versus -54.12). Second, the additive genetic factors wereimportant for covariation among the five iris characteristics,
©2004 Molecular VisionMolecular Vision 2004; 10:821-31 <http://www.molvis.org/molvis/v10/a98>
TABLE 1. MEANS AND STANDARD DEVIATIONS FOR FIVE SCALES
DESCRIBING IRIS CHARACTERISTICS IN MONOZYGOTIC AND DIZYGOTIC
TWINS.
Monozygotic Dizygotic (100 pairs) (99 pairs) ----------- ---------- Scales Mean SD Mean SD-------- ---- ---- ---- ----Crypts 2.14 0.90 2.20 0.88P. dots* 2.03 1.04 1.76 0.98Color** 2.32 0.90 2.16 0.78Wolfflin 1.40 0.67 1.45 0.77Furrows* 2.25 1.18 1.85 1.11
Asterisk indicates the significant mean differences between monozy-gotic and dizygotic twins (p<0.05). Double asterisks indicates thesignificant variance differences between monozygotic and dizygotictwins (p<0.05).
TABLE 2. GOODNESS OF FIT STATISTICS FOR THE FULL CHOLESKY
MODEL AND THREE NESTED SUBMODELS
Models chi-sq df p AIC------------------------------- ------ -- ---- ------Full model 75.88 65 0.18 -54.12No shared environmental effects 82.82 80 0.39 -77.18No genetic correlations 197.51 90 0.00 17.51No environmental correlations 92.77 90 0.40 -87.23
Goodness of fit statistics for the full Cholesky model and three nestedsubmodels in which all parameters in common to the iris characteris-tics (e.g. a12, a13, a14, a15, a23, a24, a25, a34, a35, a45) are fixed at zero. Thetable lists the 2 statistic (chi-sq), the degrees of freedom (df), theestimated significance level (p; if p<0.05 then the model does notfit), and the Akaike information criterion (AIC). The model with themost negative value for the AIC was considered the best model.
TABLE 3. PHENOTYPIC CORRELATIONS AMONG THE MEASURES OF THE
FIVE IRIS CHARACTERISTICS
Scales Crypts P. Dots Color Wolfflin Furrows-------- ------ ------- ------ -------- -------Crypts -P. dots 0.00 -Color 0.03 0.13* -Wolfflin 0.22* 0.02 -0.19* -Furrows -0.29* 0.13* 0.39* -0.06 -
The asterisk represents a p<0.05 (by a two tailed test).
TABLE 4. TWIN CORRELATIONS AND TWIN CROSS CORRELATIONS FOR
THE FIVE IRIS CHARACTERISTICS BY ZYGOSITY
Monozygotic twins (100 pairs) ---------------------------------------------- Scales Crypts P. Dots Color Wolfflin Furrows-------- ------ ------- ------ -------- -------Crypts 0.66*P. dots -0.05 0.58*Color 0.06 0.20* 0.87*Wolfflin 0.22* -0.05 -0.18 0.75*Furrows -0.23* 0.24* 0.37* 0.03 0.79*
Dizygotic twins (99 pairs) ---------------------------------------------- Scales Crypts P. Dots Color Wolfflin Furrows-------- ------ ------- ------ -------- -------Crypts 0.34*P. dots -0.12 0.27*Color 0.06 0.25* 0.53*Wolfflin -0.10 -0.10 -0.06 -0.20*Furrows -0.16 0.10 0.38* -0.17 -0.28*
Within pair correlations are shown on the diagonal, and the cross-twin correlations are shown off-diagonal. The asterisk represents ap<0.05 (by a two tailed test).
826
ST
UD
Y II

The gene Mitf, implicated in the development of melanocytesin the anterior border layer, is an obvious candidate gene forthe genetic correlation between crypt frequency and contrac-tion furrows. But Mitf also negatively regulates the expres-sion of Pax6 [40], a master control gene for iris development,and decreases or increases over the normal level of Pax6 ex-pression lead to specific eye anterior segment defects [41].The genetic correlation between crypt frequency and contrac-tion furrows may therefore be dependent on genes that inter-act with Pax6 (such as Mitf) and downstream targets of Pax6,such as Six3 as well as Lmx1b, Hox-7.1, and Hox-8. These areexpressed in a subset of periocular mesenchymal cells origi-nating from the neural crest, which during morphogenesismigrate from the optic cup margin over the lens to form theembryonic pupillary membrane. These, in turn, will developto become the fibroblasts, melanocytes and collagen fibers(type I and III) in the adult iris [33]. Mis-expression of Six3 inthe chick attenuates proliferation and differentiation of perio-cular mesenchymal cells of the iris. This implies that Six3,Lmx1b, Hox-7.1, and Hox-8, may be involved in the forma-tion of Fuchs’ crypts in the anterior border layer [3,15-17].Other genes that may influence the development of Fuchs’crypts as well as the variability of contraction furrows in thehuman iris are RIEG1/PITX2 [12], and FKHL7/FOXC1 [42].
The third strongest significant genetic correlation was be-tween more extended rings of Wolfflin nodules and higherfrequency of Fuchs’ crypts (rA=0.37, p<0.05). This may re-flect observations that Wolfflin nodules, which mainly con-tain collagen fibers [35,43], in part are rest products from at-rophy in the anterior border layer [44,45]. The histologicalsimilarity between Brushfield spots and Wolfflin nodules, aswell as the fact that the position and the appearance ofBrushfield spots for patients with Down’s syndrome can bequite similar to what is seen in normal controls [35,43], mayindicate that the region on chromosome 21 that has been asso-ciated with Brushfield spots [46] also holds candidates genesfor Wolfflin nodules. The genes ERG [47], ETS2 [48], HMG[49], MX1 [50], WRB [51], DSCR1 [52], and SH3BGR [53] aswell as other genes which map to this region [54], could fromthis perspective be potential candidate genes for Wolfflin nod-ules and by extension, the genetic correlations between cryptfrequency and Wolfflin nodules. However, normal individu-als with mutations in some of those genes do not have WolfflinNodules or Brushfield spots, indicating that their appearancemay depend on interactions between several genes. Researchincluding both normal individuals with Wolfflin nodules andDown’s syndrome patients with Brushfield spots needs to beperformed to find out the extent to which the genetic origin ofWolfflin nodules differs from, or overlaps with, the geneticorigin of Brushfield spots.
The differences in results for pigment dots in the fullsample versus the sample excluding twins younger than 15years old are difficult to explain, as we anticipated that thegenetic correlations should have been greater in samples thathave reached their full development of pigment dots. One likelyexplanation is that the sample size that remained lacked thepower to detect correlations in the 0.10 range. Alternatively,
there simply is little if any association between pigment dotsand the other iris characteristics.
Methodological implication for molecular iris research:Given the high inter-rater reliabilities (91%-97%), heritabili-ties (58%-90%) [2] and relatively low but significant geneticcorrelations (0.22 to 0.44) for the iris characteristics reported,we suggest additional studies are necessary to test to whatextent the candidate genes reviewed above contribute to theobserved heritabilities and genetic correlations. The extent thatalleles in candidate genes explain heritable variation in theiris characteristics can readily be calculated with a slight modi-fication of the structural equation model used in this study[55]. Iris data collected from twins may therefore provide amethod to pinpoint how genes interact in the formation of dif-ferent characteristics in the human iris.
ACKNOWLEDGEMENTS This study was supported by funds from the Department ofSocial Sciences at Örebro University in Sweden and The Swed-ish Foundation for International Cooperation in Research andHigher Education. We are grateful to Dr. Angelica Burkhardtfor preparing the data material, Anna Törnblom and UlrikaSandberg for their accurate work as raters, and all the twinsfor their cooperation.
REFERENCES 1. Bito LZ, Matheny A, Cruickshanks KJ, Nondahl DM, Carino OB.
Eye color changes past early childhood. The Louisville TwinStudy. Arch Ophthalmol 1997; 115:659-63.
2. Larsson M, Pedersen NL, Stattin H. Importance of genetic effectsfor characteristics of the human iris. Twin Res 2003; 6:192-200.
3. Hsieh YW, Zhang XM, Lin E, Oliver G, Yang XJ. The homeoboxgene Six3 is a potential regulator of anterior segment formationin the chick eye. Dev Biol 2002; 248:265-80.
4. Jaworski C, Sperbeck S, Graham C, Wistow G. Alternative splic-ing of Pax6 in bovine eye and evolutionary conservation of in-tron sequences. Biochem Biophys Res Commun 1997; 240:196-202.
5. Wentzel P, Bergh K, Wallin O, Niemela P, Stjernschantz J. Tran-scription of prostanoid receptor genes and cyclooxygenase en-zyme genes in cultivated human iridial melanocytes from eyesof different colours. Pigment Cell Res 2003; 16:43-9.
6. Ragge NK, Falk RE, Cohen WE, Murphree AL. Images of Lischnodules across the spectrum. Eye 1993; 7:95-101.
7. Kim I, Ryan AM, Rohan R, Amano S, Agular S, Miller JW, AdamisAP. Constitutive expression of VEGF, VEGFR-1, and VEGFR-2 in normal eyes. Invest Ophthalmol Vis Sci 1999; 40:2115-21.Erratum in: Invest Ophthalmol Vis Sci 2000; 41:368.
8. Kivela T, Jaaskelainen J, Vaheri A, Carpen O. Ezrin, a membrane-organizing protein, as a polarization marker of the retinal pig-ment epithelium in vertebrates. Cell Tissue Res 2000; 301:217-23.
9. Friedman JS, Faucher M, Hiscott P, Biron VL, Malenfant M,Turcotte P, Raymond V, Walter MA. Protein localization in thehuman eye and genetic screen of opticin. Hum Mol Genet 2002;11:1333-42.
10. Smith RS, Zabaleta A, Kume T, Savinova OV, Kidson SH, Mar-tin JE, Nishimura DY, Alward WL, Hogan BL, John SW.Haploinsufficiency of the transcription factors FOXC1 andFOXC2 results in aberrant ocular development. Hum Mol Genet
©2004 Molecular VisionMolecular Vision 2004; 10:821-31 <http://www.molvis.org/molvis/v10/a98>
829
suggest that much of the genetic variance for eye color in nor-mally developed eyes is explained by the P gene [14]. Thus,Mitf, TYR, and the P are candidate genes for explaining someof the genetic correlation between iris color and the extensionand distinction of contraction furrows.
The second strongest genetic correlation was betweenfewer Fuchs’ crypts and more extended contraction furrows(rA=-0.41, p<0.05). Increasing number of Fuchs’ crypts de-creases the overall density and thickness of the iris and thismay allow the iris to fold in different locations when the pupiladapts to different light conditions. This, in turn, would giveless extended and distinct contraction furrows. Alternatively,contraction furrows may still be present in the deeper cell lay-ers of irises with high crypt frequency, but due to the patchlike absence of tissue in the anterior border layer, leave lessextended contraction furrows there.
In turning to the task of identifying plausible candidategenes that could explain this finding, the embryological andhistological development of Fuchs’ crypts needs to be consid-ered. Fuchs’ crypts may represent local anomalies in the em-bryonic pupillary membrane where tissue fails to form be-cause of the lack of inductive signals occurring sometime be-tween the third and six month of gestation. By the seventhmonth of gestation, the absorption of the embryonic pupillarymembrane is complete and could spill over into the mainstroma leaf [33]. Genes expressed in precursors to the ante-rior border layer and underlying stroma during this period canthus be considered to be candidate genes for crypt frequency.However, due to the interdependence of the variability ofFuchs’ crypt and contraction furrows mentioned earlier, suchgenes could also be considered to be candidate genes for thecovariation between Fuchs’ crypts and contraction furrows.
©2004 Molecular VisionMolecular Vision 2004; 10:821-31 <http://www.molvis.org/molvis/v10/a98>
Figure 7. Standardized path coefficients and 95% confidence intervals from Model 2. All paths representing additive genetic and nonsharedenvironmental effects were freely estimated. Shared environmental effects were fixed at 0. Statistically significant (p<0.05; based on a chi-square with 1 df) differences are marked with an asterisk.
828
ST
UD
Y II

mosome 21 of IFI-78K gene, the human equivalent of murineMx gene. Somat Cell Mol Genet 1988; 14:123-31.
51. Egeo A, Mazzocco M, Sotgia F, Arrigo P, Oliva R, Bergonon S,Nizetic D, Rasore-Quartino A, Scartezzini P. Identification andcharacterization of a new human cDNA from chromosome21q22.3 encoding a basic nuclear protein. Hum Genet 1998;102:289-93.
52. Fuentes JJ, Pritchard MA, Planas AM, Bosch A, Ferrer I, EstivillX. A new human gene from the Down syndrome critical regionencodes a proline-rich protein highly expressed in fetal brainand heart. Hum Mol Genet 1995; 4:1935-44.
53. Vidal-Taboada JM, Bergonon S, Scartezzini P, Egeo A, NizeticD, Oliva R. High-resolution physical map and identification of
©2004 Molecular VisionMolecular Vision 2004; 10:821-31 <http://www.molvis.org/molvis/v10/a98>
potentially regulatory sequences of the human SH3BGR locatedin the Down syndrome chromosomal region. Biochem BiophysRes Commun 1997; 241:321-6.
54. Gosset P, Crete N, Ait Ghezala G, Theophile D, Van BroeckhovenC, Vayssettes C, Sinet PM, Creau N. A high-resolution map of1.6 Mb in the Down syndrome region: a new map betweenD21S55 and ETS2. Mamm Genome 1995; 6:127-30.
55. Zhu G, Duffy DL, Eldridge A, Grace M, Mayne C, O’Gorman L,Aitken JF, Neale MC, Hayward NK, Green AC, Martin NG. Amajor quantitative-trait locus for mole density is linked to thefamilial melanoma gene CDKN2A: a maximum-likelihood com-bined linkage and association analysis in twins and their sibs.Am J Hum Genet 1999; 65:483-92.
831
The print version of this article was created on 2 Nov 2004. This reflects all typographical corrections and errata to the article through that date.Details of any changes may be found in the online version of the article.
2000; 9:1021-32.11. Huang W, Jaroszewski J, Ortego J, Escribano J, Coca-Prados M.
Expression of the TIGR gene in the iris, ciliary body, and trabe-cular meshwork of the human eye. Ophthalmic Genet 2000;21:155-69.
12. Kulak SC, Kozlowski K, Semina EV, Pearce WG, Walter MA.Mutation in the RIEG1 gene in patients withiridogoniodysgenesis syndrome. Hum Mol Genet 1998; 7:1113-7.
13. Orlow SJ, Brilliant MH. The pink-eyed dilution locus controlsthe biogenesis of melanosomes and levels of melanosomal pro-teins in the eye. Exp Eye Res 1999; 68:147-54.
14. Rebbeck TR, Kanetsky PA, Walker AH, Holmes R, Halpern AC,Schuchter LM, Elder DE, Guerry D. P gene as an inheritedbiomarker of human eye color. Cancer Epidemiol BiomarkersPrev 2002; 11:782-4.
15. Lichter PR, Richards JE, Downs CA, Stringham HM, BoehnkeM, Farley FA. Cosegregation of open-angle glaucoma and thenail-patella syndrome. Am J Ophthalmol 1997; 124:506-15.
16. Pressman CL, Chen H, Johnson RL. LMX1B, a LIMhomeodomain class transcription factor, is necessary for nor-mal development of multiple tissues in the anterior segment ofthe murine eye. Genesis 2000; 26:15-25.
17. Monaghan AP, Davidson DR, Sime C, Graham E, Baldock R,Bhattacharya SS, Hill RE. The Msh-like homeobox genes de-fine domains in the developing vertebrate eye. Development1991; 112:1053-61.
18. Oetting WS, King RA. Molecular basis of albinism: mutationsand polymorphisms of pigmentation genes associated with al-binism. Hum Mutat 1999; 13:99-115.
19. Wistow G, Bernstein SL, Ray S, Wyatt MK, Behal A, TouchmanJW, Bouffard G, Smith D, Peterson K. Expressed sequence taganalysis of adult human iris for the NEIBank Project: steroid-response factors and similarities with retinal pigment epithe-lium. Mol Vis 2002; 8:185-95 .
20. Simpson TI, Price DJ. Pax6; a pleiotropic player in development.Bioessays 2002; 24:1041-51.
21. Graw J. Genetic aspects of embryonic eye development in verte-brates. Dev Genet 1996; 18:181-97.
22. Sale MM, Craig JE, Charlesworth JC, FitzGerald LM, HansonIM, Dickinson JL, Matthews SJ, Heyningen Vv V, Fingert JH,Mackey DA. Broad phenotypic variability in a single pedigreewith a novel 1410delC mutation in the PST domain of the PAX6gene. Hum Mutat 2002; 20:322.
23. Burkhardt A. [The color and structure of the human iris. 2. Stud-ies of 200 twins]. Anthropol Anz 1992; 50:235-70.
24. Nichols RC, Bilbro WC Jr. The diagnosis of twin zygosity. ActaGenet Stat Med 1966; 16:265-75.
25. Kasriel J, Eaves L. The zygosity of twins: further evidence on theagreement between diagnosis by blood groups and written ques-tionnaires. J Biosoc Sci 1976; 8:263-6.
26. Neale MC, Cardon LR. Methodology for genetic studies of twinsand families. Kluwer Academic Publisher; 1992.
27. McGue M, Bouchard TJ Jr. Adjustment of twin data for the ef-fects of age and sex. Behav Genet 1984; 14:325-43.
28. Neale MC, Walters EE, Eaves LJ, Maes HH, Kendler KS. Multi-variate genetic analysis of twin-family data on fears: Mx mod-els. Behav Genet 1994; 24:119-39.
29. Peck R, Williams LA. SPSS Manual. Boston: Addison WesleyPublishing Company; 2002.
30. Akaike H. Factor analysis and AIC. Psychometrika 1987; 52:317-32.
31. Eagle RC Jr. Iris pigmentation and pigmented lesions: an ultra-
structural study. Trans Am Ophthalmol Soc 1988; 86:581-687.32. Jakobiec FA, Silbert G. Are most iris “melanomas” really nevi?
A clinicopathologic study of 189 lesions. Arch Ophthalmol 1981;99:2117-32.
33. Oyster CW. The human eye: structure and function. Sunderland(MA): Sinauer Associates; 1999.
34. Imesch PD, Bindley CD, Khademian Z, Ladd B, Gangnon R,Albert DM, Wallow IH. Melanocytes and iris color. Electronmicroscopic findings. Arch Ophthalmol 1996; 114:443-7.
35. Donaldson DD. The significance of spotting of the iris inmongolids: Brushfield spots. Arch Ophthalmol 1961; 65:26-31.
36. Brooke Williams RD. Brushfield spots and Wolfflin nodules inthe iris: an appraisal in handicapped children. Dev Med ChildNeurol 1981; 23:646-9.
37. Opdecamp K, Nakayama A, Nguyen MT, Hodgkinson CA, PavanWJ, Arnheiter H. Melanocyte development in vivo and in neu-ral crest cell cultures: crucial dependence on the Mitf basic-helix-loop-helix-zipper transcription factor. Development 1997;124:2377-86.
38. Yavuzer U, Keenan E, Lowings P, Vachtenheim J, Currie G,Goding CR. The Microphthalmia gene product interacts withthe retinoblastoma protein in vitro and is a target for deregula-tion of melanocyte-specific transcription. Oncogene 1995;10:123-34.
39. Planque N, Leconte L, Coquelle FM, Martin P, Saule S. SpecificPax-6/microphthalmia transcription factor interactions involvetheir DNA-binding domains and inhibit transcriptional proper-ties of both proteins. J Biol Chem 2001; 276:29330-7.
40. Mochii M, Mazaki Y, Mizuno N, Hayashi H, Eguchi G. Role ofMitf in differentiation and transdifferentiation of chicken pig-mented epithelial cell. Dev Biol 1998; 193:47-62.
41. Schedl A, Ross A, Lee M, Engelkamp D, Rashbass P, vanHeyningen V, Hastie ND. Influence of PAX6 gene dosage ondevelopment: overexpression causes severe eye abnormalities.Cell 1996; 86:71-82.
42. Alward WL. Axenfeld-Rieger syndrome in the age of moleculargenetics. Am J Ophthalmol 2000; 130:107-15.
43. Jaeger EA. Ocular findings in Down’s syndrome. Trans AmOphthalmol Soc 1980; 78:808-45.
44. Purtscher E. [Nodular densification of stroma iridis in mongol-ism.]. Albrecht Von Graefes Arch Ophthalmol 1958; 160:200-15.
45. Lowe R. The eyes in mongolism. Br J Ophthalmol 1949; 33:131-54.
46. Delabar JM, Theophile D, Rahmani Z, Chettouh Z, Blouin JL,Prieur M, Noel B, Sinet PM. Molecular mapping of twenty-four features of Down syndrome on chromosome 21. Eur J HumGenet 1993; 1:114-24.
47. Rao VN, Papas TS, Reddy ES. erg, a human ets-related gene onchromosome 21: alternative splicing, polyadenylation, and trans-lation. Science 1987; 237:635-9.
48. Boulukos KE, Pognonec P, Begue A, Galibert F, Gesquiere JC,Stehelin D, Ghysdael J. Identification in chickens of an evolu-tionarily conserved cellular ets-2 gene (c-ets-2) encoding nuclearproteins related to the products of the c-ets proto-oncogene.EMBO J 1988; 7:697-705.
49. Landsman D, McBride OW, Soares N, Crippa MP, Srikantha T,Bustin M. Chromosomal protein HMG-14. Identification, char-acterization, and chromosome localization of a functional genefrom the large human multigene family. J Biol Chem 1989;264:3421-7.
50. Horisberger MA, Wathelet M, Szpirer J, Szpirer C, Islam Q, LevanG, Huez G, Content J. cDNA cloning and assignment to chro-
©2004 Molecular VisionMolecular Vision 2004; 10:821-31 <http://www.molvis.org/molvis/v10/a98>
830
ST
UD
Y II

ASDSADFDFSDDDDDDDDDDDDDDDDDDDDDDDDDDDDDDDDDDDDDDDDDDDSTUDY III

ASDSADFDFSDDDDDDDDDDDDDDDDDDDDDDDDDDDDDDDDDDDDDDDDDDDSTUDY III

Associations between iris characteristics and personality in adulthood
Mats Larsson a,*, Nancy L. Pedersen b, Hakan Stattin a
a Department of Behavioral, Social and Legal Sciences, Center for Developmental Research, Orebro University, 701 82 Orebro, Swedenb Department of Medical Epidemiology and Biostatistics Karolinska Institutet, Box 281, 171 77 Stockholm, Sweden
Received 10 March 2005; accepted 24 January 2007
Available online 1 February 2007
Abstract
Variable and person-oriented analyses were used to explore the associations between personality and three previously untested general iris
characteristics: crypts, pigment dots and contraction furrows. Personality data, as measured by the NEO PI-R and ratings of iris characteristics from
428 undergraduate students were collected. Crypts were significantly associated with five approach-related behaviors, i.e., feelings, tendermind-
edness, warmth, trust and positive emotions, whereas furrows were associated with impulsiveness. These findings suggest that because Pax6
induces tissue deficiencies in both the iris and the left anterior cingulate cortex, Pax6 may influence the extent people engage in approach-related
behaviors. The results from using a person-oriented analysis suggested that people with different iris configurations tend to develop along different
personality trajectories. Future longitudinal studies, twin-studies and genetic association studies, may benefit from collecting iris data and testing
candidate genes for crypts and furrows.
# 2007 Elsevier B.V. All rights reserved.
Keywords: Personality; Iris characteristics/crypts/pigment dots/contraction furrows; Candidate genes/Pax6/Six3/Lmx1b; Anterior cingulate; Hemispheric
asymmetries
1. Introduction
The idea that personality differences are related to iris
characteristics is not new. In 1965, Cattell (1965) observed
differences in cognitive styles between blue and brown eyed
subjects and since then eye color has been found to be related to a
great variety of physiological and behavioral characteristics.
Dark eyed people have on average higher scores on extraversion,
neuroticism (Gentry et al., 1985), ease of emotional arousal
(Markle, 1976) and sociability (Gary and Glover, 1976).
However, there are a number of studies that fail to replicate
the personality findings, typically because the effect tends to fade
after early childhood. For instance, Rubin and Both (1989) found
that blue-eyed children in kindergarten and Grade 2 were
overrepresented in groups of extremely withdrawn youngsters,
whereas no association could be found in Grade 4 or between eye
color and extreme sociability in any grade. Furthermore, in
subjects around 20 years of age, eye color failed to account for
any difference between high versus low scorers on personality
measures (Lester, 1987; Rim, 1983). Consequently, it has been
assumed that the biological mechanisms that may underlie the
association between eye color and social wariness in early
childhood tends to be ‘‘overcome’’ around age 9 when the
increasing influence of social environmental factors has gained
momentum (Rubin and Both, 1989). To our knowledge, no
research has been reported concerning eye color and its relation
to personality since 1998, when Coplan et al. (1998) found a
significant eye color by gender interaction for social wariness in a
sample of 3.5–5.5-year-old toddlers. This finding raised further
questions regarding the phenotypic penetrance of the suggested
biological mechanism involved. Leading researchers in the field
concluded that eye color cannot be a useful marker for
personality in older ages (Coplan et al., 1998; Rosenberg and
Kagan, 1989; Rubin and Both, 1989).
One of the reasons eye color has been considered to be a
useful biomarker is its high heritability (98%), and the fact that
eye color does not change much over time (Bito et al., 1997).
Other key reasons are that eye color can be linked to biological
mechanisms that provide a somewhat speculative, but still
plausible, biological explanation for the associations found. For
instance, Kagan suggested that melanin production in the eyes
(the pigment that colors the eye brown), may be associated with
norepinephrine and cortisol production, which are biological
www.elsevier.com/locate/biopsycho
Biological Psychology 75 (2007) 165–175
* Corresponding author. Tel.: +46 19 303415; fax: +46 19 303484.
E-mail address: [email protected] (M. Larsson).
0301-0511/$ – see front matter # 2007 Elsevier B.V. All rights reserved.
doi:10.1016/j.biopsycho.2007.01.007
ST
UD
Y III

cingulate gyrus accounted for 24% of the variance in harm
avoidance. Overall, these findings are consistent with the
assumed specialization of each hemisphere in the control of
individual differences in withdrawal- and approach-related
behaviors (Davidson, 1992, 2001; Davidson and Irwin, 1999;
Pujol et al., 2002).
Moreover, the fact that the production of dopamine (Kohwi
et al., 2005) and noradrenalin neurons (Jaworski et al., 1997)
has been associated with Pax6 functioning provides another
link to personality (Reif and Lesch, 2003; Rosenberg and
Kagan, 1989). But Pax6 is not the only candidate gene for crypt
frequency and contraction furrows that potentially could
influence personality. Lmx1b is required for the survival of
the dopaminergic neurons in the mesolimbic system (Burbach
et al., 2003). It is also essential for the production of
serotoninergic neurons (Ding et al., 2003), and Six3, which
is a downstream target to Pax6 (Simpson and Price, 2002) and
which controls the division of the brain into two hemispheres
(Wallis and Muenke, 2000). Thus, based on these findings we
assume that tissue differences in the iris, such as crypts and
contraction furrows, could be associated with Pax6, Six3 and
Lmx1b, which in turn could be associated with personality.
The links between pigment dots and personality are less well
documented, but nevertheless, pigment dots could potentially be
associated with personality, as the development of pigment dots
is in part regulated by neurotransmitters produced by the
autonomic nervous system (Hu, 2000; Hu et al., 2000; Mukuno
and Witmer, 1977), which in turn is influenced by the extent the
individual engages in withdrawal- and approach-related beha-
viors (Davidson and Irwin, 1999). Thus, through the expression
patterns of Pax6, Six3 and Lmx1b in the iris and the brain, crypts,
contraction furrows and pigment dots may be associated with
both brain structures and neurotransmitters that influence
personality. However, there is no evidence available that shows
that these genes influence crypts and contraction furrows directly.
In addition, other candidate genes for crypts and contraction
furrows have been recognized (Larsson and Pedersen, 2004).
In order to discriminate between the biological pathways
that theoretically could influence the presumed association
between iris characteristics and personality, and to more fully
evaluate a potential role of Pax6, we test three hypotheses. They
draw heavily on the Pax6 expression pattern in the anterior
cingulate cortex as documented by Ellison-Wright et al. (2004),
in conjunction with the findings made by Pujol et al. (2002),
Davidson (1992, 2001) and Davidson and Irwin (1999). These
hypotheses increase in their specificity. If all three hypotheses
are supported, we believe there is a high likelihood that Pax6,
rather than other candidates, is involved. Thus, based on the
findings reviewed above, we expect, first, that crypts more often
than other iris characteristics will be associated with
personality. Crypts are related to greater tissue loss in the
iris than the other two iris characteristics, which in turn may
reflect greater tissue loss in the brain (which makes it likely that
more measures of personality are associated with crypts than
the other iris characteristics). Second, because the tissue
damage that was due to Pax6 mutations in anterior cingulate
cortex primarily affected the left hemisphere (Ellison-Wright
et al., 2004), and this hemisphere primarily relates to approach-
related behaviors (Davidson, 1992, 2001; Davidson and Irwin,
1999), we expect that crypt frequency in most cases will be
related approach-related behaviors. Third, because greater
tissue loss in the iris, may reflect greater tissue loss in the left
anterior cingulate cortex, we expect individuals with an open
crypt structure (those with more tissue loss in the iris) to score
lower on traits that relate to approach-related behaviors than
those with a dense crypt structure. Furthermore, in order to
deepen the analysis, the present study combines variable- and
person-oriented approaches. As has been shown repeatedly
within a holistic interactionistic framework, person-oriented
approaches are able to answer different questions than more
traditional variable-oriented approaches (Bergman and Mag-
nusson, 1997; Magnusson and Stattin, 1998; von Eye and
Bergman, 2003). For example, in variable-oriented analysis the
relationship among variables and their way of functioning in the
totality of an individual is assumed to be the same for all
individuals. However, this prerequisite may not be fulfilled in
the present study since most of the genetic variance for each iris
characteristic is independent of the other iris characteristics
(Larsson and Pedersen, 2004). In other words, the behavioral
meaning of having a specific crypt frequency may depend on
which other iris characteristics are present in any one iris
(Lander and Schork, 1994). Person-oriented analysis takes
these possibilities into consideration and is based on the
perspective that the individual organism can be thoroughly
understood in its totality (Bergman and Magnusson, 1997).
Furthermore, this totality is assumed to result from self-
organization. This means that although there are, theoretically,
an infinite variety of differences with regard to process
characteristics and observed states at a detailed level, at a more
global level there will often be a small number of more
frequently observed patterns (Bergman and Magnusson, 1997;
Bergman et al., 2003). This principle of self-organization has
been demonstrated in many human biological systems and has
been applied to the development of the neural, sensory and
cognitive systems (Post and Weiss, 1997) as well as personality
(Bosma and Kunnen, 2002; Carver and Scheier, 2002).
Consequently, we expect that from the embryological events
that form the adult iris (detailed level), distinct configurations
of iris characteristics will occur in the population studied.
Furthermore, if the iris characteristics that define these
naturally occurring configurations are associated with person-
ality, then we expect that these configurations will define
subgroups of individuals that differ from each other on
personality in a systematic manner. Developmentally, the
individuals in these subgroups may represent different
trajectories with regard to personality, and subgroups with
more tissue loss in the iris are, just as in the variable-oriented
analysis, expected to score lower on approach-related
behaviors. Moreover, because the relationship among iris
variables and their way of functioning in the totality of an
individual is not likely to be the same for all individuals (Lander
and Schork, 1994; Larsson and Pedersen, 2004), the effect size
in the variable-oriented analysis is expected to be lower than in
the person-oriented analyses.
M. Larsson et al. / Biological Psychology 75 (2007) 165–175 167
indices of behavioral inhibition (Kagan et al., 1988; Reznick,
1989).
High levels of norepinephrine and cortisol can thus
potentially inhibit melanin production in the eye and increase
responsiveness of the limbic system, which has been associated
with higher scores on inhibition (Rosenberg and Kagan, 1989).
Placental cortisol level during the initial stages of pregnancy
and the gene POMC, which are likely to play an important role
in individuals’ responses to varying levels of arousal
(Kupfermann, 1991) and to the synthesis of melanin (Pawelek
and Korner, 1982), have also been suggested to contribute to the
associations found.
However, if one carefully examines people’s irises, it is clear
that there are other iris characteristics than eye color that
potentially could be associated with personality, such as Fuchs’
crypts, contraction furrows and pigment dots. To take one
example, if the biological mechanisms associated with the
frequency of Fuchs’ crypts (a measure characterized by
different degrees of hypoplasia of the anterior border layer
and underlying stroma in the iris), influence behavior, then
biological mechanisms other than those suggested to be
associated with eye color can be responsible for the
associations. This study explores the association between iris
characteristics other than eye color and personality. Three
general iris characteristics that to our knowledge not have been
considered previously will be tested.
The iris characteristics of interest in this study are depicted
in Fig. 1: frequency of Fuchs’ crypts in the main stroma leaf
(which from now on will only be called ‘‘crypts’’); frequency of
pigment dots; the distinction and extension of contraction
furrows. These iris characteristics are moderately to highly
heritable, show no sex differences and are stable over time
(Larsson et al., 2003).
Crypts and contraction furrows are measures that are related
to the thickness and density of the iris. Crypt frequency is
characterized by different degrees of hypoplasia in the two top
cell layers in the iris (i.e., anterior border layer and underlying
stroma), whereas contraction furrows are characterized by
different degrees of hypoplasia or density conditions in any of
the five cell layers present in the iris (Oyster, 1999). What is
intriguing about these cell layers is that genes that influence the
growth of precursors to these cell layers during the
embryological development also cause tissue loss in the brain.
For example, the genes Pax6, Six3 and Lmx1b have been
recognized as candidate genes for crypts and contraction
furrows (Hsieh et al., 2002; Pressman et al., 2000; Sale et al.,
2002) and the embryological events that make these genes
plausible candidates for crypts and contraction furrows have
been reviewed (Larsson and Pedersen, 2004). In addition, the
most recent studies available confirm that Pax6 is a likely
candidate gene for tissue differences in the iris. Pax6 dosage
influences the muscle-cell differentiation in the iris (Jensen,
2005), and Davis-Silberman et al. (2005) conclude that (p.
2474) iris stroma defects are likely to be due to cell-non-
autonomous events, where Pax6 regulates the expression of the
cells that are required for the adhesion of the iris stroma. Thus,
it is possible that Pax6, Six3 and Lmx1b, which influence the
growth of the precursors to the cell layers in the iris, could
influence the variability of crypts and contraction furrows
typically present in people’s irises (Hsieh et al., 2002; Pressman
et al., 2000; Sale et al., 2002; Simpson and Price, 2002).
Furthermore, the expression pattern of these genes in the brain
supports the notion that these iris characteristics can be
associated with personality. In the first study published that
has demonstrated a major genetic contribution to frontal lobe
dysfunction, family members with a mutation in Pax6 showed
high rates of unusual behavior including disinhibition, impulsive
behavior, impaired social understanding and impaired verbal
inhibition (Heyman et al., 1999). In addition, magnetic resonance
imaging (MRI) in this family (Ellison-Wright et al., 2004)
demonstrated local gray and white matter changes in anterior
cingulate cortex (approximate Brodmann areas 24 and 32), as
well as posterior white matter abnormalities in corpus callosum
extending posteriorly into cingulate cortex, which are brain areas
that have been associated with personality (Davidson, 2001;
Johnson et al., 1999; Posner and Rothbart, 1998). Healthy
university subjects with larger right anterior cingulate gyrus
(Brodmann’s areas 24a, 24b and 25), score higher on harm
avoidance, which is associated with emotional responses that
regulate withdrawal-related behaviors, whereas subjects with
larger left cingulate gyrus, score higher on Novelty seeking,
which is associated with emotional responses that regulate
approach-related behaviors (Pujol et al., 2002). Indeed,
anatomical data revealed that hemispheric asymmetry in the
anterior cingulate gyrus was very common (83% of
cases, n = 100) and that surface measures of the right anterior
Fig. 1. The numbered arrows point toward the iris characteristics of interest. (1) Furchs’ crypts in the main stroma leaf; (2) pigment dots; (3) contraction furrows.
M. Larsson et al. / Biological Psychology 75 (2007) 165–175166
ST
UD
Y III

significantly associated with crypt frequency: openness to
experience and agreeableness. In contrast, furrows were only
associated with neuroticism, and pigment dots were not
associated with any of the main domains of personality. Not
surprisingly, most of the correlations between the specific
facets of personality and crypt frequency were found for facets
belonging to the two domains with significant associations.
Thus, our first hypothesis – i.e., that most association should
involve crypt frequency – was confirmed. Furthermore, our
second and third hypotheses – i.e., that crypt frequency in most
cases should be related to approach-related behaviors and that
individuals with a dense crypt structure should score higher on
such behaviors – was also confirmed. Most of the significant
associations with crypt pinpointed behaviors that measure
approach-related behaviors and individuals with a dense crypt
structure scored higher on such behaviors (i.e., warmth, positive
emotions, openness to experience, feelings, agreeableness, trust
and tendermindedness).
In addition, the magnitude of the associations with the iris
characteristics was, as expected, quite modest and ranged from
.10 to .15. No associations between eye color and personality
could be found (results not shown).
We are aware that many correlations are reported in Table 2. If
we were to apply a conservative Bonferroni correction, no
significant correlation would remain. Nevertheless, for two of the
three measures of iris characteristics, the number of significant
correlations obtained is significantly above chance. As for the
associations between crypts and the Big Five measures, we
conducted35separate analyses. Bychance, wewouldexpect1.75
analyses with p-values of .05 or lower (35 analyses � .05 = 1.75)
and .35 analyses with p-values of .01 or lower (35 analyses �.01 = .35). For crypts, we obtain eight significant correlations at
the .05 level and five at the .01. For furrows, we obtain three
correlations with p-values of .05 or lower and 2 at the p-value of
.01 or lower. Hence, for crypts and furrows, the number of signi-
ficant correlations is well above the chance. For pigment dots, on
the other hand, the findings are not much different from chance
expectations. Moreover, the fact that most of the significant
associations in Table 2 are consistent with our hypotheses
decreases the likelihood that these findings are due to random
effects. The significant results in the person-oriented analysis,
which pinpoint the same behaviors, also support this notion.
In the person-oriented analysis, a four cluster solution was
chosen based on the criteria that each group should differ as
much as possible in their iris morphologically, as well as define
subgroups with a sufficient number of members with a view to
the subsequent analyses of variance. Only the iris measures that
were significantly associated with personality in the variable-
oriented analysis were included in the cluster analysis. The
result of the analysis, which represents the configurations of iris
characteristic that typically tends to appear in early adults, is
presented in Table 3.
3.2. Person-oriented analysis
Two different types of configurations emerged. The
individuals in clusters 1 and 2 had dense crypt structures,
whereas clusters 3 and 4 contained individuals with open crypt
structures. The amount of furrows that existed in each of these
clusters further differentiated between the clusters. Clusters 1
and 4 individuals had few contraction furrows, whereas subjects
in clusters 2 and 3 had many.
The one-way analyses of variance that tested if any mean
differences emerged between these four clusters, produced
results which were in agreement with our expectations, mean
differences in regards to personality emerged (Table 4). Overall,
individuals in the clusters with more tissue loss in the iris scored
lower on approach-related behaviors, compared with thosewith a
dense iris structure. For example, the individuals in cluster 3
scored significantly lower than the individuals in cluster 1 on all
approach-related behaviors that in the variable-oriented analysis
were found to be significantly associated to crypts. Hence, tissue
loss in the iris was in the person-oriented analysis, just as in the
variable-oriented analyses, associated with lower scores on
approach-related behaviors.
Table 2
Pearson correlation between iris characteristics and the personality measures
Personality measure Iris characteristics
Crypts Pigment dots Furrows
Neuroticism �.04 .06 .11*
Anxiety �.02 �.01 .06
Angry-hostility .04 .07 .04
Depression .01 .07 .09
Self-consciousness �.05 .08 .09
Impulsiveness �.06 .02 .15**
Vulnerability �.08 .04 .07
Extraversion �.09 �.02 .04
Warmth �.15** �.04 .04
Gregariousness �.05 �.06 �.01
Assertiveness �.01 �.02 �.00
Activity �.05 .00 .05
Excitement seeking .01 .01 .07
Positive emotions �.13** .01 .03
Openness to experience �.10* .01 �.06
Fantasy �.01 .02 �.03
Aesthetics �.13** .01 �.06
Feelings �.14** �.05 �.03
Actions �.03 .02 �.06
Ideas �.01 .03 .02
Values �.07 �.03 �.08
Agreeableness �.10* �.06 �.00
Trust �.11* �.05 �.01
Straightforwardness �.04 �.10* .03
Altruism �.06 .01 .03
Compliance �.04 �.01 �.02
Modesty �.04 �.05 �.01
Tendermindedness �.13** �.03 �.03
Conscientiousness �.07 �.05 �.09
Competence �.02 �.07 �.09
Order .00 �.03 �.08
Dutifulness �.06 �.09 �.01
Achievement striving �.08 �.03 �.06
Self-discipline �.08 �.03 �.12**
Deliberation �.04 .03 �.04
* p < .05.** p < .01.
M. Larsson et al. / Biological Psychology 75 (2007) 165–175 169
To sum up, the purpose of this study is to explore the
association between iris characteristics other than eye color and
personality, using both variable- and person-oriented analyses,
as well as highlight genes expressed in the iris that potentially
could be candidate genes for personality. In performing the
variable-oriented analysis, we test three hypotheses, which
together explore the likelihood that the neurodevelopmental
control gene Pax6 influences personality. In performing the
person-oriented analyses, we test the extent to which self-
organizing properties of the developmental system create
configurations of iris characteristics that can identify subgroups
of individuals who differ in their personality. In comparing the
effect size in the variable- and person-oriented analyses, we
explore how efficiently the self-organizing properties of the
developmental system can identify individuals who differ in
their personality.
2. Method
2.1. Participants and recruitment procedure
The participants were all undergraduate student volunteers at Orebro
University, Sweden, recruited from programs in psychology (47%), social
studies (30%), economics (10%), automatic data processing (5%), political
science (4%) and engineering (4%). Most participants were female (80% of 428
participants). The mean age of the sample was 26.6 years (19–52 years,
S.D. = 7.1). The participants were recruited after a regular lecture by the first
author, who was given an opportunity to describe the study. Consenting
participants filled out the NEO PI-R personality questionnaire in a location
where they were not disturbed (Costa and McCrea, 1992). However, psychology
and social studies students responded to a computerized version of NEO PI-R in
a group setting with 15 students. Close-up iris color photography was taken
individually in a lab setting at the university.
There were two waves of data collection. In the first wave of data collection,
all students that volunteered were accepted as participants. In the second wave,
only those individuals with irises that were most similar to scale-step 1 and 3–5
on the crypt frequency scale (see below) were accepted. This was done in order
to arrive at approximately the same number of participants with each level of
crypt frequency.
2.2. Measures
2.2.1. Personality
Personality was assessed with the Swedish version of the NEO PI-R (Costa
and McCrea, 1992), which is considered to be a reliable and valid assessment of
personality based on the Five-Factor Model of Personality. Eight-item scales
measured six specific facets for each of the five broad factors. The internal
consistencies (Cronbach’s alpha) were high overall, ranging from .69 to .85
(mean = .72) and did not differ substantially from what has been found for other
samples with NEO PI-R measured in Sweden (Costa and McCrae, 1985), and
other countries.
2.2.2. Iris characteristics
Close-up photos, where the diameter of the iris on the 36 mm � 24 mm
Fujicolor, Professional 100 ASA slide film was about 22 mm, were taken of
both irises from all subjects. An Olympus OM-4T camera with a double sided
flash device from Lena Medical Photo Design Systems, and an Olympus 50 mm
macro lens with a 1:2 converter was used. The shutter speed was 60 and the
aperture was set to 16. To assist focus adjustment and to standardize the extent
the iris was dilated, a lamp with standard brightness was shown into the
subjects’ irises during focus and photography. To prevent blurring caused by
involuntary movements from the subjects, all participants rested their cheeks on
a stand during the procedure. The iris photos were digitized using Minoltas
35 mm Dimage Scan Dual film scanner. The resolution of the digitized color
pictures was 768 � 512 pixels (96 pixels/in.). A high contrast color computer
screen (Brand: Eizo; Model: FlexScan F55) with 1024 � 768/85 Hz resolution
(.28 mm Dot Pitch CRT; fH: 27–70 kHz/fV: 50–120 Hz) and the software
program Photo Shop 7.0 was used during the rating process.
Three scales, one for each iris characteristic of interest, were constructed:
frequency of crypts, pigment dots and extension and distinction of contraction
furrows. Specially trained raters independently reviewed the photographs of the
right iris and judged which scale step to which each photo was most similar. The
raters’ judgments were scored on an ordinal scale. Scale construction, the rating
procedure and the reliability of the procedures are reported in detail in Larsson
et al. (2003). The pictures used for the scales may be seen at: http://www.mol-
vis.org/molvis/v10/a98/ (or obtained directly from the first author).
2.2.3. Analysis
The first set of analyses was variable-oriented in nature and tested whether
our three expectations derived from Pax6 expression pattern in the anterior
cingulate cortex were correct. This was done by computing Pearson correlations
between the three iris characteristics and the personality measures. Due to the
fact that the facet level traits in NEO PI-R have their own biological basis (Jang
et al., 1998) and the necessity to include as specific measures as possible has
been emphasized in studies, such as ours (Heyman et al., 1999), both facet level
traits and the main domains of personality were included in the analysis. The
distributions of the iris characteristics used in these analyses are presented in
Table 1.
In the second step, we performed the person-oriented analyses. They tested
if the iris configurations that typically exist in early adults can identify
subgroups of individuals that differ in their personality in a systematic manner.
First a cluster analysis based on WARD’s method (Peck and Williams, 2002)
was performed. Only the iris characteristics that were found to be significantly
associated with personality in the correlation analysis were included. A four
cluster solution was chosen which explained 77% of the total variance in the
sample. The variance explanation was higher than the minimum criterion of
67%, recommended by Bergman et al. (2003). One-way analyses of variance
were used to investigate if any mean differences in personality existed between
the clusters (Tukey HSD were used for post hoc tests). Both facet level traits and
the main domains of personality were included in the variance analysis.
Finally, to explore how efficiently the self-organizing properties of the
developmental system could pick out subgroups of individuals that differed in
their personalities, we calculated the effect size d (Cohen, 1988) for all
associations that were found to be significant in the variable- and person-
oriented analysis.
3. Results
3.1. Variable-oriented analysis
The results of the variable-oriented analyses are presented in
Table 2. We found that two of the five domains were
Table 1
Distribution of iris characteristics
Iris characteristic and scale description Number of
observations
Fuchs’ crypt frequency
(1) Only parallel and/or densely packed curly fibres 129
(2) Spots of wavy fibres and 1–3 two shallow crypts 169
(3) Four shallow crypts or more 130
Pigment dots
(1) Absence of, or only minute grains of pigment dots 280
(2) One pigment dots or more 148
Contraction furrows
(1) Extending less than 1/4 circle 106
(2) Extending between 1/4 and 8/10 of a circle 142
(3) More distinct, extending 8/10 of one circle or more 180
M. Larsson et al. / Biological Psychology 75 (2007) 165–175168
ST
UD
Y III

4. Discussion
The introduction in this study reviews several possible
biological pathways that theoretically could explain an
association between iris characteristics and personality. In
order to more fully evaluate a potential role of the
neurodevelopmental control gene Pax6 we tested three
hypotheses by performing both variable- and person-oriented
analysis. These hypotheses draw heavily on the Pax6
expression pattern in the human iris (Davis-Silberman et al.,
2005; Jensen, 2005; Sale et al., 2002) as well as the anterior
cingulate cortex as documented by Ellison-Wright et al. (2004)
in conjunction with the findings made by Pujol et al. (2002),
Davidson (1992, 2001) and Davidson and Irwin (1999). The
specificity of the hypotheses increased. We believed that if all
predictions were supported the likelihood that Pax6 would be
involved would have to be considered high.
Our first hypothesis, that most of the associations with
personality would be found for crypt frequency, was confirmed.
Furthermore, our second and third hypotheses were also
confirmed; crypts were primarily associated with approach-
related behaviors and individuals with a dense crypt structure
scored higher than those with an open crypt structure on such
behaviors.
Thus, the findings in the variable-oriented analyses show
that crypt frequency is associated with the extent in which
individuals engage in approach-related behavior. Furthermore,
since our hypotheses were confirmed, crypt frequency may
likely be caused by subtle Pax6 differences. In turn, these Pax6
differences may also act as a mediator to approach-related
behavior since Pax6 potentially can induce tissue deficiencies
in the left anterior cingulate cortex.
The results in the person-oriented analysis supported this
notion, as the findings were essentially the same. Clusters with
less tissue loss in the iris were associated with higher scores on
approach-related behaviors and the significant mean differ-
ences between clusters 1 and 3 were systematically pinpointing
such traits (i.e., warmth, positive emotion, feelings, agreeable-
ness, trust and tendermindedness) (see Table 4).
But maybe the most intriguing finding was that smaller
tissue differences than crypts were also of major importance.
This was apparent in three different ways. First, the association
between furrows and the facet scale impulsiveness in the
variable-oriented analyses were of the same magnitude as the
strongest association found for crypts. Second, in the person-
oriented analyses furrows could differentiate between indivi-
duals who scored high and low on the neuroticism and
conscientiousness domain, even when the individuals in these
clusters had the same crypt structure. Third, when the combined
effect of having specific configurations of crypts and furrows
was taken into consideration in the person-oriented analyses,
the effect sizes were on average about twice the magnitude of
what was found in the variable-oriented analyses. Thus, it is
apparent that even smaller tissue differences than crypts were of
importance. Naturally emerging configurations of both crypts
and furrows were, as expected, pinpointing subgroups of
individuals that were especially likely to differ in their
personalities. Indeed, when both crypts and furrows were
Table 5
The effect size for all associations that was significant in the variable- and person-oriented analysis
Personality measure Cohen’s d
Variable-oriented analysisa Person-oriented analysisb
Pearson correlations Clusters
1 and 2
Clusters
1 and 3
Clusters
2 and 3
Clusters
3 and 4
Crypts furrows Crypts furrows
Neuroticism – .22* .33* – – –
Impulsiveness – .30** .36* – – –
Extraversion – – – – – –
Warmth .30** – – .37* – –
Positive emotions .26** – – .39* – –
Openness to experience .20* – – .47** – –
Aesthetics .26** – – .55** – –
Feelings .28** – – .62** .40* –
Values – – .44** – –
Agreeableness .20* – – .36* – –
Trust .22* – – .39** – –
Tendermindedness .26** – – .41** – –
Conscientiousness – – – .42* – .44*
Achievement striving – – – .38* .38* .49*
Self-discipline – .24** – .61** – .57**
a Cohen’s d = 2r/H(1 � r2), where r is the Pearson correlation.b Cohen’s d = M1 � M2/spooled, where M1 is the mean in one of the cluster and M2 is the mean in the other cluster. spooled is the pooled standard deviation for the two
clusters (spooled ¼ p½ðs21 þ s2
2Þ=2�).* p < .05.
** p < .01.
M. Larsson et al. / Biological Psychology 75 (2007) 165–175 171
But the results of the analyses of variance also demonstrated
that furrows were associated with mean differences between
clusters that had the same crypt structure. For example, subjects
in clusters 1 and 2, both of which contained individuals with
dense crypt structures, scored differently on the neuroticism
domain as well as the facet scale Impulsiveness in this domain.
The individuals in cluster 1 who had few furrows, scored
significantly lower than individuals in cluster 2 who had many
furrows. Likewise, subjects in clusters 3 and 4, which both
contained individuals with open crypt structures, scored
differently on the Conscientiousness domain as well as the
facet scales achievement-striving and self-discipline in this
domain. The individuals in cluster 3 who had many furrows,
scored significantly lower than individuals in cluster 4 who had
few furrows. Furrows were thereby associated with mean
differences between clusters that had the same crypt structure,
and the direction of these associations was consistent with the
significant association found between furrows and neuroticism,
impulsiveness and self-discipline in the variable-oriented
analyses.
Especially noteworthy was that mean differences emerged
on behaviors that were not significantly associated with crypts
in the variable-oriented analysis. Mean differences between
clusters 1 and 3 were observed for values in the openness to
experience domain, as well as the conscientiousness domain
and the facet scales achievement-striving and self-discipline in
this domain. These traits were not significantly associated with
crypts in the variable-oriented analysis.
The effect sizes for all associations that were significant in
the variable- and person-oriented analyses are presented in
Table 5. Overall, the effect sizes in the person-oriented analysis
were about twice as large as in the variable-oriented analysis.
Table 3
The configurations of iris characteristic that typically exists in early adults
Iris characteristic and scale description Cluster 1
(N = 143)1
Cluster 2
(N = 155)2
Cluster 3
(N = 73)3
Cluster 4
(N = 57)4
Crypt frequency
(1) Only parallel and/or densely packed curly fibres Yes Yes – –
(2) Spots of wavy fibres and 1–3 two shallow crypts Yes Yes – –
(3) Four shallow crypts or more – – Yes Yes
Contraction furrows
(1) Extending less than 1/4 circle Yes – – Yes
(2) Extending between 1/4 and 8/10 of a circle Yes – Yes –
(3) More distinct, extending 8/10 of one circle or more – Yes Yes –
1 Meancrypts = 1.61/meanfurrows = 1.65.2 Meancrypts = 1.52/meanfurrows = 3.00.3 Meancrypts = 3.00/meanfurrows = 2.34.4 Meancrypts = 3.00/meanfurrows = 1.00.
Table 4
Means of the personality measures with standard deviations within parentheses in each of the four clusters, with test for mean differences between the clusters (one-
way ANOVA, post hoc = Tukey HSD)
Personality measure Cluster 1
(N = 143)
Cluster 2
(N = 155)
Cluster 3
(N = 73)
Cluster 4
(N = 57)
d.f. F
Neuroticism �.15 (.89) .16 (1.01)1 .01 (1.08) �.11 (1.08) 3; 423 2.63*
Impulsiveness �.14 (.95) .19 (.96)1 �.04 (1.14) �.18 (1.11) 3; 423 3.52*
Extraversion – – – – – –
Warmth .13 (.97)3 .03 (.95) �.26 (1.13) �.13 (.99) 3; 423 2.90*
Positive emotions .13 (.92)3 .05 (1.02) �.26 (1.09) �.11 (.97) 3; 423 2.86*
Openness to experience .17 (.99)3 �.00 (.98) �.30 (1.07) �.06 (.88) 3; 423 3.82**
Aesthetics .21 (.96)3 �.01 (.97) �.35 (1.09) �.06 (.90) 3; 423 5.42**
Feelings .22 (.94)3 .01 (1.01)3 �.38 (1.00) �.15 (.96) 3; 423 6.49**
Values .12 (.97)3 .00 (.99) �.34 (1.10) .07 (.87) 3; 423 3.67**
Agreeableness .18 (.97)3 �.04 (1.01) �.18 (1.09) �.14 (.88) 3; 423 2.92*
Trust .20 (.93)3 �.03 (.98) �.22 (1.17) �.09 (.90) 3; 423 3.48**
Tendermindedness .20 (.93)3 �.07 (1.02) �.20 (1.08) �.12 (.91) 3; 423 3.57**
Conscientiousness .11 (.94)3 �.02 (.94) �.31 (1.04) .17 (1.14)3 3; 423 3.53*
Achievement striving .04 (.93)3 .04 (.97)3 �.33 (.99) .16 (1.15)3 3; 423 3.39*
Self-discipline .20 (.95)3 �.08 (.98) �.39 (1.00) .19 (1.02)3 3; 423 6.84**
The table show Z-transformed values. Elevated numbers indicates between which clusters a significant mean difference was observed (post hoc = Tukey HSD).* p < .05.
** p < .01.
M. Larsson et al. / Biological Psychology 75 (2007) 165–175170
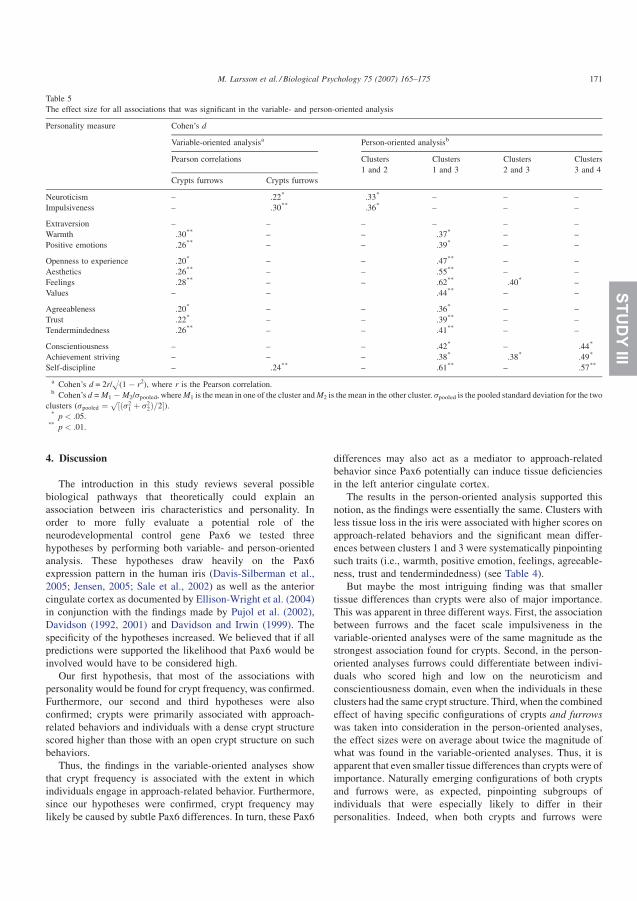
ST
UD
Y III

finding as well as the fact that the principal distribution and
depth of crypts are present at birth (Oyster, 1999).
Furthermore, our conscientiousness and Impulsiveness
findings are also consistent with previously published results.
The anterior cingulate function at large is to integrate
attentional and affective information that is critical for self-
regulation and adaptability, and it plays a crucial role in
initiation, motivation and goal-directed behaviors (Devinsky
et al., 1995; Thayer and Lane, 2000). The ventral region (BA
24a–c, 25, 32, 33) is primarily involved in assessing the salience
of emotions, hurtful rejections and romantic love, for example,
as well as the regulation of emotional responses involved in
social interactions which assess one’s own and other people’s
emotions and states of minds (Bartels and Zeki, 2000;
Eisenberger and Lieberman, 2004; Simmons et al., 2006).
The dorsal region (BA 24b0–c0, 320) is primarily involved in
response selection and the processing of cognitively demanding
information. For example, the cognitions that are activated in
reward-related conflicts and the evaluation of different
outcomes are processed in the dorsal anterior cingulate (Bush
et al., 2000). Furthermore, damage to the anterior cingulate is
associated with a host of social affective impairments including
blunted affect, impulsivity, disinhibition and poor social
judgments (Devinsky et al., 1995; Heyman et al., 1999).
Thus, since processes of planning, organizing and carrying
out tasks as well as resisting impulses are so central for anterior
cingulate functioning at large, as well as for the conscientious-
ness domain, it is not surprising – given the expression pattern
of Pax6 in the iris and brain – that individuals with different
configurations of crypts and furrows scored differently on this
domain.
These findings in conjunction with our findings indicate that
there are sizeable bodies of research that support the notion that
tissue loss in the iris potentially could be associated with tissue
loss in the brain. However, there are also other biological
pathways that may contribute to the associations found. As
mentioned in Section 1, tissue differences in the iris may be
associated with both brain structures and neurotransmitters that
influence personality. The fact that even small differences in the
monoamine systems during the embryological development of
the brain has the strongest influence on the neural development of
the anterior cingulate cortex, effects that persist into adulthood,
further underscores this possibility (Levitt et al., 1997).
Thus, to elucidate these genetic developmental complexities
additional studies are needed. However, given that the genetic
complexities that underlie the appearances of crypts and
furrows probably are difficult to dissect (Aota et al., 2003;
Davis-Silberman et al., 2005). It may be fruitful to investigate
to what extent crypts and furrows can be useful biomarkers in
their own right. The following highlights three areas were it
may be especially rewarding to further investigate the
usefulness of the iris as a biomarker.
4.1. MRI-studies
MRI-studies can identify the extent crypts and furrows are
associated with structural differences in the anterior cingulate
cortex. Thus, crypts and furrows could potentially be
biomarkers for developmental brain differences in large
samples, where it would be too expensive and time consuming
to collect MRI data of the brain. In contrast to MRI data, it takes
about 3 min per person to take digital photos, which readily can
be rated automatically by an iris scanner if the algorithm
currently used for personal identification (Daugman, 2003)
were to be modified to fit this purpose (Dougman, personal
communication, July, 2, 1999). Such efforts would make it
possible to study many neurodevelopmental questions that
today are impractical to study in large samples. For example, do
genes that influence the dopamine, serotonin and noradrenalin
systems and their assumed behavioral associations to specific
personality traits (Comings et al., 2000) change, when the
structure of the brain shifts?
4.2. Longitudinal studies
Iris data may be able to map out how impulsive and
approach-related behaviors of genetic origin, in interaction
with environmental factors, influence dyadic relationships
between family members. For example, it would be interesting
to find out if scores on child disclosure, parental solicitation,
parental control, parental support and parents’ bad reactions to
disclosure, differ from what is normal, in parental–child dyads
where there is a low concordance between the child and the
parent iris configurations. The fact that the expression pattern
for Pax6 in the brain overlaps with the cortical foundation for
maternal behaviors (mainly BA 24/32 and 47) and hurtful
rejections (BA 24/32), in conjunction with our results with
regard to approach-related and impulsive behaviors, suggests
that the iris can be useful marker for biological mechanisms that
influence the interaction between such child and parent based
behaviors (Eisenberger and Lieberman, 2004; Kerr and Stattin,
2003; Lorberbaum et al., 2002; Neiderhiser et al., 2004).
4.3. Twin-studies
The monozygotic (MZ) intra-pair twin correlation for
crypts, pigment dots and furrows are .66, .58 and .79,
respectively (Larsson and Pedersen, 2004). Thus, given that
it actually is quite common, at least in some MZ pairs, to
observe intra-pair differences that are relatively large,
especially with regard to crypts and pigment dots, and smaller
iris differences than this were associated with personality
differences in our sample, it is quite possible that small MZ
intra-pair iris differences could be associated with non-
systematic non-shared environmental effects for personality,
that is, random embryological events that make MZ twins less
similar. In any event, since there is a quest for more theory and
research in this area (Plomin et al., 2001; Plomin and Daniels,
1987; Turkheimer and Waldron, 2000). It is worth mentioning
that by collecting iris data from MZ twins it may be possible to
learn more about how non-systematic non-shared environ-
mental effects, influence personality as well as other behaviors.
In conclusion, our hypothesis was largely confirmed. Crypt
frequency is likely, via Pax6, to be associated with tissue
M. Larsson et al. / Biological Psychology 75 (2007) 165–175 173
taken into consideration in the person-oriented analyses, mean
differences in all main domains of personality emerged.
Overall, these findings support the notion that people with
different iris configurations tend to develop along different
trajectories in regards to personality. Furthermore, the self-
organizational properties of the developmental system that are
reflected in the iris appear to be quite efficient in pinpointing the
individuals who differ in their personalities. The effect sizes
between the clusters in the person-oriented analyses ranged
from d = .33 to .62, which is much larger than, for example,
women’s tendency to be more emotional than men, d = .05 to
.30 (Brebner, 2003).
When considering which approach-related behaviors were
most salient in the variable-oriented analyses, it was apparent
that a group of five approach-related traits (i.e., feelings,
tendermindedness, warmth, trust and positive emotions) was
driving the significant associations in the main domains. Both
the significant associations with the facet scales in the openness
to experience and agreeableness domain suggest that.
People with dense structures were more receptive to their
inner feelings and tended to sympathize and feel concern for
other people’s needs more than people with open crypt
structures. Furthermore, the most robust results for crypt
frequency suggest that people with dense structures form
warmer and more trustful attachments to others and experience
and express positive emotions, such as joy, happiness, and
excitement more often than those with open crypt structures.
Crypt frequency was thereby predominately associated with
facet scales that tap the emotional space in the extraversion,
openness to experience, and agreeableness domains. Thus,
tissue loss in the two top cell layers in the iris, as assessed by our
crypt measure, is in this general sense most strongly associated
with the emotional component of personality.
However, contraction furrows, which measure the thickness
and density differences in all five-cell layers in the iris, also
appear to be associated with emotional functioning. Furrows
were primarily associated with impulsiveness, and people with
many contraction furrows were less able than people with few
contraction furrows to control their cravings and urges. Thus,
the variable-oriented analyses revealed that the behavioral
correlates of the two iris characteristics differ. Crypt frequency
is most strongly related to the emotional space in the
extraversion, agreeable and openness to experience domains,
whereas the effect of contraction furrows is more specific and
relates directly to impulse control.
It is, therefore, interesting to note that when the principles of
self-organization were applied in the person-oriented analysis
(Bergman and Magnusson, 1997), the configurations of iris
characteristics that naturally emerge pinpointed clusters of
individuals that scored significantly different on the con-
scientiousness domain—a domain that was unrelated to the iris
characteristics in the variable-oriented analysis. At first sight
this may not be surprising since the inability to resist impulses,
or poor self-control, generally also influences the active process
of planning, organizing and carrying out tasks, which are basic
tendencies in the conscientiousness domain (Costa and
McCrea, 1992). However, the fact that the relationship with
the conscientiousness domain was only possible to identify
when both crypts and furrows were taken in consideration,
suggests two things that previously have not been recognized.
First, small differences in the extent to which people engage in
approach-related behaviors – as assessed by crypt frequency –
matters for how poor impulse control influences the con-
scientiousness domain. Second, crypt frequency identifies for
whom poor impulse control most likely also results in a
tendency to score low on the conscientiousness domain. Thus,
given that it has been difficult to replicate associations between
single genes and personality traits influenced by impulsive
behavior (Persson et al., 2000; Reif and Lesch, 2003), and that
single genes generally explain less than 1.5% of the variance for
a personality trait (Comings et al., 2000), our crypt frequency
scale may be helpful to use in future association studies. If not
considered, crypt frequency may mask potential associations
between candidate genes that potentially could influence the
conscientiousness domain, and potentially many other beha-
vioral traits that in part are dependent on the individual’s ability
to exercise self-control (Schmeichel and Baumeister, 2004).
However, if the crypt frequency scale is considered, or even
better, if the genes that determine crypt frequency can be
identified, this may help to find genes that add up in their effect,
which eventually can account for a greater proportion of the
genetic variance that influences personality as well as other
behaviors (Comings et al., 2000; Schmeichel and Baumeister,
2004). Thus, future association studies may be more fruitful,
and their result more applicable on the individual level, if iris
data is considered. The fact that people with different iris
configurations tend to develop along different trajectories, and
that the self-organizational properties of the developmental
system that are reflected in the iris are quite efficient in
pinpointing the individuals who differ more in their person-
alities, also supports this notion.
The behavioral findings in this study suggest that because
Pax6 induces tissue deficiencies in both the iris (Davis-
Silberman et al., 2005) and the left anterior cingulate cortex
(Ellison-Wright et al., 2004), it may influence the extent to
which people engage in approach-related behaviors (Pujol
et al., 2002). Indeed, there is a substantial body of research that
supports this notion. For example, positive emotions experi-
enced by monkeys increased the left-sided activation of their
brains (Kosslyn et al., 2002). People with positive dispositions
show greater relative left frontal EEG asymmetry at baseline
and respond more strongly to positive than to negative stimuli
(Sutton and Davidson, 1997; Wheeler et al., 1993). Ten-month-
old infants who did not cry when they were separated from their
mothers exhibited more left-brain activation (Fox and
Davidson, 1987). The thresholds for experiencing positive
emotions is lower for people who display left-sided activation
patterns (Fox and Carlkins, 1993). In addition, these left-sided
patterns are stable in both early childhood (Fox et al., 1992) and
adulthood (Davidson, 2003). Thus, the association between
frontal brain asymmetries and approach-related behaviors
exhibits enough stability and consistency to be considered an
underlying biological disposition for personality (Buss and
Larsen, 2005). Overall, these findings correspond well with our
M. Larsson et al. / Biological Psychology 75 (2007) 165–175172
ST
UD
Y III
Jang, K.L., McCrae, R.R., Angleitner, A., Riemann, R., Livesley, W.J., 1998.
Heritability of facet-level traits in a cross-cultural twin sample: support for a
hierarchical model of personality. Journal of Personality and Social Psy-
chology 74, 1556–1565.
Jaworski, C., Sperbeck, S., Graham, C., Wistow, G., 1997. Alternative splicing
of Pax6 in bovine eye and evolutionary conservation of intron sequences.
Biochemical and Biophysical Research Communications 240, 196–202.
Jensen, A.M., 2005. Potential roles for BMP and Pax genes in the development
of iris smooth muscle. Developmental Dynamics 232, 385–392.
Johnson, D.L., Wiebe, J.S., Gold, S.M., Andreasen, N.C., Hichwa, R.D.,
Watkins, G.L., Boles Ponto, L.L., 1999. Cerebral blood flow and person-
ality: a positron emission tomography study. American Journal of Psychia-
try 156, 252–257.
Kagan, J., Reznick, J.S., Snidman, N., 1988. Biological bases of childhood
shyness. Science 240, 167–171.
Kerr, M., Stattin, H., 2003. Parenting of adolescents: action or reaction? In:
Crouter, A.C., Booth, A. (Eds.), Children’s Influence on Family Dynamics:
The Neglected Side of Family Relationships. Lawrence Erlbaum Associ-
ates, Mahwah, NJ, pp. 121–151.
Kohwi, M., Osumi, N., Rubenstein, J.L., Alvarez-Buylla, A., 2005. Pax6
is required for making specific subpopulations of granule and periglo-
merular neurons in the olfactory bulb. Journal of Neuroscience 25,
6997–7003.
Kosslyn, S.M., Cacioppo, J.T., Davidson, R.J., Hugdahl, K., Lovallo, W.R.,
Spiegel, D., Rose, R., 2002. Bridging psychology and biology: the analysis
of individuals in groups. American Psychologist 57, 341–351.
Kupfermann, I., 1991. Hypothalamus, limbis system and cerebral cortex:
homeostasis and arousal. In: Kandel, E.R., Schwartz, J.H., Jessell, T.M.
(Eds.), Principles of Neural Science. Appleton & Lange, East Norwalk, CT,
pp. 732–760.
Lander, E.S., Schork, N.J., 1994. Genetic dissection of complex traits. Science
265, 2037–2048.
Larsson, M., Pedersen, N.L., 2004. Genetic correlations among texture char-
acteristics in the human iris. Molecular Vision 10, 821–831.
Larsson, M., Pedersen, N.L., Stattin, H., 2003. Importance of genetic effects for
characteristics of the human iris. Twin Research 6, 192–200.
Lester, D., 1987. Eye color, ectomorphy and autonomic nervous system
balance. Personality and individual differences 8, 767–768.
Levitt, P., Harvey, J.A., Friedman, E., Simansky, K., Murphy, E.H., 1997. New
evidence for neurotransmitter influences on brain development. Trends in
Neuroscience 20, 269–274.
Lorberbaum, J.P., Newman, J.D., Horwitz, A.R., Dubno, J.R., Lydiard, R.B.,
Hamner, M.B., Bohning, D.E., George, M.S., 2002. A potential role for
thalamocingulate circuitry in human maternal behavior. Biological Psy-
chiatry 51, 431–445.
Magnusson, D., Stattin, H., 1998. Person-context interaction theories. In:
Lerner, R.M., Damon, W. (Eds.), Handbook of Child Psychology: vol. 1.
Theoretical Models of Human Development. John Wiley & Sons Inc., New
York, pp. 685–759.
Markle, A., 1976. Eye color and responsiveness to arousing stimuli. Perceptual
and Motor Skills 43, 127–133.
Mukuno, K., Witmer, R., 1977. Innervation of melanocytes in human iris. An
electron microscopic study. Albrecht Von Graefes Archiv fur Klinische und
Experimentelle Ophthalmologie 203, 1–8.
Neiderhiser, J.M., Reiss, D., Pedersen, N.L., Lichtenstein, P., Spotts, E.L.,
Hansson, K., Cederblad, M., Ellhammer, O., 2004. Genetic and environ-
mental influences on mothering of adolescents: a comparison of two
samples. Developmental Psychology 40, 335–351.
Oyster, C.W., 1999. The Human Eye Structure and Function. Sunderland, MA.
Sinauer Associates, Boston.
Pawelek, J.M., Korner, A.M., 1982. The biosynthesis of mammalian melanin.
American Science 70, 136–145.
Peck, R., Williams, L.A., 2002. SPSS Manual/Roger Peck. Addison Wesley
Publishing Company, New York.
Persson, M.L., Wasserman, D., Geijer, T., Frisch, A., Rockah, R., Michaelovsky,
E., Apter, A., Weizman, A., Joensson, E.G., Bergman, H., 2000. Dopamine
D4 receptor gene polymorphism and personality traits in healthy volunteers.
European Archives of Psychiatry and Clinical Neuroscience 250, 203–206.
Plomin, R., Asbury, K., Dunn, J., 2001. Why are children in the same family so
different? Nonshared environment a decade later. Canadian Journal of
Psychiatry 46, 225–233.
Plomin, R., Daniels, D., 1987. Why are children in the same family so different
from one another? Behavioral and Brain Sciences 10, 1–16.
Posner, M.I., Rothbart, M.K., 1998. Attention, self-regulation and conscious-
ness. Philosophical Transactions of the Royal Society of London Series B:
Biological Sciences 353, 1915–1927.
Post, R.M., Weiss, S.R., 1997. Emergent properties of neural systems: how focal
molecular neurobiological alterations can affect behavior. Development and
Psychopathology 9, 907–929.
Pressman, C.L., Chen, H., Johnson, R.L., 2000. LMX1B, a LIM homeodomain
class transcription factor, is necessary for normal development of multiple
tissues in the anterior segment of the murine eye. Genesis 26, 15–25.
Pujol, J., Lopez, A., Deus, J., Cardoner, N., Vallejo, J., Capdevila, A., Paus, T.,
2002. Anatomical variability of the anterior cingulate gyrus and basic
dimensions of human personality. Neuroimage 15, 847–855.
Reif, A., Lesch, K.P., 2003. Toward a molecular architecture of personality.
Behavioural Brain Research 139, 1–20.
Reznick, J.S., 1989. Perspectives on Behavioral Inhibition. University of
Chicago Press, Chicago.
Rim, Y., 1983. Eye-colour, ethnic origin or family size? Personality and
individual differences 4, 101–102.
Rosenberg, A.A., Kagan, J., 1989. Physical and physiological correlates of
behavioral inhibition. Developmental Psychobiology 22, 753–770.
Rubin, K.H., Both, L., 1989. Iris pigmentation and sociability in childhood: a re-
examination. Developmental Psychobiology 22, 717–725.
Sale, M.M., Craig, J.E., Charlesworth, J.C., FitzGerald, L.M., Hanson, I.M.,
Dickinson, J.L., Matthews, S.J., Heyningen Vv, V., Fingert, J.H., Mackey,
D.A., 2002. Broad phenotypic variability in a single pedigree with a novel
1410delC mutation in the PST domain of the PAX6 gene. Human Mutation
20, 322–327.
Schmeichel, B.J., Baumeister, R.F., 2004. Self-regulatory strength. In: Vohs,
K.D., Baumeister, R.F. (Eds.), Handbook of Self Regulation: Research,
Theory, and Applications. Guilford Press, New York, pp. 84–98.
Simmons, A., Stein, M.B., Matthews, S.C., Feinstein, J.S., Paulus, M.P., 2006.
Affective ambiguity for a group recruits ventromedial prefrontal cortex.
Neuroimage 29, 655–661.
Simpson, T.I., Price, D.J., 2002. Pax6; a pleiotropic player in development.
BioEssays 24, 1041–1051.
Sutton, S.K., Davidson, R.J., 1997. Prefrontal brain asymmetry: a biological
substrate of the behavioral approach and inhibition systems. Psychological
Science 8, 204–210.
Thayer, J.F., Lane, R.D., 2000. A model of neurovisceral integration in emotion
regulation and dysregulation. Journal of Affective Disorders 61, 201–216.
Turkheimer, E., Waldron, M., 2000. Nonshared environment: a theoretical,
methodological, and quantitative review. Psychological Bulletin 126,
78–108.
von Eye, A., Bergman, L.R., 2003. Research strategies in developmental
psychopathology: dimensional identity and the person-oriented approach.
Development and Psychopathology 15, 553–580.
Wallis, D., Muenke, M., 2000. Mutations in holoprosencephaly. Human Muta-
tion 16, 99–108.
Wheeler, R.E., Davidson, R.J., Tomarken, A.J., 1993. Frontal brain asymmetry
and emotional reactivity: a biological substrate of affective style. Psycho-
physiology 30, 82–89.
M. Larsson et al. / Biological Psychology 75 (2007) 165–175 175
deficiencies in the left anterior cingulate cortex, which in turn
influences how much individuals engage in approach-related
behaviors. Furthermore, the self-organizing property of the
developmental system that is reflected in the iris appears to be
quite efficient in pinpointing individuals who differ in their
personalities. When both crypts and furrows were taken into
consideration in the person-oriented analyses, mean differences
in all main domains of personality emerged. Furthermore, the
effect sizes in the person-oriented analyses were about twice as
large as in the variable-oriented analyses. Overall, these
findings support the notion that people with different iris
configurations tend to develop along different trajectories in
regards to their personalities. Thus, it may be fruitful to
investigate further the usefulness of the iris as a biomarker
within a holistic interactionistic framework, using both
variable- and person-oriented approaches. Future genetic
association studies as well as MIR-, longitudinal- and twin-
studies may benefit from collecting iris data and testing
candidate genes for crypts and contraction furrows.
Acknowledgements
This study was supported by funds from the Department of
Social Sciences at Orebro University in Sweden and The
Swedish Foundation for International Cooperation in Research
and Higher Education. We are grateful to the participants for
their cooperation.
References
Aota, S., Nakajima, N., Sakamoto, R., Watanabe, S., Ibaraki, N., Okazaki, K.,
2003. Pax6 autoregulation mediated by direct interaction of Pax6 protein
with the head surface ectoderm-specific enhancer of the mouse Pax6 gene.
Developmental Biology 257, 1–13.
Bartels, A., Zeki, S., 2000. The neural basis of romantic love. Neuroreport 11,
3829–3834.
Bergman, L.R., Magnusson, D., 1997. A person-oriented approach in research
on developmental psychopathology. Development and Psychopathology 9,
291–319.
Bergman, L.R., Magnusson, D., El Khouri, B.M., 2003. Studying Individual
Development in an Interindividual Context: A Person-Oriented Approach.
Lawrence Erlbaum Associates, Mahwah, NJ.
Bito, L.Z., Matheny, A., Cruickshanks, K.J., Nondahl, D.M., Carino, O.B.,
1997. Eye color changes past early childhood. The Louisville Twin Study.
Archives of Ophthalmolmology 115, 659–663.
Bosma, H.A., Kunnen, E., 2002. Identity and Emotion: Development Through
Self-Organization. Cambridge University Press, New York.
Brebner, J., 2003. Gender and emotions. Personality and individual differences
34, 387–394.
Burbach, J.P., Smits, S., Smidt, M.P., 2003. Transcription factors in the
development of midbrain dopamine neurons. Annals of The New York
Academy of Sciences 991, 61–68.
Bush, G., Luu, P., Posner, M.I., 2000. Cognitive and emotional influences in
anterior cingulate cortex. Trends in Cognitive Sciences 4, 215–222.
Buss, D.M., Larsen, R.J., 2005. Personality Psychology: Domains of Knowl-
edge About Human Nature. McGraw-Hill, New York.
Carver, C.S., Scheier, M.F., 2002. Control processes and self-organization as
complementary principles underlying behavior. Journal of Social Psychol-
ogy Review 6, 304–315.
Cattell, R.B., 1965. The Scientific Analysis of Personality. Aldine, Chicago.
Cohen, J., 1988. Statistical Power Analysis for the Behavioral Sciences, vol. 2.
Lawrence Earlbaum Associates, Hillsdale, NJ.
Comings, D.E., Gade-Andavolu, R., Gonzalez, N., Wu, S., Muhleman, D.,
Blake, H., Mann, M.B., Dietz, G., Saucier, G., MacMurray, J.P., 2000. A
multivariate analysis of 59 candidate genes in personality traits: the
temperament and character inventory. Clinical Genetics 58, 375–385.
Coplan, R.J., Coleman, B., Rubin, K.H., 1998. Shyness and little boy blue: iris
pigmentation, gender, and social wariness in preschoolers. Developmental
Psychobiology 32, 37–44.
Costa, P.T., McCrae, R.R., 1985. Revised NEO Personality Inventory (NEO PI-
R) and NEO Five-Factor Inventory (NEO-FFI) Professional manual. Psy-
chological Assessment Resources, Odessa, FL. Psykologiforlaget AB,
Svensk version: NEO PI-RTM, Stockholm, Sweden, 2003.
Costa, P.T., McCrea, R.R., 1992. Neo Personality Inventory Revised. Psychologi-
cal Assessment Resources, Inc., 16204 North Florida Avenue, Lutz, Florida.
Daugman, J., 2003. The importance of being random: statistical principles of
iris recognition. Pattern Recognition 36, 279–291.
Davidson, R.J., 1992. Anterior cerebral asymmetry and the nature of emotion.
Brain and Cognition 20, 125–151.
Davidson, R.J., 2001. Toward a biology of personality and emotion. In: Damasio,
A.R. (Ed.), Unity of Knowledge: The Convergence of Natural and Human
Science. New York Academy of Sciences, New York, pp. 191–207.
Davidson, R.J., 2003. Affective neuroscience and psychophysiology: toward a
synthesis. Psychophysiology 40, 655–665.
Davidson, R.J., Irwin, W., 1999. The functional neuroanatomy of emotion and
affective style. Trends in Cognitive Sciences 3, 11–21.
Davis-Silberman, N., Kalich, T., Oron-Karni, V., Marquardt, T., Zillig, M.,
Tamm, E.R., Ashery-Padan, R., 2005. Genetic dissection of Pax6 dosage
requirements in the developing mouse eye. Human Molecular Genetics 14,
2265–2276.
Devinsky, O., Morrell, M.J., Vogt, B.A., 1995. Contributions of anterior
cingulate cortex to behaviour. Brain 118 (Pt 1), 279–306.
Ding, Y.Q., Marklund, U., Yuan, W., Yin, J., Wegman, L., Ericson, J., Deneris,
E., Johnson, R.L., Chen, Z.F., 2003. Lmx1b is essential for the development
of serotonergic neurons. Nature Neuroscience 6, 933–938.
Eisenberger, N.I., Lieberman, M.D., 2004. Why rejection hurts: a common
neural alarm system for physical and social pain. Trends in Cognitive
Sciences 8, 294–300.
Ellison-Wright, Z., Heyman, I., Frampton, I., Rubia, K., Chitnis, X., Ellison-
Wright, I., Williams, S.C., Suckling, J., Simmons, A., Bullmore, E., 2004.
Heterozygous PAX6 mutation, adult brain structure and fronto-striato-
thalamic function in a human family. European Journal of Neuroscience
19, 1505–1512.
Fox, J., Gelb, A.W., Enns, J., Murkin, J.M., Farrar, J.K., Manninen, P.H., 1992.
The responsiveness of cerebral blood flow to changes in arterial carbon
dioxide is maintained during propofol-nitrous oxide anesthesia in humans.
Anesthesiology 77, 453–456.
Fox, N.A., Carlkins, S.D., 1993. Multiple-measure approaches to the study of
infant emotion. In: Lewis, M., Haviland, J.M. (Eds.), Handbook of Emo-
tions. Guilford, New York, pp. 167–185.
Fox, N.A., Davidson, R.J., 1987. Electroencephalogram asymmetry in response
to the approach of a stranger and maternal separation in 10-month-old
infants. Developmental Psychology 23, 233–240.
Gary, A.L., Glover, J., 1976. Eye-Coulor, Sex and Children’s Behavior. Nelson-
Hall, Chicago.
Gentry, T.A., Polzine, K.M., Wakefield, J.A., 1985. Human genetic markers
associated with variation in intellectual abilities and personality. Personality
and individual differences 6, 111–113.
Heyman, I., Frampton, I., van Heyningen, V., Hanson, I., Teague, P., Taylor, A.,
Simonoff, E., 1999. Psychiatric disorder and cognitive function in a family
with an inherited novel mutation of the developmental control gene PAX6.
Psychiatric Genetics 9, 85–90.
Hsieh, Y.W., Zhang, X.M., Lin, E., Oliver, G., Yang, X.J., 2002. The homeobox
gene Six3 is a potential regulator of anterior segment formation in the chick
eye. Developmental Biology 248, 265–280.
Hu, D.N., 2000. Regulation of growth and melanogenesis of uveal melanocytes.
Pigment Cell Research 13, 81–86.
Hu, D.N., Woodward, D.F., McCormick, S.A., 2000. Influence of autonomic
neurotransmitters on human uveal melanocytes in vitro. Experimental Eye
Research 71, 217–224.
M. Larsson et al. / Biological Psychology 75 (2007) 165–175174
ST
UD
Y III


Doctorial Dissertation
Human Iris Characteristics asBiomarkers for Personality
Mats Larsson
Psychology
Publications in series Örebro Studies in Psychology
1. Andershed, Henrik, Antisocial Behavior in Adolescence – The Role of Individual Characteristics. 2002.
2. Trost, Kari, A new look at parenting during adolescence: Reciprocal interactions in everyday life. 2002.
3. Jensen, Eva, (Mis)understanding and Learning of Feedback Relations in a Simple Dynamic System. 2004.
4. Wester Herber, Misse, Talking to me? – Risk Communication to a diverse Public. 2004.
5. Boersma, Katja, Fear and avoidance in the development of a persistent musculo-skeletal pain problem. Implications for secondary prevention. 2005.
6. Jansson, Markus, Insomnia: Psychological Mechanisms and Early Intervention. A Cognitive- Behavioral Perspective. 2005.
7. Lindblom, Karin, Utbrändhet i normalbefolkningen. Arbets- och individfaktorers relation i utvecklingen mot eller återhämtning från utbrändhet. 2006. (Vetenskaplig uppsats)
8. Almqvist, Lena, Children’s Health and Developmental Delay: Positive Functioning in Every-day Life. 2006.
9. Johansson, Peter, Understanding psychopathy through the study of long-term violent offenders. 2006.
10. Persson, Andreas, Leisure in Adolescence: Youth’s activity choices and why they are linked to problems for some and not others. 2006.
11. Ojala, Maria, Hope and worry: Exploring young people’s values, emotions, and behavior regarding global environmental problems. 2007.
12. Larsson, Mats, Human Iris Characteristics as Biomarkers for Personality. 2007.
Hum
an Iris Characteristics as B
iomarkers for Personality
ISSN 1651-1382ISBN 978-91-7668-562-4
Örebro Studies in Psychology 12
ÖREBRO 2007

Publications in series Örebro Studies in Psychology
1. Andershed, Henrik, Antisocial Behavior in Adolescence – The Role of Individual Characteristics. 2002.
2. Trost, Kari, A new look at parenting during adolescence: Reciprocal interactions in everyday life. 2002.
3. Jensen, Eva, (Mis)understanding and Learning of Feedback Relations in a Simple Dynamic System. 2004.
4. Wester Herber, Misse, Talking to me? – Risk Communication to a diverse Public. 2004.
5. Boersma, Katja, Fear and avoidance in the development of a persistent musculo-skeletal pain problem. Implications for secondary prevention. 2005.
6. Jansson, Markus, Insomnia: Psychological Mechanisms and Early Intervention. A Cognitive- Behavioral Perspective. 2005.
7. Lindblom, Karin, Utbrändhet i normalbefolkningen. Arbets- och individfaktorers relation i utvecklingen mot eller återhämtning från utbrändhet. 2006. (Vetenskaplig uppsats)
8. Almqvist, Lena, Children’s Health and Developmental Delay: Positive Functioning in Every-day Life. 2006.
9. Johansson, Peter, Understanding psychopathy through the study of long-term violent offenders. 2006.
10. Persson, Andreas, Leisure in Adolescence: Youth’s activity choices and why they are linked to problems for some and not others. 2006.
11. Ojala, Maria, Hope and worry: Exploring young people’s values, emotions, and behavior regarding global environmental problems. 2007.
12. Larsson, Mats, Human Iris Characteristics as Biomarkers for Personality. 2007.
Cover Art Nature Genetics July 2007 39 No 7s made by Erin Boyle http://www.callme-eb.com
MA
TS L
AR
SSON
Hum
an Iris Characteristics as B
iomarkers for Personality
ISSN 1651-1382ISBN 978-91-7668-562-4
MATS LARSSON works as a researcher and lecturer at the Center for Developmental Research and the Department of Behavioral, Social and Legal Sciences at Örebro University, Sweden. His re-search interests lie within the fi eld of Behavioral Genetics, with an emphasis on genes that infl uence personality and the extent to which such
genes also infl uence other behaviors. His dissertation investigates whether it is possible to increase power to detect genes that infl uence personality by using iris characteristics and a person-oriented approach. The following questions are addressed:
- What is the extent to which genes contribute to tissue differences in the human iris?
- Are the genetic effects that infl uence the appearance of different iris characteristics independent of each other?
- Is it possible to take advantage of the self-organized mechanisms that govern the development of the nervous system by using iris data and a person-oriented app-roach?
- Does the power to detect genetic effects for personality increase when iris data and a person-oriented approach are used?
- Are the confi gurations of iris characteristics that typically occur in a population systematically related to how the tissue grows in the frontal lobe?
- Why has it been so hard to replicate candidate gene fi ndings for personality over the last 10 years?
- Will it be easier to replicate candidate gene fi ndings for personality if iris data are used?
- Can iris data and DNA collected from twins be used to pinpoint the personality traits that are most strongly inherited for an individual?