larsen & toubro investor presentation q3 / 9m...
TRANSCRIPT

Larsen & Toubro
Investor Presentation – Q3 / 9M FY17February 7, 2017

Disclaimer
This presentation contains certain forward looking statements concerning L&T’s future
business prospects and business profitability, which are subject to a number of risks
and uncertainties and the actual results could materially differ from those in such
forward looking statements.
The risks and uncertainties relating to these statements include, but are not limited to,
risks and uncertainties regarding fluctuations in earnings, our ability to manage growth,
competition (both domestic and international), economic growth in India and the
target countries for exports, ability to attract and retain highly skilled professionals,
time and cost over runs on contracts, our ability to manage our international
operations, government policies and actions with respect to investments, fiscal
deficits, regulations, etc., interest and other fiscal costs generally prevailing in the
economy. Past performance may not be indicative of future performance.
The company does not undertake to make any announcement in case any of these
forward looking statements become materially incorrect in future or update any
forward looking statements made from time to time by or on behalf of the company.2
L&T Overview
Presentation Outline
3
Business Overview
Group Performance
Sectoral opportunities

L&T Overview
Presentation Outline
4
Business Overview
Group Performance
Sectoral opportunities

L&T - At a Glance
Professionally Managed Company
FY 16 Group Revenues: `1020 Bn
(approx.
US$ 16 Bn)
Market Cap (30th Jan’17):
₹1347 Bn
(approx.
US$ 20 Bn)
Credit Ratings CRISIL:
AAA/Stable ICRA:
AAA(Stable)
5
India’s largest E&C company with interests in Projects, Infrastructure
Development, Manufacturing, IT & Financial Services

6
L&T - At a Glance

Major Institutional Shareholders % Shares
Life Insurance Corporation of India 16.5%
Administrator of the SUUTI 6.6%
HDFC Mutual Fund 3.1%
General Insurance Corp. of India 1.9%
ICICI Prudential Mutual Fund 1.9%
ICICI Prudential Life Insurance 1.8%
Government of Singapore 1.5%
Reliance Mutual Fund 1.4%
7
Govt. Financial
Institutions & Insurance Companies,
27%
FII’s & GDR, 18%
Individuals,23%
L&T Employee Welfare
Foundation,12%
Mutual Funds & Pvt.
Insurance Cos., 16%
Others,4%
31st Dec
2016
L&T – Shareholding Pattern
Listed with BSE & NSE
GDRs listed with LSE and LuxSE
L&T is one of the most widely held listed companies in India
No promoter holding
Uninterrupted Dividend payment record since 1946; FY16 Dividend of Rs. 18.25 per share (FY15: Rs. 16.25 per share)

8
A M Naik
Group Executive Chairman
BE [Mech]
Joined L&T in March 1965
Diverse and vast experience in general management, Technology and E&C
S. N. Subrahmanyan
Deputy Managing Director & President
B.SC ENGG (CIVIL), MBA (Finance)
Joined L&T in November 1984
R Shankar Raman
Whole-time Director &Chief Financial Officer
B.Com, ACA, CWA
Joined L&T Group in November 1994
Shailendra Roy
Whole-time Director & Sr. Executive Vice President (Power, Heavy Engg. & Defence)
BTech
Joined L&T in 2004
D. K. Sen
Whole-time Director & Sr. Executive Vice President (Infrastructure)
B.SC ENGG (CIVIL), MBA (Finance)
Joined L&T in 1989
M. V. Satish
Whole-time Director & Sr. Executive Vice President
(Building, Minerals & Metals)
BE (Civil)
Joined L&T in 1980
Vast experience in Design & Build (D&B) Contracts, PPP Projects, Engineering and Construction Industry
Vast experience in Finance, Taxation, Insurance, Risk Management, Legal and Investor Relations
Vast experience in Thermal Power,
Heavy Engineering, Defence &
Aerospace Business
Vast experience in Design &
Engineering, Business Development,
Tendering and construction
Vast experience in Construction,
Business Development, Contracts
Management and Property
Development in India and GCC region
Subramanian Sarma
Non-Executive Director
B.Tech (Chem.),
M.Tech – IIT, Mumbai
Joined L&T Group in 2015
Vast experience in managing large business portfolios in energy sector
Experienced Management Team

9
Four-tier Governance Structure
L&T’s essential character revolves around values based on transparency, integrity, professionalism and accountability
Board
of Directors
Executive Management Committee (EMC)
Independent Company (IC) Board
Strategic Business Group (SBG) / Business Unit (BU)
Corporate Governance

Sustainability Programme
Sustainability Report 2016 is ‘GRI Checked’ externally assured & ‘In Accordance-Comprehensive’ highest level of disclosures in public domain
Sustainability Thrust Areas
Among the Top 11 Engineering &Construction Companies in the world by DJSI(Dow Jones Sustainability Index)
L&T ranked among Asia’s Top 5 ‘Most Sustainable Companies’
L&T is leader in Carbon Performance Leadership
Index (CDLI) 2016 -Industrial segment
Released
Sustainability Roadmap 2021

Green Portfolio
Green Buildings
L&T’s own 17 green buildings at campuses.
Constructed for Clients – 49.2 million sq. ft.
Under certification- 8.8 Million Sq. ft
Green Product Portfolio reached over 25.9 % of sales in 2016
Over 76 million units of energy conserved cumulatively
Over 60,900 Tons of CO2 emissions avoided
CSR Highlights
Theme: Building India’s social infrastructure reached over 1.3 million beneficiaries
Working in three states on
Integrated Community Development Program
Linkage with Sustainable Development Goals (SDGs)
Sustainability – Environment & Social

L&T Overview
Presentation Outline
12
Business Overview
Group Performance
Sectoral opportunities

13
Wankhede Stadium, Mumbai
Baha’i Temple, Delhi
Vizag Steel Plant 88m Rail Bridge Jammu UdhampurTurbine Rotor, Gujarat
Oil & Gas EquipmentMumbai International Airport Vivekanand Bridge, Kolkata
ITC Grand Chola Hotel, Chennai Sri Sathya sai Whitefield Hospital Srinagar Hydro Electric Plant
2x384 MW CCPP, Vemagiri, A.P. Cyber Towers, Hyderabad Water Treatment Plant, BarmerVacuum Column, Paradip Refinery
Kakrapar Nuclear Power Plant, Guj
Builders to the Nation

14
NMC Speciality hospital, Abu Dhabi
Bhukara Hotel, Uzbeckistan
Stadium at Barbados Twin Towers, Dubai MarinaSalalah Airport, Oman
Fabrication Facility, Oman
Sheikh Khalifa Interchange, UAE Coal Gasifier for China Transmission Lines, Fujirah, Dhaid
Petronas Refinery, Malaysia Bi-metallic Urea Stripper for Saudi MV Switchgear Factory, MalaysiaWater Treatment Plant, Doha
Punatsangchhu HEP, Bhutan
World’s Longest Conveyer, Bangladesh Bulk Cement Terminal, Colombo
International Footprint – Marquee Jobs

15Single point responsibility for turnkey solutions
Design
&
Engineering
Manufacture
&
Fabrication
EPC Projects
Construction
One of Asia’s largest vertically integrated E&C Companies
E&C Delivery Platform

16
MIALIndian Coastguard
Quality Customer Mix

17
Alliances
Pre qualifications
Note: Some of these are project specific alliances & pre qualifications
Joint Ventures
Befula Investments
Multiple Alliances & Joint Ventures

LARSEN & TOUBRO LTD.
BUSINESS VERTICALSSUBSIDIARIES, JVs &
ASSOCIATES
BUILDINGS & FACTORIES
TRANSPORTATION INFRASTRUCTURE
POWER
POWER T&D
SHIPBUILDING
ELECTRICAL & AUTOMATION
HEAVY ENGINEERING
FINANCIAL SERVICES
IT & TECHNOLOGY SERVICES
INFRASTRUCTURE SPVs (BOTs)
REALTY DEVELOPMENT
HEAVY CIVIL INFRASTRUCTURE
WATER & EFFLUENT TREATMENT
MHPS JVs (BOILERS & TURBINE MFG.)
OTHER MANUFACTURING & FABRICATION SUBSIDIARIES
18
L&T HYDROCARBON ENGINEERING
SERVICES AND OTHER SUBSIDIARIES & ASSOCIATES
L&T’s Business Structure

L&T Overview
Presentation Outline
19
Sectoral opportunities
Business Overview
Group Performance

FY 12 FY 13 FY 14 FY 15 FY 16
88.8
99.3
107.3 112.6
123.4
EBITDA
20
`B
illi
on
FY 12 FY 13 FY 14 FY 15 FY 16
643 745
851 920
1,026
Net Sales
`B
illi
on
`B
illi
on
FY 12 FY 13 FY 14 FY 15 FY 16
1,450 1,648 1,815
2,326 2500
Order Book
`B
illi
on
FY 12 FY 13 FY 14 FY 15 FY 16
793
1,029
1,272
1,554 1,369
Order Inflow
`B
illi
on
`B
illi
on
Five Year Performance
All numbers are under I-GAAP

21
Q3 9M
10%
6%1%
39%
19%
Performance Highlights
14%
59%
3%Order Inflows
Revenues
EBITDA
Profit After Tax

Order Inflow decline due to muted domestic capex and delay in awards
10% growth in International orders led by B&F, Heavy Civil and Hydrocarbon Businesses
Order Book at more than 2x TTM Revenues
Group level Order Inflow & Order Book
22
Amount in ` Bn
9M FY16 9M FY17
633 632
296 325
Domestic International
(32%) (34%)
(68%) (66%)
929 957
9M FY16 9M FY17
260 297
282 311
387 349
Q1 Q2 Q3
929 9573%
Order Inflows Order Book
9M FY16 9M FY17
1,856 1,833
694 753
Domestic International
2550 25861%
(27%) (29%)
(73%) (71%)

Revenue growth in International market neutralized by domestic execution environment
Hydrocarbon and Infrastructure business aid revenue growth
Operational efficiencies in Hydrocarbon, MMH and Heavy Engg. Businesses led to favourable MCO
expenses
Moderate increase in staff cost on productivity improvements
SGA includes higher provisioning by Financial Services Business 23
Group Performance – Sales & Costs
Q3 FY16 Q3 FY17 % Change ` Billion 9M FY16 9M FY17 % Change FY16
259.28 262.87 1% Revenue from Operations 691.00 731.83 6% 1,019.75
88.21 95.90 9% International Revenue 227.20 261.42 15% 323.37
34% 36% % of Revenue 33% 36% 32%
175.81 172.83 -2% Mfg, Cons. & Opex (MCO) 453.67 474.23 5% 674.21
12.12 13.32 10%Finance Cost of Fin. Services
and Fin. Lease Activities 36.26 40.22 11% 49.67
34.17 34.97 2% Staff Costs 99.02 103.53 5% 133.25
15.92 16.52 4% Sales & Admin. Expense (SGA) 43.24 46.73 8% 58.77
238.02 237.64 0% Total Opex 632.18 664.71 5% 915.90

Margin improvement driven by Infrastructure, Heavy Engg. and Hydrocarbon businesses
Decline in Interest cost on efficient fund management
Depreciation includes asset value restatement of a Retail Mall upon monetization
Increase in Other Income due to higher Treasury earnings24
Group Performance Summary - Profitability
Q3 FY16 Q3 FY17 % Change ` Billion 9M FY16 9M FY17 % Change FY16
21.26 25.23 19% EBITDA 58.81 67.12 14% 103.85
8.2% 9.6% 1.4% EBITDA Margin 8.5% 9.2% 0.7% 10.2%
(4.04) (3.79) -6% Interest Expenses (12.16) (10.43) -14% (16.55)
(3.68) (7.22) 96% Depreciation (13.62) (16.47) 21% (17.87)
2.41 2.57 7% Other Income 8.46 10.29 22% 9.82
(5.12) (4.40) -14% Provision for Taxes (14.75) (16.69) 13% (24.16)
(2.94) (1.48)Share in profit / (loss) of
JVs / Associates (6.57) (4.79) (9.90)
(0.9) (1.18) Non-controlling Interest (1.65) (2.88) (3.20)
7.00 9.72 39% PAT (Before Exceptionals) 18.52 26.14 41% 42.00
- - Exceptional (Net of Tax) 0.46 4.02 0.79
7.00 9.72 39% Reported PAT 18.98 30.17 59% 42.79

Group Balance Sheet
25
` Billion Dec-16 Mar-16 Incr / (Decr)
Equity & Reserve 471.02 444.55 26.48
Non Controlling Interest 32.55 27.11 5.44
Borrowings - Financial Services 585.32 545.86 39.46
Development Projects 152.99 142.03 10.96
Others 186.19 193.43 (7.24)
Other Non-Current Liabilities 24.30 8.44 15.86
Sources of Funds 1,452.37 1,361.41 90.96
Fixed Assets
(Tangible / Intangible / Goodwill)183.63 188.06 (4.43)
Development Projects Fixed Assets 145.19 123.22 21.97
Finance lease receivable 96.11 98.16 (2.05)
Loans towards Financing Activities 599.82 557.03 42.78
Other Non-Current Assets
(Incl. S&A / JV Investment)81.98 87.31 (5.34)
Current Investments 119.61 74.91 44.69
Working Capital 226.03 232.71 (6.67)
Application of Funds 1,452.37 1,361.41 90.96

26
Group Cash Flow
* included under Net Cash from operations under statutory financial statements
Q3 FY16 9M FY16 ` Billion Q3 FY17 9M FY17
24.79 65.83 Operating Profit 26.12 69.62
(6.28) (5.24) Changes in Working Capital 10.22 9.59
(8.75) (22.49) Direct Taxes paid (9.51) (22.84)
9.75 38.10 Net Cash from Operations (A) 26.83 56.37
(7.27) (33.75) Investments in Fixed Assets (Net) (8.64) (27.33)
22.06 (0.29) Net Purchase of Long Term & Curr. Inv. (27.90) (48.38)
(0.55) (2.14) Loans/Deposits made with Associate Cos. (0.52) (3.10)
0.03 0.40 Interest & Dividend Received & Others 1.47 3.42
- 0.74 Divestment Proceeds (Incl. Advances) 14.30 19.56
14.27 (35.05) Net Cash from/(used in) Invest. Act. (B) (21.29) (55.84)
3.88 9.90 Issue of Share Capital / Minority (0.02) 20.57
29.47 104.23 Net Borrowings 16.24 43.75
(43.93) (80.60) Disbursements towards financing activities* (17.59) (31.11)
(6.72) (37.32) Interest & Dividend paid (3.88) (32.93)
(17.29) (3.79) Net Cash from Financing Activities (C) (5.25) 0.28
6.73 (0.74) Net (Dec) / Inc in Cash & Bank (A+B+C) 0.28 0.81

27
Segment Performance Analysis
28
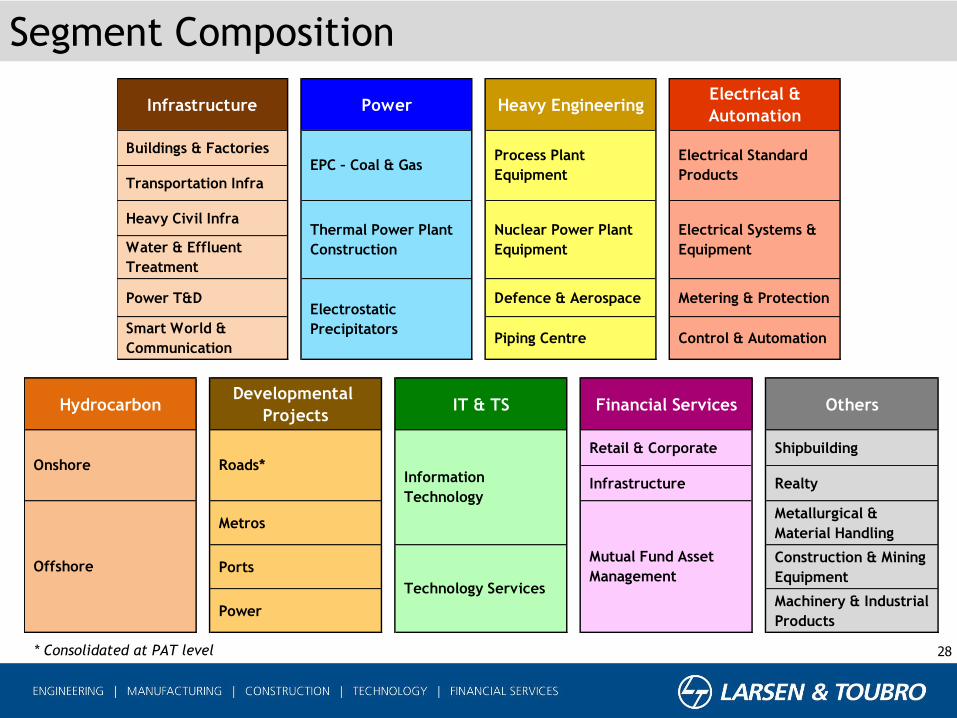
Infrastructure Power Heavy EngineeringElectrical &
Automation
Buildings & Factories
Transportation Infra
Heavy Civil Infra
Water & Effluent
Treatment
Power T&D Defence & Aerospace Metering & Protection
Smart World &
CommunicationPiping Centre Control & Automation
Electrical Standard
Products
Electrical Systems &
Equipment
Thermal Power Plant
Construction
EPC – Coal & Gas
Electrostatic
Precipitators
Process Plant
Equipment
Nuclear Power Plant
Equipment
Segment Composition
HydrocarbonDevelopmental
ProjectsIT & TS Financial Services Others
Retail & Corporate Shipbuilding
Infrastructure Realty
MetrosMetallurgical &
Material Handling
PortsConstruction & Mining
Equipment
PowerMachinery & Industrial
Products
Offshore
Information
Technology
Roads*
Technology Services
Mutual Fund Asset
Management
Onshore
* Consolidated at PAT level

Figures in brackets indicate corresponding period of the Previous Year
Infrastructure
75%(75%)
Power6%(8%)
HE3%(3%)
E&A1%
(1%)
Hydrocarbon 8%(5%)
Others7%(8%)
Order Book
₹ 2586 Bn
29
Segmental Breakup of Orders – 9M FY17
Infrastructure
55%(60%)
Power3%(3%)
HE2%(2%)
E&A5%(4%)
Hydrocarbon12%(6%) Services
17%(17%)
Others6%(8%)
Order Inflow
₹ 957 Bn
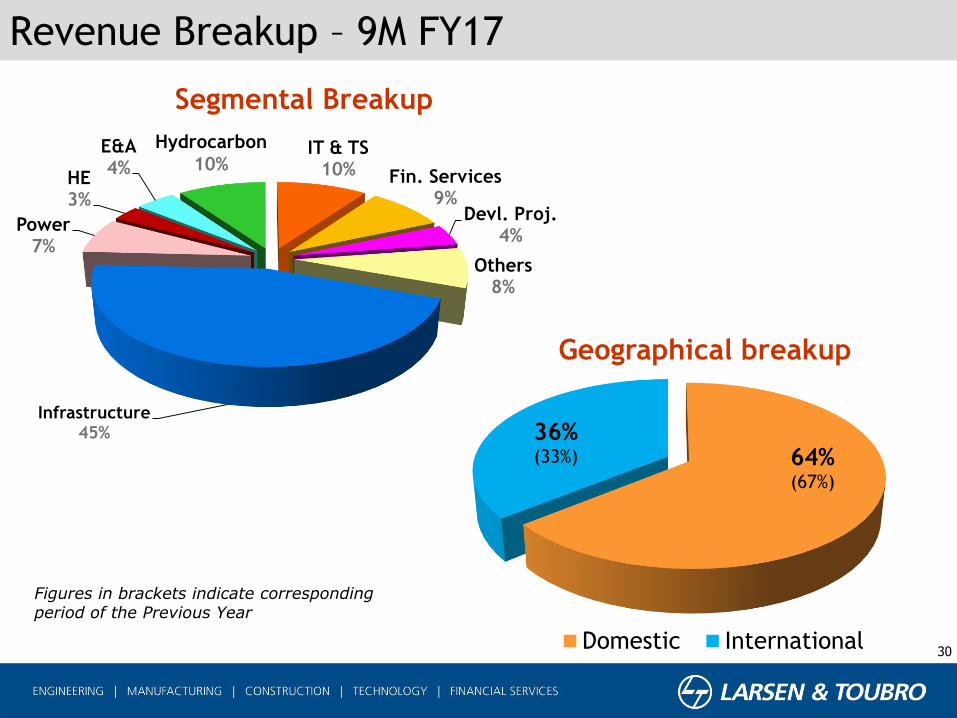
Infrastructure45%
Power7%
HE3%
E&A4%
IT & TS10% Fin. Services
9%Devl. Proj.
4%
Others8%
Segmental Breakup
64%(67%)
36%(33%)
Geographical breakup
Domestic International30
Hydrocarbon
10%
Revenue Breakup – 9M FY17
Figures in brackets indicate corresponding period of the Previous Year

Modest sales growth on execution headwinds and slower payment cycles
Heavy Civil and Power T&D registers better margin
Q3 Margin benefits from cost reduction & design optimization initiatives
31
Amount in ` Bn
Net Revenues & Margin
Infrastructure Segment

Revenue decline due to lower order-book and international revenue taper
Lower Margins in Q3 due to higher proportion of cost jobs
MHPS JVs consolidated at PAT level
32
Amount in ` BnNet Revenues & Margin
Power Segment

Revenue growth impacted by lower order book and stage of execution
Previous year margin impacted by cost and time overruns
CY margin improved both in PPN and D&A Business
33
Amount in ` Bn
Heavy Engineering Segment
Net Revenues & Margin

Lack of industrial demand continues to hamper growth
Electrical Standard Product (ESP) and Control & Automation Business registers growth
Margin improvement due to operational efficiencies
34
Amount in ` Bn
Electrical & Automation (E&A) Segment
Net Revenues & Margin

Revenue growth as conversion of orders pick-up
Margin improvement on execution progress, operational efficiency and close out of legacy jobs
35
Amount in ` Bn
Net Revenues & Margin
Hydrocarbon Segment

Revenue growth contributed by Insurance, Auto & Aero for IT business and Transportation & Medical
Devices for Tech Services Business
Margin decline on investment for scaling up of operations
Thrust on mining existing customers, analytics and automation
36
Amount in ` Bn
IT & Technology Services Segment
Net Revenues & Margin

Weak industrial demand and low capacity utilization indicative of the business environment
MMH business witnessed robust revenue growth on execution pick-up
Lower offtake in construction and mining equipment and Realty projects
Delayed defence ordering impacts Shipbuilding performance
37
Amount in ` Bn
Others Segment
Net Revenues & Margin
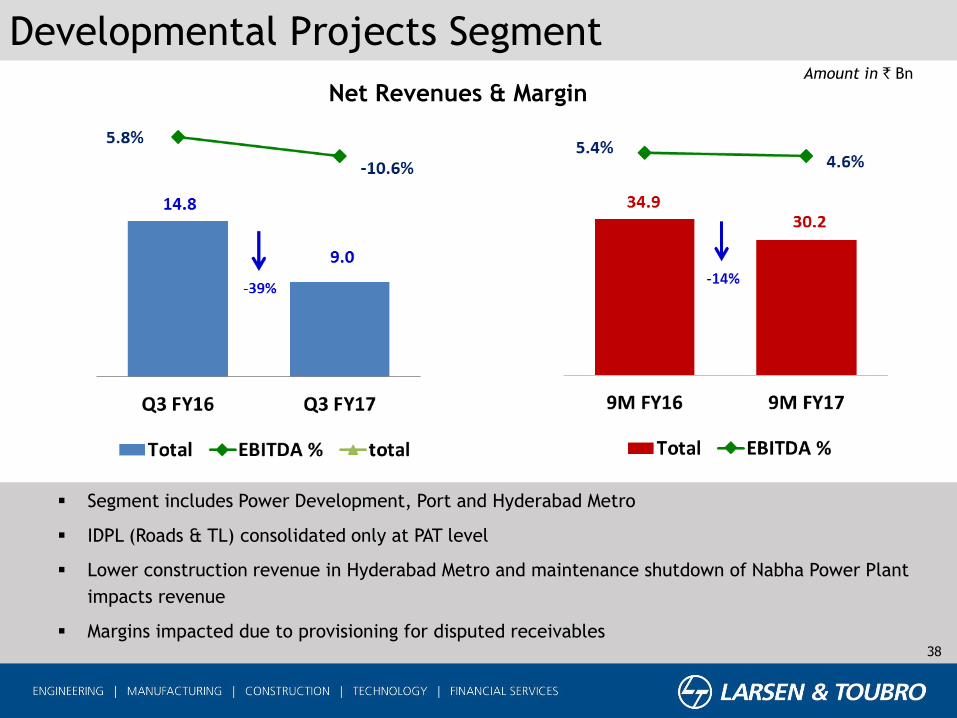
Segment includes Power Development, Port and Hyderabad Metro
IDPL (Roads & TL) consolidated only at PAT level
Lower construction revenue in Hyderabad Metro and maintenance shutdown of Nabha Power Plant
impacts revenue
Margins impacted due to provisioning for disputed receivables38
Amount in ` Bn
Developmental Projects Segment
Net Revenues & Margin

Third successive quarter of ROE improvement – ROE stands at 12.81% in Q3FY17 as against 9.29% in
Q3FY16 and 11.72% in Q2FY17
Cost to Income reduced from 30% to 25%
Focussed business growth of 15%
39
L&T Finance Holdings (I-GAAP)
` Billion Q3 FY16 Q3 FY17 % Change
Networth
(Incl. Pref.Cap and Warrants) 92.38 91.35 -1%
Consolidated Debt 488.30 550.68 13%
Loans and Advances 561.19 619.70 10%
Mutual Fund Average AUM 250.59 351.91 40%
Income from Operations 18.20 20.94 15%
Net NPA (%) - 120 DPD 3.89% 3.10% -0.79%
PAT 2.12 2.71 28%

L&T Overview
Presentation Outline
40
Business Overview
Group Performance
Sectoral opportunities

41
Opportunities:
High end residential projects by cash rich developers
Affordable housing projects
Government and Private sector office buildings
Healthcare capacity expansion in India & Middle East
Brownfield Airport terminal expansions
Thrust on Education facility expansion by Govt
New Manufacturing facilities under Make In India as
well as capacity expansions in light engg. and
Cement
Presence :
Residential & Commercial Buildings, IT & Office Space,
Hospitals, Shopping Malls, Educational Institutions,
Luxury Hotels, Airport Terminals, and Factory
Buildings
Infrastructure Segment – Urban Infra
42
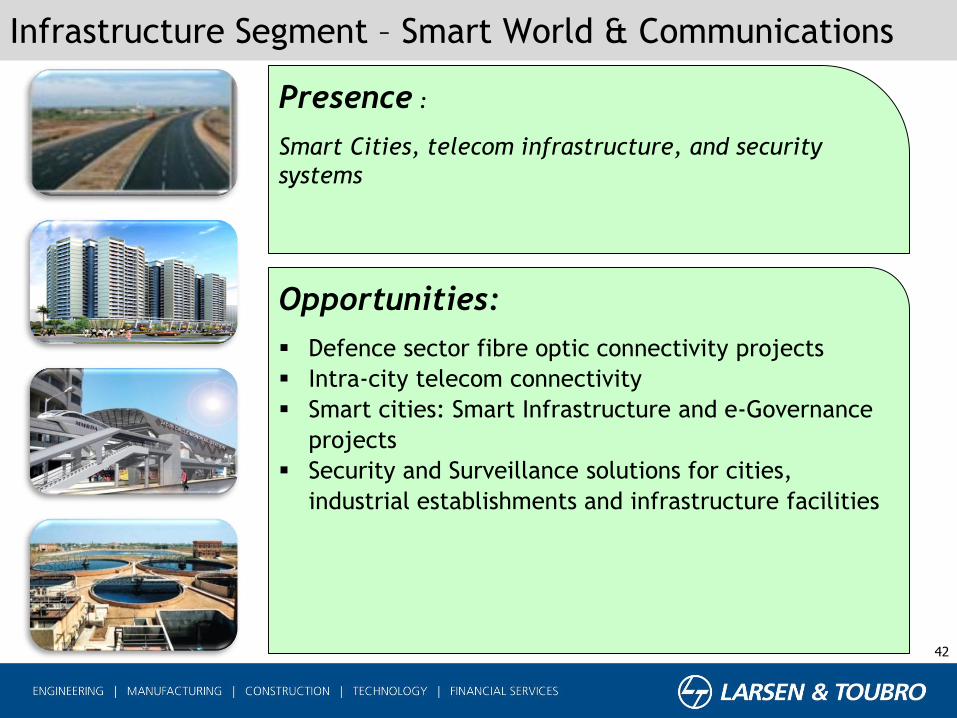
Opportunities:
Defence sector fibre optic connectivity projects
Intra-city telecom connectivity
Smart cities: Smart Infrastructure and e-Governance
projects
Security and Surveillance solutions for cities,
industrial establishments and infrastructure facilities
Presence :
Smart Cities, telecom infrastructure, and security
systems
Infrastructure Segment – Smart World & Communications

43
Opportunities:
Increased road build-out by NHAI with current focus on
EPC projects
Expressway projects by State Governments
Elevated corridors and Ring Roads in major cities
Dedicated Freight Corridor program
Track modernisation and expansion by Indian Railways
Brownfield Airport expansion
Highway projects in Middle East
Presence :
Roads, Elevated Corridors, Railway Construction &
Airport Runways
Infrastructure Segment – Transportation Infra

44
Opportunities:
Metro Rail projects planned in multiple cities across
India (to decongest urban traffic)
Thrust on connectivity to hilly states with Tunnels
and Border Roads
Major road and railway bridges and sea links
Increased spends on infrastructure facilities for
armed forces
Thrust being given by Govt on increasing nuclear
power installed base
Inland Water Transport Terminal
Presence :
Metro Railways, Monorails, Ports, Hydel Power Plant
construction, Nuclear (civil) plant construction,
Defence Infrastructure, Special Bridges and Tunnels
Infrastructure Segment – Heavy Civil Infra

45
Opportunities:
Thrust on water infra due to growing scarcity in India
Water treatment, management & distribution,
desalination
Lift irrigation programs
Waste water treatment plants from municipalities
Clean Ganga and other river water pollution
prevention projects
Effluent treatment plants in Industrial units/clusters
Thrust on Water recycling, conservation, Desalination
and availability improvement in Middle East
Presence :
Bulk transmission of water, water treatment, waste
water treatment, sewage rehabilitation, effluent
treatment
Infrastructure Segment – Water & Effluent Treatment

46
Opportunities:
Thrust on Grid Strengthening, Expansion and
Efficiency programs with growing generation
capacities and increasing loads
Transmission lines from State, Central and Private
Transmission utilities
Inter-regional and HVDC grid connectivity
Feeder Separation scheme (DDUGJY), IPDS, and other
Rural electrification programs
Dedicated Green Energy Transmission Corridors
Thrust on Solar Power capacity addition
T&D expansion in Middle East, Africa, South East Asia
Presence :
Sub-stations, Transmission Lines, Solar Power projects
Infrastructure Segment – Power T&D

47
Major Challenges in Infrastructure:
Investment constraints
Lending capacity of Banking system
Lack of private sector interest in PPP projects
Land acquisition
Government Funding
Environmental Clearances
Slow evolution of policy frameworks
Pace of awards and execution
Oil price-led fiscal deficits in Middle East
Infrastructure Segment – Challenges
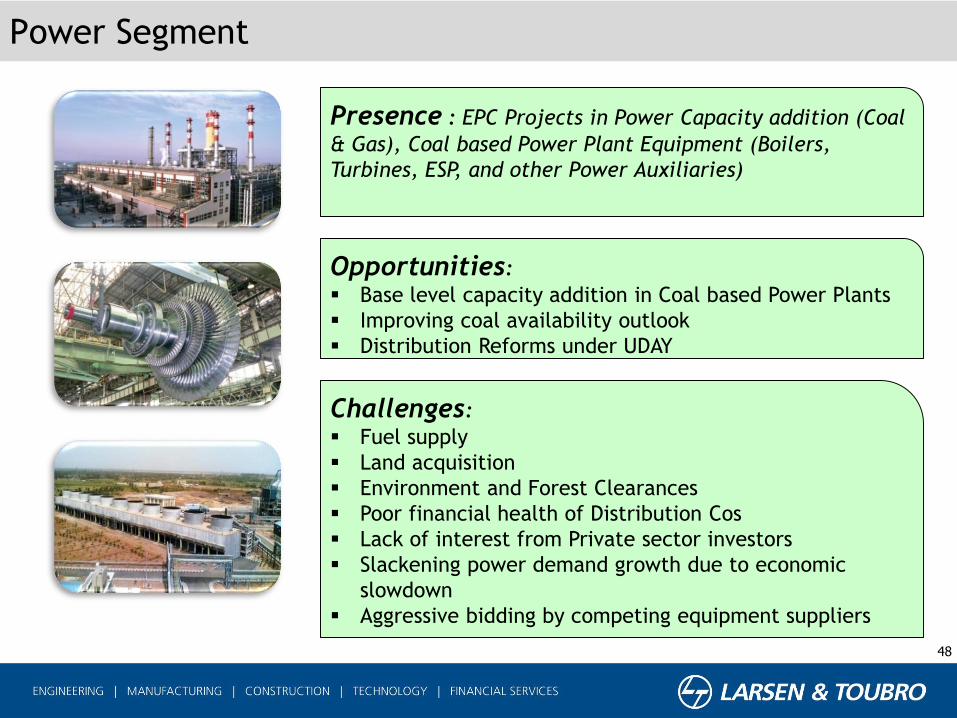
Power Segment
48
Presence : EPC Projects in Power Capacity addition (Coal
& Gas), Coal based Power Plant Equipment (Boilers,
Turbines, ESP, and other Power Auxiliaries)
Challenges:
Fuel supply
Land acquisition
Environment and Forest Clearances
Poor financial health of Distribution Cos
Lack of interest from Private sector investors
Slackening power demand growth due to economic
slowdown
Aggressive bidding by competing equipment suppliers
Opportunities:
Base level capacity addition in Coal based Power Plants
Improving coal availability outlook
Distribution Reforms under UDAY
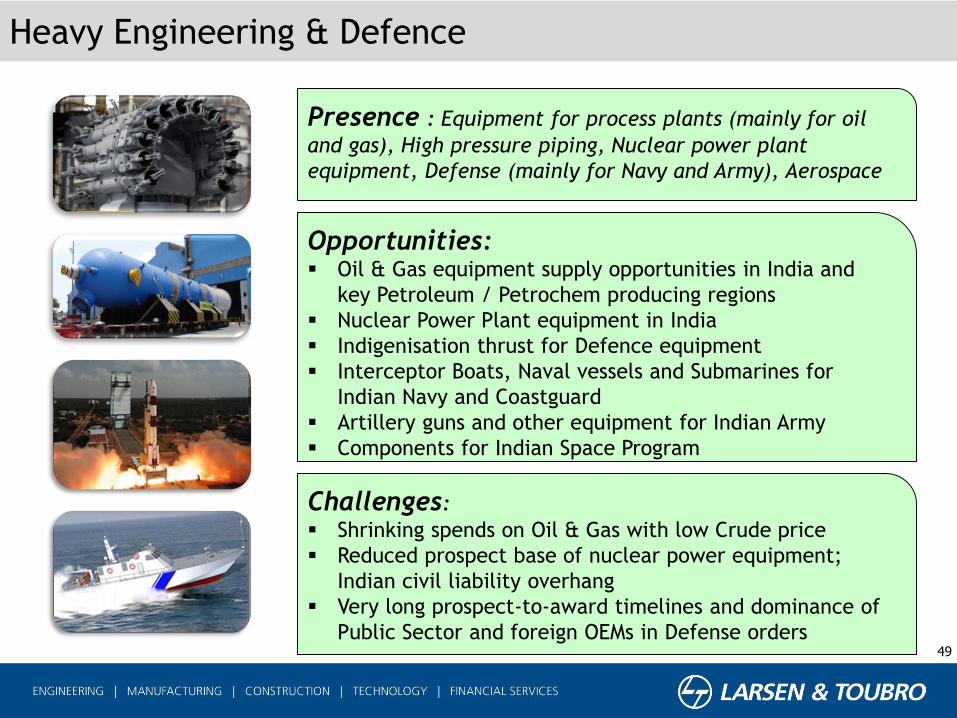
Heavy Engineering & Defence
49
Opportunities: Oil & Gas equipment supply opportunities in India and
key Petroleum / Petrochem producing regions
Nuclear Power Plant equipment in India
Indigenisation thrust for Defence equipment
Interceptor Boats, Naval vessels and Submarines for
Indian Navy and Coastguard
Artillery guns and other equipment for Indian Army
Components for Indian Space Program
Presence : Equipment for process plants (mainly for oil
and gas), High pressure piping, Nuclear power plant
equipment, Defense (mainly for Navy and Army), Aerospace
Challenges:
Shrinking spends on Oil & Gas with low Crude price
Reduced prospect base of nuclear power equipment;
Indian civil liability overhang
Very long prospect-to-award timelines and dominance of
Public Sector and foreign OEMs in Defense orders

Hydrocarbon Segment
50
Opportunities: Select International prospects – mainly Onshore
Opportunities from ONGC Capex – Offshore / Onshore
Opportunities for Fertilizer EPC
Clean Fuel projects, Refinery Expansion and upgrade
Pipeline projects
Presence : Offshore Platforms, Subsea pipelines,
Floating Systems, Subsea installations, Onshore Oil & Gas
installations, Refineries, Petrochemical and Fertiliser
Plants (EPC), Onshore pipelines, Regasification Terminals
Challenges:
Reduced Capex in Middle East in low Crude price
scenario
Long bid-to-award timelines
Aggressive competition in Domestic and GCC markets
Project execution in international markets

Thank You
51

52
Annexure-1: Group Profit & Loss Extract
* Includes Insurance Business
9M FY17 9M FY16 %
Change
Revenue from Operations 72.47 63.38 30.21 565.77 731.83 691.00 6%
EBITDA 15.28 6.93 1.10 43.81 67.12 58.81 14%
Interest Expenses (0.03) (0.01) (1.07) (9.32) (10.43) (12.16) -14%
Depreciation (1.86) (0.64) (0.43) (13.54) (16.47) (13.62) 21%
Other Income 0.28 2.10 0.28 7.63 10.29 8.46 22%
Provision for Taxes (3.20) (2.66) (0.39) (10.44) (16.69) (14.75) 13%
Share in profit/(loss) of JVs /
Associates- 0.03 (4.08) (0.73) (4.79) (6.57)
Adjustments for non -controlling
interest in Subs., etc.(0.98) (2.13) 0.73 (0.49) (2.88) (1.65)
Net PAT 9.48 3.62 (3.86) 20.93 30.17 18.98 59%
L&T Group
` Billion IT & TS Fin.
Services *
Devl.
Projects
L&T &
Others (Incl.
Eliminations)

53
Annexure-2: Share in Profit/(Loss) of JVs/Associates
` Billion 9M FY17 9M FY16
MHPS JVs 0.77 0.19
IDPL & Subs. (4.08) (5.30)
Others (1.48) (1.46)
Total (4.79) (6.57)

OCI represents movement in components of Equity (Net Worth) in Balance Sheet
Components:
• Re-measurement of defined benefit (retirement) plans – Volatile and dependent on G-Sec rate
movement due to actuarial valuation; no flow back to P&L
• MTM of Debt investments – Flow back to P&L on actual sale
• Changes in FCTR represents MTM on Consolidation of Balance Sheets of Businesses with Foreign
Functional Currency – Flow back to P&L only on sale of business
• MTM of Off-Balance Sheet Hedges – Flow back to P&L on entry of underlyings into Balance Sheet54
Annexure-3: Other Comprehensive Income (OCI)
₹ Billion 9M FY16 9M FY17
Changes arising out of re-measurement of defined
benefit plans for employees 0.13 (0.44)
MTM of investment in Debt instruments (0.33) 0.06
Changes in Foreign Currency Translation Reserve (0.32) (0.83)
MTM of Off-Balance Sheet Hedges (0.44) (0.77)
Total (0.96) (1.98)

Balance Equity Commitment (Dec 2016): ` 18 Bn
Total Project Cost (Dec 2016): ` 476 Bn
Equity Invested (Dec 2016): ` 97 Bn
55
Roads and Bridges:
Portfolio: 15 projects (1661 Km); 13 Operational
Project Cost: `161 Bn
Power (Excl. Projects under DPR):
Portfolio: 2 projects (1499 MW); 1 Operational
Project Cost: `112 Bn
Ports:
Portfolio: 2 projects (18 MTPA) - Operational
Project Cost: `20 Bn
Metros:
Portfolio: 1 project (71.16 Km) – Under-implementation
Project Cost (Fin. Closure): `170 Bn
Transmission Lines:
Portfolio: 1 project (482 Km)
Project Cost: `13.5 Bn
Annexure 4: Concessions Business Portfolio – 21 SPVs